Article

Effectiveness of Conservation Measures Based on Assessment of Grazing Intensity in the Yellow River Source Region

1
Key Laboratory of Land Surface Pattern and Simulation, Institute of Geographic Sciences and Natural Resources Research, Chinese Academy of Sciences, Beijing 100101, China
2
University of Chinese Academy of Sciences, Beijing 100049, China
3
State Key Laboratory of Tibetan Plateau Earth System, Resources and Environment, Beijing 100101, China
*
Author to whom correspondence should be addressed.
Land 2025, 14(4), 813; https://doi.org/10.3390/land14040813
Submission received: 26 February 2025 / Revised: 24 March 2025 / Accepted: 7 April 2025 / Published: 9 April 2025

Abstract

:
Functional zoning diversifies the management of grazing intensity within protected areas (PAs). However, the complexity makes it difficult to assess grazing intensity and thus understand the effectiveness of PAs in reducing grazing intensity. In this study, grazing intensity in Madoi County, the Yellow River source region, was evaluated based on mapping gridded livestock in areas where grazing was permitted under management measures in functional zones. The effectiveness of PAs in reducing grazing intensity was then assessed by comparing the changes in grazing intensity in PAs and non-PAs. Furthermore, the contributions of climate change and grazing activity to vegetation changes were quantified using temperature (°C), precipitation (mm), grazing intensity (sheep units/ha), and the normalized difference vegetation index (NDVI) (a proxy of vegetation cover) data. Subsequently, the effects of reducing grazing intensity on vegetation changes were analyzed by comparing the contribution of grazing activity to vegetation changes inside and outside of PAs. The results showed that the average grazing intensity in PAs decreased by 0.23 sheep units/ha, which was higher than the decrease in non-PAs (0.07 sheep units/ha) as expected. Specifically, the average grazing intensity in the core, buffer, and experimental zones decreased by 0.36, 0.22, and 0.14 sheep units/ha, respectively, any of which was a greater reduction than that in non-PAs. The contribution of grazing activity to the increase in vegetation cover in PAs was 12% higher than that outside of PAs, indicating that the positive effect of grazing activity on vegetation changes in PAs was greater than that outside of PAs. The findings suggest that the establishment of PAs in the Yellow River source region are effective in reducing grazing intensity and enhance the positive role of grazing activity in vegetation changes. Our research provides a reference for analyzing the effectiveness of functional zoning in areas with large-scale grazing livestock.

1. Introduction

Human activities are profoundly altering the Earth’s system and natural environment [1,2]. Excessive human disturbance can lead to biodiversity loss, ecosystem degradation, and a decline in ecosystem services [3,4]. In response, many governments have established protected areas (PAs) to mitigate the human impact on the natural environment. Since the 1970s, the global extent of PAs has quadrupled [5]. In addition, authorities have motivated local people to participate in programs for vegetation regeneration. For example, they issued orders to manage human activities, such as the grassland ecological compensation policy and the returning farmland to forest program [6,7]. Numerous studies have assessed the effectiveness of PAs in mitigating the intensity of human activities such as deforestation, cropland expansion, and urbanization, primarily through monitoring changes in land cover types using remote sensing data [8,9,10]. However, fewer studies have evaluated the effectiveness of PAs in reducing grazing intensity, possibly because grazing typically does not alter the land cover in ways that are easily detectable [11]. To strengthen evidence-based management and support sustainable development, it is crucial to assess the conservation effectiveness in reducing grazing intensity.
Quantifying grazing intensity in PAs is the key to evaluating the effectiveness of conservation measures aimed at mitigating grazing pressure, but it is also challenging. Some studies have used grid-scale livestock distribution maps to calculate livestock density (the number of livestock per unit area) as an indicator of grazing intensity [12,13]. However, mapping livestock distribution within PAs is complicated by regional differences in grazing management due to functional zoning. Functional zoning is used to balance ecological protection and human development within PAs by dividing the PA into different zones with tailored management measures for human activities [14,15]. For example, PAs are often divided into core, buffer, and experimental zones [16]. The core zone is under strict protection for ecosystems and rare and endangered species [17]. The buffer zone lies between the core zone and the experimental zone, aspiring to mitigate or block interference to the core zone. The experimental zone, located outside of the core zone or buffer zone, is for human activities and regulated development, where multiple activities related to biodiversity conservation and sustainable development are allowed [18]. Following functional zoning, grazing is prohibited in some areas of a PA while permitted in other areas. Therefore, when allocating livestock to gridded units, it is imperative to allocate livestock to grazing areas rather than to grazing-prohibited areas, in line with the provisions of the functional zoning. To address this challenge, Hu et al. [19] proposed a new method for assessing grazing intensity, which incorporates the identification of grazing-prohibited areas and grazing-permitted areas based on conservation measures. In addition, the number of livestock allocated within a grid is determined by the probability of the grid being grazed.
The ultimate goal of reducing grazing intensity through conservation efforts is to improve the role of grazing activity in vegetation changes [20]. For example, in the Three-River-Source region, many types of PAs have been established, such as the Three-River-Source Nature Reserve and the Three-River-Source National Park, since 2000, to reverse grassland degradation (i.e., vegetation fragmentation or loss of vegetation cover) driven primarily by overgrazing [20,21,22]. Vegetation changes, however, are affected not only by human activities but also by climate change. Many studies have attempted to separate the respective contributions of climate change and human activities to vegetation changes [23,24,25,26]. These studies generally used climate variables (such as temperature and precipitation) and vegetation indices (such as the normalized difference vegetation index, NDVI), but tended to overlook direct anthropogenic indicators. Then, the contribution of human activities was inferred indirectly through the residuals between the vegetation variation rates calculated from vegetation indices and inferred from climate variables [27]. To better understand the role of grazing activity in vegetation changes, it is essential to incorporate the direct indicators of human activities, such as grazing intensity.
The Yellow River source region, mainly located in Madoi County, is a key component of the Three-River-Source region on the Tibetan Plateau, alongside the Yangtze and Lancang River source regions [28]. In the Yellow River source region, grassland constitutes the dominant land use type, and grazing on grassland is the main means of livelihood for local people. Moderate grazing can promote the growth of grassland vegetation and maintain the stability of plant communities [29,30]. However, poorly managed grazing can lead to grassland degradation and increase the number of endangered species [31,32]. Research has shown that, in the past century, overgrazing, rather than climate change, was the primary driver of grassland degradation in the Yellow River source region [33]. Several conservation measures have been implemented, including the prohibition of grazing in degraded grasslands and the regulation of livestock numbers in areas where grazing is still permitted [34]. Despite these efforts, the effectiveness of conservation measures in reducing grazing intensity and the subsequent impact on vegetation dynamics remain insufficiently explored.
This study aims to (1) detect the spatiotemporal changes in grazing intensity in the Yellow River source region through a grazing intensity assessment; (2) evaluate the effectiveness of PAs and their functional zones in reducing grazing intensity; (3) quantify the contributions of climate change and grazing activity to vegetation changes using grazing intensity, temperature, precipitation, and NDVI data; (4) analyze the effects of reducing grazing intensity on vegetation changes.

2. Materials and Methods
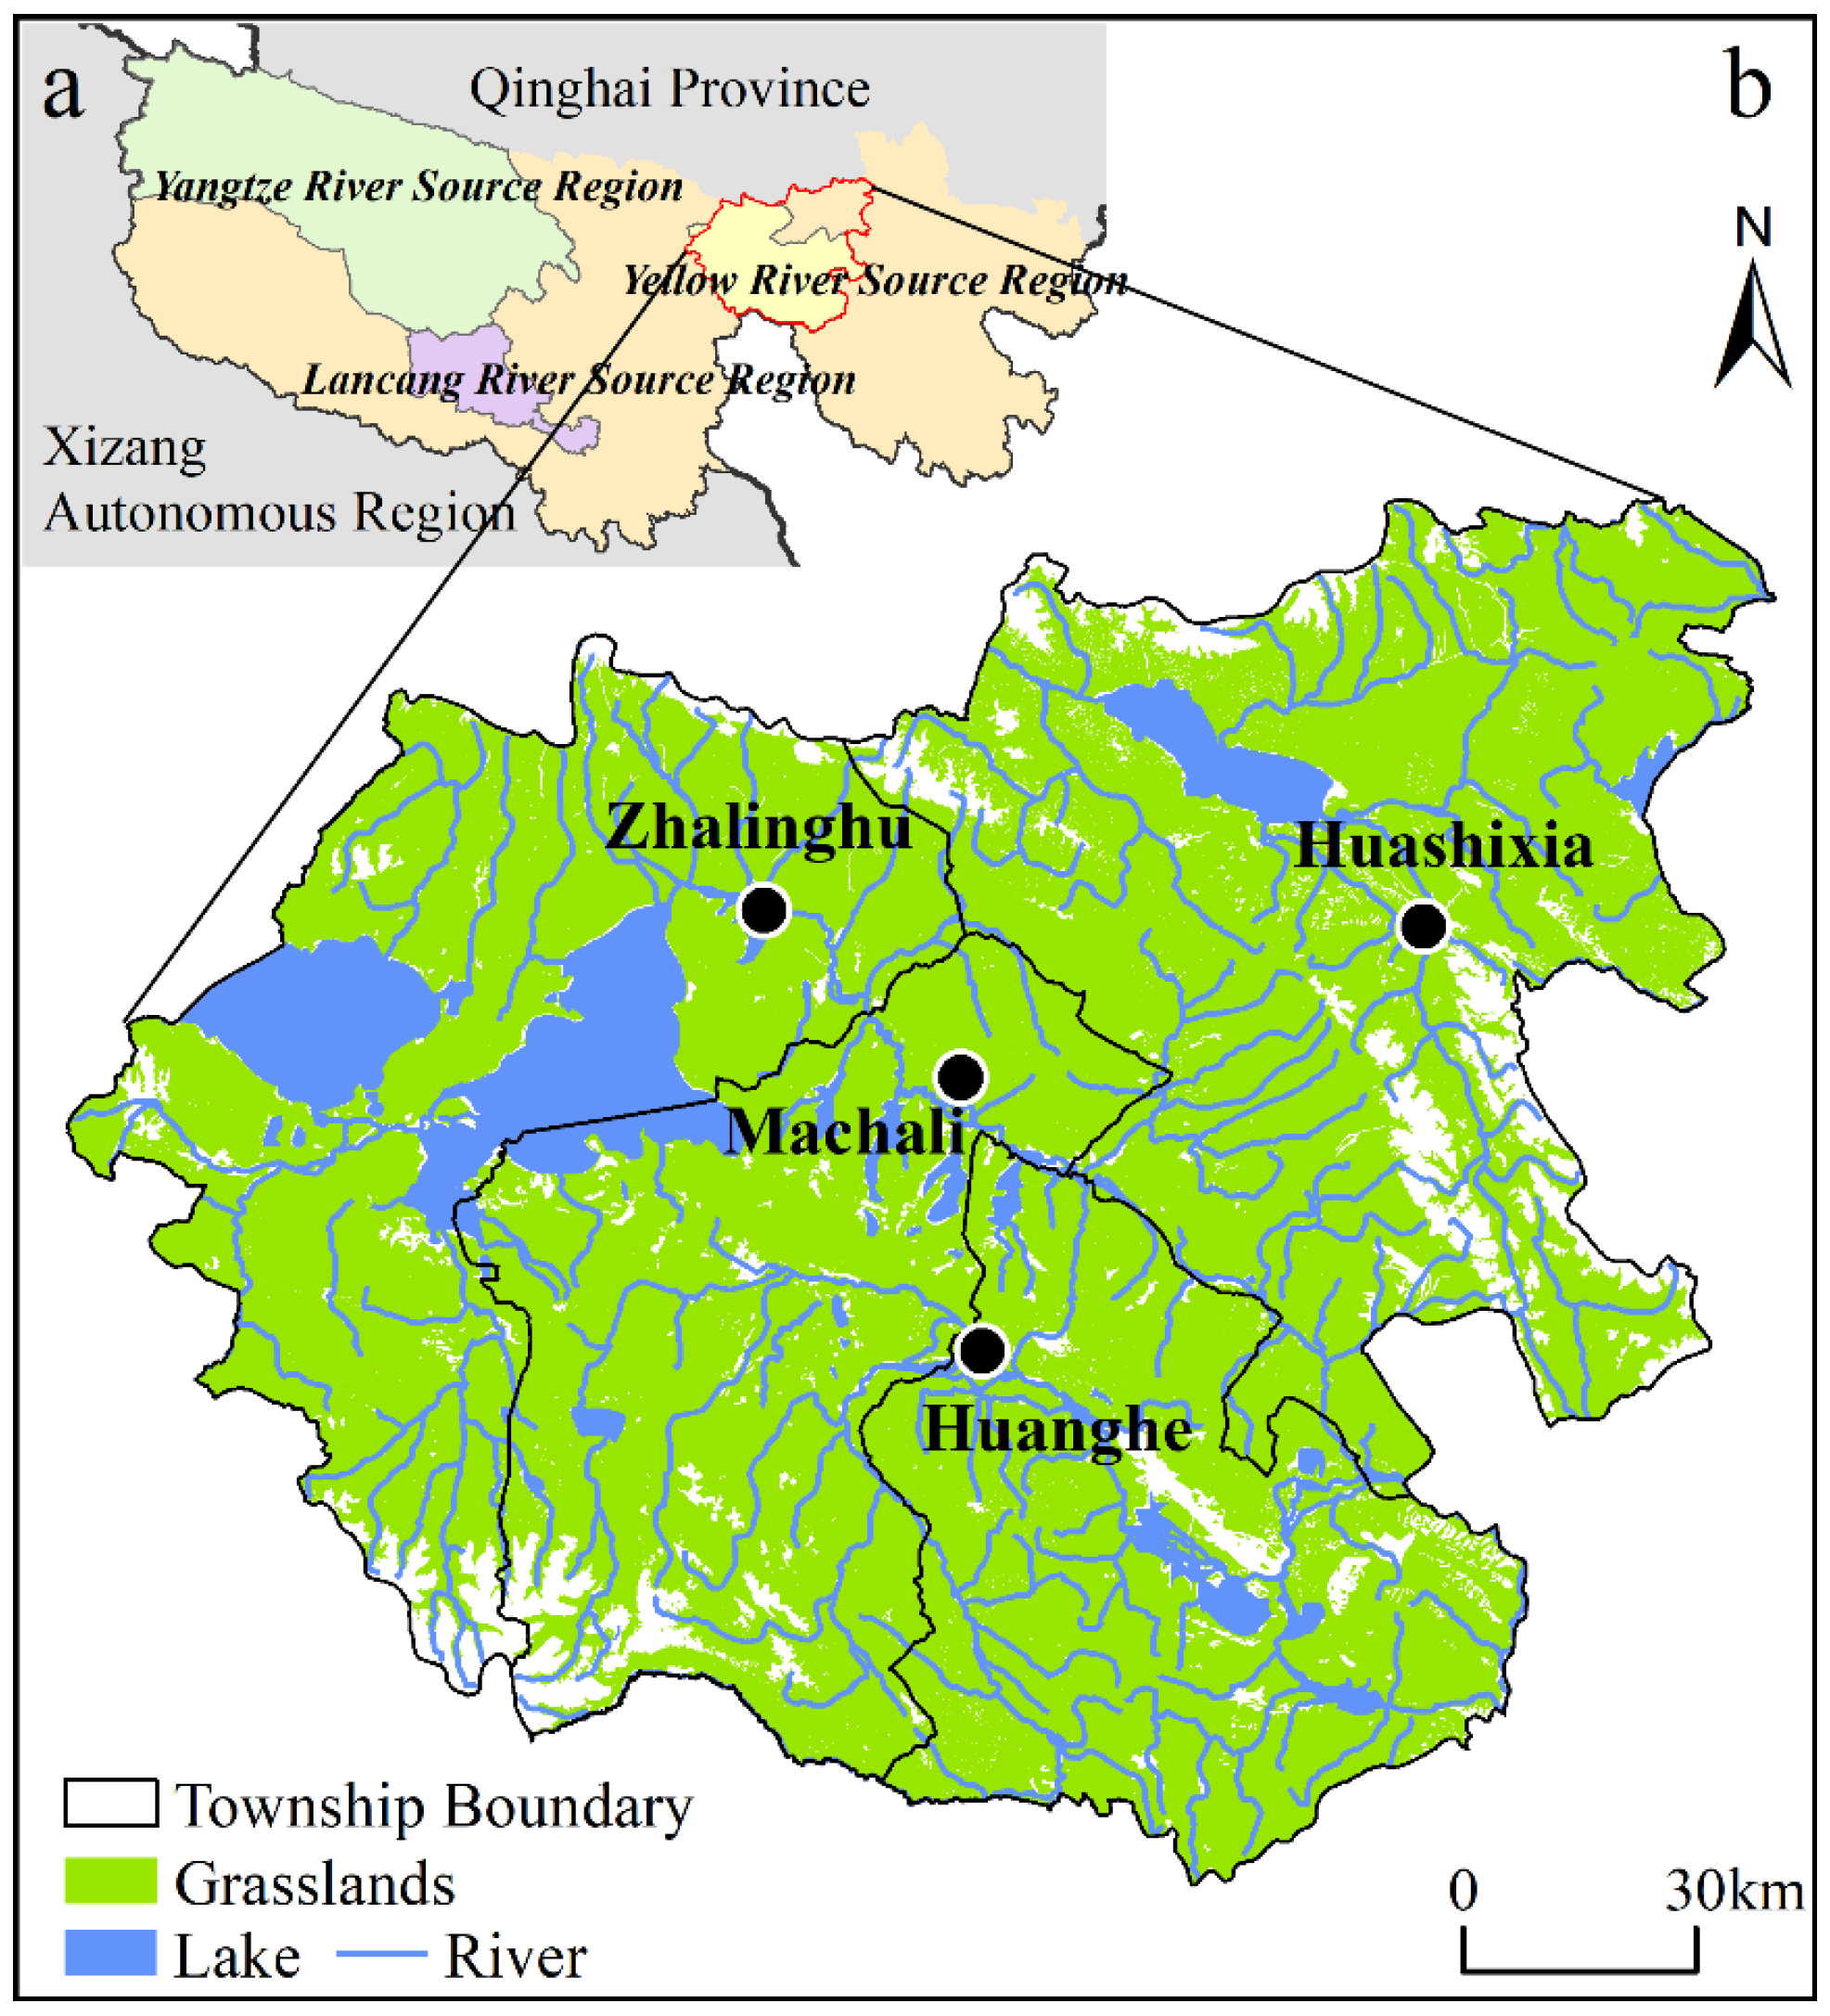
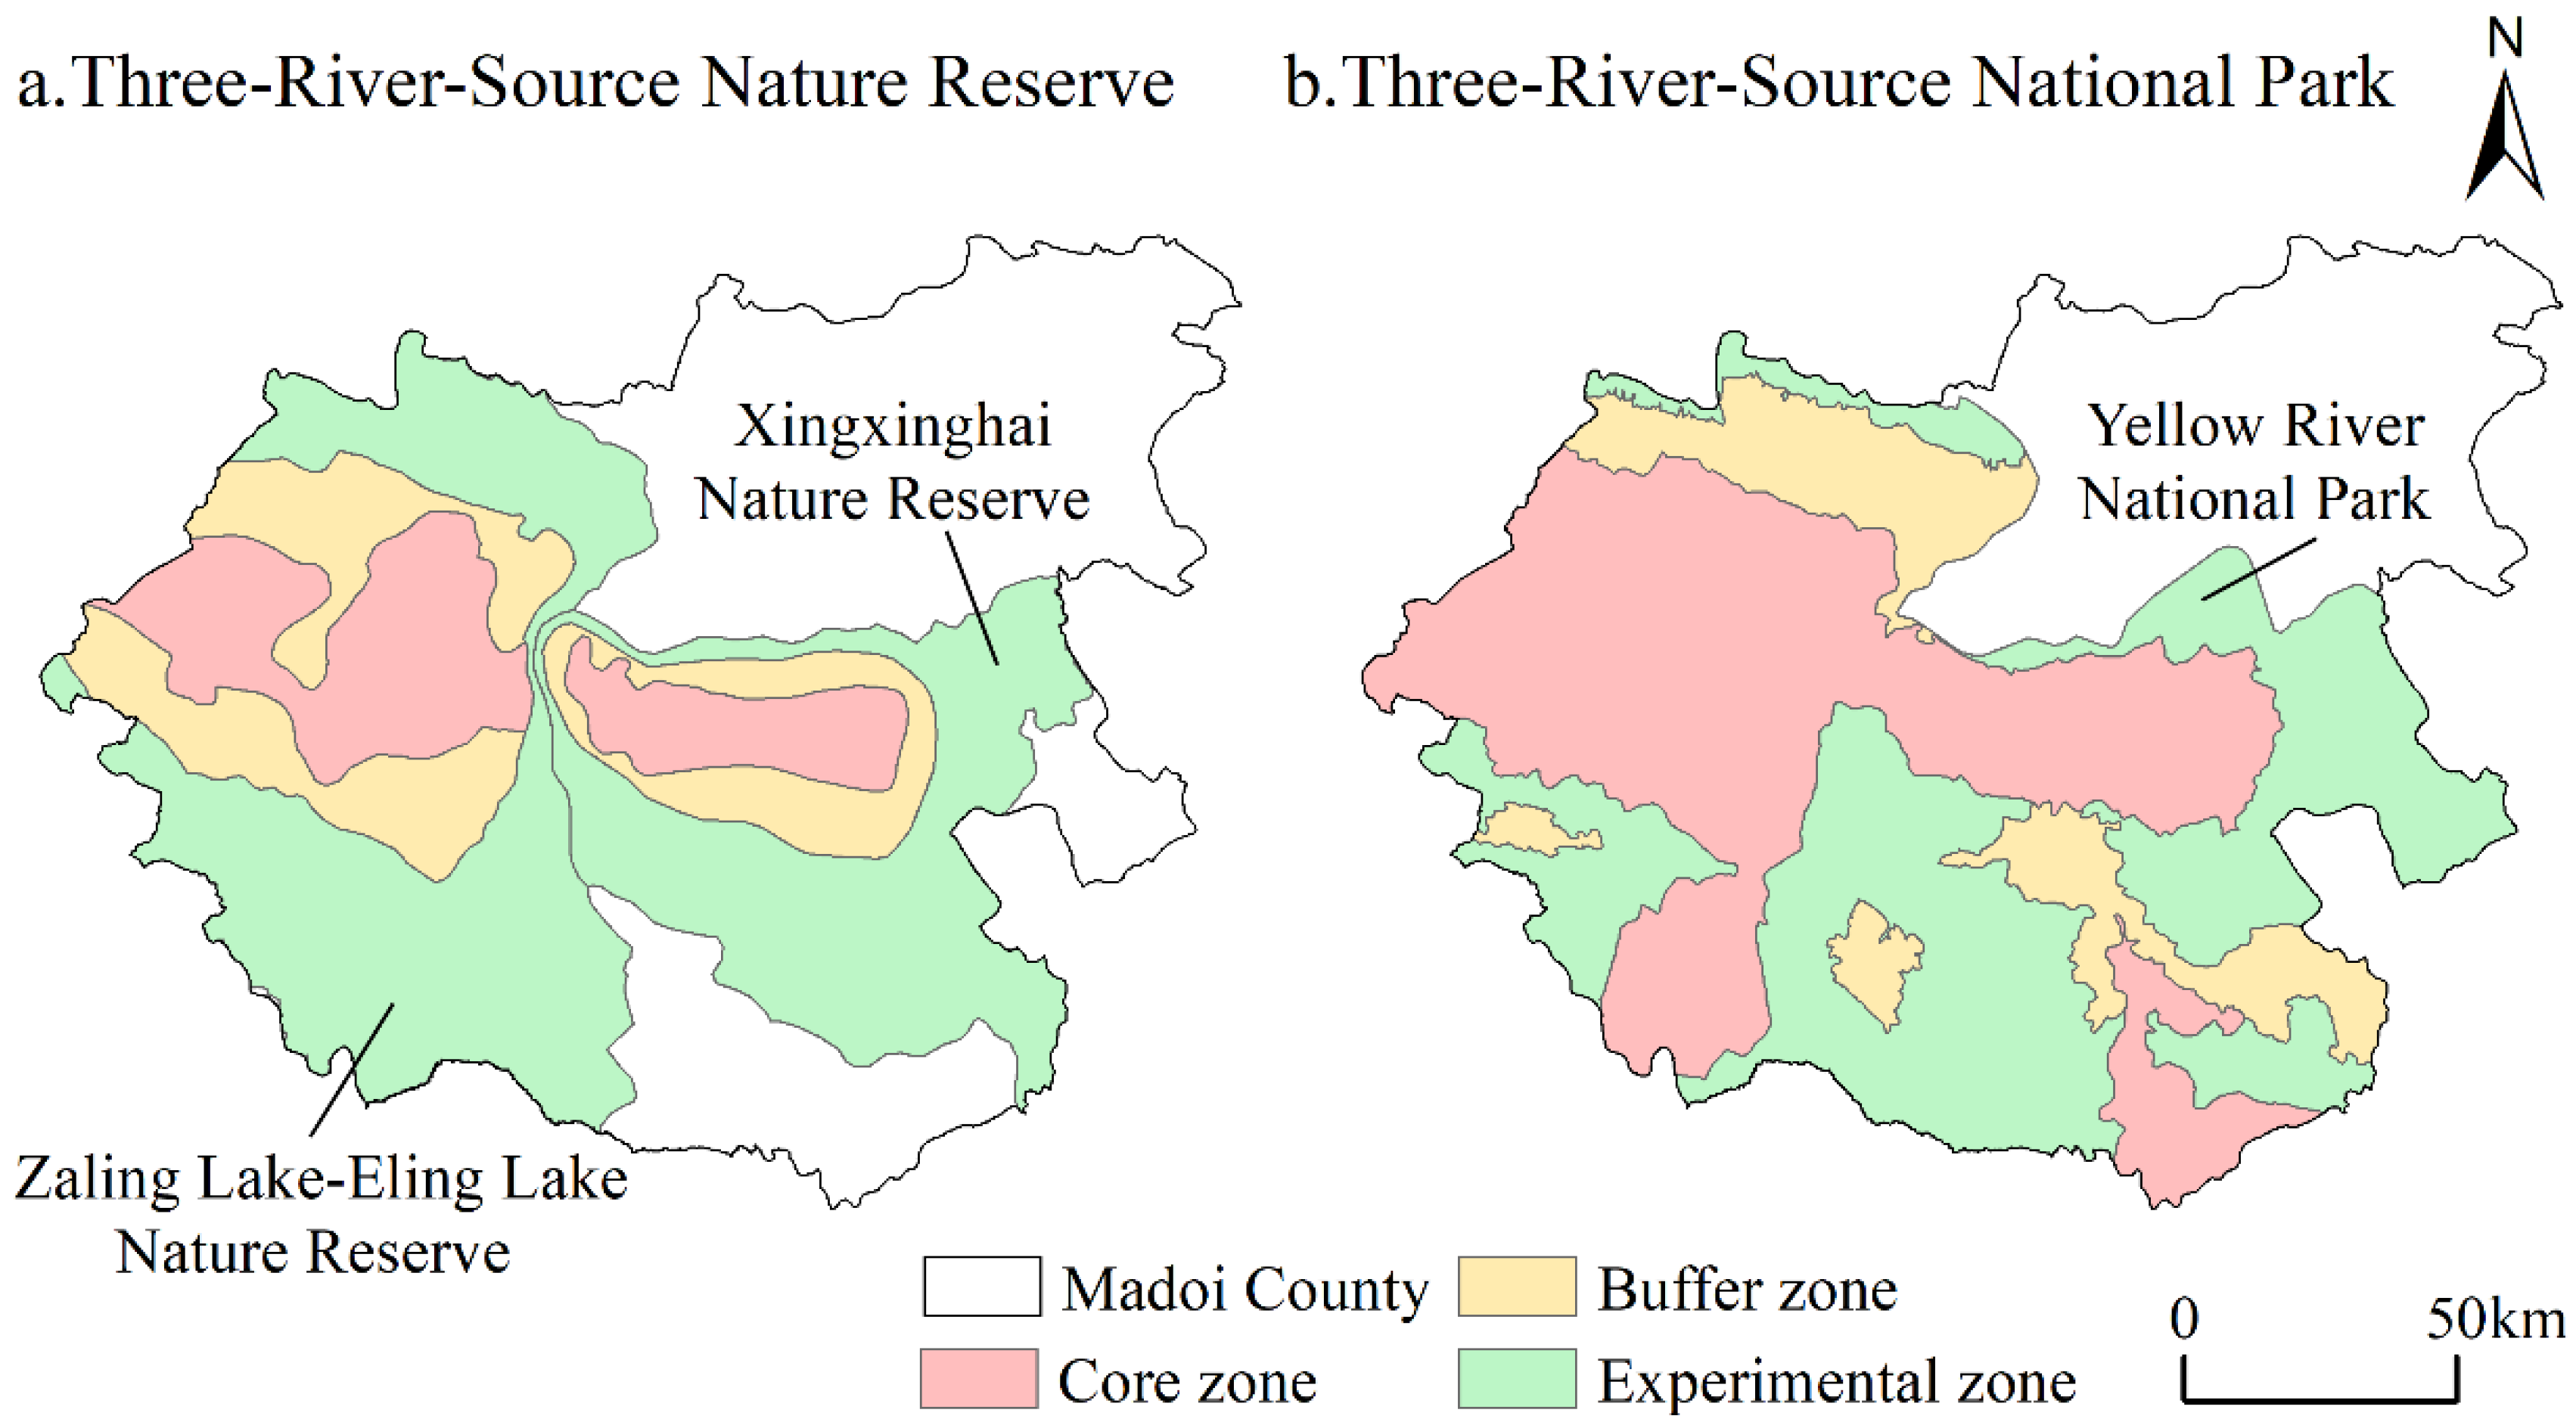
2.1. Study Area

The Yellow River source region lies in the eastern part of the Three-River-Source region on the Tibetan Plateau (Figure 1a). Because livestock data used in grazing intensity assessment are often counted based on administrative units, Madoi County, an administrative unit in the Yellow River source region, was selected as the study area. Madoi County is a typical pastoral county, with grassland occupying more than 90% of the total land area of 25253 km2 [28]. Grazing activity is the dominant type of human activity on the grasslands. In 2019, the total population of Madoi County was 15,989, of which pastoralists accounted for 79%. The population in 2023 was 14,870. When grazing, pastoralists move their livestock around settlements, along roads or rivers to forage, migrate, or drink [35]. The altitude ranges from 3882 to 5262 m [36]. In 2023, the county’s GDP reached CNY 390.7146 million and the total value of agriculture and animal husbandry was CNY 107.397 million. The average temperature in January is −14.0 °C to −12.3 °C and that in July is 8.3 to 10.3 °C. The annual precipitation is (431.3 ± 57.8) mm, mainly concentrated from July to September [37]. Madoi has many rivers, and 5849 large lakes of various sizes, earning it the reputation of “the county of a thousand lakes” [36]. There are many famous lakes, such as Zaling Lake and Eling Lake, Xingxinghai. Madoi County is divided into four townships, namely Machali, Huashixia, Huanghe, and Zhalinghu (Figure 1b).
PAs in Madoi County include the Zaling Lake–Eling Lake Nature Reserve and the Xingxinghai Nature Reserve in the Three-River-Source National Nature Reserve and the Yellow River Source National Park in the Three-River-Source National Park [38]. The Zaling Lake–Eling Lake Nature Reserve and the Xingxinghai Nature Reserve were established in 2003, and the Yellow River Source National Park started its pilot program in 2015. Due to functional zoning, each PA is divided into three zones (the core, buffer, and experimental zone). Grazing is completely prohibited in the core zone, while grazing is allowed in the experimental zone, accompanied by grass–livestock balance management (Figure 2). In addition, due to the implementation of the Grassland Ecological Protection Compensation Policy (GECP) throughout the whole of Madoi County since 2011, some areas in non-PAs have begun to be prohibited from grazing [6]. Before implementing the grazing prohibition in the core zones, the local government negotiated with pastoralists to facilitate their relocation outside of PAs, offering housing and employment opportunities. Beyond the core zones, pastoralists who reduce livestock numbers on designated pastures to maintain a grass–livestock balance are also eligible for subsidies. When assessing grazing intensity at different times, livestock distribution should be within the range permitted for grazing at that time. Therefore, when evaluating grazing intensity in 2000, only grasslands with natural conditions unsuitable for grazing were excluded. In 2005 and 2010, grasslands in the core zones of the Zaling Lake–Eling Lake Nature Reserve and the Xingxinghai Nature Reserve were excluded. In 2011, grasslands in the core zones of the Zhaling Lake–Eling Lake Nature Reserve and the Xingxinghai Nature Reserve, as well as grazing-prohibited areas in the buffer zones, experimental zones, and non-PAs were excluded. In 2015 and 2019, grasslands in the core zones of the Yellow River Source National Park, as well as grazing-prohibited areas in the buffer zones, experimental zones, and non-PAs were excluded.

2.2. Datasets

2.2.1. Data for Grazing Intensity Assessment

Grazing intensity assessment required livestock statistics of Madoi County, data for calculating grazing probability, and land use and land cover data. The data used are as follows:
(1)
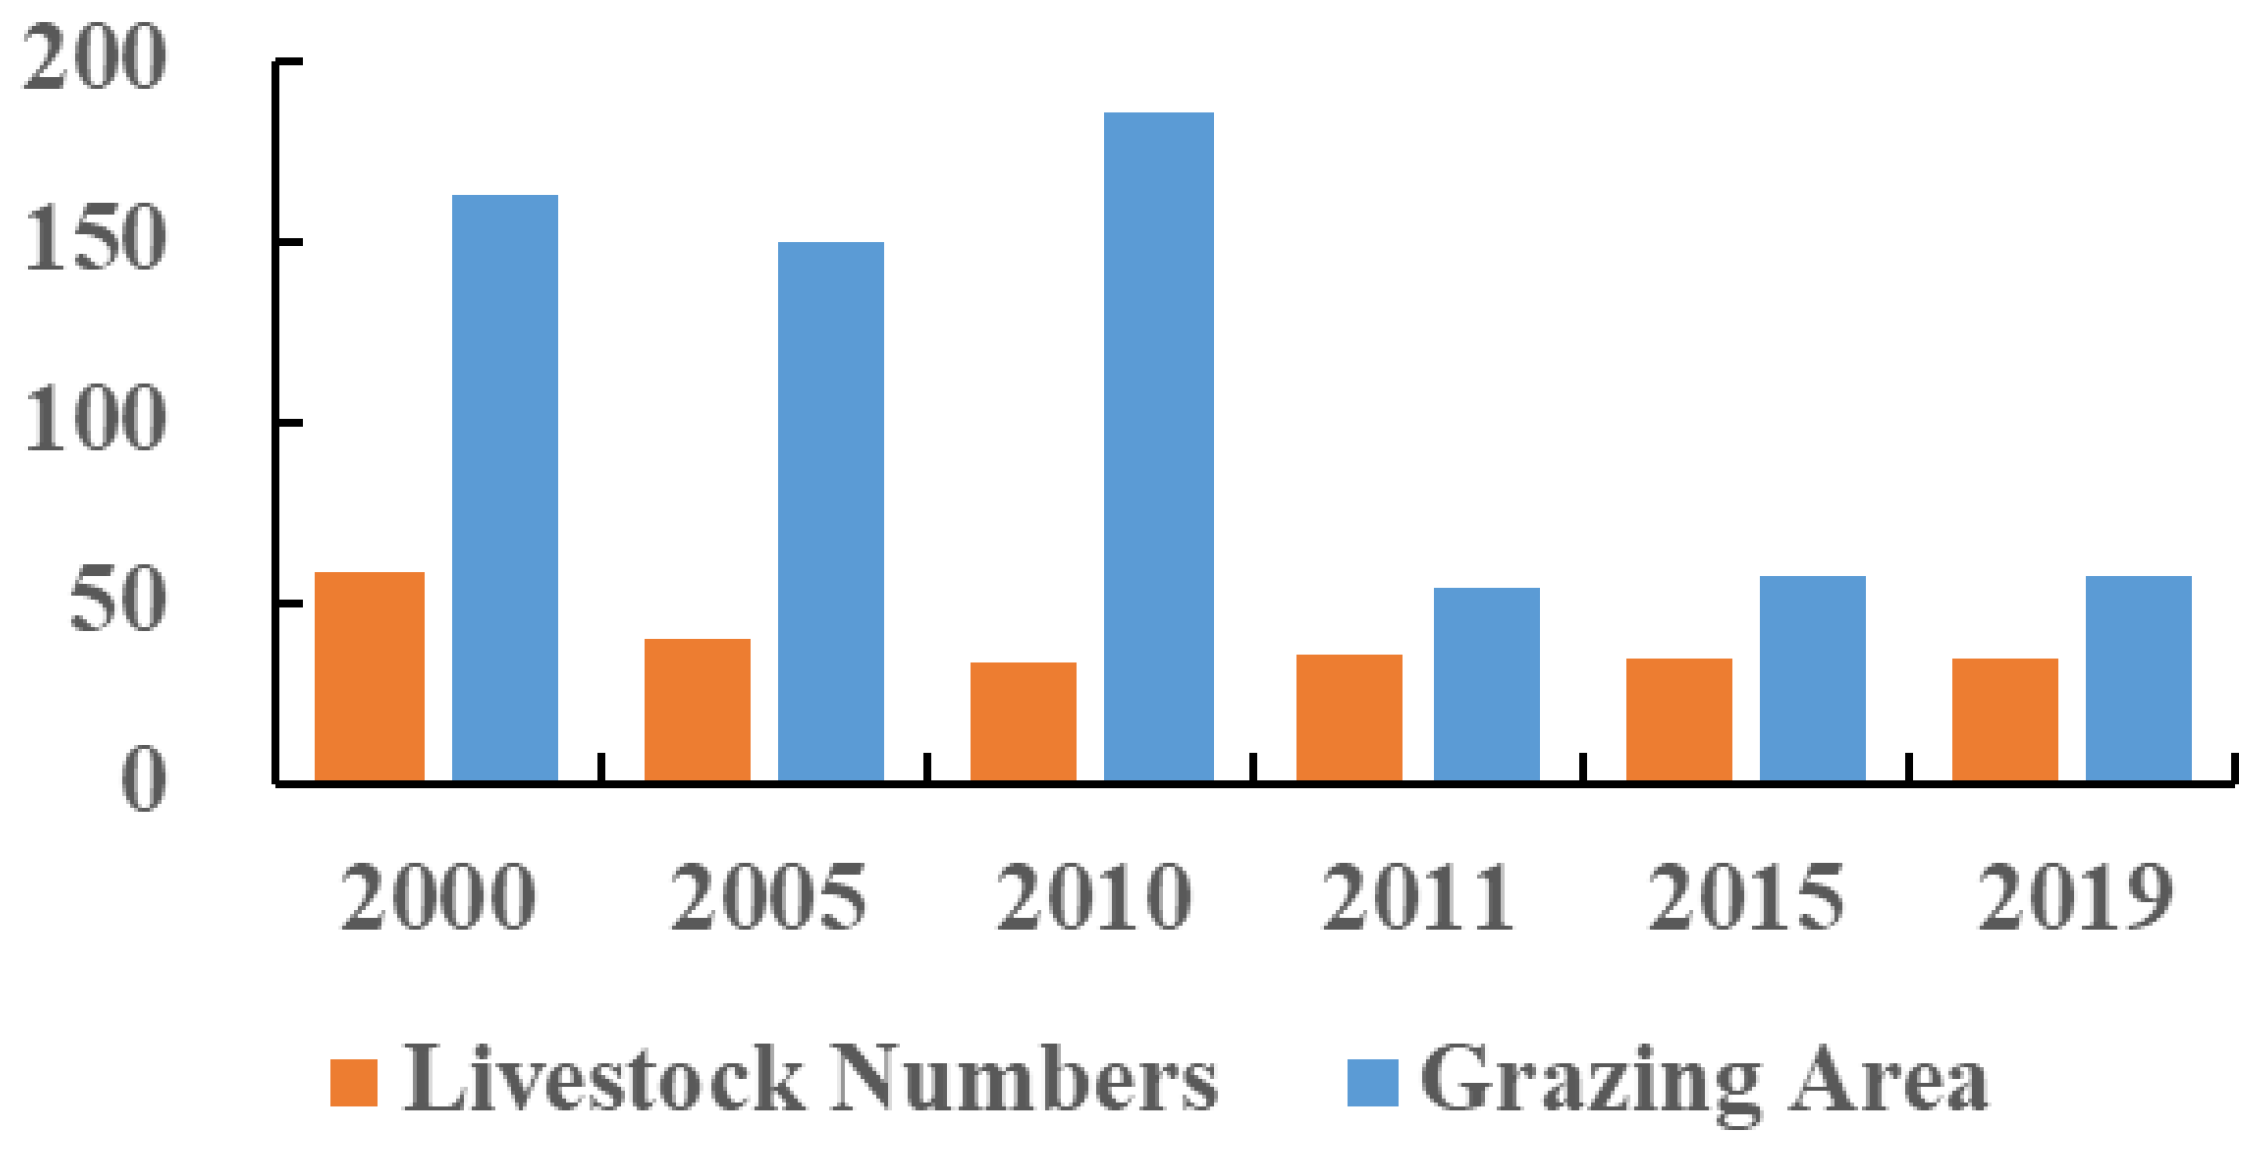
Livestock statistics of Madoi County
Year-end livestock statistics at the township level in 2000, 2005, 2010, 2011, 2015, and 2019 were obtained from the Madoi County Bureau of Statistics and the Guoluo Tibetan Autonomous Prefecture Bureau of Statistics.
(2)
Data for calculating grazing probability
Grazing probability was used to allocate livestock statistics to each grassland unit within grazing-permitted areas [19]. Data for grazing probability included digital elevation data, vector data for settlements, roads, rivers, and land use and land cover data.
The digital elevation data at 30 m resolution were obtained from the Geospatial Data Cloud (http://www.gscloud.cn/, accessed on 3 February 2021), which can be used to further analyze slope and aspect by ArcGIS 10.2 (ESRI, Inc., Redlands, CA, USA). Settlements, roads, and rivers with a scale of 1:250,000 were obtained from the National Geomatics Center of China (https://www.webmap.cn/commres.do?method=result25W, accessed on 5 February 2021).
(3)
Land use and land cover data
Land use and land cover data in 2000, 2005, 2010, 2015, and 2018 were obtained from the Resource and Environment Science and Data Center (http://www.resdc.cn/, accessed on 22 November 2020). The resolution was 30 m. Land use and land cover data divided grassland into three subclasses: high-coverage grassland, medium-coverage grassland, and low-coverage grassland. The grazing intensity assessments in 2011 and 2019 used land use and land cover data from 2010 and 2018, respectively.

2.2.2. Normalized Difference Vegetation Index Data

We obtained the normalized difference vegetation index (NDVI) data (MOD13Q1) during 2000-2019 with a spatial resolution of 250 m and a temporal resolution of 16 d from the National Aeronautics and Space Administration (NASA) (https://ladsweb.nascom.nasa.gov/, accessed on 10 March 2021). To eliminate atmospheric effects and cloud contamination, we synthesized monthly NDVI values using the maximum value composite method [39]. NDVI values for the growing season (from June to August) were obtained by averaging monthly NDVI values.

2.2.3. Meteorological Data

Meteorological data were collected from 24 weather stations within and around Madoi County from 2000 to 2019. The data were obtained from the China Meteorological Science Data Sharing Service Network (http://www.nmic.cn/, accessed on 28 March 2021), including the daily average temperature and total precipitation. The monthly average temperature and total precipitation during the growing season were computed from these data. The ANUSPLIN 4.4 software was used to interpolate station meteorological data into grid data.

2.3. Methods

2.3.1. Grazing Intensity Assessment

Grazing intensity at the grid scale was represented by livestock density, which was calculated as the ratio of the number of livestock within a grid to the grid area. However, livestock numbers are often reported at the level of administrative units. To estimate the number of livestock at the grid scale, allocating the total livestock numbers from the administrative unit to each grid within grazing-permitted areas is necessary. It is important to note that grids within grazing-prohibited areas should not be allocated livestock. The allocation of livestock is not uniform across grids, as their grazing probability varies due to differing grassland conditions. To account for this variation, the grazing probability was introduced as a factor to adjust livestock distribution at the grid scale. The grazing probability for one grid and the total number of livestock within the administrative unit yielded the livestock number allocated to that grid. Dividing this value by the grid area provided the grazing intensity at the grid scale. It was expressed in the form of the following formula (Formula (1)) [19]:
G I i = N × P i S i
where GIi represents the grazing intensity of grid i. N represents the total livestock numbers (sheep units). Pi represents the grazing probability of grid i. Si represents the area of grid i.
Therefore, the steps of grazing intensity gridding were as follows: (1) exclude the grids within the grazing-prohibited areas and retain the grids within the grazing-permitted areas; (2) calculate the total number of livestock of different breeds within the administrative unit; (3) calculate the probability of grazing for each grid within the grazing-permitted areas; (4) determine the area of the grids; (5) calculate the grazing intensity of the grids according to Formula (1).
(1)
Excluding grids in grazing-prohibited areas
When excluding grazing-prohibited areas, grids within the core zones can be easily excluded based on boundary data for the core zones. However, grids outside of the core zones are not easy to exclude because the spatial location of the grazing-prohibited areas outside of the core zones is difficult to determine due to rotational grazing. Fortunately, we obtained data on the total area of grazing-permitted areas outside of the core zones from a field survey. In addition, we observed that local herders graze with the settlement as the center and spread out to the surrounding areas. Therefore, according to the grazing intensity assessment method of Hu et al. [19], with the settlements as the centers, the radius of the circles was continuously adjusted outward until the area of the circles was equal to the grazing-permitted area with the help of ArcGIS 10.2 software. The areas outside of the circles were regarded as grazing-prohibited areas.
(2)
Calculating the total number of livestock
Before calculating the total number of livestock, it is necessary to standardize different livestock breeds into a unified sheep unit. It is essential because livestock breeds differ in their feed intake from grasslands, thus exerting varying levels of grazing pressure. The conversion standard used in this study was issued by the Ministry of Agriculture and Rural Affairs of China in 2015 (1.0 sheep = 1.0 sheep units, 1.0 goat = 0.8 sheep units, 1.0 yak = 4.5 sheep units, and 1.0 horse = 5.5 sheep units).
(3)
Calculate the probability of grazing
Grazing probability is calculated with the following formula (Formula (2)) [17]:
P i = 1 t u i b 1 n 1 t u i b
where Pi represents the grazing probability of grid i, n represents the number of grassland grids within grazing-permitted areas, t represents the number of influencing factors, and uib represents the influence value of factor b of grid i. Based on the screening of Hu et al. [19], seven factors influence grazing probability, including elevation, slope, aspect, vegetation cover, distance from settlements, distance from roads, and distance from rivers. The assignment of the influencing factors was based on Hu’s method [19].
(4)
Determining the area of the grids
The grid area generally corresponds to the resolution of the land use type. In this study, the area of each grid is 30 × 30 m.

2.3.2. Vegetation Trend Analysis

The linear least-squares regression method was applied to detect the changing trend in vegetation cover [40]. NDVI, derived from satellites, is an indicator of vegetation cover and has been widely used to monitor vegetation changes [41,42]. The regression coefficient was calculated using the following equation [43]:
S = n × i t i × V i ( i t i ) ( i n V i ) n × i t i 2 ( i n i ) 2
where n represents the number of years, V represents the value of the NDVI of the year i, and t represents the biggest year. In this study, we detected the vegetation dynamics from 2000 to 2019. Thus, n was 20, t was 2019, and i was from 2000 to 2019.
In addition, we classified vegetation changes into four categories by combining the slope and F-test: significant increase (S > 0, p < 0.05), slight increase (S > 0, p ≥ 0.05), slight decrease (S < 0, p ≥ 0.05), and significant decrease (S < 0, p < 0.05).

2.3.3. Quantitative Analysis of the Relative Contributions of Climatic and Human Factors to Grassland Vegetation Changes

To detect and attribute vegetation changes, we adopted a method based on partial derivatives, which has been widely used in diverse ecological studies [23,26,44] and hydrological studies [45,46]. Vegetation changes are influenced by a variety of factors. The slope of NDVI over time is equal to the sum of the contribution rates of all factors to vegetation changes (Equation (4)) [47].
d N D V I d t = i = 1 n N D V I x i d x i d t = i = 1 n C x i
where d N D V I d t is the variation rate of NDVI in time variable t, n is the number of factors, x i is the ith factor, and C x i is the contribution of x i to NDVI change.
In this study, we assume human activities and climate change to be the major factors affecting vegetation changes. Specifically, temperature and precipitation are regarded as key climatic factors, and grazing is regarded as a key anthropogenic factor. Therefore, the contributions of temperature, precipitation, and grazing are as the following equations (Formulas (5) and (6)) according to Formula (4).
C c c = C t e m + C p r e = N D V I t e m · d t e m d t + N D V I p r e · d p r e d t
C g a = C g r a z = N D V I g r a z · d g r a z d t
where C c c and C g a represent the contributions of climate change and grazing activity to the NDVI change rate, respectively. C t e m , C p r e , and C g r a z represent the contributions of temperature, precipitation, and grazing to the NDVI change rate. N D V I t e m , N D V I p r e , and N D V I g r a z are the slopes of the linear regression lines between the NDVI and temperature, precipitation, and grazing intensity. d t e m d t , d p r e d t , and d g r a z d t are the slopes of the linear regression for temperature, precipitation, and grazing intensity against time t at pixel scale.
To determine the relative effects of climatic and anthropogenic factors on vegetation changes, we devised six scenarios (Table 1).

3. Results

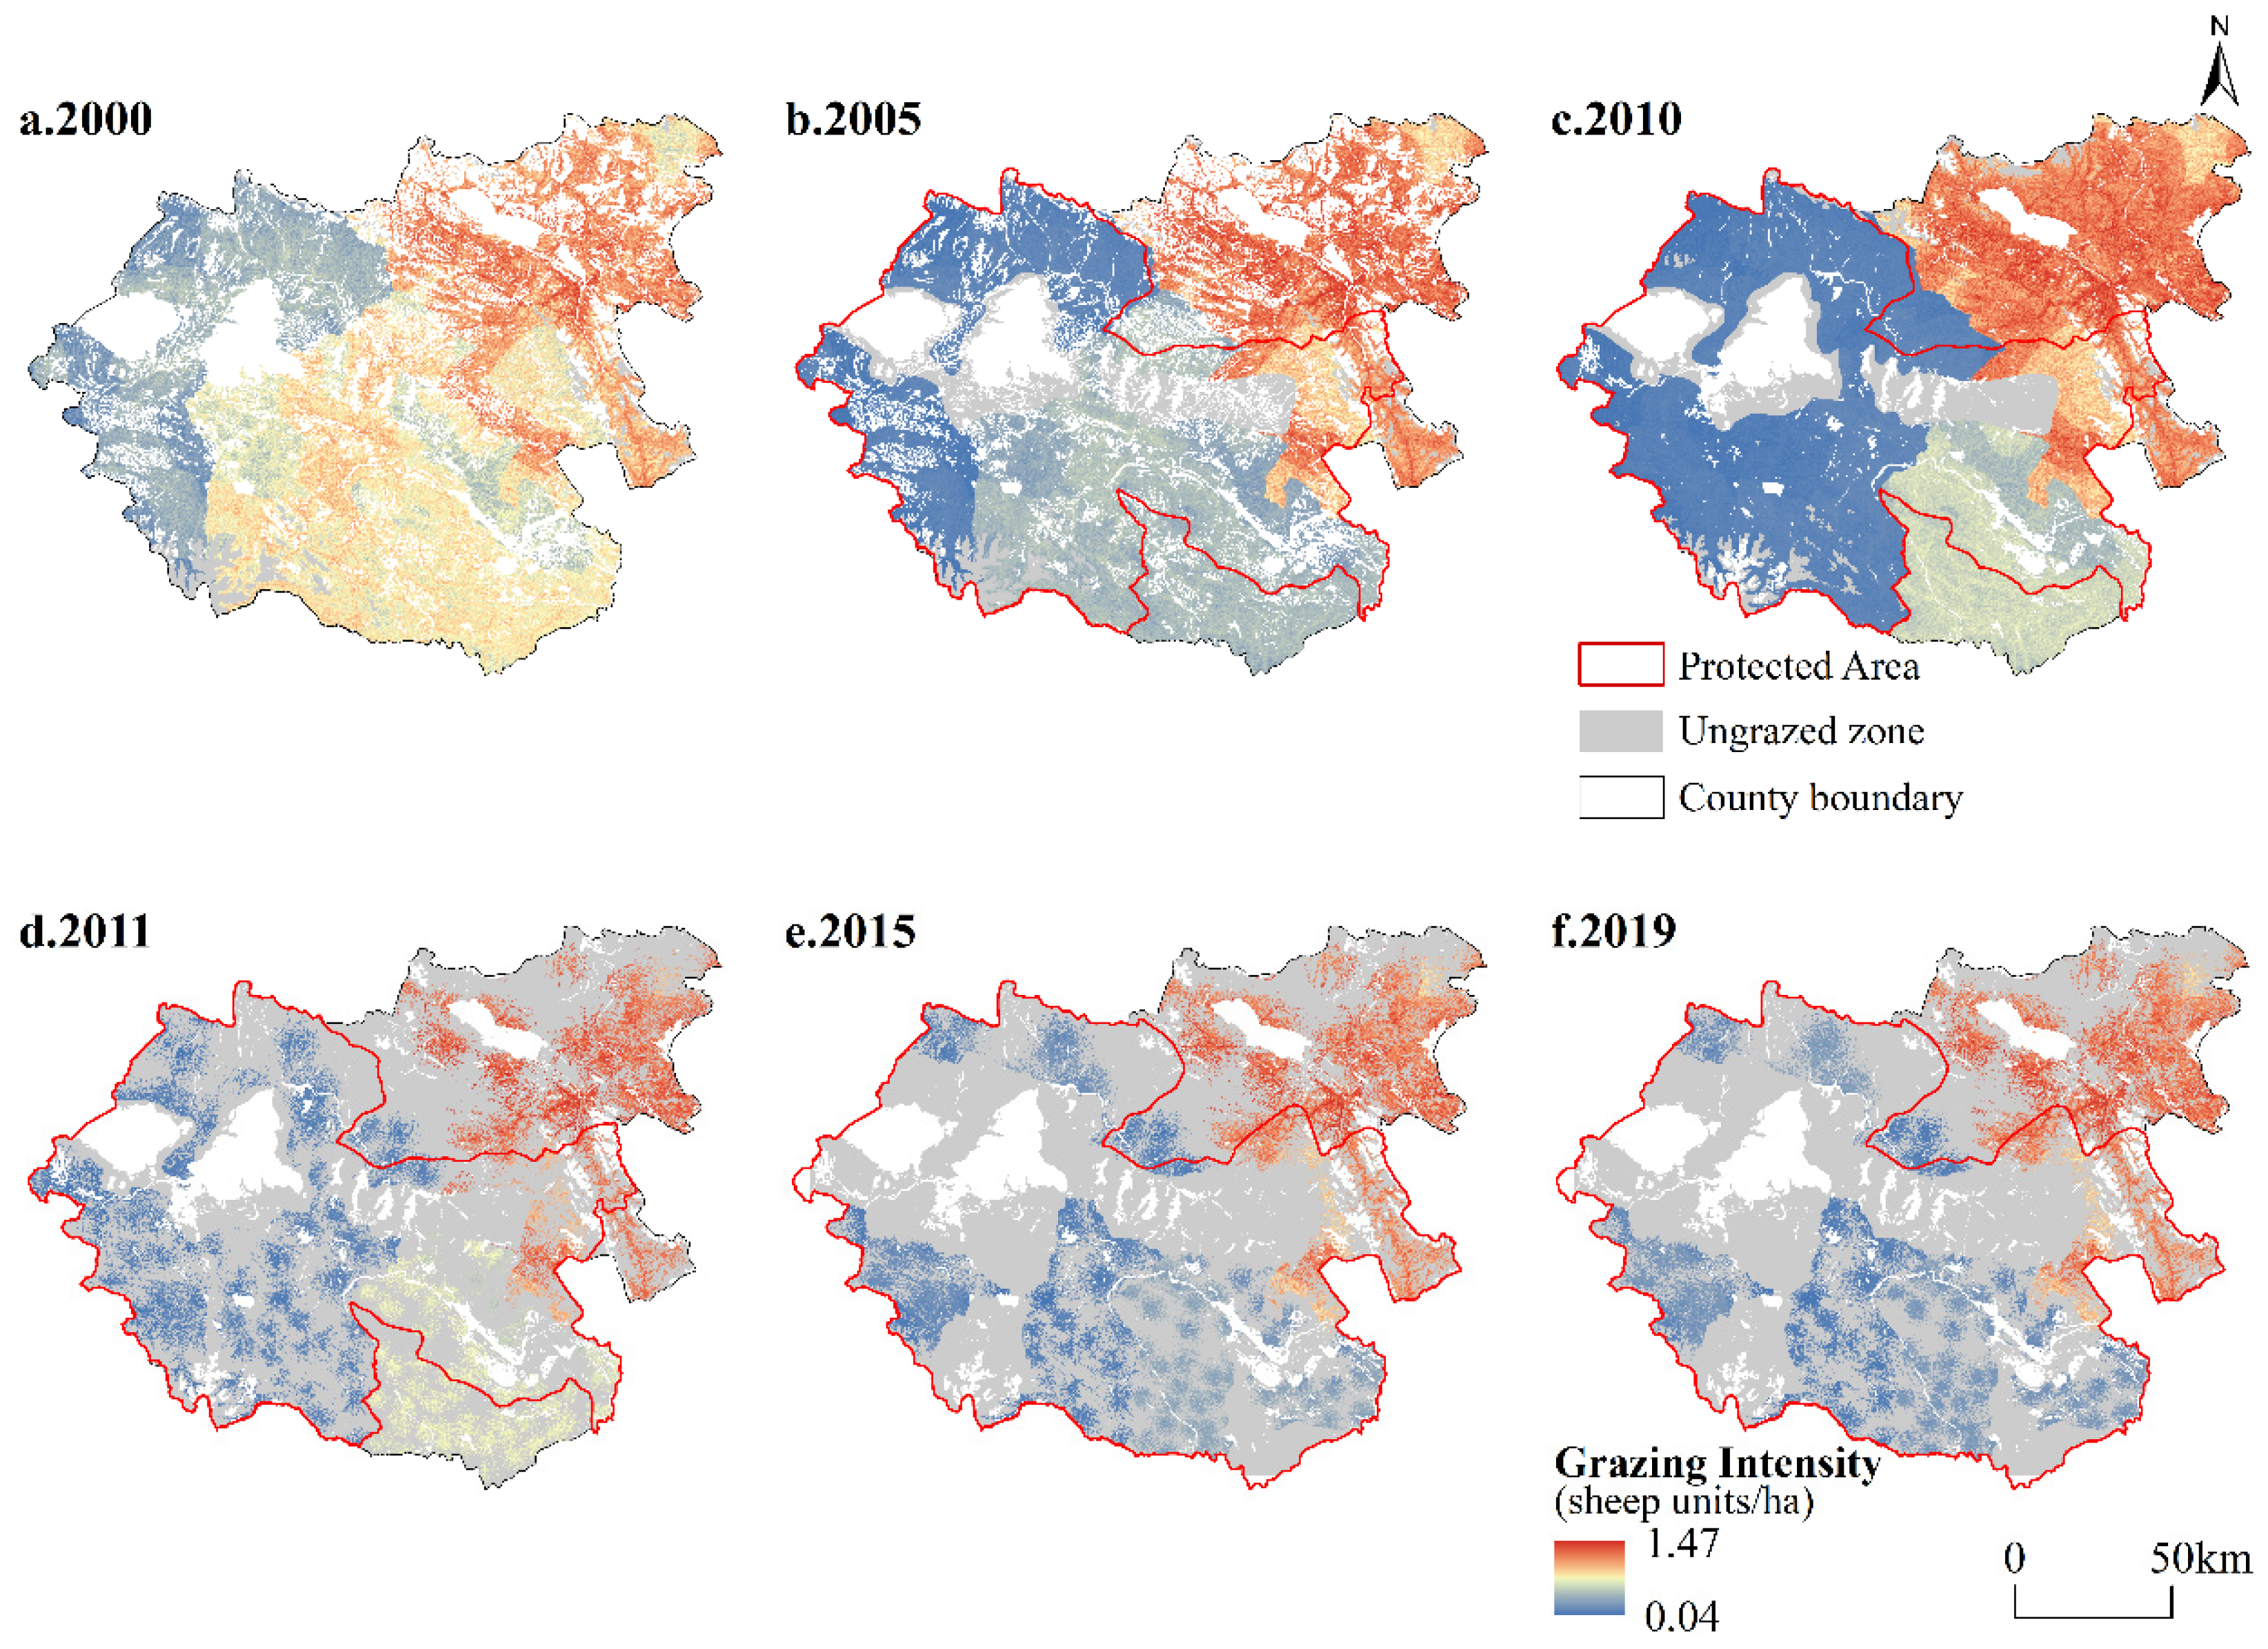
3.1. Spatial and Temporal Dynamics of Grazing Intensity

Using the method of grazing intensity assessment, we mapped grazing intensity in Madoi County from 2000 to 2019 (Figure 3).
The grazing intensity in Madoi County from 2000 to 2019 ranged from 0 to 1.47 sheep units/ha (grazing intensity in ungrazed zones was 0), with a pattern of “high in the northeast and low in the southwest” (Figure 3). The areas with higher grazing intensity have always been outside of PAs; the areas with lower grazing intensity have always been inside of PAs. Thus, the establishment of PAs ensured that over a long period of time, the grasslands in PAs were less disturbed by grazing than those outside of PAs.
Over the past two decades, grazing-permitted areas in Madoi County have been gradually shrinking. On the contrary, grazing-prohibited areas have been gradually expanding (Figure 3). Areas where grazing is prohibited and areas that are not suitable for grazing are collectively referred to as ungrazed zones. The ungrazed zone accounted for only 4.20% of the grassland in 2000 and rose to 73.15% of the grassland in 2019 (Figure 4a). After the establishment of the Yellow River Source National Park, its core zone was larger than the sum of the core zones of the Zaling Lake–Eling Lake Nature Reserve and the Xingxinghai Nature Reserve, so grazing-prohibited areas were further expanded. Moreover, after the implementation of GECP, in addition to the core zone, there were some areas where grazing was prohibited in the buffer zones, experimental zones, and even non-PAs. These results suggested that conservation measures were the main factor affecting the change in ungrazed zones.
The average grazing intensity of all grasslands in Madoi County, including grazed and ungrazed zones, decreased by 0.20 sheep units/ha from 2000 to 2019 (Figure 4b). However, the average grazing intensity in grazed zones was increasing. In just one year, from 2010 to 2011, the average grazing intensity in grazed zones increased by 0.25 sheep units/ha (Figure 4b), which may be because the ungrazed zones expanded rapidly from 2010 to 2011 while the number of livestock did not decrease over time.

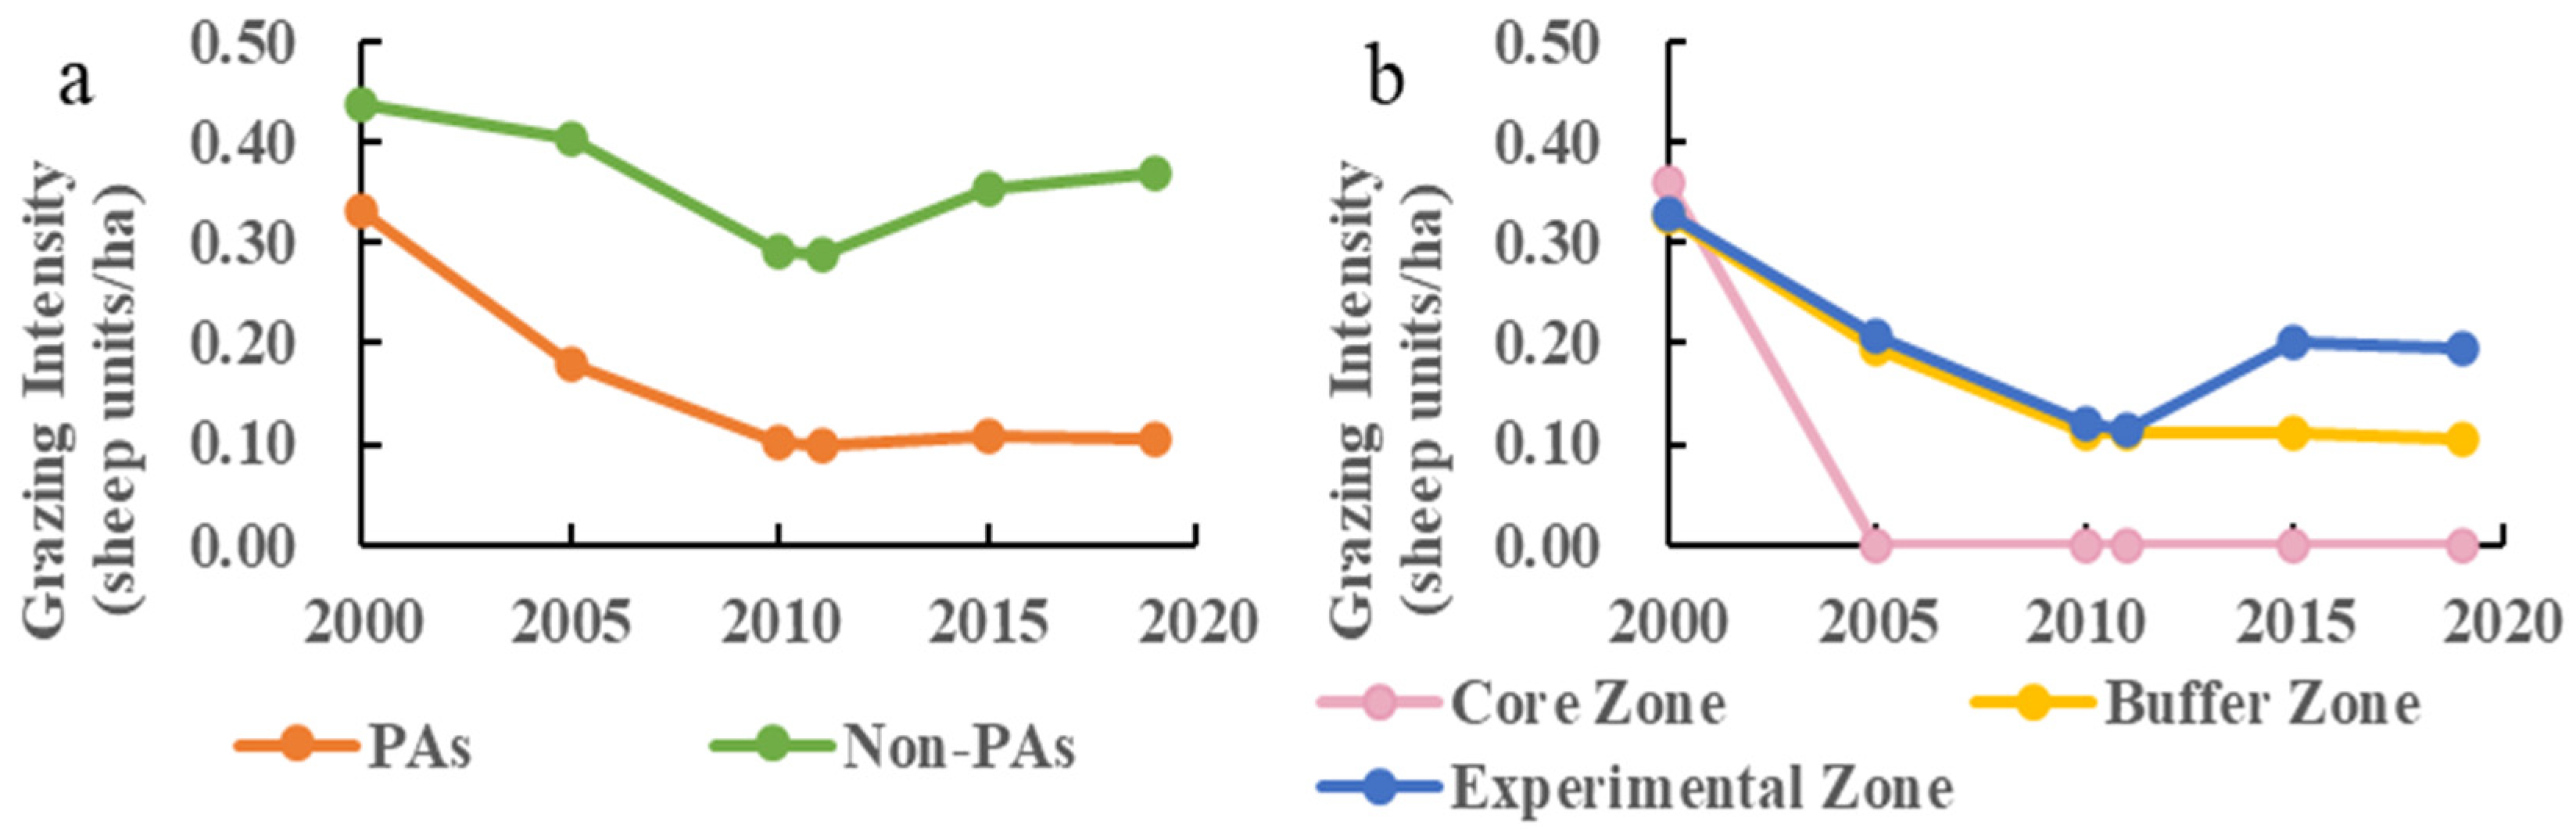
3.2. Differences in Grazing Intensity Inside and Outside of PAs

The average grazing intensity from 2000 to 2019 in PAs (0.15 sheep units/ha) was lower than in non-PAs (0.36 sheep units/ha) (Figure 5a). In addition, the grazing intensity decreased more in PAs (0.23 sheep units/ha) than in non-PAs (0.07 sheep units/ha). From 2000 to 2010, the grazing intensity in PAs and non-PAs showed a downward trend. From 2011 to 2019, the grazing intensity in PAs did not change much, while that in non-PAs increased (Figure 5a). These results show that the conservation measures taken in PAs were more effective in mitigating grazing intensity than those taken in non-PAs.
The decrease in grazing intensity varied between functional zones within PAs. The average grazing intensity in the core zone dropped directly from 0.36 sheep units/ha to 0 (Figure 5b) because of the complete grazing prohibition. The average grazing intensity decreased by 0.22 and 0.14 sheep units/ha in the buffer zone and the experimental zone (Figure 5b), respectively. Grazing was also prohibited in some areas within the buffer zone and experimental zone, and grass–livestock balance management was implemented in areas where grazing was not prohibited.

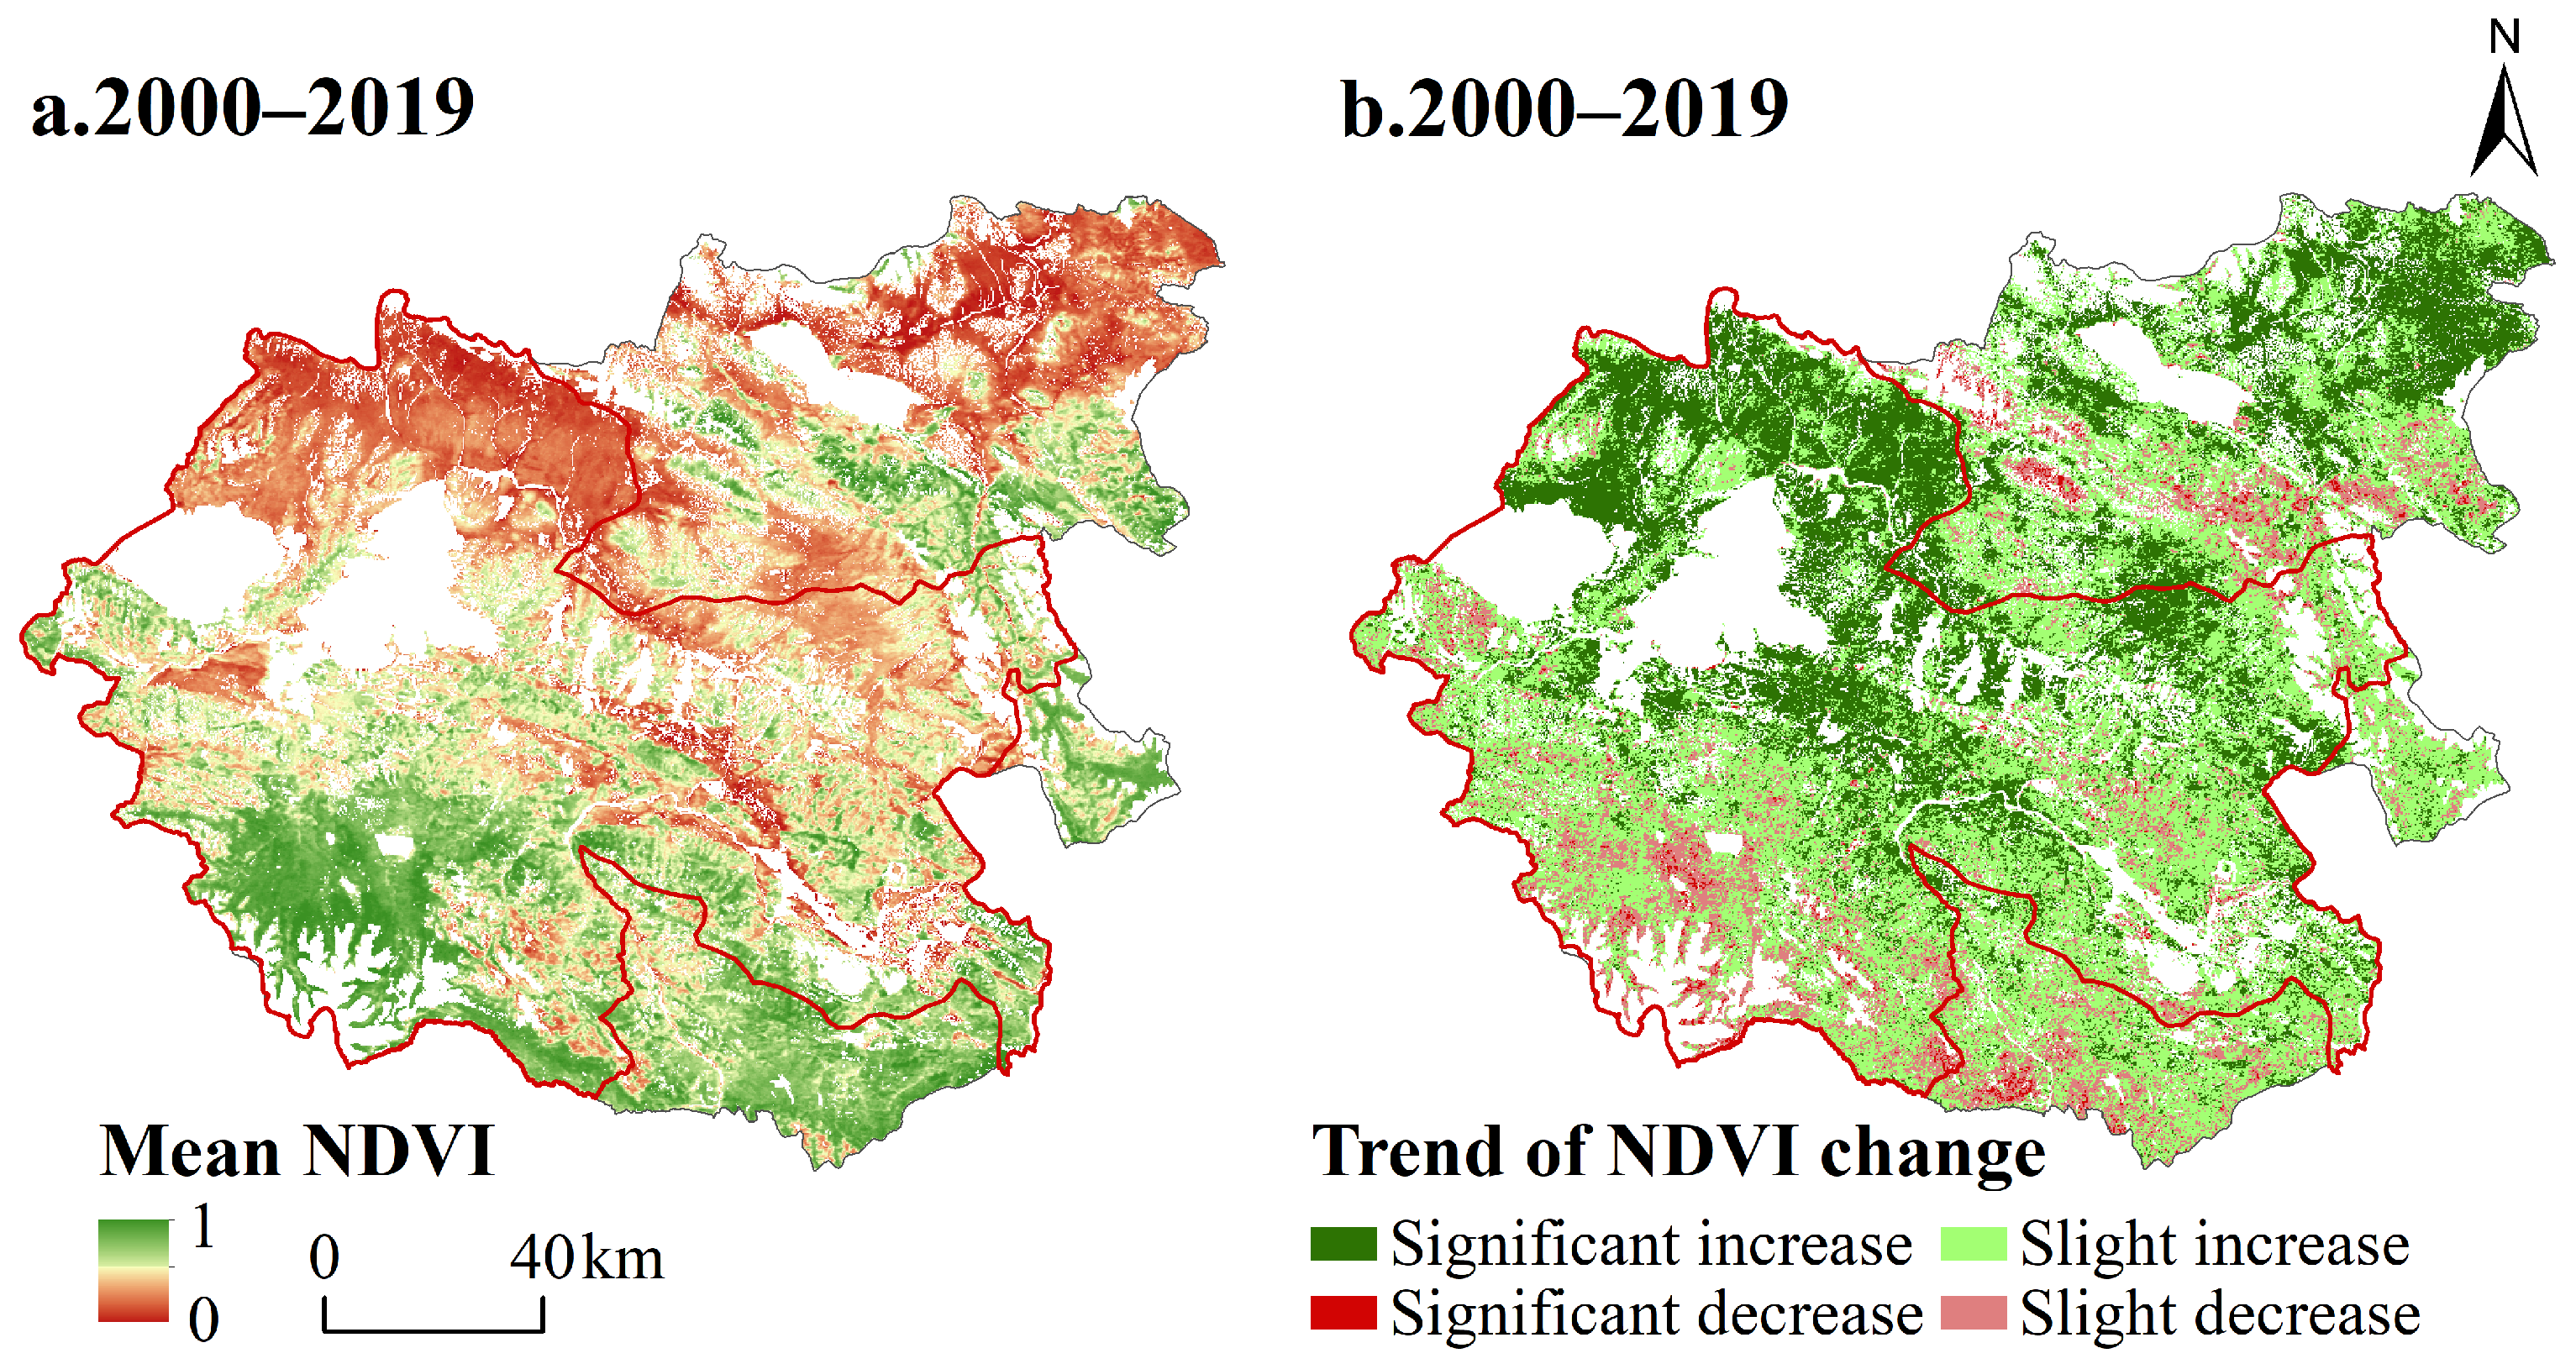
3.3. Vegetation Dynamics Within and Outside of Protected Areas

The vegetation cover changes from 2002 to 2019 mainly showed an increasing trend, accounting for 85.18% of the total grassland area (Figure 6b). The area with a significant increase in vegetation cover accounted for 35.20%, mainly distributed in the northern region; the area with a slight increase accounted for 49.98%, mainly distributed in the southern region. In addition, the vegetation cover in the northern part of Madoi County was lower than that in the southern part (Figure 6a). Therefore, the changing trend in areas with low vegetation cover was mainly a significant increase, while the changing trend in areas with high vegetation cover was mainly a slight increase.
The trend of vegetation cover changes in both PAs and non-PAs was mainly increasing, and the proportion of areas with increased vegetation cover in PAs (86.20%) was larger than the proportion in non-PAs (83.44%). In addition, the proportion of areas with significant increases in PAs (36.60%) was also larger than the proportion in non-PAs (32.81%).

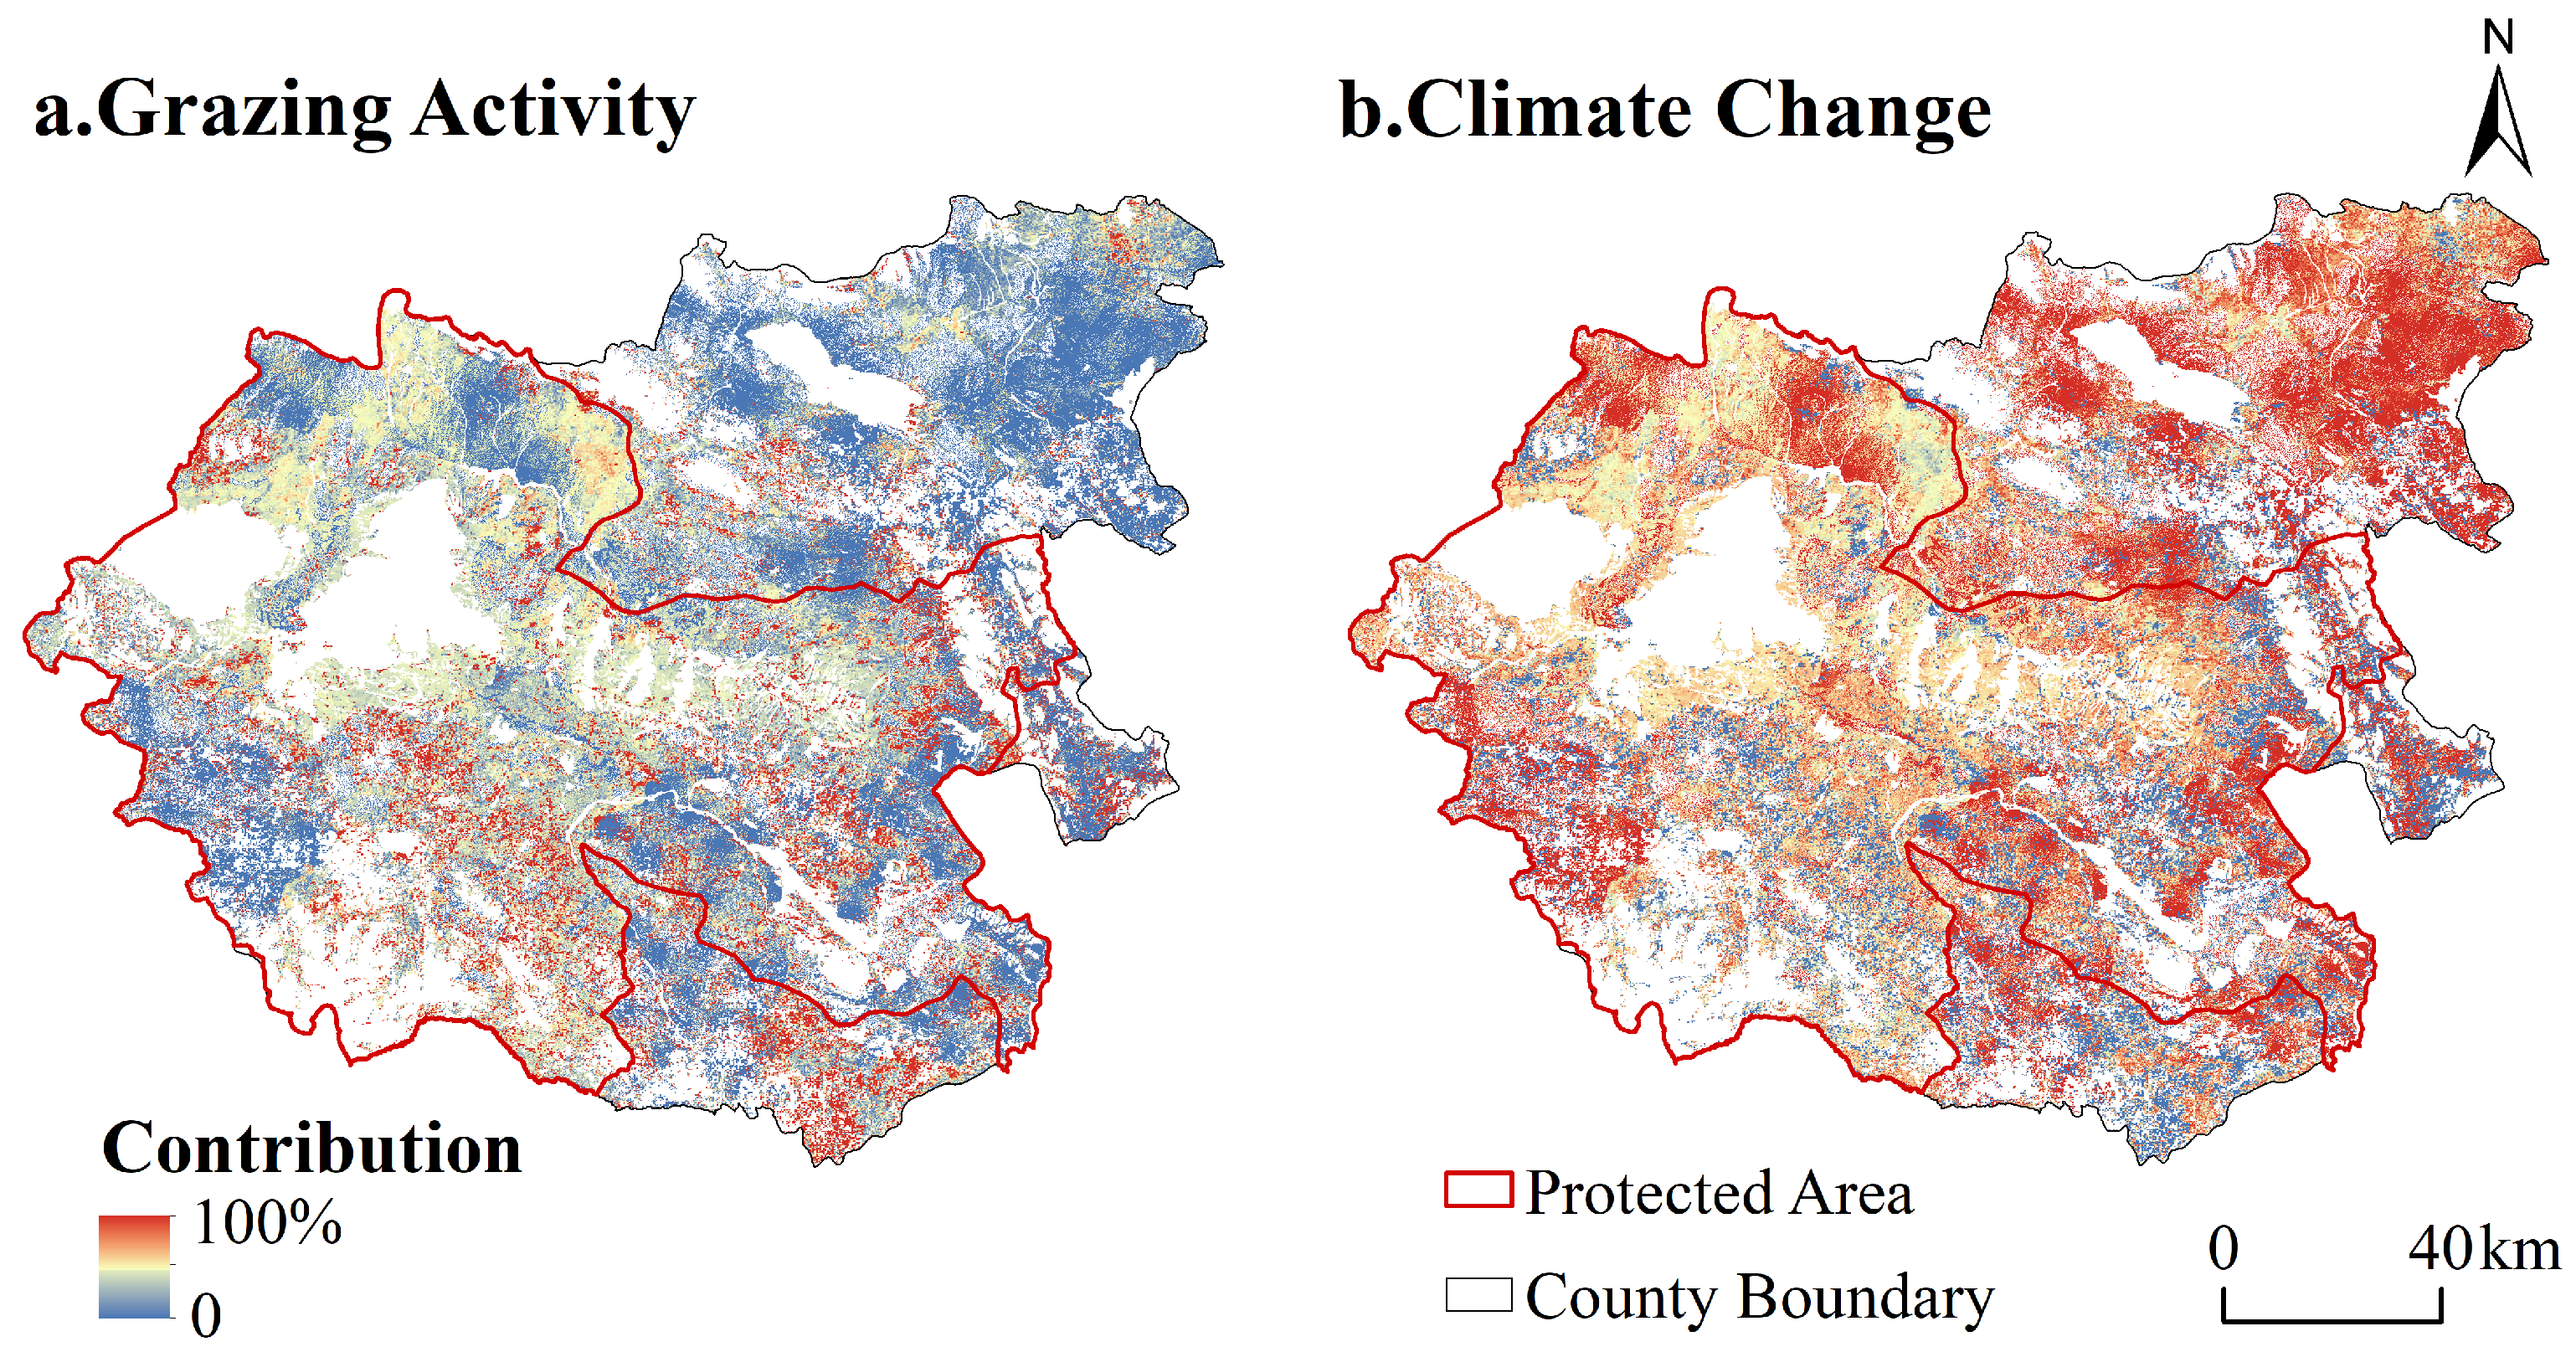
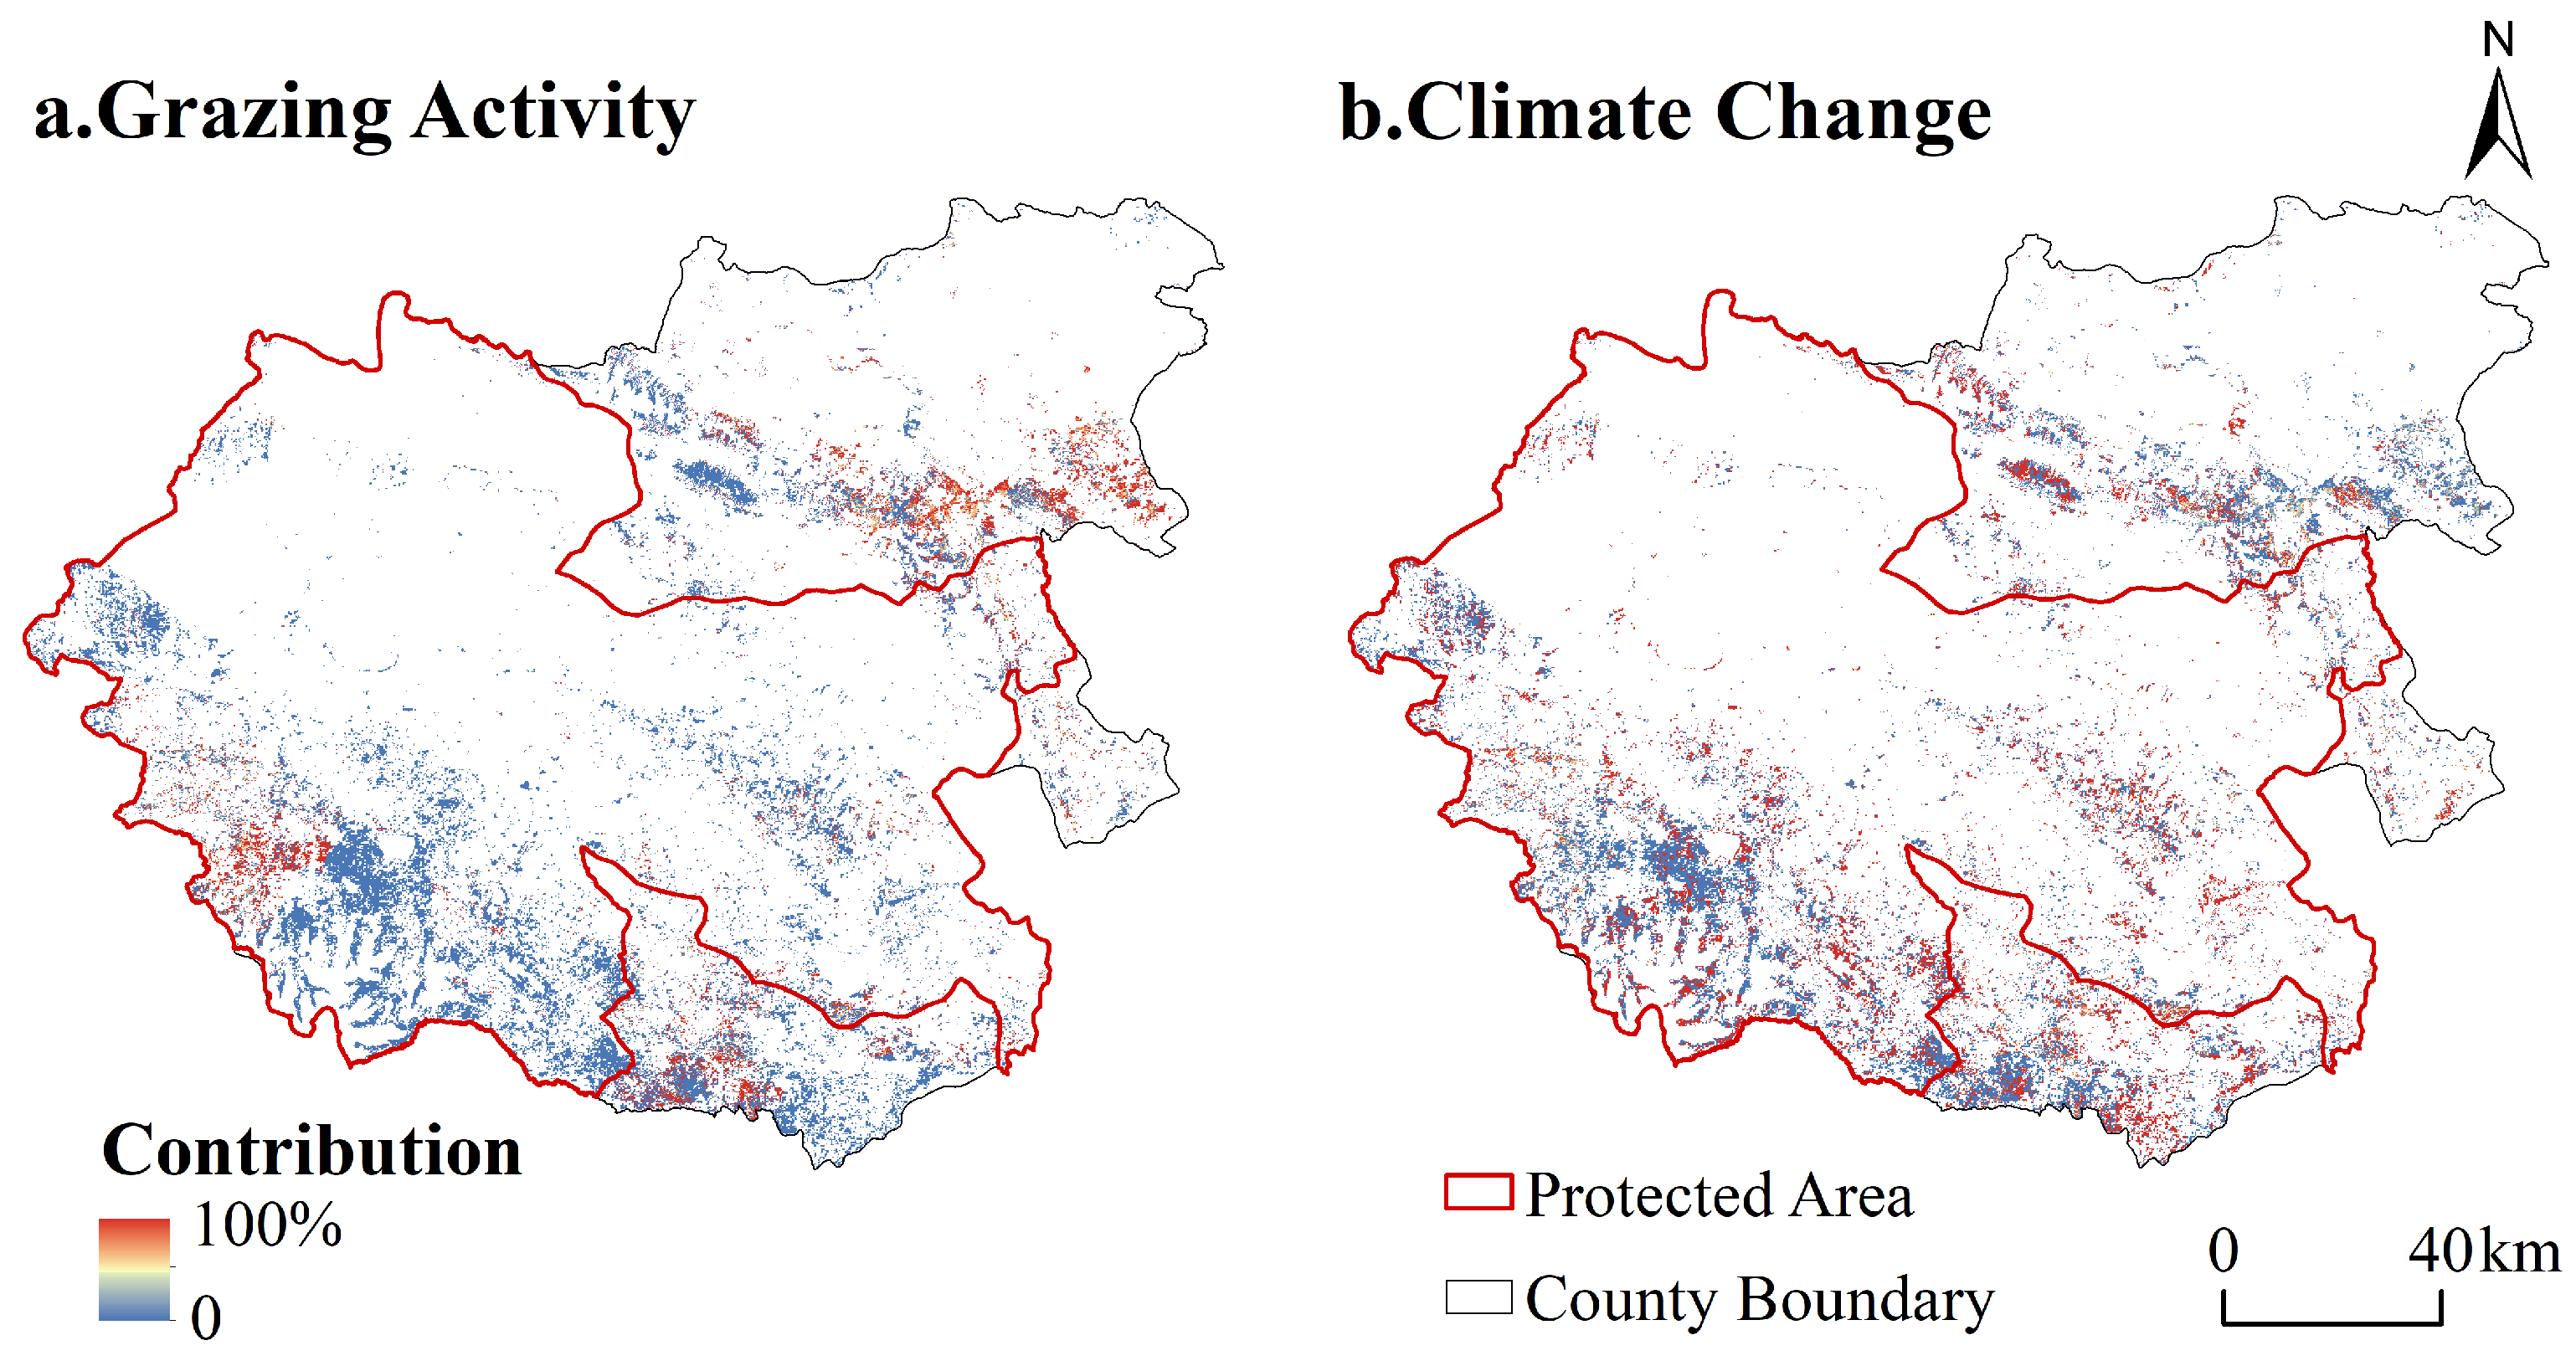
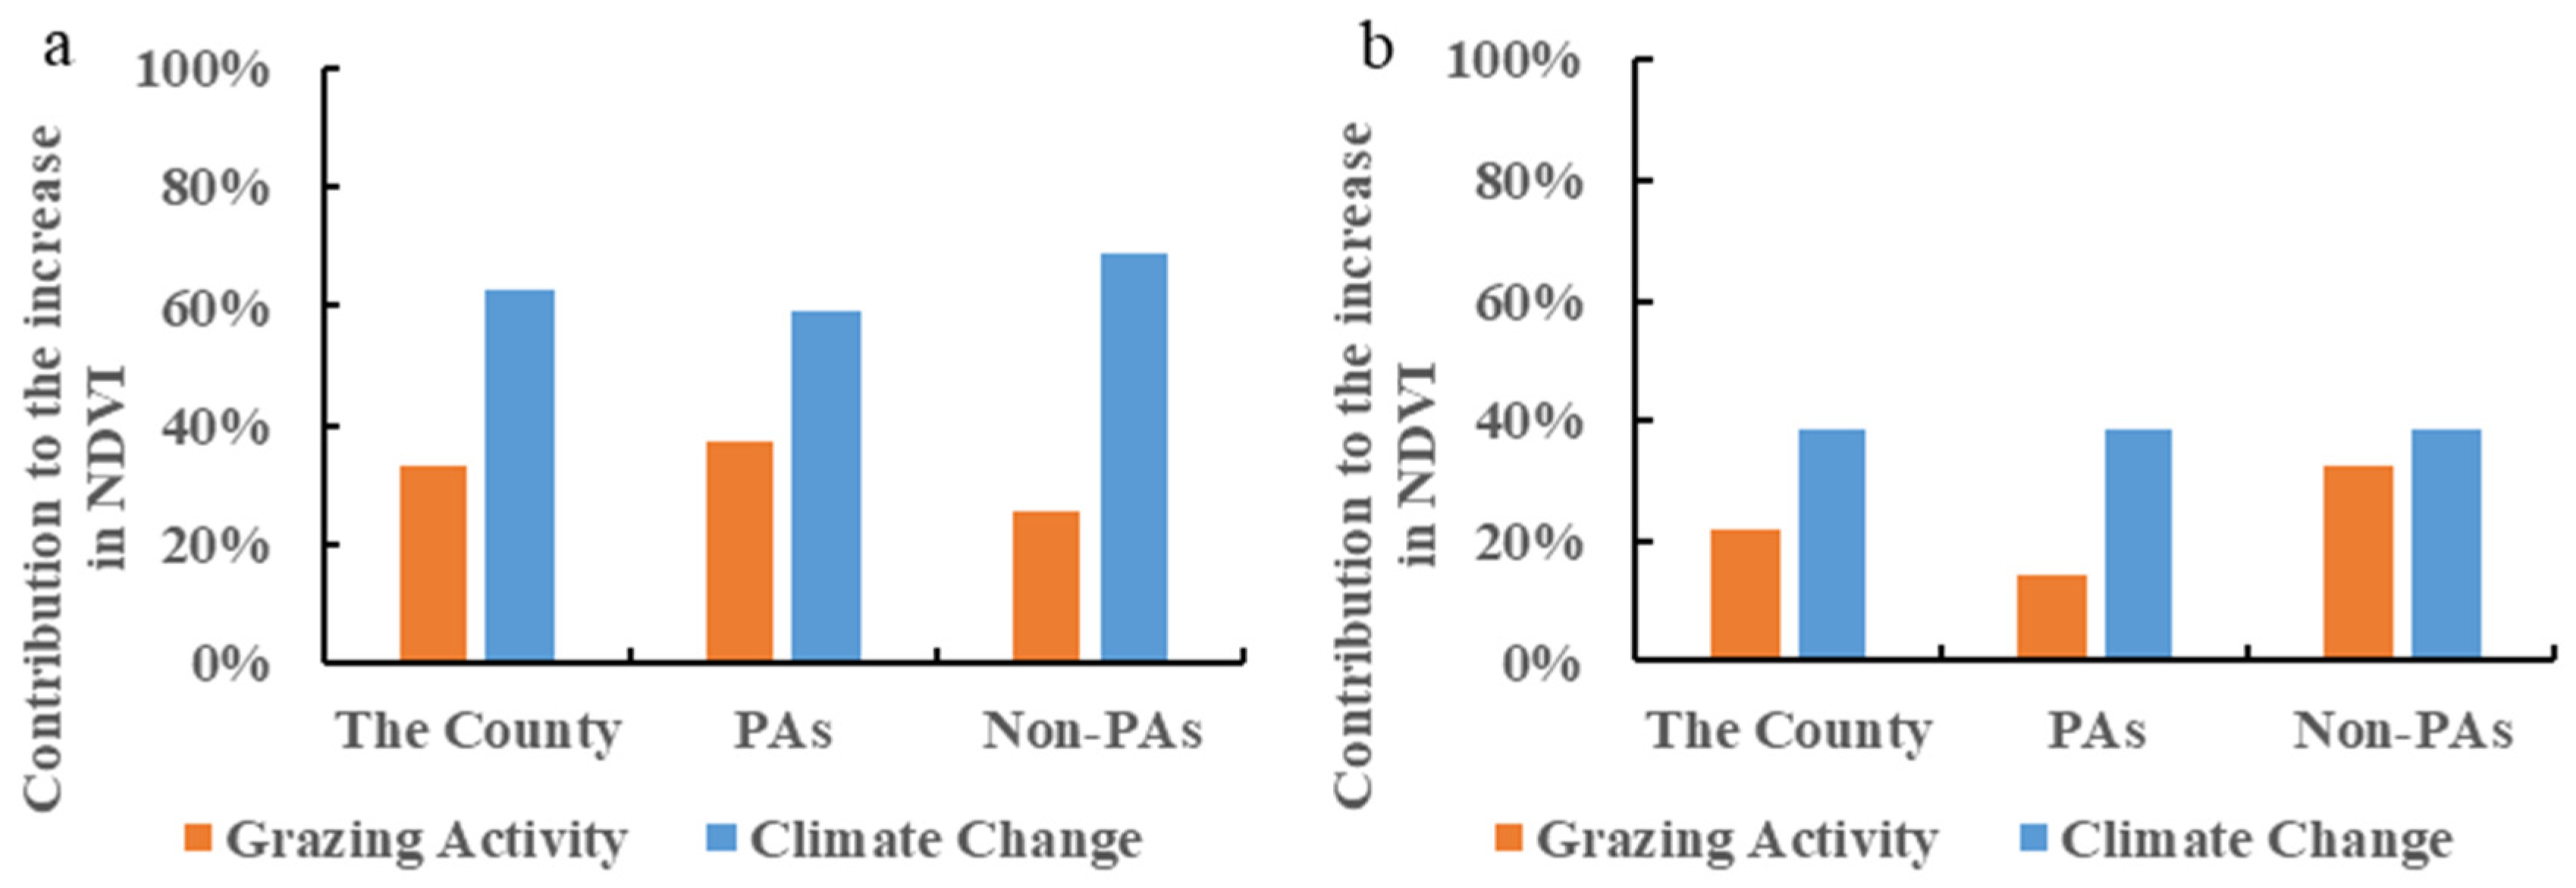
3.4. Contributions of Grazing Activity and Climate Change to Vegetation Changes

The contributions of grazing activity and climate change to vegetation changes in grasslands (Figure 7, Figure 8 and Figure 9) were quantified. The contribution of climate change to vegetation greening (63%) was higher than that of grazing activity (33%) (Figure 9a), especially in northern grasslands where vegetation cover increased significantly (Figure 7b). The contribution of climate change to vegetation browning (39%) was also higher than that of grazing activity (22%). (Figure 8b). Thus, vegetation changes in Madoi County were mainly driven by climate change.
The contribution of grazing activity to vegetation greening in PAs (38%) is higher than that in non-PAs (26%). The contribution of grazing activity to vegetation browning in PAs (14%) was lower than that in non-PAs (32%) (Figure 8a and Figure 9b). In addition, grazing intensity decreased more in PAs than in non-PAs. Therefore, reducing grazing intensity can not only increase the contribution of grazing activity to vegetation greening but also reduce the contribution of grazing activity to vegetation browning. It seems feasible to improve the role of grazing activity in vegetation changes and promote the increase in vegetation cover by reducing grazing intensity.

4. Discussion

4.1. Advantages of Assessing Grazing Intensity Based on Conservation Measures

This study assessed grazing intensity in the Yellow River source region by assigning township-scale livestock census data to grids within areas where grazing is permitted under the management of conservation measures. Livestock were not allocated in areas where grazing was not permitted. For example, zero livestock were assigned to the core zones of PAs because grazing was completely prohibited in the core zones. Similarly, livestock were also not allocated to grazing-prohibited areas in the buffer, experimental zones, and non-PAs. The allocation of livestock in combination with management measures for grazing activity in functional zones avoids the overestimation of grazing intensity ingrazing-prohibited areas and the underestimation of grazing intensity in grazing-permitted areas [48,49]. Moreover, the number of livestock allocated to a grid depended on the probability of the grid being grazed. Altitude, slope, aspect, vegetation cover, distance from settlements, roads, and rivers were all influencing factors of grazing probability. Calculating grazing probability did not rely on mathematical models, such as the random forest model [49], but on the livestock activity patterns observed by grazing tracking experiments, which are more consistent with real grazing characteristics than mathematical models [19]. Therefore, the method of grazing intensity assessment used in this study is credible and reasonable.
In addition, based on the grazing intensity assessment, the efficiency of functional zoning in reducing grazing intensity was tested, providing a means to evaluate whether the objectives of functional zoning were achieved. The results showed that grazing intensity decreased the most in the core zones, followed by the buffer zones, and the least in the experimental zones. Indeed, the management of grazing activity has become increasingly strict from the experimental zones to the buffer zones and then to the core zones. The primary goal of the core zones is ecological conservation, and grazing was completely prohibited in the core zones. The experimental zones are designated to maintain human development, and grazing was allowed in the experimental zones. Buffer zones, which are usually located between core and experimental zones, aim to reduce the impact of human activities in the experimental zones on the core zones. Thus, functional zoning not only allowed residents in PAs to sustain their livelihoods through grazing but also achieve the goal of reducing grazing pressure on grasslands. Moreover, functional zoning proved to be successful in protecting biodiversity. The number of giant pandas in the core zones of PAs in Sichuan Province, China, was significantly higher than in the buffer and experimental zones [14].

4.2. Effectiveness of Conservation Measures in Regulating Grazing Intensity

A variety of conservation measures have been taken to mitigate the intensity of human activities, particularly grazing. Our research found that the establishment of PAs was effective in reducing grazing intensity. Grazing intensity decreased more inside of PAs than outside of PAs in Madoi County. Grazing intensity inside of PAs was lower than outside of PAs from 2000 to 2019. The findings were similar to previous studies. Hua et al. [50] found that the human footprint was 60% lower inside of PAs than outside of PAs, despite a continued increase in the human footprint on the Tibetan Plateau after 2000. The increase in human pressure in PAs globally was also smaller than in non-PAs [51].
Several factors may explain the good performance of PAs. For example, PAs tend to be in areas that are less likely to conflict with other land uses and therefore have less human pressure [52]. In addition, the allocation of political, financial, and human resources to PAs ensures the smooth implementation of conservation measures aimed at regulating human activities [53,54]. In the Yellow River source region, for example, herders were compensated financially when they asked to either cease grazing or reduce livestock numbers in their grasslands [55,56,57]. The establishment of the Yellow River Source National Park further exemplified such efforts, with an ecological protection team formed to manage waste, maintain infrastructure, and enforce regulations against illegal activities, such as grazing in restricted zones and poaching. To date, more than 17,200 individuals have joined the ecological protection team [58]. Politically, the creation of a new department, the Yellow River Source National Park Administration, has addressed the problem that ecological protection efforts were fragmented across various departments and lacked a unified focus.
However, grazing intensity in certain areas outside of PAs has shown an upward trend. The shift may be due to the displacement of grazing pressures from PAs to adjacent lands, as herders seek alternative grazing areas for their livestock. From a vegetation dynamics perspective, vegetation cover has largely continued to increase despite the rise in grazing intensity. This suggests that the current grazing levels may still be within the grassland’s carrying capacity. In addition, field surveys revealed that livestock were supplemented with hay or feed, which helped mitigate grazing pressure to some extent. However, if grazing intensity exceeds this threshold, it could compromise ecosystem stability and lead to grassland degradation [59]. Therefore, monitoring grazing intensity changes outside of PAs is also essential, and active adjustment measures should be taken to avoid grassland degradation caused by increased grazing intensity.

4.3. Optimized Management for Grazing Intensity

Grazing prohibition, eliminating grazing activity from the grassland, is considered one of the most stringent conservation measures. Recent studies have confirmed the positive effects of grazing prohibition in grassland conservation. For example, grazing prohibition has greatly enhanced vegetation biomass and improved soil conditions, including increases in soil carbon and nitrogen content, on the northern Tibetan Plateau [60]. In addition, grazing prohibition has led to notable increases in plant coverage and species richness [61]. However, the positive impact of grazing prohibition only applies to the grasslands where grazing is prohibited. The grasslands that are still grazed after grazing prohibition may face greater grazing pressure than before. The present study found that the average grazing intensity in grazing-permitted areas in Madoi County increased by 63.21%. A similar phenomenon was also observed in northern Tibet, where the overgrazing rate rose sharply from 27.41% before grazing prohibition to 83.02% after its implementation [62].
To understand the factors contributing to the increased grazing intensity in grazing-permitted areas following grazing prohibition, we analyzed changes in grazing area and livestock numbers (Figure 10). Although both grazing area and livestock numbers in Madoi County decreased, the reduction in grazing area (65%) was greater than that in livestock numbers (40%) (Figure 10). The difference led to a higher grazing intensity in grazing-permitted areas. Therefore, after grazing prohibition, the number of livestock also needs to be reduced promptly, and the reduction ratio could be similar to or even lower than the reduction ratio of the grazing area caused by grazing prohibition.
Restricting grazing activity, such as grazing prohibition or livestock reduction, is considered an effective strategy for restoring degraded grasslands [63]. However, the positive effects of grazing prohibition on vegetation growth may be limited to the initial years. Jing et al. [64] found that after 15 years of grazing prohibition, both plant productivity and species richness generally declined. Moreover, prolonged grazing exclusion may not yield additional ecological or economic benefits. Therefore, reducing grazing intensity rather than grazing prohibition is considered a more sustainable approach to grassland restoration [65].
In addition to domestic livestock, grassland vegetation is also influenced by wild herbivores. With strengthened conservation efforts in the Yellow River source region, populations of wild herbivores have increased significantly. The ratio of large wild herbivores in sheep units to livestock in sheep units in Madoi County was 1:4.5 [66]. Therefore, when implementing grass–livestock balance management, the impact of wild herbivores should also be considered and incorporated into stocking pressure assessments.

4.4. Impact of Grazing Activity and Climate Change on Vegetation Changes

Our study revealed that the grassland vegetation cover reflected by NDVI in the Yellow River source region presented an overall increasing trend. Even when other vegetation indicators, such as the enhanced vegetation index (EVI), were used to detect grassland cover changes, the majority of grasslands in the region still exhibited an upward trend in vegetation cover [67]. Climate change was the predominant driver of the increase in vegetation cover [68]. The results of this study showed that the contribution of climate change to the increase in vegetation cover surpassed that of grazing activity. Both temperature and precipitation have been rising in the Yellow River source region, which has facilitated vegetation growth [24,69]. Rising temperatures may reduce snow thickness and advance snowmelt on grasslands, thereby extending the vegetation growing season [70]. Previous studies have shown that climate warming enhances photosynthesis in high-altitude areas and drives the upward expansion of vegetation belts [71]. In addition, alpine grasslands on the Tibetan Plateau exhibited higher sensitivity to precipitation than other vegetation types [72]. The increase in precipitation may offset some of the negative effects of elevated evapotranspiration. It also increases the water availability during the vegetation greening period, ultimately promoting plant growth [73].
Grazing was identified as the primary cause of grassland degradation in the Yellow River source region during the 1990s [33]. However, our study suggests a shift in this dynamic. After 2000, areas with reduced vegetation cover only accounted for 14.12% of the total grassland area. In addition, the influence of grazing activity on the decline in vegetation cover is now less significant than that of climate change. The shift could be attributed to the success of conservation measures. Zhang et al. found a reduction in grazing pressure and increased grass yield following the ecological implementation of the ecological protection program in the Three-River-Source region [74]. Reducing grazing intensity may mitigate soil compaction caused by livestock trampling, increasing soil permeability and facilitating root development. It also enhances plant litter decomposition, increasing soil nitrogen and phosphorus availability, which supports plant growth [75]. In addition, heavy grazing significantly decreased the plant richness [76]. As grazing intensity increases, toxic or trample-resistant plants, such as Leguminosae and Plantaginaceae, tend to proliferate [77]. Lowering grazing intensity could increase the seed germination rate or plant community richness [78]. It also promotes the rapid recovery of palatable species, such as Gramineae [79], supporting the long-term sustainability of grassland ecosystems. Our study further underscores the effectiveness of conservation measures in mitigating grazing intensity and fostering positive changes in vegetation cover.

4.5. Uncertainty

There are some limitations in our study. Our assessment of grazing intensity was based on the strict enforcement of conservation measures, so livestock numbers were considered zero in grazing-prohibited areas. However, illegal grazing may also exist in PAs, which will affect the judgment of the effectiveness of PAs in reducing grazing intensity, resulting in the inability to adjust management measures promptly and even leading to grassland degradation. In addition, the location of the grazing-prohibited areas in the buffer zone, experimental zone, and non-PAs in this study was determined by adjusting the grazing radius around settlements, which may affect the accuracy of the grazing intensity. To improve precision, comprehensive and high-resolution spatial data are essential, which improve the ability to monitor grazing intensity dynamics and facilitate the timely identification of areas requiring management adjustments. Moreover, our study relied solely on the grazing intensity assessment method proposed by Hu et al. While the approach provided valuable insights, alternative methods—such as support vector (SV) regression, Random Forests (RFs), and Extra-Tree Regression (ET)—are also capable of gridding livestock distribution [49,80]. However, these alternative methods determine the number of livestock on each grid based on mathematical calculations rather than grazing characteristics reflected by grazing trajectories used in our study. Consequently, we did not compare results across these different methods.

5. Conclusions

We assessed the effectiveness of conservation measures in reducing grazing intensity and improving the role of grazing activity on vegetation changes based on mapping grazing intensity and quantifying the contribution of climate change and grazing activity on vegetation changes. The results showed that the establishment of PAs in the Yellow River source region effectively reduced grazing intensity. The average grazing intensity within PAs (0.23 sheep units/ha) decreased more than that in non-PAs (0.07 sheep units/ha). Among the functional zones within PAs, the core zones where grazing is completely prohibited have seen the largest reduction in grazing intensity (0.36 sheep units/hectare). The buffer and experimental zones have seen a smaller reduction in grazing intensity than the core zones, but still more than non-PAs. However, in some areas of the Yellow River source region, particularly in non-PAs, grazing intensity increased. The trend may be attributed to the displacement of grazing pressure from grazing-prohibited areas to regions where grazing is still permitted. The findings suggest that when implementing grazing prohibition, it is essential to reduce livestock numbers in proportion to the extent of the grazing area to ensure the desired outcomes.
In addition, the reduction in grazing intensity was found to enhance the positive role of grazing activity in vegetation changes. The contribution of grazing activity to the increase in vegetation cover in PAs was 12% higher than that outside of PAs. The contribution of grazing activity to the decrease in vegetation cover in PAs was 18% lower than that outside of PAs. Thus, the positive effect of grazing activity on vegetation changes in PAs is higher than that in non-PAs, while the negative effect in PAs is lower than that in non-PAs.

Author Contributions

Z.W. and X.H.: Conceptualization, Methodology, Investigation. X.H.: Software, Data Curation, Writing—Original Draft. Y.Z.: Resources, Funding Acquisition, Supervision, Project Administration. D.G.: Investigation, Methodology, Data Curation. L.L. and K.L.: Writing—Review and Editing. All authors have read and agreed to the published version of the manuscript.

Funding

This work was financed by the Second Tibetan Plateau Scientific Expedition and Research Program (Grant No. 2019QZKK0603), and the National Natural Science Foundation of China (Grant No. 41861134038).

Data Availability Statement

The original contributions presented in the study are included in the article, further inquiries can be directed to the corresponding author.

Conflicts of Interest

The authors declare no conflicts of interest.

References

  1. Williams, B.A.; Venter, O.; Allan, J.R.; Atkinson, S.C.; Rehbein, J.A.; Ward, M.; Di Marco, M.; Grantham, H.S.; Ervin, J.; Goetz, S.J. Change in terrestrial human footprint drives continued loss of intact ecosystems. One Earth 2020, 3, 371–382. [Google Scholar] [CrossRef]
  2. MacDougall, A.S.; McCann, K.S.; Gellner, G.; Turkington, R. Diversity loss with persistent human disturbance increases vulnerability to ecosystem collapse. Nature 2013, 494, 86–89. [Google Scholar] [CrossRef]
  3. Johnson, C.N.; Balmford, A.; Brook, B.W.; Buettel, J.C.; Galetti, M.; Guangchun, L.; Wilmshurst, J.M. Biodiversity losses and conservation responses in the Anthropocene. Science 2017, 356, 270–275. [Google Scholar] [CrossRef]
  4. Adla, K.; Dejan, K.; Neira, D.; Dragana, Š. Degradation of ecosystems and loss of ecosystem services. In One Health; Elsevier: Amsterdam, The Netherlands, 2022; pp. 281–327. [Google Scholar]
  5. Watson, J.E.; Dudley, N.; Segan, D.B.; Hockings, M. The performance and potential of protected areas. Nature 2014, 515, 67–73. [Google Scholar] [CrossRef]
  6. Hou, L.; Xia, F.; Chen, Q.; Huang, J.; He, Y.; Rose, N.; Rozelle, S. Grassland ecological compensation policy in China improves grassland quality and increases herders’ income. Nat. Commun. 2021, 12, 4683. [Google Scholar] [CrossRef]
  7. Li, W.; Wang, W.; Chen, J.; Zhang, Z. Assessing effects of the Returning Farmland to Forest Program on vegetation cover changes at multiple spatial scales: The case of northwest Yunnan, China. J. Environ. Manag. 2022, 304, 114303. [Google Scholar] [CrossRef]
  8. Rahman, M.F.; Islam, K. Effectiveness of protected areas in reducing deforestation and forest fragmentation in Bangladesh. J. Environ. Manag. 2021, 280, 111711. [Google Scholar] [CrossRef]
  9. Meng, Z.; Dong, J.; Ellis, E.C.; Metternicht, G.; Qin, Y.; Song, X.-P.; Löfqvist, S.; Garrett, R.D.; Jia, X.; Xiao, X. Post-2020 biodiversity framework challenged by cropland expansion in protected areas. Nat. Sustain. 2023, 6, 758–768. [Google Scholar] [CrossRef]
  10. De La Fuente, B.; Bertzky, B.; Delli, G.; Mandrici, A.; Conti, M.; Florczyk, A.J.; Freire, S.; Schiavina, M.; Bastin, L.; Dubois, G. Built-up areas within and around protected areas: Global patterns and 40-year trends. Glob. Ecol. Conserv. 2020, 24, e01291. [Google Scholar] [CrossRef]
  11. Ghoddousi, A.; Pratzer, M.; Lewinska, K.E.; Eggers, J.; Bleyhl, B.; Ambarli, H.; Arakelyan, M.; Askerov, E.; Butsic, V.; Ghazaryan, A. Effectiveness of protected areas in the Caucasus Mountains in preventing rangeland degradation. Conserv. Biol. 2024, e14415. [Google Scholar] [CrossRef]
  12. Zhou, J.; Niu, J.; Wu, N.; Lu, T. Annual high-resolution grazing-intensity maps on the Qinghai–Tibet Plateau from 1990 to 2020. Earth Syst. Sci. Data 2024, 16, 5171–5189. [Google Scholar] [CrossRef]
  13. Wang, D.; Peng, Q.; Li, X.; Zhang, W.; Xia, X.; Qin, Z.; Ren, P.; Liang, S.; Yuan, W. A long-term high-resolution dataset of grasslands grazing intensity in China. Sci. Data 2024, 11, 1194. [Google Scholar] [CrossRef]
  14. Zhuang, H.; Xia, W.; Zhang, C.; Yang, L.; Wanghe, K.; Chen, J.; Luan, X.; Wang, W. Functional zoning of China’s protected area needs to be optimized for protecting giant panda. Global Ecol. Conserv. 2021, 25, e01392. [Google Scholar] [CrossRef]
  15. Qi, W.; Hu, Y.; Linsheng, Z.; Hui, W. Optimising the relationship between ecological protection and human development through functional zoning. Biol. Conserv. 2023, 281, 110001. [Google Scholar] [CrossRef]
  16. Wei, D.; Feng, A.; Huang, J. Analysis of ecological protection effect based on functional zoning and spatial management and control. Int. J. Geoheritage Parks 2020, 8, 166–172. [Google Scholar] [CrossRef]
  17. Xu, W.; Li, X.; Pimm, S.L.; Hull, V.; Zhang, J.; Zhang, L.; Xiao, Y.; Zheng, H.; Ouyang, Z. The effectiveness of the zoning of China’s protected areas. Biol. Conserv. 2016, 204, 231–236. [Google Scholar] [CrossRef]
  18. Liu, F.; Feng, C.; Zhou, Y.; Zhang, L.; Du, J.; Huang, W.; Luo, J.; Wang, W. Effectiveness of functional zones in National Nature Reserves for the protection of forest ecosystems in China. J. Environ. Manag. 2022, 308, 114593. [Google Scholar] [CrossRef]
  19. Hu, X.; Wang, Z.; Zhang, Y.; Gong, D. Spatialization method of grazing intensity and its application in Tibetan Plateau. Acta Geogr. Sin. 2022, 77, 547–558. [Google Scholar] [CrossRef]
  20. Cai, H.; Yang, X.; Xu, X. Human-induced grassland degradation/restoration in the central Tibetan Plateau: The effects of ecological protection and restoration projects. Ecol. Eng. 2015, 83, 112–119. [Google Scholar] [CrossRef]
  21. Ning, X.; Zhu, N.; Liu, Y.; Wang, H. Quantifying impacts of climate and human activities on the grassland in the Three-River Headwater Region after two phases of Ecological Project. Geogr. Sustain. 2022, 3, 164–176. [Google Scholar] [CrossRef]
  22. Li, X.L.; Gao, J.; Brierley, G.; Qiao, Y.M.; Zhang, J.; Yang, Y.W. Rangeland degradation on the Qinghai-Tibet plateau: Implications for rehabilitation. Land Degrad. Dev. 2013, 24, 72–80. [Google Scholar] [CrossRef]
  23. Zhang, Y.; Zhang, C.; Wang, Z.; Chen, Y.; Gang, C.; An, R.; Li, J. Vegetation dynamics and its driving forces from climate change and human activities in the Three-River Source Region, China from 1982 to 2012. Sci. Total Environ. 2016, 563, 210–220. [Google Scholar] [CrossRef]
  24. Huang, K.; Zhang, Y.; Zhu, J.; Liu, Y.; Zu, J.; Zhang, J. The influences of climate change and human activities on vegetation dynamics in the Qinghai-Tibet Plateau. Remote Sens. 2016, 8, 876. [Google Scholar] [CrossRef]
  25. Wei, D.; Zhao, H.; Zhang, J.; Qi, Y.; Wang, X. Human activities alter response of alpine grasslands on Tibetan Plateau to climate change. J. Environ. Manag. 2020, 262, 110335. [Google Scholar] [CrossRef]
  26. Peng, Q.; Wang, R.; Jiang, Y.; Li, C. Contributions of climate change and human activities to vegetation dynamics in Qilian Mountain National Park, northwest China. Glob. Ecol. Conserv. 2021, 32, e01947. [Google Scholar] [CrossRef]
  27. Jiang, L.; Bao, A.; Guo, H.; Ndayisaba, F. Vegetation dynamics and responses to climate change and human activities in Central Asia. Sci. Total Environ. 2017, 599, 967–980. [Google Scholar] [CrossRef]
  28. Wang, Z.; Dong, C.; Dai, L.; Wang, R.; Liang, Q.; He, L.; Wei, D. Spatiotemporal evolution and attribution analysis of grassland NPP in the Yellow River source region, China. Ecol. Inf. 2023, 76, 102135. [Google Scholar] [CrossRef]
  29. Beck, J.J.; Hernández, D.L.; Pasari, J.R.; Zavaleta, E.S. Grazing maintains native plant diversity and promotes community stability in an annual grassland. Ecol. Appl. 2015, 25, 1259–1270. [Google Scholar] [CrossRef]
  30. Guo, Y.; Chen, Y. A review of the impact of grazing on grassland ecosystems: Research progress and prospects. Adv. Resour. Res. 2024, 4, 455–473. [Google Scholar] [CrossRef]
  31. Hao, L.; Pan, C.; Fang, D.; Zhang, X.; Zhou, D.; Liu, P.; Liu, Y.; Sun, G. Quantifying the effects of overgrazing on mountainous watershed vegetation dynamics under a changing climate. Sci. Total Environ. 2018, 639, 1408–1420. [Google Scholar] [CrossRef]
  32. Zhu, Q.; Chen, H.; Peng, C.; Liu, J.; Piao, S.; He, J.-S.; Wang, S.; Zhao, X.; Zhang, J.; Fang, X. An early warning signal for grassland degradation on the Qinghai-Tibetan Plateau. Nat. Commun. 2023, 14, 6406. [Google Scholar] [CrossRef] [PubMed]
  33. Bai, W.; Zhang, Y.; Xie, G.; Shen, Z. Analysis of formation causes of grassland degradation in Maduo County in the source region of Yellow River. J. Appl. Ecol. 2002, 13, 823–826. [Google Scholar]
  34. Wang, Y.; Lv, W.; Xue, K.; Wang, S.; Zhang, L.; Hu, R.; Zeng, H.; Xu, X.; Li, Y.; Jiang, L. Grassland changes and adaptive management on the Qinghai–Tibetan Plateau. Nat. Rev. Earth Environ. 2022, 3, 668–683. [Google Scholar] [CrossRef]
  35. Gu, C.; Liu, L.; Zhang, Y.; Wei, B.; Cui, B.; Gong, D. Understanding the spatial heterogeneity of grazing pressure in the Three-River-Source Region on the Tibetan Plateau. J. Geogr. Sci. 2023, 33, 1660–1680. [Google Scholar] [CrossRef]
  36. Yang, F.; Shao, Q.; Guo, X.; Tang, Y.; Li, Y.; Wang, D.; Wang, Y.; Fan, J. Effect of large wild herbivore populations on the forage-livestock balance in the source region of the Yellow River. Sustainability 2018, 10, 340. [Google Scholar] [CrossRef]
  37. Ma, Q.; Jin, H.-J.; Wu, Q.-B.; Yurova, A.; Liang, S.-H.; Șerban, R.D.; Lan, Y.-C. Changes in hydrological processes in the headwater area of Yellow River, China during 1956–2019 under the influences of climate change, permafrost thaw and dam. Adv. Clim. Change Res. 2023, 14, 237–247. [Google Scholar] [CrossRef]
  38. Bao, S.; Yang, F. Identification of Potential Habitats and Adjustment of Protected Area Boundaries for Large Wild Herbivores in the Yellow-River-Source National Park, China. Land 2024, 13, 186. [Google Scholar] [CrossRef]
  39. Tucker, C.; Newcomb, W.; Dregne, H. AVHRR data sets for determination of desert spatial extent. Int. J. Remote Sens. 1994, 15, 3547–3565. [Google Scholar] [CrossRef]
  40. Mao, D.; Wang, Z.; Luo, L.; Ren, C. Integrating AVHRR and MODIS data to monitor NDVI changes and their relationships with climatic parameters in Northeast China. Int. J. Appl. Earth Obs. Geoinf. 2012, 18, 528–536. [Google Scholar] [CrossRef]
  41. Chang, J.; Liu, Q.; Wang, S.; Huang, C. Vegetation dynamics and their influencing factors in China from 1998 to 2019. Remote Sens. 2022, 14, 3390. [Google Scholar] [CrossRef]
  42. Pan, N.; Feng, X.; Fu, B.; Wang, S.; Ji, F.; Pan, S. Increasing global vegetation browning hidden in overall vegetation greening: Insights from time-varying trends. Remote Sens. Environ. 2018, 214, 59–72. [Google Scholar] [CrossRef]
  43. Zhou, X.; Yamaguchi, Y.; Arjasakusuma, S. Distinguishing the vegetation dynamics induced by anthropogenic factors using vegetation optical depth and AVHRR NDVI: A cross-border study on the Mongolian Plateau. Sci. Total Environ. 2018, 616, 730–743. [Google Scholar] [CrossRef] [PubMed]
  44. Yan, Y.; Liu, X.; Wen, Y.; Ou, J. Quantitative analysis of the contributions of climatic and human factors to grassland productivity in northern China. Ecol. Indic. 2019, 103, 542–553. [Google Scholar] [CrossRef]
  45. Yang, H.; Yang, D. Climatic factors influencing changing pan evaporation across China from 1961 to 2001. J. Hydrol. 2012, 414, 184–193. [Google Scholar] [CrossRef]
  46. Roderick, M.L.; Rotstayn, L.D.; Farquhar, G.D.; Hobbins, M.T. On the attribution of changing pan evaporation. Geophys. Res. Lett. 2007, 34, L17403. [Google Scholar] [CrossRef]
  47. Zhang, M.; Lin, H.; Long, X.; Cai, Y. Analyzing the spatiotemporal pattern and driving factors of wetland vegetation changes using 2000-2019 time-series Landsat data. Sci. Total Environ. 2021, 780, 146615. [Google Scholar] [CrossRef]
  48. Yang, Z.; Gong, J.; Li, X.; Wang, Y.; Wang, Y.; Kan, G.; Shi, J. Gridded Grazing Intensity Based on Geographically Weighted Random Forest and Its Drivers: A Case Study of Western Qinghai–Tibetan Plateau. Land Degrad. Dev. 2024, 35, 5295–5307. [Google Scholar] [CrossRef]
  49. Li, X.; Hou, J.; Huang, C. High-resolution gridded livestock projection for western China based on machine learning. Remote Sens. 2021, 13, 5038. [Google Scholar] [CrossRef]
  50. Hua, T.; Zhao, W.; Cherubini, F.; Hu, X.; Pereira, P. Effectiveness of protected areas edges on vegetation greenness, cover and productivity on the Tibetan Plateau, China. Landsc. Urban Plan. 2022, 224, 104421. [Google Scholar] [CrossRef]
  51. Geldmann, J.; Manica, A.; Burgess, N.D.; Coad, L.; Balmford, A. A global-level assessment of the effectiveness of protected areas at resisting anthropogenic pressures. Proc. Natl. Acad. Sci. USA 2019, 116, 23209–23215. [Google Scholar] [CrossRef]
  52. Joppa, L.N.; Pfaff, A. High and far: Biases in the location of protected areas. PLoS ONE 2009, 4, e8273. [Google Scholar] [CrossRef] [PubMed]
  53. Oldekop, J.A.; Holmes, G.; Harris, W.E.; Evans, K.L. A global assessment of the social and conservation outcomes of protected areas. Conserv. Biol. 2016, 30, 133–141. [Google Scholar] [CrossRef] [PubMed]
  54. He, P.; Gao, J.; Zhang, W.; Rao, S.; Zou, C.; Du, J.; Liu, W. China integrating conservation areas into red lines for stricter and unified management. Land Use Policy 2018, 71, 245–248. [Google Scholar] [CrossRef]
  55. Zhai, X.; Liang, X.; Yan, C.; Xing, X.; Jia, H.; Wei, X.; Feng, K. Vegetation dynamic changes and their response to ecological engineering in the Sanjiangyuan Region of China. Remote Sens. 2020, 12, 4035. [Google Scholar] [CrossRef]
  56. Yu, H.; Liu, B.-t.; Wang, G.-x.; Zhang, T.-z.; Yang, Y.; Lu, Y.-q.; Xu, Y.-x.; Huang, M.; Yang, Y.; Zhang, L. Grass-livestock balance based grassland ecological carrying capability and sustainable strategy in the Yellow River Source National Park, Tibet Plateau, China. J. Mt. Sci. 2021, 18, 2201–2211. [Google Scholar] [CrossRef]
  57. Qian, Q.; Wang, J.; Zhang, X.; Wang, S.; Li, Y.; Wang, Q.; Watson, A.E.; Zhao, X. Improving herders’ income through alpine grassland husbandry on Qinghai-Tibetan Plateau. Land Use Policy 2022, 113, 105896. [Google Scholar] [CrossRef]
  58. Ma, T.; Swallow, B.; Foggin, J.M.; Zhong, L.; Sang, W. Co-management for sustainable development and conservation in Sanjiangyuan National Park and the surrounding Tibetan nomadic pastoralist areas. Humanit. Soc. Sci. Commun. 2023, 10, 321. [Google Scholar] [CrossRef]
  59. Meng, Z.; Dong, J.; Zhai, J.; Huang, L.; Liu, M.; Ellis, E.C. Effectiveness in protected areas at resisting development pressures in China. Appl. Geogr. 2022, 141, 102682. [Google Scholar] [CrossRef]
  60. Dai, L.; Fu, R.; Guo, X.; Du, Y.; Lin, L.; Zhang, F.; Li, Y.; Cao, G. Long-term grazing exclusion greatly improve carbon and nitrogen store in an alpine meadow on the northern Qinghai-Tibet Plateau. Catena 2021, 197, 104955. [Google Scholar] [CrossRef]
  61. Liu, X.; Ma, Z.; Huang, X.; Li, L. How does grazing exclusion influence plant productivity and community structure in alpine grasslands of the Qinghai-Tibetan Plateau? Glob. Ecol. Conserv. 2020, 23, e01066. [Google Scholar] [CrossRef]
  62. Sun, J.; Liu, M.; Fu, B.; Kemp, D.; Zhao, W.; Liu, G.; Han, G.; Wilkes, A.; Lu, X.; Chen, Y. Reconsidering the efficiency of grazing exclusion using fences on the Tibetan Plateau. Sci. Bull. 2020, 65, 1405–1414. [Google Scholar] [CrossRef] [PubMed]
  63. Wang, L.; Gan, Y.; Wiesmeier, M.; Zhao, G.; Zhang, R.; Han, G.; Siddique, K.H.; Hou, F. Grazing exclusion—An effective approach for naturally restoring degraded grasslands in Northern China. Land Degrad. Dev. 2018, 29, 4439–4456. [Google Scholar] [CrossRef]
  64. Jing, Z.; Cheng, J.; Su, J.; Bai, Y.; Jin, J. Changes in plant community composition and soil properties under 3-decade grazing exclusion in semiarid grassland. Ecol. Eng. 2014, 64, 171–178. [Google Scholar] [CrossRef]
  65. Wu, G.L.; Wang, D.; Liu, Y.; Ding, L.M.; Liu, Z.H. Warm-season grazing benefits species diversity conservation and topsoil nutrient sequestration in alpine meadow. Land Degrad. Dev. 2017, 28, 1311–1319. [Google Scholar] [CrossRef]
  66. Shao, Q.; Guo, X.; Li, Y.; Wang, Y.; Wang, D.; Liu, J.; Fan, J.; Yang, F. Using UAV remote sensing to analyze the population and distribution of large wild herbivores. Natl. Remote Sens. Bull. 2021, 22, 497–507. [Google Scholar] [CrossRef]
  67. Ge, J.; Meng, B.; Liang, T.; Feng, Q.; Gao, J.; Yang, S.; Huang, X.; Xie, H. Modeling alpine grassland cover based on MODIS data and support vector machine regression in the headwater region of the Huanghe River, China. Remote Sens. Environ. 2018, 218, 162–173. [Google Scholar] [CrossRef]
  68. Xu, H.-j.; Wang, X.-p.; Zhang, X.-x. Impacts of climate change and human activities on the aboveground production in alpine grasslands: A case study of the source region of the Yellow River, China. Arab. J. Geosci. 2017, 10, 17. [Google Scholar] [CrossRef]
  69. Ren, Y.; Liu, J.; Liu, S.; Wang, Z.; Liu, T.; Shalamzari, M.J. Effects of climate change on vegetation growth in the Yellow River Basin from 2000 to 2019. Remote Sens. 2022, 14, 687. [Google Scholar] [CrossRef]
  70. Wei, Y.; Lu, H.; Wang, J.; Wang, X.; Sun, J. Dual influence of climate change and anthropogenic activities on the spatiotemporal vegetation dynamics over the Qinghai-Tibetan plateau from 1981 to 2015. Earth’s Future 2022, 10, e2021EF002566. [Google Scholar] [CrossRef]
  71. Sigdel, S.R.; Zheng, X.; Babst, F.; Camarero, J.J.; Gao, S.; Li, X.; Lu, X.; Pandey, J.; Dawadi, B.; Sun, J. Accelerated succession in Himalayan alpine treelines under climatic warming. Nat. Plants 2024, 10, 1909–1918. [Google Scholar] [CrossRef]
  72. Li, X.; Zhang, K.; Li, X. Responses of vegetation growth to climate change over the Tibetan Plateau from 1982 to 2018. Environ. Res. Commun. 2022, 4, 045007. [Google Scholar] [CrossRef]
  73. Zhang, Q.; Kong, D.; Shi, P.; Singh, V.P.; Sun, P. Vegetation phenology on the Qinghai-Tibetan Plateau and its response to climate change (1982–2013). Agric. For. Meteorol. 2018, 248, 408–417. [Google Scholar] [CrossRef]
  74. Zhang, L.; Fan, J.; Zhou, D.; Zhang, H. Ecological protection and restoration program reduced grazing pressure in the Three-River Headwaters Region, China. Rangel. Ecol. Manag. 2017, 70, 540–548. [Google Scholar] [CrossRef]
  75. Ebrahimi, M.; Khosravi, H.; Rigi, M. Short-term grazing exclusion from heavy livestock rangelands affects vegetation cover and soil properties in natural ecosystems of southeastern Iran. Ecol. Eng. 2016, 95, 10–18. [Google Scholar] [CrossRef]
  76. Zhang, Z.; Zhao, Y.; Lin, H.; Li, Y.; Fu, J.; Wang, Y.; Sun, J.; Zhao, Y. Comprehensive analysis of grazing intensity impacts alpine grasslands across the Qinghai-Tibetan Plateau: A meta-analysis. Front. Plant Sci. 2023, 13, 1083709. [Google Scholar] [CrossRef] [PubMed]
  77. Niu, Y.; Yang, S.; Wang, G.; Liu, L.; Hua, L. Effects of grazing disturbance on plant diversity, community structure and direction of succession in an alpine meadow on Tibet Plateau, China. Acta Ecol. Sin. 2018, 38, 274–280. [Google Scholar] [CrossRef]
  78. Du, Y.; Ke, X.; Guo, X.; Cao, G.; Zhou, H. Soil and plant community characteristics under long-term continuous grazing of different intensities in an alpine meadow on the Tibetan plateau. Biochem. Syst. Ecol. 2019, 85, 72–75. [Google Scholar] [CrossRef]
  79. Wang, S.; Fan, J.; Li, Y.; Huang, L. Effects of grazing exclusion on biomass growth and species diversity among various grassland types of the Tibetan Plateau. Sustainability 2019, 11, 1705. [Google Scholar] [CrossRef]
  80. Kolluru, V.; John, R.; Saraf, S.; Chen, J.; Hankerson, B.; Robinson, S.; Kussainova, M.; Jain, K. Gridded livestock density database and spatial trends for Kazakhstan. Sci. Data 2023, 10, 839. [Google Scholar] [CrossRef]
Figure 1. (a) Location of Madoi County in the Three-River-Source region; (b) spatial distribution of grasslands in Madoi County.
Land 14 00813 g001
Figure 2. (a) Zaling Lake–Eling Lake Nature Reserve and Xingxinghai Nature Reserve in Madoi County; (b) Yellow River Source National Park in Madoi County.
Land 14 00813 g002
Figure 3. Spatial distribution of grazing intensity in Madoi County from 2000 to 2019.
Land 14 00813 g003
Figure 4. (a) Percentage of ungrazed area to total grassland area; (b) changes in the average grazing intensity for all grasslands and grasslands in grazed zones.
Land 14 00813 g004
Figure 5. Changes in the average grazing intensity in (a) PAs, non-PAs, and (b) different functional zones from 2000 to 2019.
Land 14 00813 g005
Figure 6. Spatial pattern of (a) mean NDVI and (b) NDVI dynamics on grasslands in Madoi County from 2000 to 2019.
Land 14 00813 g006
Figure 7. The contribution of (a) grazing activity and (b) climate change to vegetation greening in Madoi County from 2000 to 2019.
Land 14 00813 g007
Figure 8. The contribution of (a) grazing activity and (b) climate change to vegetation browning in Madoi County.
Land 14 00813 g008
Figure 9. The average contribution of grazing activity and climate change to (a) greening and (b) browning of grassland vegetation in Madoi County, PAs, and non-PAs (data source: Madoi County Bureau of Agriculture, Animal Husbandry, and Science and Technology).
Land 14 00813 g009
Figure 10. Livestock numbers (unit: 104 sheep units) and grazing area (unit: 104 hectares) in Madoi County from 2009 to 2019.
Land 14 00813 g010
Table 1. Determination of the relative contribution proportion for grazing activity and climate change that affects vegetation changes.
Vegetation VariationSGICccContribution of GA (%)Contribution of CC (%)
Increased vegetation cover (SNDVI > 0)>0>00100
>0<000
<0>0 C g a C c c + C g a × 100 C c c C c c + C g a × 100
Decreased vegetation cover (SNDVI < 0)>0>01000
>0<0 C g a C c c + C g a × 100 C c c C c c + C g a × 100
<0>000
Disclaimer/Publisher’s Note: The statements, opinions and data contained in all publications are solely those of the individual author(s) and contributor(s) and not of MDPI and/or the editor(s). MDPI and/or the editor(s) disclaim responsibility for any injury to people or property resulting from any ideas, methods, instructions or products referred to in the content.

