Article

Analysis of Factors Influencing the Ecosystem Service Value in Yuzhong County and Multi-Scenario Predictions

1
College of Water Conservancy and Hydropower Engineering, Gansu Agricultural University, Lanzhou 730070, China
2
Yaojie Coal Power Group Tianzhu Coal Industry Company, Wuwei 733211, China
*
Author to whom correspondence should be addressed.
Land 2025, 14(4), 833; https://doi.org/10.3390/land14040833
Submission received: 17 February 2025 / Revised: 9 April 2025 / Accepted: 9 April 2025 / Published: 11 April 2025

Abstract

:
The value of ecosystem services (ESV) serves as a crucial metric for assessing the cost-effectiveness of ecosystems and evaluating their economic worth. Predicting the evolution of ESV across various land uses under different scenarios is essential for maintaining ecological stability and fostering sustainable developm0ent. Utilizing land use change data combined with the PLUS predictive model and ecosystem service value equivalence techniques, this study analyzes the spatiotemporal patterns and underlying drivers of ESV in Yuzhong County, China. The results indicate that the overall ESV distribution exhibits a “fragmented northeast, clustered southwest” pattern, dominated by high-high and low-low clustering. Among the driving factors, elevation exerts the greatest influence on ESV, followed by precipitation and population density, while slope contributes least. Under natural development scenarios, the ESV remains relatively stable compared to the base year of 2020. In contrast, the farmland protection scenario effectively preserves the ESV associated with cultivated land. However, the economic development scenario leads to a significant decline in the overall ESV, with a retraction of high-value areas and an expansion of low-value regions. These insights provide a fresh perspective for analyzing the factors influencing ESV and for conducting multi-scenario predictions, thereby aiding in the development of ecological resource conservation and landscape ecological risk prevention strategies in the study region.

1. Introduction

Ecosystem service value (ESV) represents the monetized outcome of quantifying the structure and function of ecosystems, serving as a crucial foundation for environmental economic accounting and the delineation of ecological function zones. It also provides important assurance for substantiating the rationality and healthiness of ecological economies [1,2]. However, with the continuous advancement of the economy and society and the acceleration of urbanization, the contradictions between human activities and the natural environment are becoming increasingly severe. The interplay of various driving factors has made the impact on ESV increasingly complex, leading to gradual deterioration of the ecological environment and increasing pressure on natural resources and ecosystems [3,4,5]. Therefore, scientifically analyzing and predicting ESV is of great significance for a comprehensive understanding of the relationship between ecosystems and human societies and for improving the assessment and management of ESV.
Research on ESV has expanded into an interdisciplinary field encompassing ecology, economics, geography, and others, becoming a hot topic in policy-making [6,7]. Investigating the spatiotemporal evolution of ESV is crucial for optimizing land use structures and achieving sustainable socio-economic development. Estimating ESV based on land use change can establish a direct link between land pattern alterations and economic values [8,9,10]. In recent years, ESV research has been predicated on the analysis of land use structures. By integrating environmental effects, predictive modeling, the dynamic characteristics of different driving force systems, and ecological economic models, it has gradually become an effective approach for evaluating and estimating ESV, yielding promising results [11,12]. However, most studies have focused on large-scale ecological protection areas and river basins, with less attention paid to the ESV of county-level research areas under conditions of economic development and urban expansion.
Multi-scenario simulation predictions allow for flexible setting of research objectives and development trends across various scenarios, relying on land cover change under different scenarios and employing the PLUS model for multi-scenario analysis. This addresses the limitations of previous CA models in terms of lacking research on driving force factors and the spatial-temporal scales of patch evolution [13,14]. Through different scenario simulations, the magnitude of ESV and the spatial distribution of patches under various development situations are clarified, providing diversity in research possibilities. This approach better excavates the causes of various land use changes, simulates patch-level changes in land use, and combines planning policies to achieve ecological protection and sustainable development. It avoids the limitations of single predictions and offers a richer perspective for decision-making research [15,16].
This study utilizes the PLUS land use prediction model and the ecosystem service value equivalent method, in conjunction with data on land use type structures, to analyze the spatiotemporal evolution of ESV across different land types. This provides a scientific basis for the protection and development of ESV. The specific research objectives are: (1) to explore the land type transfer changes and characteristics over the past 40 years, revealing the laws of land use evolution in time and space; (2) to calculate the spatial distribution characteristics and changes in ESV, study the service value changes of different land types, and investigate the impact of land use changes on ecosystem service value; (3) to analyze the contribution of different driving factors to ESV and predict the changes in ESV by 2030 under various multi-scenario developments.

2. Study Area and Data Sources

2.1. Overview of the Study Area

Yuzhong County is geographically situated between 34°42′ N to 35°17′ N latitude and 103°38′ E to 104°22′ E longitude. The terrain is predominantly hilly and basin shaped, featuring a variety of common land use types such as forests, grasslands, and croplands, and represents a typical transition zone between the Loess Plateau and the Qinling Mountains. The Yellow River flows through the eastern part of the county, providing local water resource and irrigation conditions. Moreover, the rate of urbanization within the county is relatively rapid, making it a typical rapidly developing area (Figure 1) [17,18].

2.2. Data Sources

The land use data utilized in this study were obtained from the Resource Environment Data Center of the Chinese Academy of Sciences, with an overall accuracy greater than 85%. The land use data were reclassified into six categories: cultivated land, forest land, grassland, water bodies, construction land, and unused land, as depicted in Figure 2. The unit area yield data used for calculating the ecosystem service value were sourced from the National Bureau of Statistics of China. The main crop prices and sown area data were, respectively, derived from the “China Agricultural Product Price Survey Yearbook” and the “Gansu Development Yearbook”.
Seven driving factors of land use change were selected for this study, as shown in Figure 3. These include the distances to roads, water systems, and residential areas, which were calculated as Euclidean distances using the National Geographic Information Resources Service Directory data and ArcGIS 10.6. The Digital Elevation Model (DEM) data were obtained from the Geospatial Data Cloud, with slope calculated from the elevation data; both datasets have a spatial resolution of 30 m. Population data were sourced from the Landscan Global Population Distribution Database, while precipitation data were obtained from the National Qinghai-Tibet Plateau Data Center, with both having a spatial resolution of 1 km [19].This article uses ArcGIS 10.6 for data processing and Plus Model v1.40 for data simulation.

3. Research Methods

This study employs unit area equivalent factors to quantify the ecosystem service value (ESV) within the research area. Through analyzing the variations, it elucidates potential patterns and the differential impacts of various driving factors on ESV. By integrating the Moran’s I index, the research investigates the spatial clustering characteristics of ESV, further corroborating the change patterns with relevant influencing factors. Consequently, by establishing predictive models under diverse ecological scenarios, the study derives the spatial distribution of ESV under various conditions, thereby offering theoretical references for policy formulation and ecological conservation efforts.

3.1. Unit Area Equivalent Factor Method

This study quantifies the economic value provided by ecosystems using an ecosystem service value accounting formula. Given that the study area is primarily composed of arable land and grassland, agricultural land value equivalents were used to quantify ecosystem value. Specifically, the standard unit of ecosystem service value is equated to one-seventh of the food production value of a unit area of farmland [20,21].
E a = 1 7 i = 1 n m i p i q i M
In the above equation, Ea represents the food production value provided by a unit area of arable land (CNY/hectare); i denotes the type of crop; mi is the planting area of the ith crop (hectares); pi is the average price of the ith crop (CNY/ton); qi represents the yield per unit area of the ith crop (tons/hectare); and M is the total planting area of all crops.

3.2. Spatial Autocorrelation Analysis

This study uses the Moran’s I index to analyze the spatial autocorrelation of ecosystem service values. The global Moran’s I index is used to measure the spatial autocorrelation of data across the entire geographic area, serving as a global statistic that provides information on the data distribution patterns across the region. The local Moran’s I index helps identify areas within the geographic space where significant spatial clustering or dispersion occurs, determining whether significant aggregation or dispersion exists in the spatial data [4,22,23].

3.3. PLUS Prediction Model and Multi-Scenario Simulation

The PLUS model is a scenario-driven prediction model that integrates land use demand and competitive effects. It consists of a land expansion analysis module and a multi-class random seed cellular automaton model [14,15,16]. The land use conversion mechanism extracts the land expansion portion and samples it proportionally. The random forest method is used to obtain the development probability and the contribution of driving factors. The total probability is then calculated through a descending threshold multi-class random patch seeding mechanism, simulating the evolution of land use patches under future scenarios [17,18,19]. The Markov chain is applied to forecast future land demand, with a Kappa index of 0.8414, indicating the high reliability of the results. After validation, it was found that when the expansion neighborhood range is set to 3, the new patch decay threshold to 0.5, the patch expansion coefficient to 0.3, and the percentage of random seed patch generation set to 0.001 the model parameters achieve the best prediction results for this study area.

4. Results Analysis

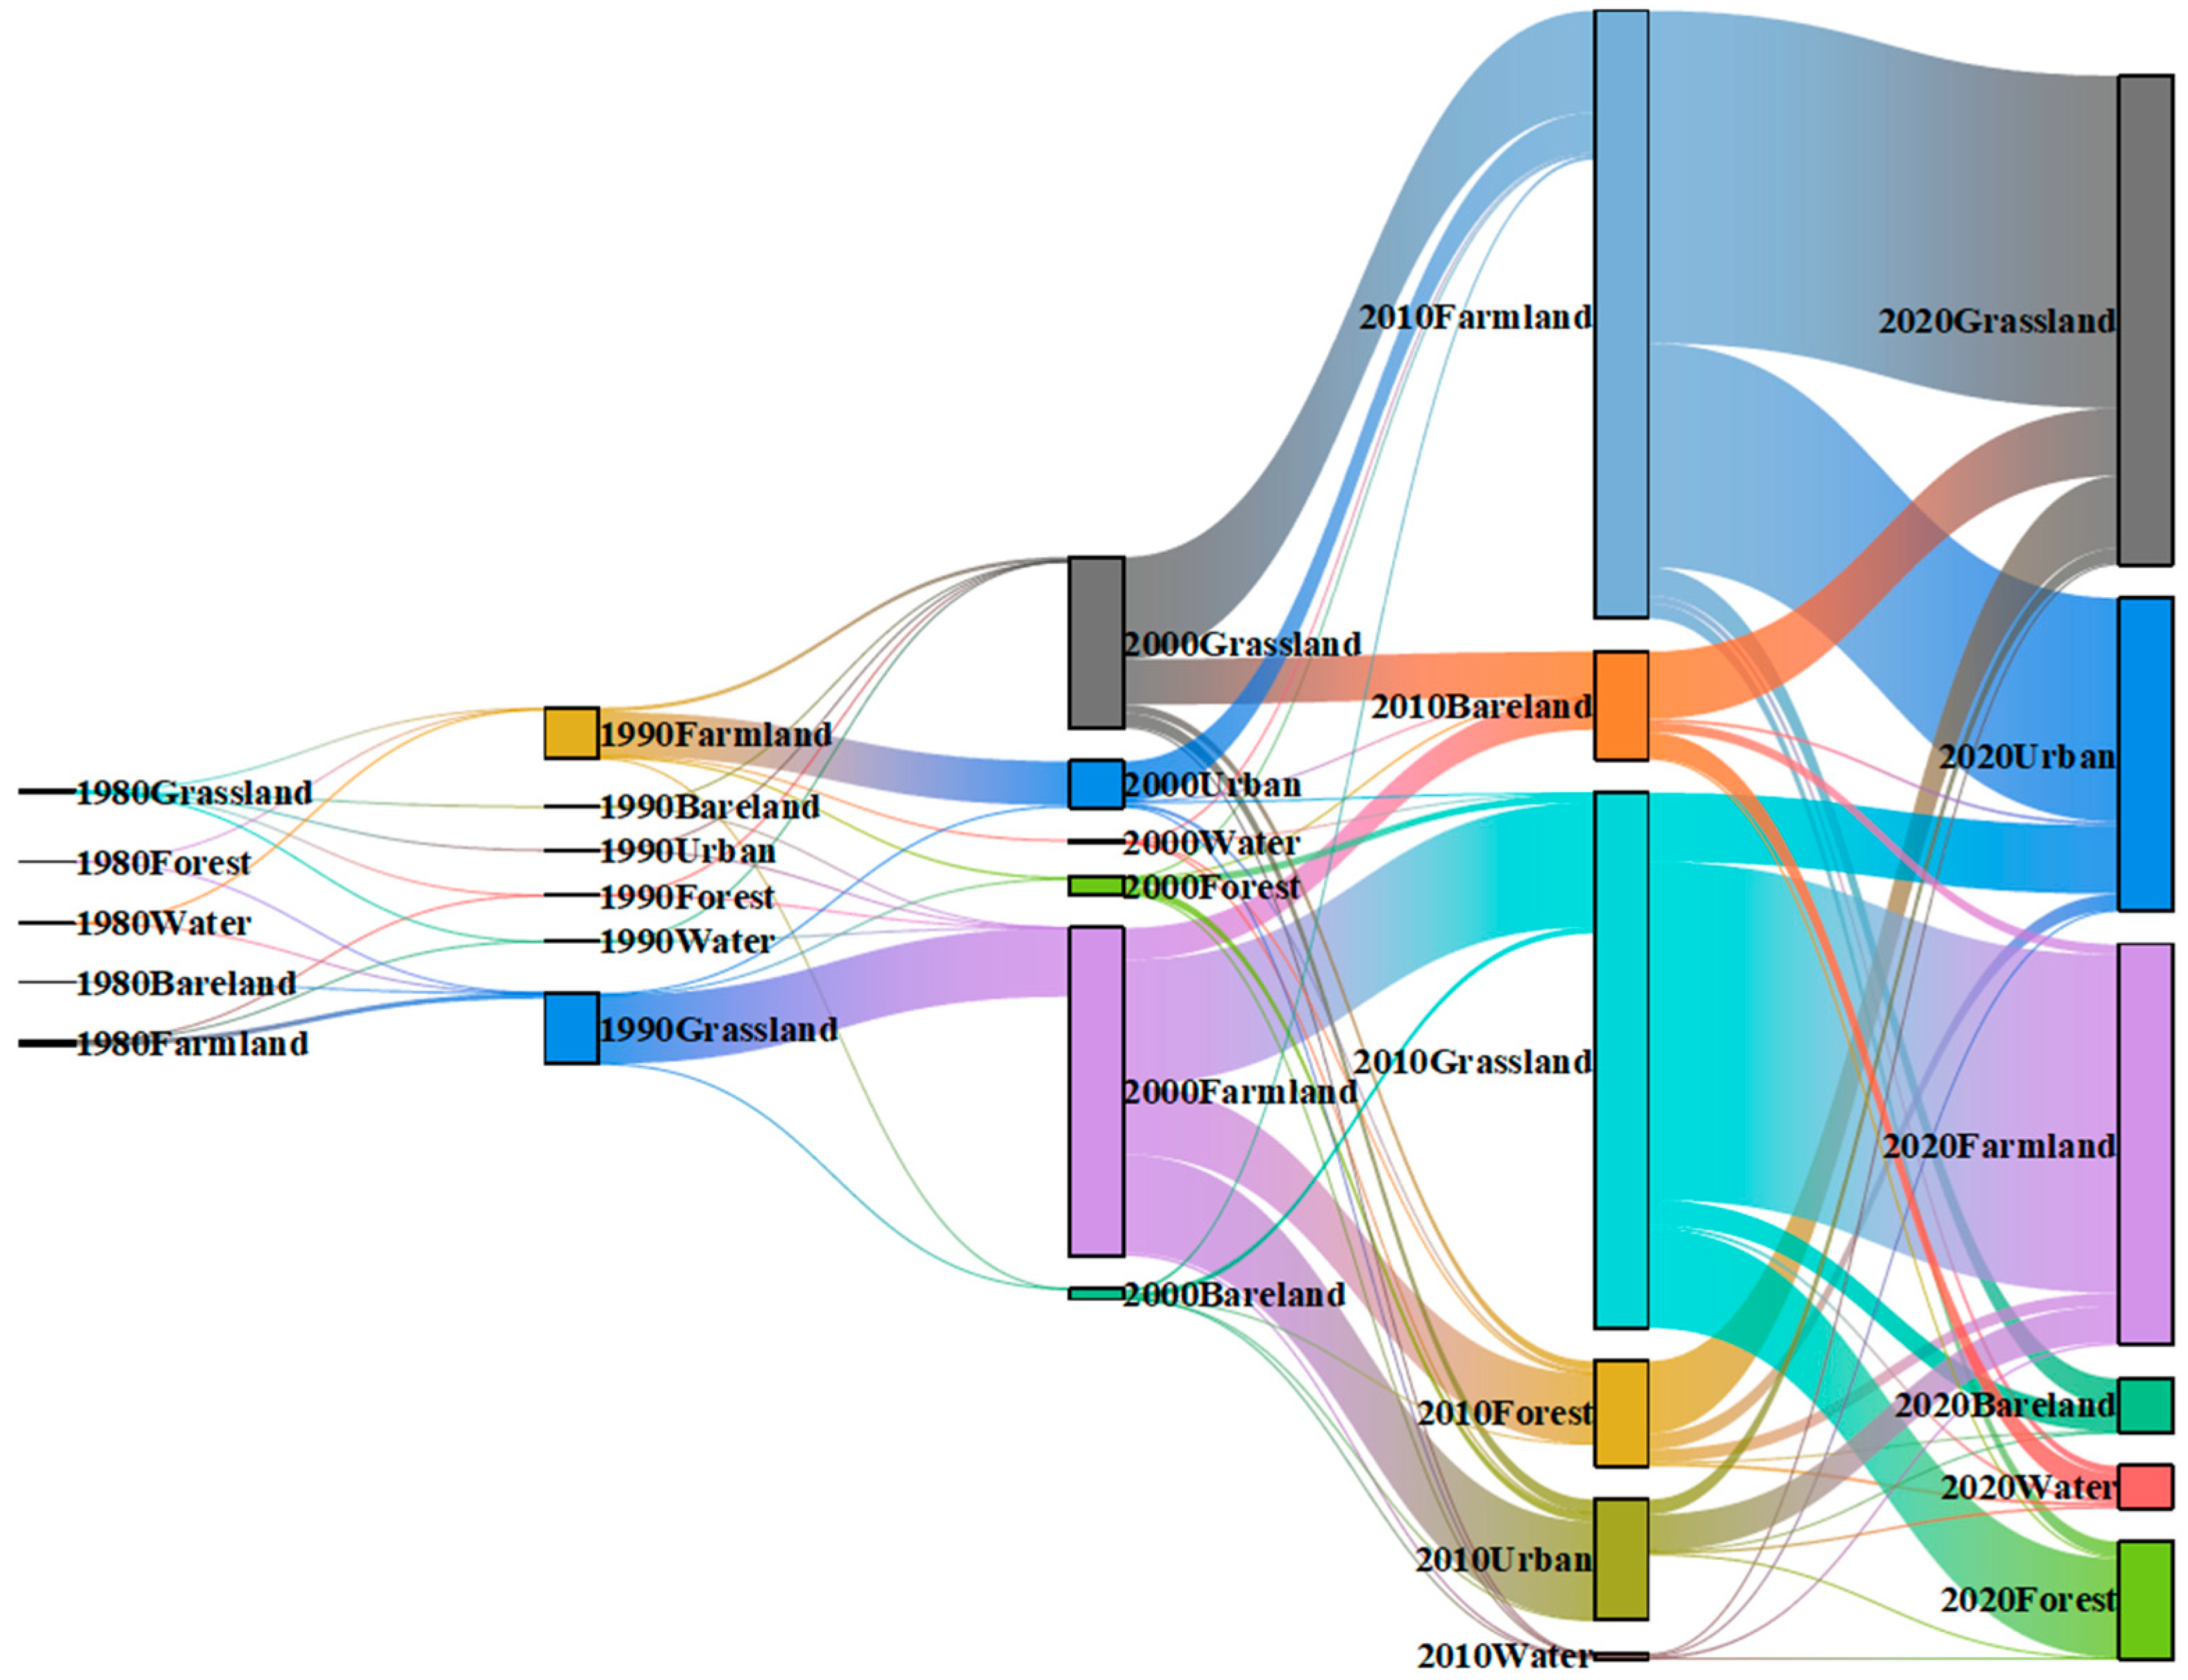
4.1. Land Cover Change Analysis

The northeastern part of Yuzhong County exhibits a mixed distribution pattern of farmland and grassland, with significant land use transitions occurring between these two categories. As a result, fine boundary transformation traces are formed within the region. In the southwest, forest land predominates, with the main land conversion occurring between forest land and grassland, leading to boundary scars in forest-grassland land use transitions. To the west, from Heping and Dingyuan towns extending southeastward, land use transitions primarily involve the conversion of farmland and grassland into built-up areas, with clear boundary changes between farmland and grassland. From 1980 to 1990, land use changes were not significant and the conversion area approached zero. Between 1990 and 2000, the largest conversion occurred between farmland and grassland, accounting for more than 90% of the total land use conversion area, with most of the conversions directed toward built-up areas and farmland. Over the next decade, conversion areas for all land types increased, with farmland conversion being the highest, followed by grassland and built-up areas, while all land types saw some degree of conversion inwards. By 2020, land use conversion reached its peak, with farmland and grassland conversions accounting for over 50% of the total conversion area, while the area of forest land, construction land, and bareland significantly increased (Figure 4 and Figure 5).

4.2. Spatiotemporal Evolution of Ecosystem Service Value

This study utilizes a modified unit area equivalence table, in combination with the actual distribution and composition of land use types. Wheat, maize, and oilseed crops were selected as the primary crops, and using the ecosystem service value calculation formula, the unit area economic value equivalence for the study area was calculated to be CNY 1109 per hectare. Regarding provisioning services, the water land type had the highest value, followed by forest, grassland, farmland, and bareland. Conversely, construction land does not provide any provisioning services. The regulating service value follows the same pattern as the provisioning services. For supporting services, forest land exhibited the highest supporting service capacity, followed by grassland, water, farmland, and bareland, with construction land still offering no supporting service value. The cultural service value was similar for forest, grassland, and water land types, with construction land next, while the cultural service value of farmland and bareland was negligible (Table 1).
The spatial distribution maps of ecosystem services value for each study year were generated by combining land use distribution characteristics and ecological service value equivalents. As shown in Figure 6, the overall spatial distribution pattern of ecosystem service value in the study area exhibits a “northeast fragmentation, southwest aggregation” trend. Between 1980 and 1990, there was a slight increase in ecosystem service value in the central region, where grassland and forest land alternated, while the value of ecosystem services associated with farmland in the northern part of the study area, located within the grassland area, decreased. In towns such as Heping, Dingyuan, Lianda, and Chengguan, the land use distribution primarily alternated between farmland and urban, with a continuous decrease in ecosystem service value during the study period. In the southern part of the study area, Mapo Township, which includes the Xinglong Mountain National Nature Reserve, saw good protection of forest land, leading to an upward trend in ecosystem service value over the study period. In the southeastern regions of Gancao Dian Town and Gaoya Town, where urban, grassland, and farmland were interwoven, ecosystem service values became increasingly polarized, with higher values growing higher and lower values becoming even lower over time. Overall, since there was little change in land types and areas between 1980 and 2000, the ecosystem service value remained stable. However, by 2010, the rapid increase in the urban area, which encroached upon a significant amount of farmland, led to a decline in ecosystem service value in the urban areas dominated by Heping, Dingyuan, and Lianda towns. Over the next decade, large areas of urban continued to encroach on surrounding farmland and bareland.

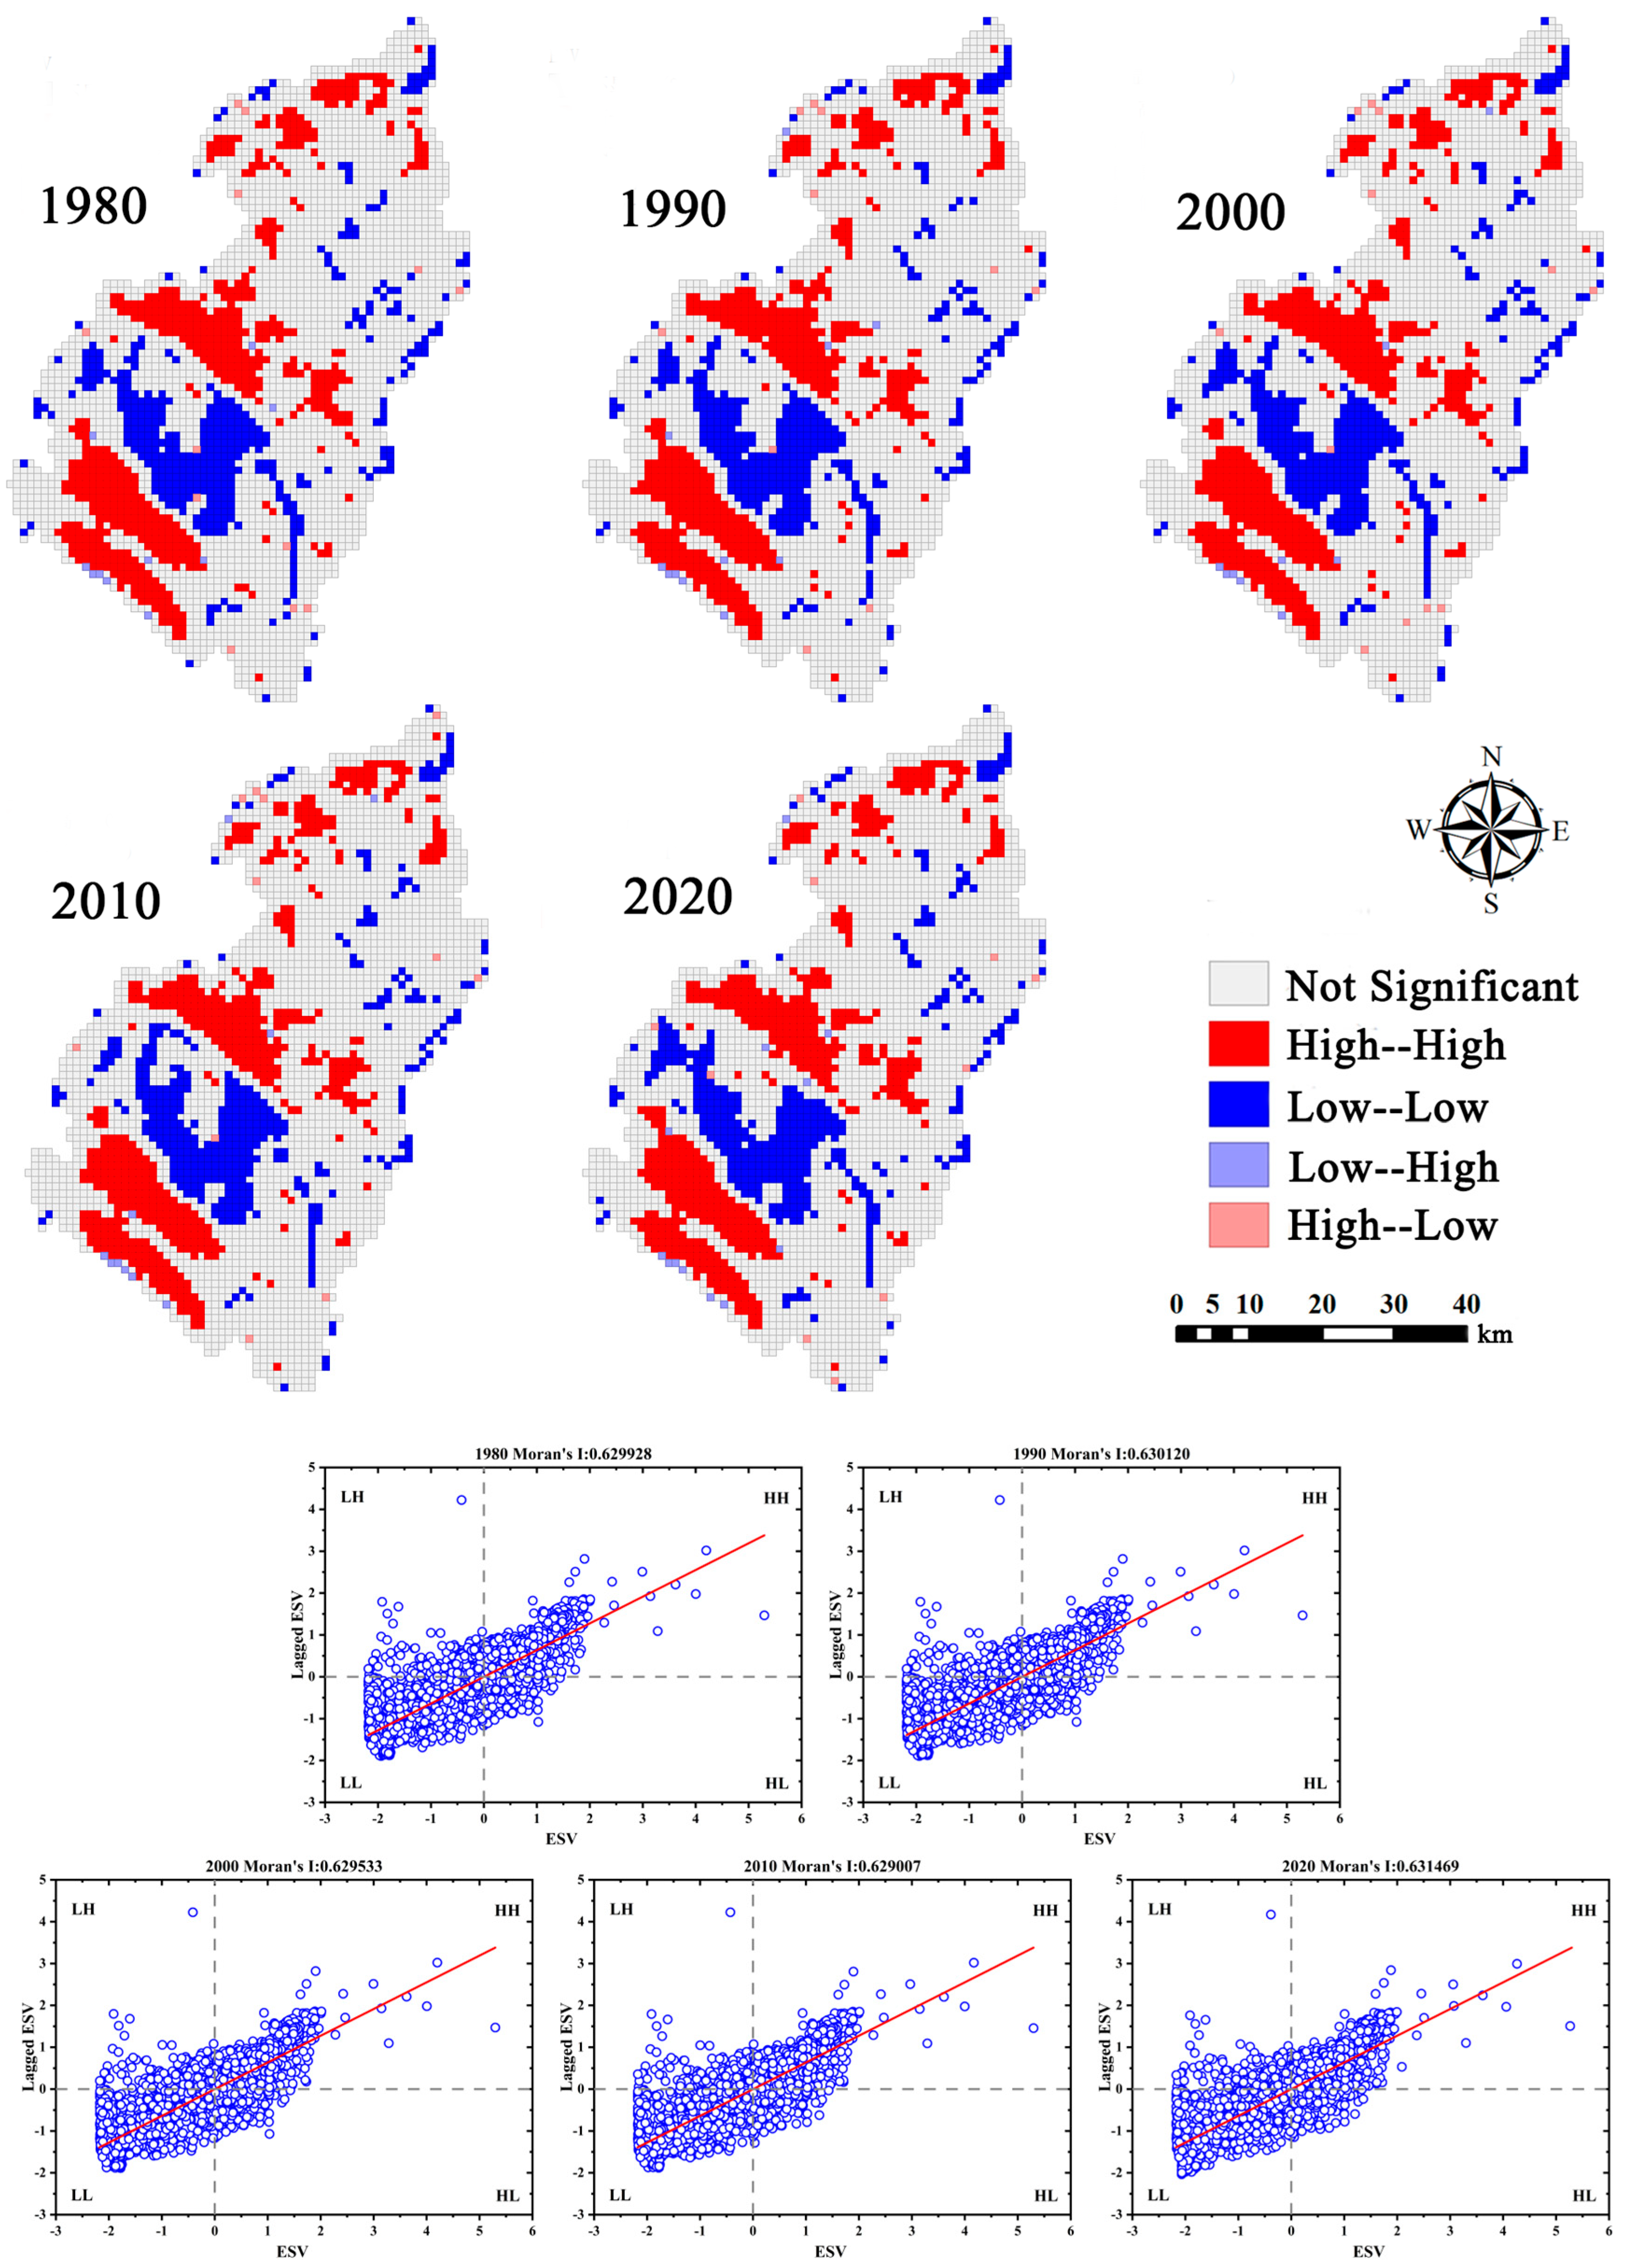
4.3. Spatial Clustering Characteristics of Ecosystem Service Values

This study applied Moran’s I index to conduct spatial autocorrelation analysis of ecosystem service values within the study area. The results indicate a positive spatial autocorrelation of ecosystem service values, with the distribution of these values exhibiting continuous mutual influence. As a result, areas with higher ecosystem service values tend to have neighboring areas with similarly high values, while areas with lower values are surrounded by regions with comparatively low values. Since the global Moran’s I index only reflects the overall level of ecological value clustering, the study further employed the local Moran’s I index to analyze the degree and characteristics of this clustering. During the study period, the area primarily exhibited two clustering patterns: high-high and low-low. The overall ecosystem service value showed a pattern of increase, followed by a decrease, and then a subsequent increase (Figure 7). As shown in Figure 7, the red line represents the relationship between the linear fitting of the spatial clustering characteristics of the ecological service value and the distribution trend.

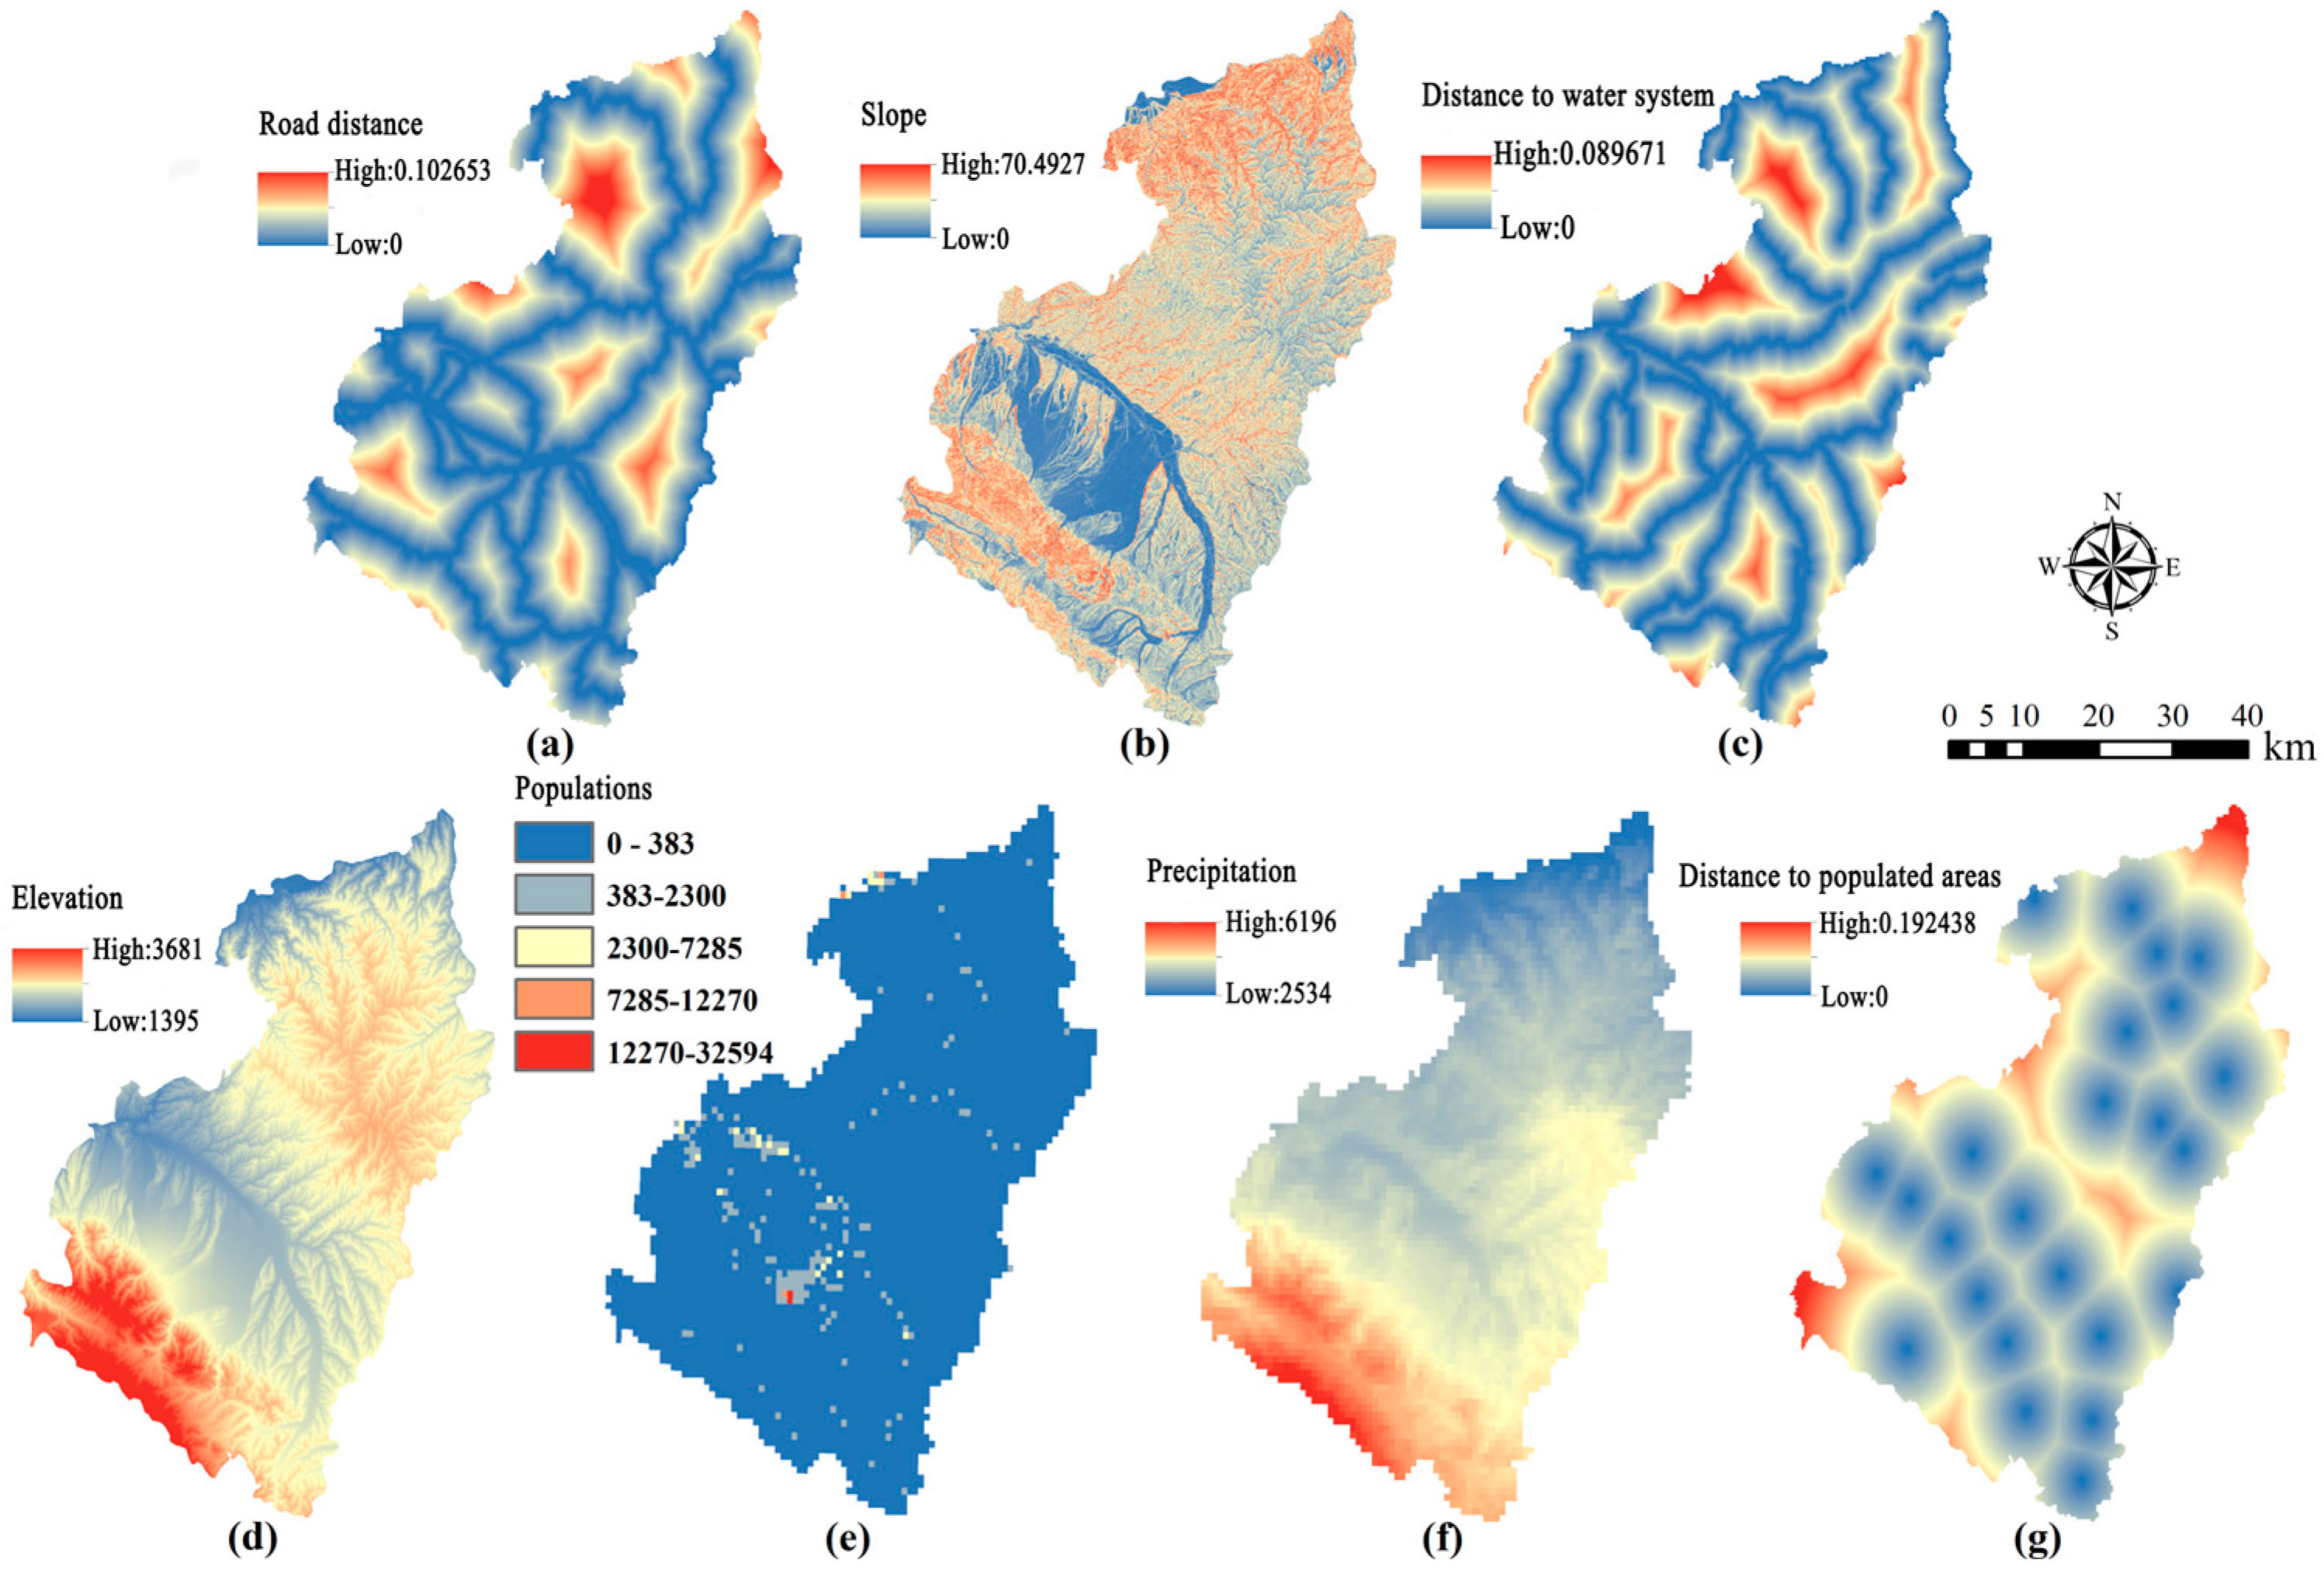
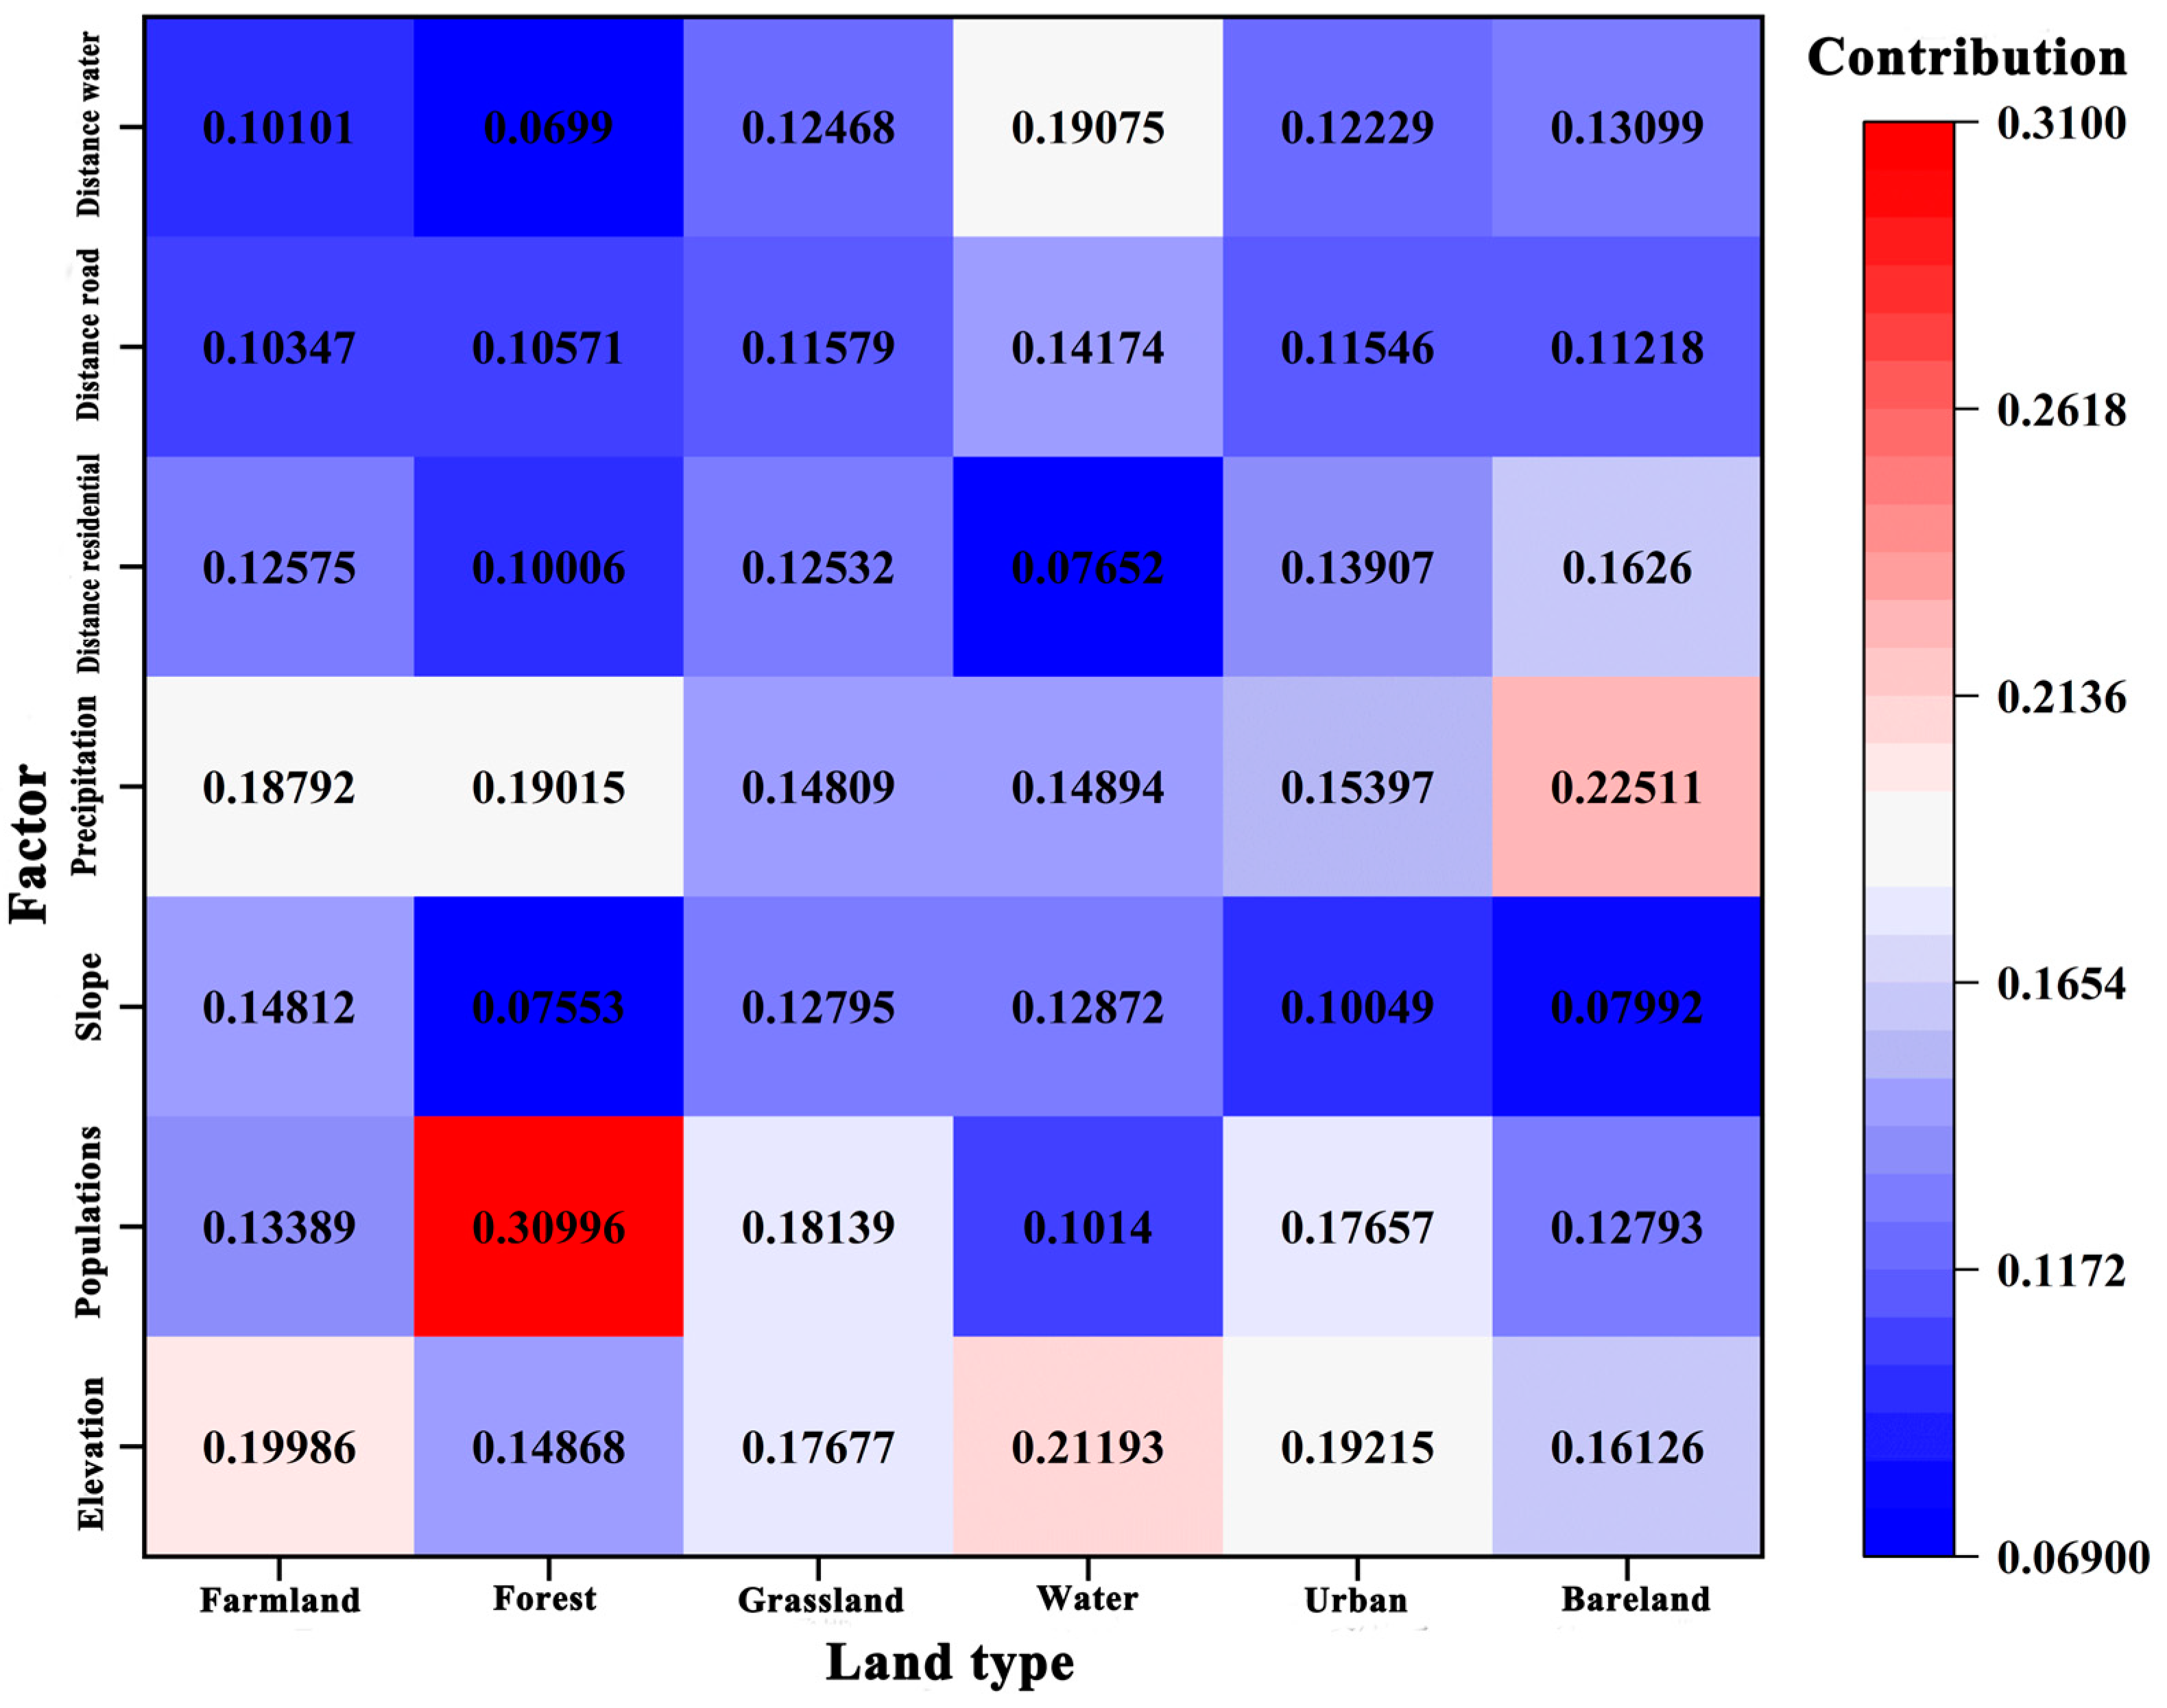
4.4. Analysis of the Drivers of Ecosystem Service Value

Seven land use driving factors and their interactions with different land cover types were selected for analysis. Using a random forest algorithm, we deeply examined the driving factors that influence land use change and their contribution to land cover conversion. The results indicate the relative contributions of each driving factor to the expansion of various land use types, as shown in Figure 8. The total contributions of the driving factors are ranked as follows: elevation (1.09065) > precipitation (1.05418) > population (1.03114) > distance to water systems (0.73962) > distance to residential areas (0.72932) > distance to roads (0.69435) > slope (0.66073). Elevation was found to have the greatest impact on the conversion of land cover types, driving the evolution of farmland, water, and built-up areas. Precipitation also plays a significant role, particularly affecting barren or moss-covered land in unused areas. The distances to water systems, residential areas, and roads have relatively smaller effects on land cover evolution and their contributions are less pronounced compared to other factors. Slope was identified as the driving factor with the smallest contribution.

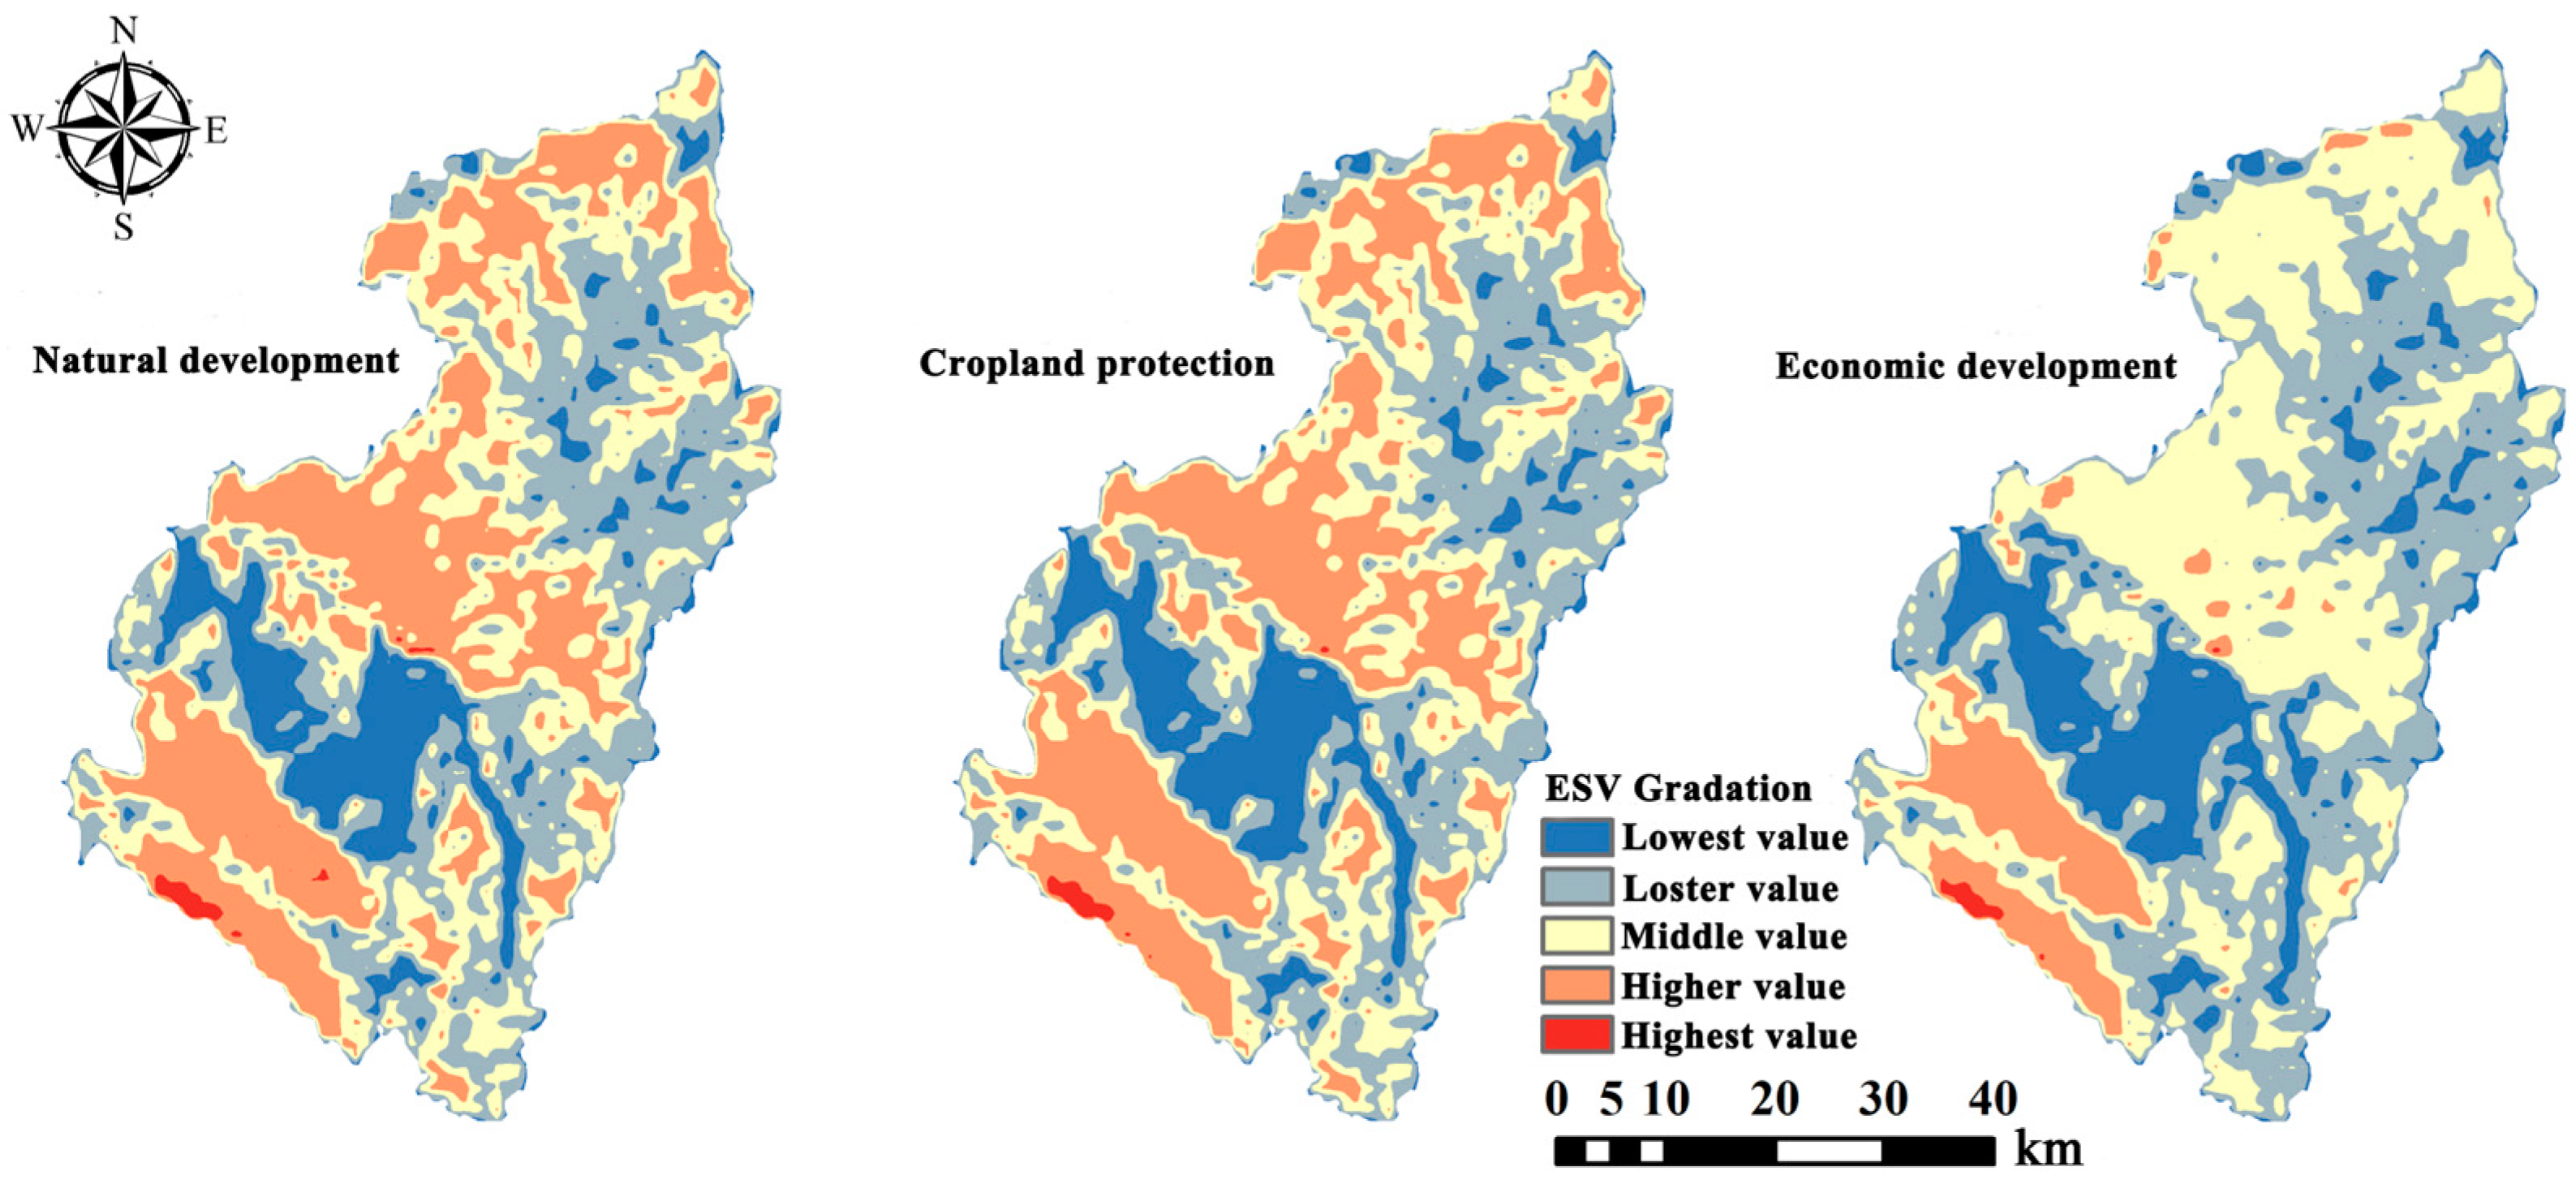
4.5. Multi-Scenario Prediction of Ecosystem Service Value

In this study, the prediction module of the PLUS model was used to perform multi-scenario simulations. Parameters such as the new patch decay threshold, patch expansion coefficient, seed percentage, and domain weight were kept constant. Only the land use type demand under different scenarios was adjusted based on transition probabilities. The Markov chain module was then used to forecast land use data for the year 2030 under various scenarios. The predicted demand for each land use type was incorporated as the land demand parameter in the PLUS model, generating the land use demand forecast table, as shown in Table 2 below.
In the natural development scenario, the land use follows natural evolution characteristics without any restrictions on conversion zones and the data transfer probabilities are directly applied. The land use demand predicted by the Markov chain is used as the forecast result without any transfer preferences or restrictions. In the farmland protection scenario, areas that have been arable land in the years 2000, 2010, and 2020 are selected as long-term stable farmland. Additionally, farmland with a slope of less than 6° is considered as high-quality arable land. These two types of farmland are merged to form restricted conversion zones. The Markov transfer probability matrix is adjusted, reducing the probability of farmland being converted to urban by 70%, and decreasing the probability of farmland converting to grassland or water by 40%. The probability of bareland converting to arable land is increased by 50%, ensuring the strict implementation of farmland protection policies. In the economic development scenario, economic growth is the main driver, aiming to promote societal development. A large amount of construction land is required to support spatial development and industrial land construction, which continuously reduces the use of arable land, forest land, grassland, and other types of land. Therefore, in this scenario, the probability of urban converting to arable land, water, forest land, grassland, and bareland is reduced by 40%, while the probability of arable land, forest land, grassland, water, and bareland converting to urban is increased by 40%, 10%, 20%, 10%, and 50%, respectively. The land use forecast maps for different scenarios are shown in Figure 9.
Under the predictions made by the PLUS land use model, land use conditions for three different development scenarios—natural development, farmland protection, and economic development—were forecasted and their corresponding ecosystem service values were calculated. These values were categorized into five levels (highest, higher, middle, lower, and lowest) using the natural breaks method. In the natural development scenario, both land types and the spatial distribution and magnitude of ecosystem service values remained relatively stable. The ecological service value of grasslands was consistently higher, while that of farmland was lower. The highest ecological service value was still located in the forest land of Mapo Township, while the lowest was found in the urban areas of urban centers. In the farmland protection scenario, land area and distribution remained stable, with farmland ecological service values well protected, ensuring food security, which is of significant importance to China’s food security. In the economic development scenario, urban areas within the study area continued to expand, encroaching on adjacent land types. Numerous scattered low-ecological-service-value construction zones appeared in the central and northern parts of the study area, encroaching on previously agricultural and pastoral areas. In the major urban areas, such as Chengguan Town, Dingyuan Town, and Lianda Town, the expansion of urban significantly impacted the ecological service value of the surrounding environment in Figure 10.

5. Discussion

5.1. Ecological Service Value Evolution and Driving Forces Analysis

The overall ecosystem service value (ESV) in the research area exhibits a “fragmented northeast, clustered southwest” distribution pattern, with spatial aggregation primarily characterized by high-high clustering and low-low clustering [20]. The results indicate that elevation has the greatest driving effect on ESV, followed by precipitation and population, while slope has the least contribution. As shown in Figure 11, the proportion and area of cultivated land remained relatively stable from 1980 to 2000, with a slight increase around 2000. Subsequently, due to economic development and the expansion of construction land, cultivated land area was continuously encroached upon. Additionally, the labor force shifted to urban areas, leading to the conversion of some cultivated land to forest, grassland, or unused land, further decreasing the ESV of cultivated land. Thus, the ESV of cultivated land began to decline [4]. Forestland remained relatively stable without significant changes from 1980 to 2000, with population and precipitation being the major driving factors. However, the economic development in the research area had little dependence on forestland, so construction development had almost no impact on it. Not until 2010, with the implementation of forestland protection policies and the conversion of cropland to forest, did the ESV of forestland significantly increase, with the fastest growth rate from 2000 to 2010.
The ESV of grassland began to decline in 1990, indicating that during the expansion of construction land for economic development, grassland resources were prioritized for encroachment before cultivated land was damaged. The decline rate of ESV for grassland reached its fastest from 1990 to 2000. Water bodies are scarce and lack large areas of water, so their ESV remained stable from 1980 to 2010, with all driving factors having little impact. However, by 2020, due to good ecological protection and increased attention to water resources, the flow of inland waters increased and river boundaries widened, resulting in a significant increase in ESV [6,7]. Construction land is also constrained by elevation factors. Due to slow economic development from 1980 to 1990, its ESV remained relatively unchanged. After 1990, with increasing emphasis on economic construction, the area occupied by construction land continuously increased, reaching the maximum growth rate of ESV in 2020. Moreover, due to ecological protection policies and improved quality of economic development, the ESV of construction land has been on a continuous rise [23]. The ESV of unused land generally showed a pattern of stable unchanged followed by an increase and then a decrease. Since unused land is mostly sandy land, Gobi dessert, or bare land, precipitation has the greatest driving effect on it and its ESV changes are directly related to the amount of precipitation [3]. From 1980 to 2000, the amount of ESV remained relatively stable without significant changes. By 2010, due to changes in water resources and precipitation, it showed a significant increase. After 2010, it began to decline from 2010 to 2020.
The spatial aggregation types of ecosystem service value (ESV) within the entire research area exhibit relatively small changes over time. In the central to southwestern part of the research area, ESV demonstrates a high-low-high spatial distribution characteristic. Human activities further influence the spatial distribution of ESV. Due to economic construction and development, in regions with intense human activities, numerous land patches have shifted towards construction use, forming a low-ESV development and construction belt primarily along National Highway 312. From 2010 to 2020, towns such as Heping Town and Dingyuan Town, where human activities are more intense and economic activities are frequent, experienced rapid increases in construction land area within the research area. Man-made surfaces extensively encroached upon surrounding cultivated and unused lands for economic development, resulting in a slight expansion of the low-ESV low-low clustering spatial distribution. Simultaneously, the intensification of human economic activities has also increased the impact on various land types. Regions with high ESV aggregation are primarily centered around grasslands in Jinya Town and Xiaguanying Town, as well as the Xinglong Mountain area dominated by Mapo Town. This area is also a natural resource protection zone, possessing high value in soil conservation, climate regulation, and hydrological regulation. In contrast, economic development areas centered around human settlements such as Heping Town, Dingyuan Town, Lianda Township, and Chengguan Town are characterized by intense human activities, extensive construction land, and frequent economic activities, leading to the emergence of low-ESV low-low aggregation types. In regions such as Jinya Town, Gongjing Township, and Zhonglianchuan Township, which are dominated by grasslands and cultivated lands, the spatial aggregation types are mostly insignificant. At the same time, there are a large number of high-high or low-low enclave patches with significant spatial aggregation. In the southern part of the research area, such as Longquan Township, Xinying Township, and Gaoya Town, land type distributions are primarily characterized by the interaction of multiple patches, resulting in generally insignificant spatial aggregation types. Furthermore, due to the rational development and protection of forestlands, high-ESV high-high aggregation areas within Mapo Township have shown an increasing trend and reached their maximum value by 2020. Overall, ESV has shown a relatively obvious upward trend, while the ESV in other regions tends to stabilize.

5.2. Ecological Service Value Multi-Scenario Forecast Analysis

(1) Natural development scenario. Under this development scenario, the spatial distribution and magnitude of ecosystem service values are similar to those in 2020, with the distribution of land types and the proportion of utilization areas remaining relatively stable. As there are no restrictions on the direction of land type conversion and no protected areas are established to limit conversion, this scenario develops on the basis of the base forecast year. The construction land at the junction of Sanjiao Urban-Rural Area and Chengguan Town continues to expand due to economic development and construction, becoming an important transportation hub connecting Lanzhou City and Yuzhong County. In the central and northern parts of the study area, the grading of ecosystem service values presents a fragmented patch pattern, with fixed grassland ecosystem service values being relatively high and cultivated land ecosystem service values being lower. The maximum ecosystem service value is located within the forest land of Mapo Township, while the minimum value is still within the construction land of Heping Town, Dingyuan Town, and Chengguan Town. Moreover, the construction land within the entire study area is in a state of slow growth, with the degree of urbanization continuously increasing. Overall, due to the improvement of economic quality, the service value of construction land has also been enhanced.
(2) Cultivated land protection scenario. This scenario strictly implements the cultivated land protection policy, selecting long-term stable cultivated land and high-quality cultivated land as restricted conversion zones, effectively avoiding the encroachment on cultivated land during economic construction and controlling the quantity and quality of cultivated land. This ensures food reserve security and better protects the crop cultivation of high-quality and long-term cultivated land. The ecosystem service value of cultivated land is well protected, delaying the destruction of cultivated land in individual areas due to rapid economic development within the county and the impact of human activities on cultivated land, which is of great significance to China’s food security.
(3) Economic development scenario. Although regional economic development has been achieved, it has greatly affected the service value of the surrounding ecological environment. During the evolution of this scenario, adjacent land types are continuously squeezed, occupying the areas of other natural land types to support the demand for large-scale development and industrial land, resulting in the continuous reduction of areas of cultivated land, forest land, grassland, and other natural land types. In the central and northern parts of the study area, a large number of scattered construction lands appear at the interlaced parts of large areas of cultivated land and grassland, further expanding the occupied area and the number of patches on the basis of previous construction lands, occupying more agricultural and pastoral areas and having a greater impact on the ecological environment. Within the main urban areas of Chengguan Town, Dingyuan Town, and Lianda Town, the area of construction land has increased significantly.

5.3. Limitations and Future Research Directions

Although this research has achieved ideal results, it also has some limitations. Firstly, the assessment of ecosystem service values requires a large amount of ecological data and environmental information. Due to the fact that data resolution cannot fully substitute actual land type conditions, the reliability of the assessment results is affected. Secondly, existing assessment methods may not effectively consider the impact of spatial heterogeneity on different types and values of ecosystem services in different regions. Lastly, the transfer matrix of the land type conversion model is summarized from historical experience, and the prediction accuracy may decrease as the time span of predicting long-term geographical spatial data increases. Therefore, how to accurately assess the contribution of ecosystem services to the economy remains a challenge. Despite the above limitations, it can provide theoretical references for high-quality development of the ecological environment and ecological security governance.

6. Conclusions

This study, based on land use change data and combining the PLUS prediction model and equivalent values of ecosystem services methods, analyzes the spatiotemporal evolution patterns and driving factors of ecosystem service values in Yuzhong County and predicts the characteristics of ecosystem service value changes under multiple scenarios. It can provide a basis for multi-scenario service value calculation and analysis in different research areas under varying climatic conditions and economic development situations. The research results show that:
(1) Ecosystem service values spatially exhibit a “fragmented in the northeast, clustered in the southwest” distribution characteristic. The land types in the northeast of the study area are mainly cultivated land and grassland and the distribution is relatively fragmented, so the ecosystem service values present a patchy pattern; the southwest is mostly large areas of continuous forest land, so the ecosystem service values show a large-scale clustered state. The spatial aggregation of ecosystem service values in the study area is mainly high-high clustering and low-low clustering.
(2) The ecosystem service values of cultivated land and grassland are continuously decreasing, while the service values of forest land, water bodies, and construction land are in a state of continuous rise due to ecological protection policies and economic development. The ecosystem service values of unused land show a change from stable to increasing and then decreasing.
(3) The ranking of driving factors of ecosystem service values in Yuzhong County is elevation (1.09065) > precipitation (1.05418) > population (1.03114) > distance from water system (0.73962) > distance from residential area (0.72932) > distance from road (0.69435) > slope (0.66073), indicating that natural factors have a stronger influence on the change of ecosystem service values under human activity interference in Yuzhong County.
(4) Under the natural development scenario, there is no significant change in ecosystem service values and they remain basically consistent with the prediction initial year in space; under the cultivated land protection scenario, high-quality cultivated land and long-term stable cultivated land as restricted areas are well protected, the cultivated land protection policy is strictly implemented, ensuring the safety of cultivated land and food reserve conditions; under the economic development scenario, the urbanization process accelerates, construction land encroaches on natural ecological land types, the ecosystem service values in the study area drop extensively, high-ecosystem service value areas shrink, and the area of low-ecosystem service value areas expands.

Author Contributions

Methodology, J.Y.; Software, J.L.; Validation, P.G.; Formal analysis, X.Y.; Data curation, G.Z., Z.G., Q.L. and M.Z.; Writing—original draft, J.Y.; Writing—review & editing, G.Z. and M.S.; Visualization, W.W. All authors have read and agreed to the published version of the manuscript.

Funding

The funding sources for this article are as follows: National Natural Science Foundation of China (42461060); Key Research and Development Special Project for Ecological Civilization Construction at the Provincial Level in Gansu Province (24YFFA059); Special Fund for Central Government to Guide Local Scientific and Technological Development (24ZYQA023); Industrial Support Program Project of the Education Department of Gansu Province (2022CYZC-41); Special Financial Project of Gansu Province (GSCZZ 20160909). The article processing charges are covered by the National Natural Science Foundation of China (42461060).

Data Availability Statement

The raw data supporting the conclusions of this article will be made available by the authors on request.

Conflicts of Interest

Author Gengxin Zhang was employed by the Yaojie Coal Power Group Tianzhu Coal Industry Company. The remaining authors declare that the research was conducted in the absence of any commercial or financial relationships that could be construed as a potential conflict of interest.

References

  1. Song, J.; Liu, J.; Zhang, X.; Chen, X.; Shang, Y.; Gao, F. Spatio-temporal fluctuation analysis of ecosystem service values in northeast china over long time series: Based on bayesian hierarchical modeling. Land 2024, 13, 833. [Google Scholar] [CrossRef]
  2. Zhang, B.; Feng, Q.; Li, Z.; Lu, Z.; Zhang, B.; Cheng, W. Land Use/Cover-related ecosystem service value in fragile ecological environments: A case study in hexi region, China. Remote Sens. 2024, 16, 563. [Google Scholar] [CrossRef]
  3. Ding, R.; Li, Y.; Zhao, C.; Chen, J.; Zhu, W. Scenario simulation and driving force analysis of ecosystem service values based on land Use/Cover in the tumen river basin, China. Sustainability 2024, 16, 399. [Google Scholar] [CrossRef]
  4. Quan, L.; Jin, S.; Chen, J.; Li, T. Evolution and driving forces of ecological service value in anhui based on landsat land use and land cover change. Remote Sens. 2024, 16, 269. [Google Scholar] [CrossRef]
  5. Li, Q.; Liu, Y.; Jiao, H.; He, Q. Spatiotemporal analysis of the impacts of land use change on ecosystem service value: A case from Guiyang, China. Land 2024, 13, 211. [Google Scholar] [CrossRef]
  6. Tang, H.; Halike, A.; Yao, K.; Wei, Q.; Yao, L.; Tuheti, B.; Duan, Y. Ecosystem service valuation and multi-scenario simulation in the ebinur lake basin using a coupled GMOP-PLUS model. Sci. Rep. 2024, 14, 5071–5089. [Google Scholar] [CrossRef] [PubMed]
  7. Qi, B.; Yu, M.; Li, Y. Multi-scenario prediction of land-use changes and ecosystem service values in the lhasa river basin based on the FLUS-markov model. Land 2024, 13, 597. [Google Scholar] [CrossRef]
  8. Shu, R.; Wang, Z.; Guo, N.; Wei, M.; Zou, Y.; Hou, K. Multi-scenario land use optimization simulation and ecosystem service value estimation based on fine-scale land survey data. Land 2024, 13, 557. [Google Scholar] [CrossRef]
  9. Peng, S.Z.; Ding, Y.X.; Wen, Z.M.; Chen, Y.M.; Cao, Y.; Ren, J.Y. Spatiotemporal change and trend analysis of potential evapotranspiration over the Loess Plateau of China during 2011–2100. Agric. For. Meteorol. 2017, 233, 183–194. [Google Scholar] [CrossRef]
  10. Huang, G.; Feng, S.; Hu, C. A study of the spatiotemporal evolution patterns and coupling coordination between ecosystem service values and habitat quality in diverse scenarios: The case of chengdu metropolitan area, China. Sustainability 2024, 16, 3741. [Google Scholar] [CrossRef]
  11. Li, W.; Chen, X.; Zheng, J.; Zhang, F.; Yang, Y.; Hai, W.; Liu, L. A multi-scenario simulation and dynamic assessment of the ecosystem service values in key ecological functional areas: A case study of the Sichuan province, China. Land 2024, 13, 468. [Google Scholar] [CrossRef]
  12. Chang, Y.; Qu, H.; Zhang, S.; Luo, G. Assessment of uncertainties in ecological risk based on the prediction of land use change and ecosystem service evolution. Land 2024, 13, 535. [Google Scholar] [CrossRef]
  13. Zhi, Z.; Liu, F.; Chen, Q.; Zhou, Q.; Ma, W. Study on the urban expansion of typical tibetan plateau valley cities and changes in their ecological service value: A case study of Xining, China. Sustainability 2024, 16, 4537. [Google Scholar] [CrossRef]
  14. Hong, X.; Peng, Q.; Zheng, R.; Lin, W.; Fan, S.; Su, K. Evaluating the spatial evolution of the eco-economy harmony in anxi county, china, based on ecosystem services value. Sustainability 2024, 16, 1491. [Google Scholar] [CrossRef]
  15. Akbar, A.; Abulizi, A.; Erken, R.; Yu, T. Driving mechanisms of spatial differentiation in ecosystem service value in opencast coal mines in arid areas: A case study in the zhundong economic and technological development zone. Land 2024, 13, 623. [Google Scholar] [CrossRef]
  16. Liang, S.; Yang, F.; Zhang, J.; Xiong, S.; Xu, Z. Assessment and management zoning of ecosystem service trade-Off/Synergy based on the Social–Ecological balance: A case of the chang-zhu-tan metropolitan area. Land 2024, 13, 127. [Google Scholar] [CrossRef]
  17. Zhang, S.; Wang, Y.; Xu, W.; Sheng, Z.; Zhu, Z.; Hou, Y. Analysis of spatial and temporal variability of ecosystem service values and their spatial correlation in Xinjiang, China. Remote Sens. 2023, 15, 4861. [Google Scholar] [CrossRef]
  18. Zhu, S.; Zhao, Y.; Huang, J.; Wang, S. Analysis of spatial-temporal differentiation and influencing factors of ecosystem services in resource-based cities in semiarid regions. Remote Sens. 2023, 15, 871. [Google Scholar] [CrossRef]
  19. Peng, Q.; Wu, D.; Lin, W.; Fan, S.; Su, K. Dynamic land-use patterns and the associated impacts on ecosystem services value in Putian city, China. Appl. Sci. 2024, 14, 4554. [Google Scholar] [CrossRef]
  20. Fu, Y.; Cui, X.; Zhao, J.; Zhang, C.; Yan, L. Estimation of ecological compensation standard based on ecological service value calculation. IOP Conf. Ser. Earth Environ. Sci. 2021, 647, 012161. [Google Scholar] [CrossRef]
  21. Guan, Y.; Li, X.; Li, S.; Sun, H.; Liu, H. Effect of urban fringes green space fragmentation on ecosystem service value. PLoS ONE 2022, 17, e0263452. [Google Scholar] [CrossRef] [PubMed]
  22. Huang, L.; He, C.; Wang, B. Study on the spatial changes concerning ecosystem services value in lhasa river basin, China. Environ. Sci. Pollut. Res. 2022, 29, 7827–7843. [Google Scholar] [CrossRef] [PubMed]
  23. Gu, X.; Long, A.; Liu, G.; Yu, J.; Wang, H.; Yang, Y.; Zhang, P. Changes in ecosystem service value in the 1 km lakeshore zone of poyang lake from 1980 to 2020. Land 2021, 10, 951. [Google Scholar] [CrossRef]
Figure 1. Overview of the study area.
Land 14 00833 g001
Figure 2. Land use during the study period.
Land 14 00833 g002
Figure 3. Driving factors of land use prediction. (a) Distance to roads; (b) slope; (c) distance to water systems; (d) elevation; (e) population; (f) precipitation; (g) distance to residential areas.
Land 14 00833 g003
Figure 4. Land use transition map.
Land 14 00833 g004
Figure 5. Land transfer Sankey diagram.
Land 14 00833 g005
Figure 6. Spatial distribution of ecosystem service values.
Land 14 00833 g006
Figure 7. Spatial autocorrelation of ecosystem service value.
Land 14 00833 g007
Figure 8. Heatmap of contribution of driving factors to land use conversion.
Land 14 00833 g008
Figure 9. Land use forecast maps for multiple scenarios.
Land 14 00833 g009
Figure 10. Ecological service value classification map under different scenarios.
Land 14 00833 g010
Figure 11. Changes in ecological service value of various land types.
Land 14 00833 g011
Table 1. Ecosystem service values in the study area (CNY per hectare).
Ecosystem ClassificationProvisioning ServicesRegulating ServicesSupporting ServicesCultural Services
Farmland99.846622.381874.68166.39
Forest5025.0257,782.2320,477.254115.42
Grassland4548.0444,398.8015,463.324586.86
Water14,731.20150,334.749695.084819.81
Urban0.000.000.002251.83
Bareland66.56976.16332.7866.56
Table 2. Land use demand forecast table (pixel count, 1 = 900 m2).
FarmlandForestGrasslandWaterUrbanBareland
20201,058,735235,7892,175,62423,751123,63640,246
Natural Development 20301,031,500237,7052,166,70028,488158,74434,644
Farmland Protection 20301,076,620237,8062,146,25027,950134,76534,390
Economic Development 20301,015,067237,4332,162,34128,195180,32934,416
Disclaimer/Publisher’s Note: The statements, opinions and data contained in all publications are solely those of the individual author(s) and contributor(s) and not of MDPI and/or the editor(s). MDPI and/or the editor(s) disclaim responsibility for any injury to people or property resulting from any ideas, methods, instructions or products referred to in the content.

