Abstract
As a pivotal area in the context of global climate change, central Asia exerts a crucial influence on tackling climate change and preserving regional ecological equilibrium via the carbon sink capacity of its ecosystem. In this study, the patch-level land use simulation model was employed to predict land use changes in central Asia under three different scenarios: agricultural priority, urbanized priority, and ecological priority. Subsequently, the integrated valuation of ecosystem services and trade-offs evaluation model is utilized to analyze variations in ecosystem carbon storage for each scenario. Finally, the multiscale geographic weighted regression model is used to identify the main driving factors influencing carbon storage changes. The findings indicate the following: (1) In the ecological priority scenario, a balance is struck between urban expansion and resource environment protection within ecological spaces. Conversely, in the urbanized priority and agricultural priority scenarios, ecological spaces experience a reduction. (2) The simulation results of carbon storage in 2060 under different scenarios suggest that the ecological priority scenario will see the largest increase in carbon storage, amounting to 1.076 × 10⁸ t. (3) The digital elevation model, precipitation, slope gradient, and temperature contribute relatively more significantly to the carbon storage in central Asia. The findings emphasize the necessity of enhancing carbon storage through ecological space protection and rational land use management, providing scientific evidence for the formulation of regional carbon management and ecological protection policies.
1. Introduction
As the global economy progresses, the issues of the greenhouse effect and global warming have grown more pronounced, capturing the attention of nations worldwide. Central Asian countries such as Kazakhstan have set the goal of achieving carbon neutrality by 2060, which will bring new momentum to global climate governance. Carbon neutrality implies that the ecosystem is capable of counterbalancing the aggregate volume of greenhouse gas emissions, thus achieving “zero” net carbon dioxide emissions. There are two primary approaches to addressing carbon neutrality: controlling CO₂ emissions and enhancing the environmental absorption of CO₂ through carbon sinks [1]. A carbon sink pertains to the process of sequestering CO₂ from the atmosphere and diminishing the concentration of greenhouse gases in the atmosphere via means like afforestation and vegetation rehabilitation. Functioning as vital ecological processes, these mechanisms facilitate atmospheric CO₂ absorption and storage, playing key roles in preserving planetary carbon equilibrium, improving biological carbon storage potential, and alleviating climate change impacts. Through photosynthetic activities, plant life converts atmospheric CO₂ into organic compounds stored in living matter, forming a fundamental component of biological carbon sequestration systems. The soil, regarded as a vast carbon reservoir, holds a substantial quantity of organic carbon, and variations in its carbon density significantly influence the carbon sequestration capacity of the entire ecosystem. These interconnected processes collectively constitute essential manifestations of ecological carbon sinks, holding critical importance for regulating atmospheric CO₂ concentrations and sustaining Earth’s climatic equilibrium.
A critical driving factor underlying the serious environmental issue of global warming is the substantial release of carbon dioxide. Among a multitude of influencing factors, alterations in land use and land cover (LULC) play a pivotal role in shaping ecosystems’ carbon storage capabilities. The Sixth Assessment Report by the Intergovernmental Panel on Climate Change (IPCC) highlights that between 2011 and 2020, such LULC transitions contributed to an annual net carbon release averaging 1.4 ± 0.7 Pg C [2,3]. Land cover change is of great importance as it not only dictates the increase or decrease in vegetation carbon sequestration but also directly impacts the alteration of soil carbon density resulting from soil modifications [4]. This indicates that changes in land use configurations, including the conversion of natural ecosystems to agricultural or built-up areas, may substantially influence the ability of ecosystems to sequester carbon.
This underscores that modifications in land utilization arrangements, including the transformation of natural habitats into agricultural or urban zones, can profoundly impact the capacity of ecosystems to store carbon. This factor is critical for assessing and projecting the carbon storage capabilities of plant communities and soil environments across diverse ecosystems. This understanding also helps in determining the carbon sink status and formulating reasonable policies and measures to address global climate change [5]. Acting as a critical metric for assessing ecosystems’ carbon storage potential, the spatial-temporal dynamics of carbon density directly reflect the evolving modifications of ecological carbon sink functions and are essential for gaining in-depth insights into the carbon sequestration mechanism. Within regional contexts, changes in vegetation cover across central Asia exert a substantial influence on local carbon cycling processes, thereby affecting global carbon dynamics [6]. Precisely modeling the future spatial arrangement of land use holds critical practical importance for analyzing changes in ecosystem service values [7].
For the in-depth exploration of land use change simulation, a plethora of simulation models have come into being, including the Markov model [8], cellular automata (CA) model [9], system dynamics (SDs) model [10], future land use simulation (FLUS) model, patch-level land use simulation (PLUS) model, and mixed-cell cellular automata (MCCA) model [5]. Among them, the parallelized land use simulation (PLUS) model, which combines the Markov CA model and the random forest classification (RFC) prediction method [11], has been widely applied due to its advantages such as strong reliability and robustness, and the high similarity between its landscape pattern indicators and the real landscape [12]. The PLUS model uncovers the diversity of land use structures and depicts changes in land use structures with greater accuracy [13]. It mainly comprises the land expansion analysis strategy (LEAS) grounded in driving factors and the cellular automata model based on multi-type random patch seeds (CARS) [14]. The LEAS module is capable of extracting and expanding components of different land uses during two phases of land use change and sampling the augmented portions. It utilizes a random forest algorithm to disclose the driving forces behind the expansion of each land use type and the development probabilities of each type. The CARS module combines random seed initialization with threshold adjustment processes to simulate the self-driven emergence of patches constrained by development probability rules [15]. Moreover, the InVEST model has been extensively adopted because of its efficacy in uncovering the relationship between land use change and carbon sequestration change, along with its benefits like low data requirements and rapid operation speed, and easy spatiotemporal visualization [16]. Accurately understanding the carbon storage capacity through these models is of great significance for our research.
Central Asia, which serves as the core region for global desertification, has approximately 75% of its land area in arid zones [17]. Terrestrial ecosystems in arid areas are generally fragile and highly susceptible to external disruptions. At present, studies regarding how land cover change in arid regions influences vegetation carbon sources/sinks and subsequently affects carbon storage are relatively scarce. Most studies focus on carbon exchanges within specific terrestrial ecosystems (e.g., grasslands and forests), yet few comparative analyses exist regarding interactions between different ecosystem types and their implications for carbon accumulation [18]. However, arid land ecosystems play a crucial role in the global carbon cycle and are shaped by the combined impacts of climate change and anthropogenic factors, thereby profoundly affecting carbon storage dynamics in global ecological systems [19].
Existing studies lack a comprehensive understanding of the spatiotemporal patterns of ecological space carbon sinks in central Asia, their driving mechanisms, and implications for regional carbon storage. While some research has addressed land use changes and carbon storage, systematic scenario-based simulations of carbon sinks and storage in central Asia are lacking. Different climate change and land use planning scenarios will drastically alter ecosystem structures and functions, thereby affecting carbon storage capacities. Therefore, multi-scenario carbon sink simulations can more thoroughly reveal trends in carbon sinks and storage under varying conditions, providing robust support for understanding regional carbon cycles, assessing climate impacts, and formulating science-based ecological policies. This study aims to simulate and predict central Asian land cover types in 2060 and investigate the spatiotemporal dynamics of ecological space carbon sinks and their driving factors, contributing to the improved understanding of regional carbon cycles, climate impact assessments, and policy formulation.
2. Data and Methods
2.1. Overview of the Study Area
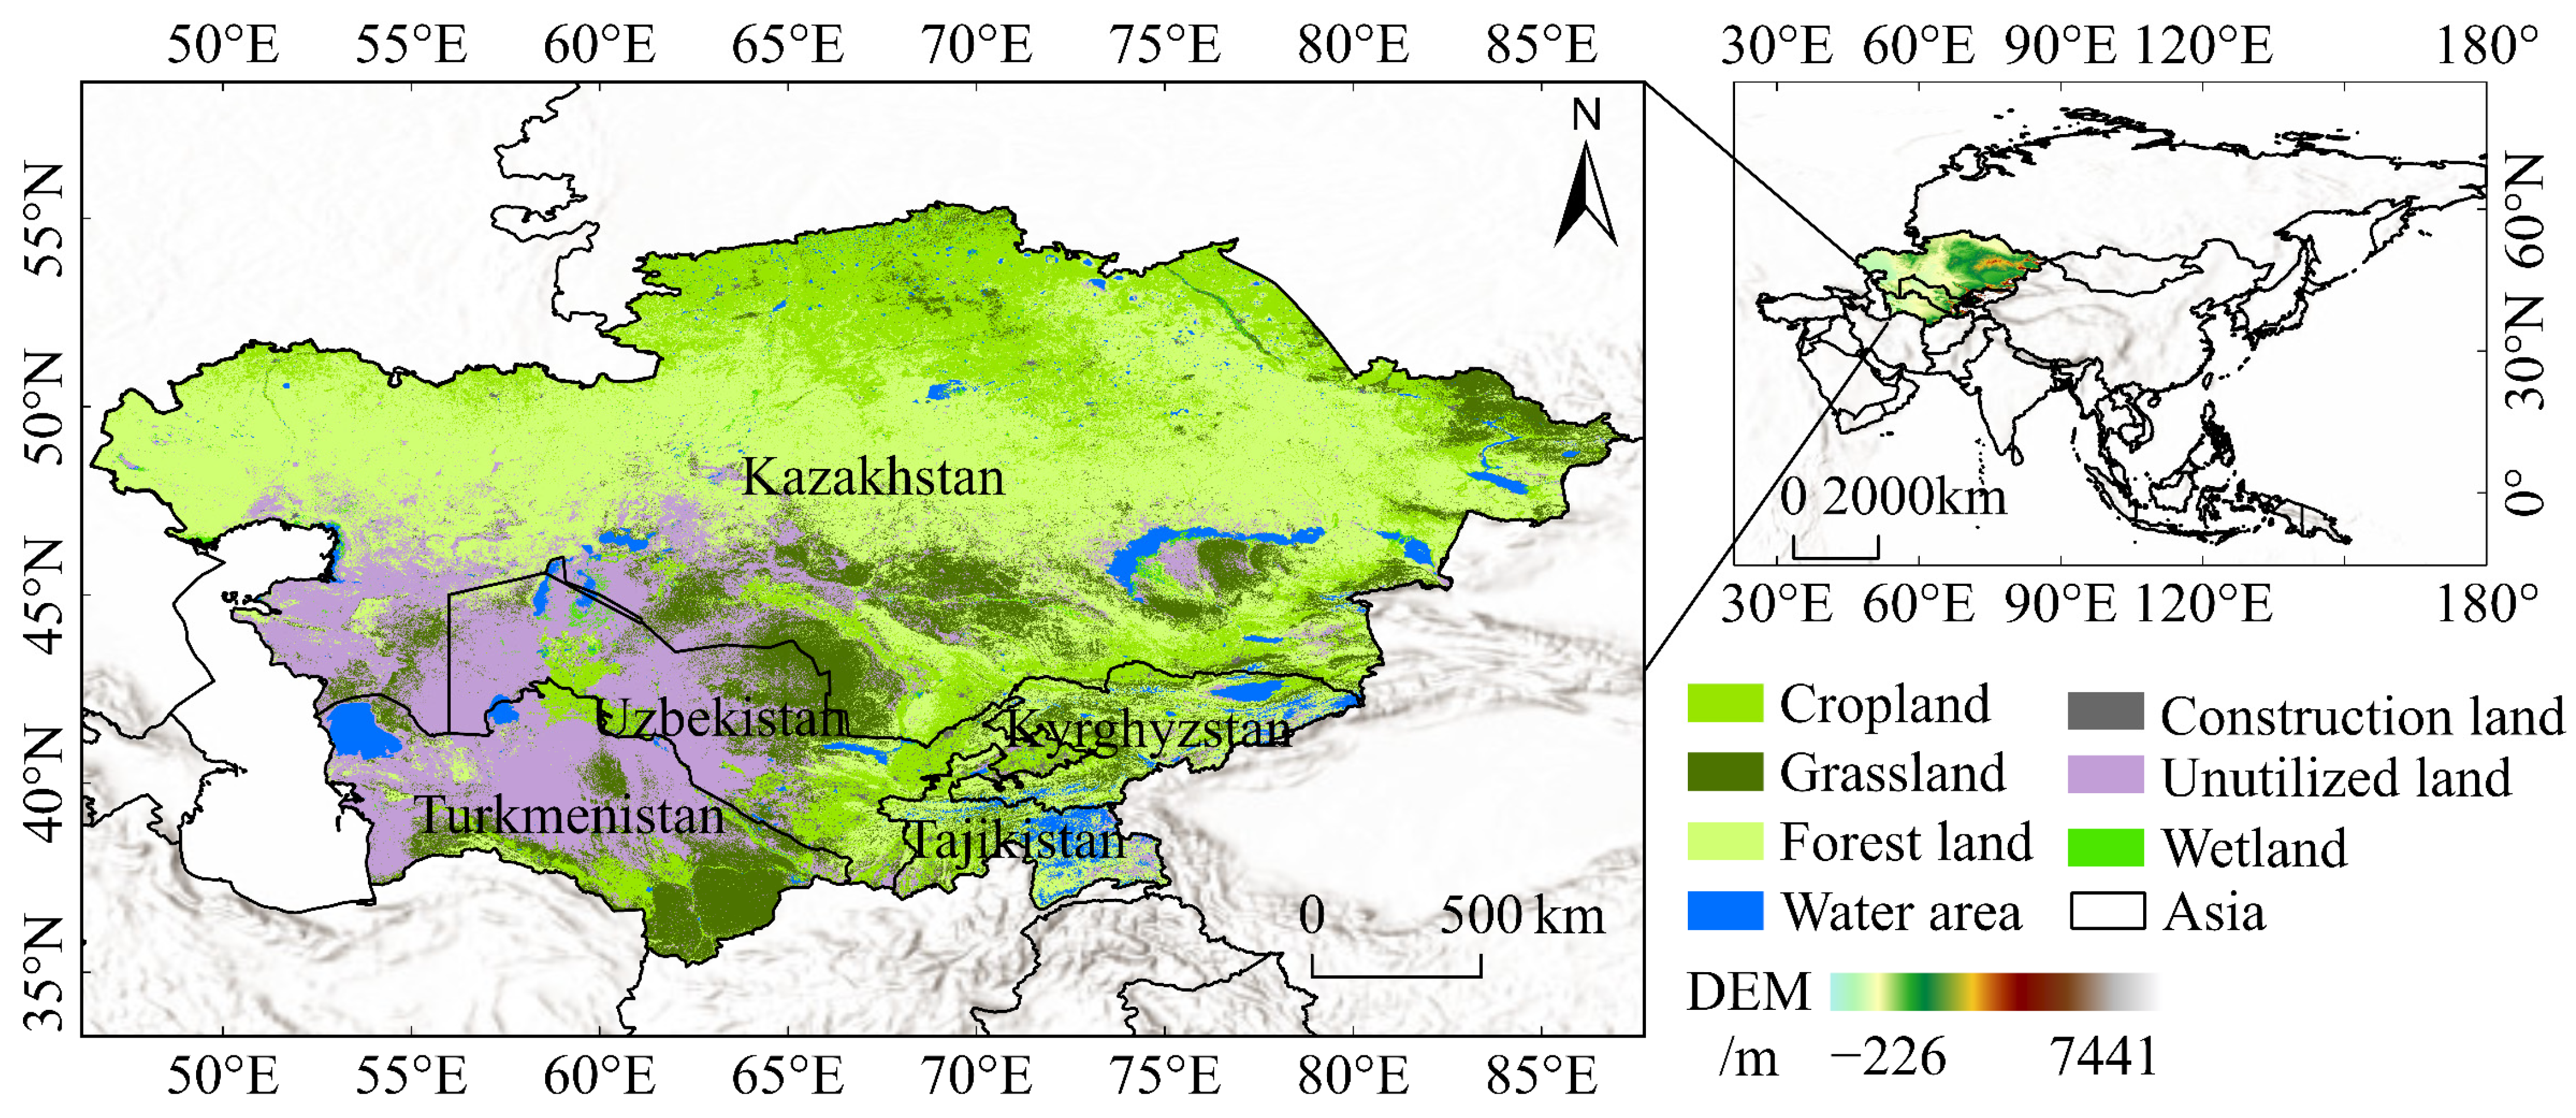
The study area (Figure 1) encompasses the five central Asian countries (35°08′ N ~ 55°25′ N, 46°28′ E ~ 87°29′ E), These countries are Kazakhstan, Kyrgyzstan, Tajikistan, Turkmenistan, and Uzbekistan [18]. Located in the central part of the Eurasian continent, central Asia is far from the ocean and is one of the largest arid regions in the mid-latitudes of the world [20]. Deserts, semi deserts, and grasslands span a large area between the Caspian Sea and the Tianshan Mountains. Central Asia has a population of nearly 75 million, primarily concentrated around the Fergana Valley [21]. The region features a typical continental climate of an inland arid zone, with cold winters and hot summers, and annual precipitation varying from 125 to 289 mm [22]. There are significant seasonal variations in precipitation, the precipitation has the widest coverage in summer, and the average precipitation is the smallest in autumn [23], with a low relative humidity and a persistent deficit in soil moisture [24]. Southeast central Asia is elevated, while the northwest is lower, primarily consisting of plains. However, the terrain is complex and diverse, with a fragile ecological environment and sparse vegetation. In some areas, land degradation has occurred, with significant issues related to dust and salt [17]. In recent years, rapid urbanization and agricultural activities in the region have placed tremendous pressure on ecological environmental protection.
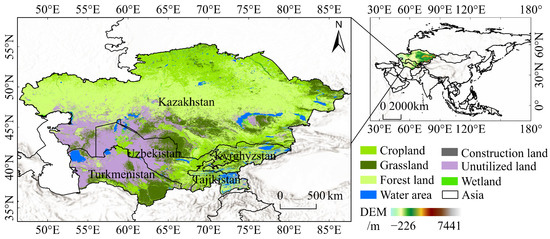
Figure 1.
Overview of the central Asia Study Area (Note: The left figure is the land cover type map of central Asia in 2020, and the right figure is the Digital Elevation Model (DEM). Source of the vector boundary of central Asia: http://www.ncdc.ac.cn.
2.2. Data
As presented in Table 1, the data utilized in this study are categorized into four types. The land use data consist of a globally recognized remote sensing product with a long time span and detailed classification system at a 30 m resolution. The team led by Liu Liangyun [25] carried out a quantitative evaluation of this dataset, utilizing more than 85,000 global validation samples. They found that the basic classification system (including 10 main land cover types) had an overall accuracy rate of 80.88% (± 0.27%), and the LCCS Level 1 validation system (comprising 17 LCCS land cover types) attained an accuracy of 73.24% (±0.30%). Overall, 35 land cover categories were classified based on standards and scientific relevance into cropland, forest land, grassland, water area, wetlands, built-up areas, and unused land, such as forest land, grassland, water bodies, wetlands, and unused land [26].

Table 1.
The source of experimental data and related information.
Taking into account the current situation in central Asia, seven kinds of natural and socio-economic driving factor data were chosen. Among the natural factors, ten elements were selected: temperature, precipitation, soil type, digital elevation model (DEM), slope, aspect, distance to local roads, distance to railways, distance to highways, and distance to towns. As for socio economic factors, population and gross domestic product (GDP) were selected. Moreover, water body data were incorporated as a restrictive factor within the framework of ecological protection scenarios. All the data were global raster data. The central Asian data, which have a uniform resolution of 250 m and adopt the WGS-84 coordinate system, were acquired via cropping and resampling.
2.3. The Model and Its Related Parameters
This research is structured into three primary components: (1) by employing the PLUS model under three distinct scenarios emphasizing urbanized priority, ecological priority, and agricultural priority, respectively, the evolution and transformation of land use in central Asia in 2060 are forecasted; (2) utilizing the InVEST model to assess carbon storage across the three scenarios; and (3) applying the MGWR model to examine the factors influencing carbon sink variations (Figure 2).
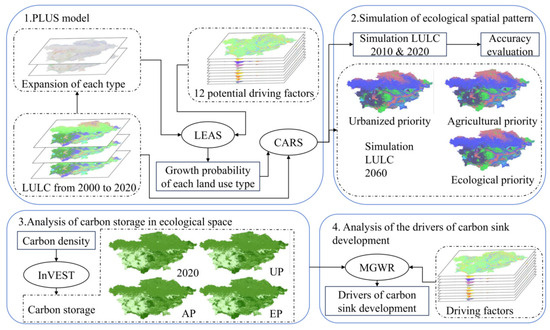
Figure 2.
The overall process of the experiment.
2.3.1. Multi-Scenario Simulation
Land use undergoes a complex transformation process. The PLUS model is deployed to simulate the future spatial configuration of land use in central Asia under various development scenarios [27]. Drawing on Xiong Jinhuai’s parameters for the multi-scenario simulation of urban expansion in the central Asian region within the framework of the Belt and Road Initiative [15], the simulation parameters for three scenarios—urban development, farmland protection, and ecological protection—are modified in terms of the following: land use neighborhood weights, conversion cost matrix (Table 2), spatial constraints, and expected land use structure, as detailed below:
- (1)
- Urbanized priority (UP): This scenario mirrors a high intensity urbanization progression, where rapid socio-economic development serves as the primary objective. The percentage of bare land transformed into built-up areas rises by 50%, whereas the conversion of farmland, forest land, grassland, and wetlands into built-up areas escalates by 20%. The conversion of built-up land to other types, with the exception of farmland, diminishes by 30%;
- (2)
- Agricultural priority (AP): This scenario places emphasis on food security and the safeguarding of farmland resources to guarantee long-term agricultural sustainability. Raise the conversion rate of grassland, wetland, and bare land to cultivated land by 20%, and cut the conversion rate of cultivated land to construction land by 50%;
- (3)
- Ecological priority (EP): This scenario gives precedence to ecological environmental protection, striving for harmonious development between socio-economic factors and nature. The percentage of land transformed from forest, grassland, wetlands, and water areas grows by 30%. The transformation of forest, grassland, and wetlands into built-up areas reduces by 50%. The transformation of farmland into forest, grassland, and wetlands grows by 20%. Habitat degradation is strictly prohibited, and regional water bodies are considered as limitations to curb their development, with the cost matrix for transforming water bodies into other types fixed at 0;
- (4)
- Neighborhood weights: The importance of sampling points and the degree of mutual influence among them are measured using domain weights, which reflect the strength of the association between a specific sample and its adjacent samples. The specific weights are as follows: cultivated land (0.7), grassland (0.56), forest land (0.5), water area (0.46), construction land (1), unutilized land (0.27), and wetland (0.52).
Table 2.
Conversion Cost Matrix.
Table 2.
Conversion Cost Matrix.
| Land Use Type | Urbanized Priority | Agricultural Priority | Ecological Priority | ||||||||||||||||||
|---|---|---|---|---|---|---|---|---|---|---|---|---|---|---|---|---|---|---|---|---|---|
| A | B | C | D | E | F | G | A | B | C | D | E | F | G | A | B | C | D | E | F | G | |
| A | 1 | 0 | 0 | 0 | 1 | 0 | 0 | 1 | 0 | 0 | 0 | 0 | 0 | 0 | 1 | 1 | 1 | 1 | 1 | 1 | 1 |
| B | 1 | 1 | 0 | 0 | 1 | 0 | 0 | 1 | 1 | 1 | 0 | 0 | 1 | 1 | 0 | 1 | 0 | 0 | 0 | 0 | 0 |
| C | 1 | 0 | 1 | 0 | 1 | 0 | 1 | 1 | 1 | 1 | 1 | 1 | 1 | 1 | 0 | 1 | 1 | 1 | 0 | 0 | 1 |
| D | 1 | 1 | 1 | 1 | 1 | 0 | 1 | 1 | 0 | 1 | 1 | 0 | 1 | 1 | 0 | 0 | 1 | 1 | 0 | 0 | 0 |
| E | 0 | 0 | 0 | 0 | 1 | 0 | 0 | 0 | 0 | 0 | 0 | 1 | 0 | 0 | 0 | 0 | 0 | 0 | 1 | 0 | 0 |
| F | 1 | 1 | 1 | 1 | 1 | 1 | 1 | 1 | 1 | 1 | 1 | 1 | 1 | 1 | 1 | 1 | 1 | 1 | 1 | 1 | 1 |
| G | 1 | 0 | 1 | 1 | 1 | 0 | 1 | 1 | 1 | 1 | 1 | 1 | 1 | 1 | 0 | 1 | 1 | 1 | 0 | 0 | 1 |
Note: A is cropland, B is forest land, C is grassland, D is water area, E is construction land, F is unutilized land, and G is wetland.
2.3.2. PLUS Model
This study employs the PLUS model to simulate land use transformations in central Asia under three distinct scenarios in 2060.
To ensure a high spatial accuracy in the land cover simulation, the Kappa coefficient, overall accuracy, and figure of merit (FOM) coefficient are used for accuracy validation. The calculation formulas are as follows:
In the formula, denotes the overall accuracy; N stands for the total number of samples; indicates the number of correctly classified samples for land type k; signifies the chance agreement between the predicted land use data and the actual data; A represents the cells where the real data changed, but the simulation predicted them as constant; B indicates the number of cells in which both the actual data and the simulation exhibited change, and the changes were consistent; C indicates the number of cells where the real data changed, and the simulation also showed change, but the change was classified into an incorrect category; and D represents the cells where the real data remained constant, but the simulation predicted change.
The nearer the overall accuracy and Kappa coefficient approach to 1, the superior the simulation outcomes and the greater the model’s precision. The FOM coefficient spans from 0 to 1, and the greater the value, the more congruence exists between the simulated values and the actual values [4]. In this study, the overall accuracy is 0.82, the Kappa coefficient is 0.78, and the FOM coefficient is 0.13. This suggests that using the PLUS model for land cover simulation in central Asia is feasible, and the analyses and calculations based on this simulation provide valuable references for the study of the actual land cover in central Asia.
In addition, after completing the simulation of land use change, it is necessary to analyze the growth rate of land use change, and the formula is as follows:
In this formula, r represents the growth rate, y’ represents the area of the corresponding land use type in the current year, and y represents the area of the same land use type in the comparison year.
2.3.3. InVEST Model
The InVEST model utilizes land use data and carbon density values to assess the carbon sequestration amount for each pixel [28]. The carbon sequestration of an ecosystem is computed by multiplying the average carbon density of the four carbon pools (aboveground biomass, belowground biomass, 0–100 cm soil organic matter, and dead organic matter) for each land use type by the respective area [29]. The calculation formula is as follows:
In these formulas, C represents the carbon density for each land cover type, Cabove is the aboveground biomass carbon density, Cbelow is the belowground biomass carbon density, Csoil is the soil organic matter carbon density, and Cdead is the dead organic matter carbon density. Ak is the area of each land cover type, and Ctotal is the total carbon storage.
In this study, carbon density data for various land use types in central Asia are mainly obtained by referring to relevant literature [5,21,30,31], as shown in Table 3.
Table 3.
Carbon Density of Different Land Use Types (t C/ha).
2.3.4. MGWR Model
As an expansion of conventional linear regression models, geographically weighted regression (GWR) integrates the spatial positioning of the data into the regression coefficients. Through the estimation of local parameters, it assesses how the relationship between independent and dependent variables fluctuates across spatial extents, thus rendering it a local statistical model [32]. The multiscale geographically weighted regression (MGWR) is the most recent expansion of GWR, deriving spatial relationships based on diverse spatial scale parameters [2]. The MGWR model iteratively refines the optimal bandwidth and local estimation coefficients for each additive component of the independent variables within the model, leading to enhanced adaptability and robustness [33], resulting in higher adaptability and robustness [34]. The calculation formula is as follows:
In the formula, Yi is the carbon storage per unit area (dependent variable); (ui−vi) represents the spatial geographic coordinates; xij denotes the natural or socioeconomic factors, hk is the bandwidth of the k-th independent variable, which determines the range of variation of its spatial scale.; β0(ui,vi) is the parameter; k is the total number of spatial units involved in the analysis; ԑi is the random error term; and βbwj(ui,vi) is the local regression coefficient for the j-th independent variable at location i.
3. Results
3.1. Changes in Ecological Spatial Patterns
3.1.1. Simulation of Development Trends in Ecological Spatial Patterns
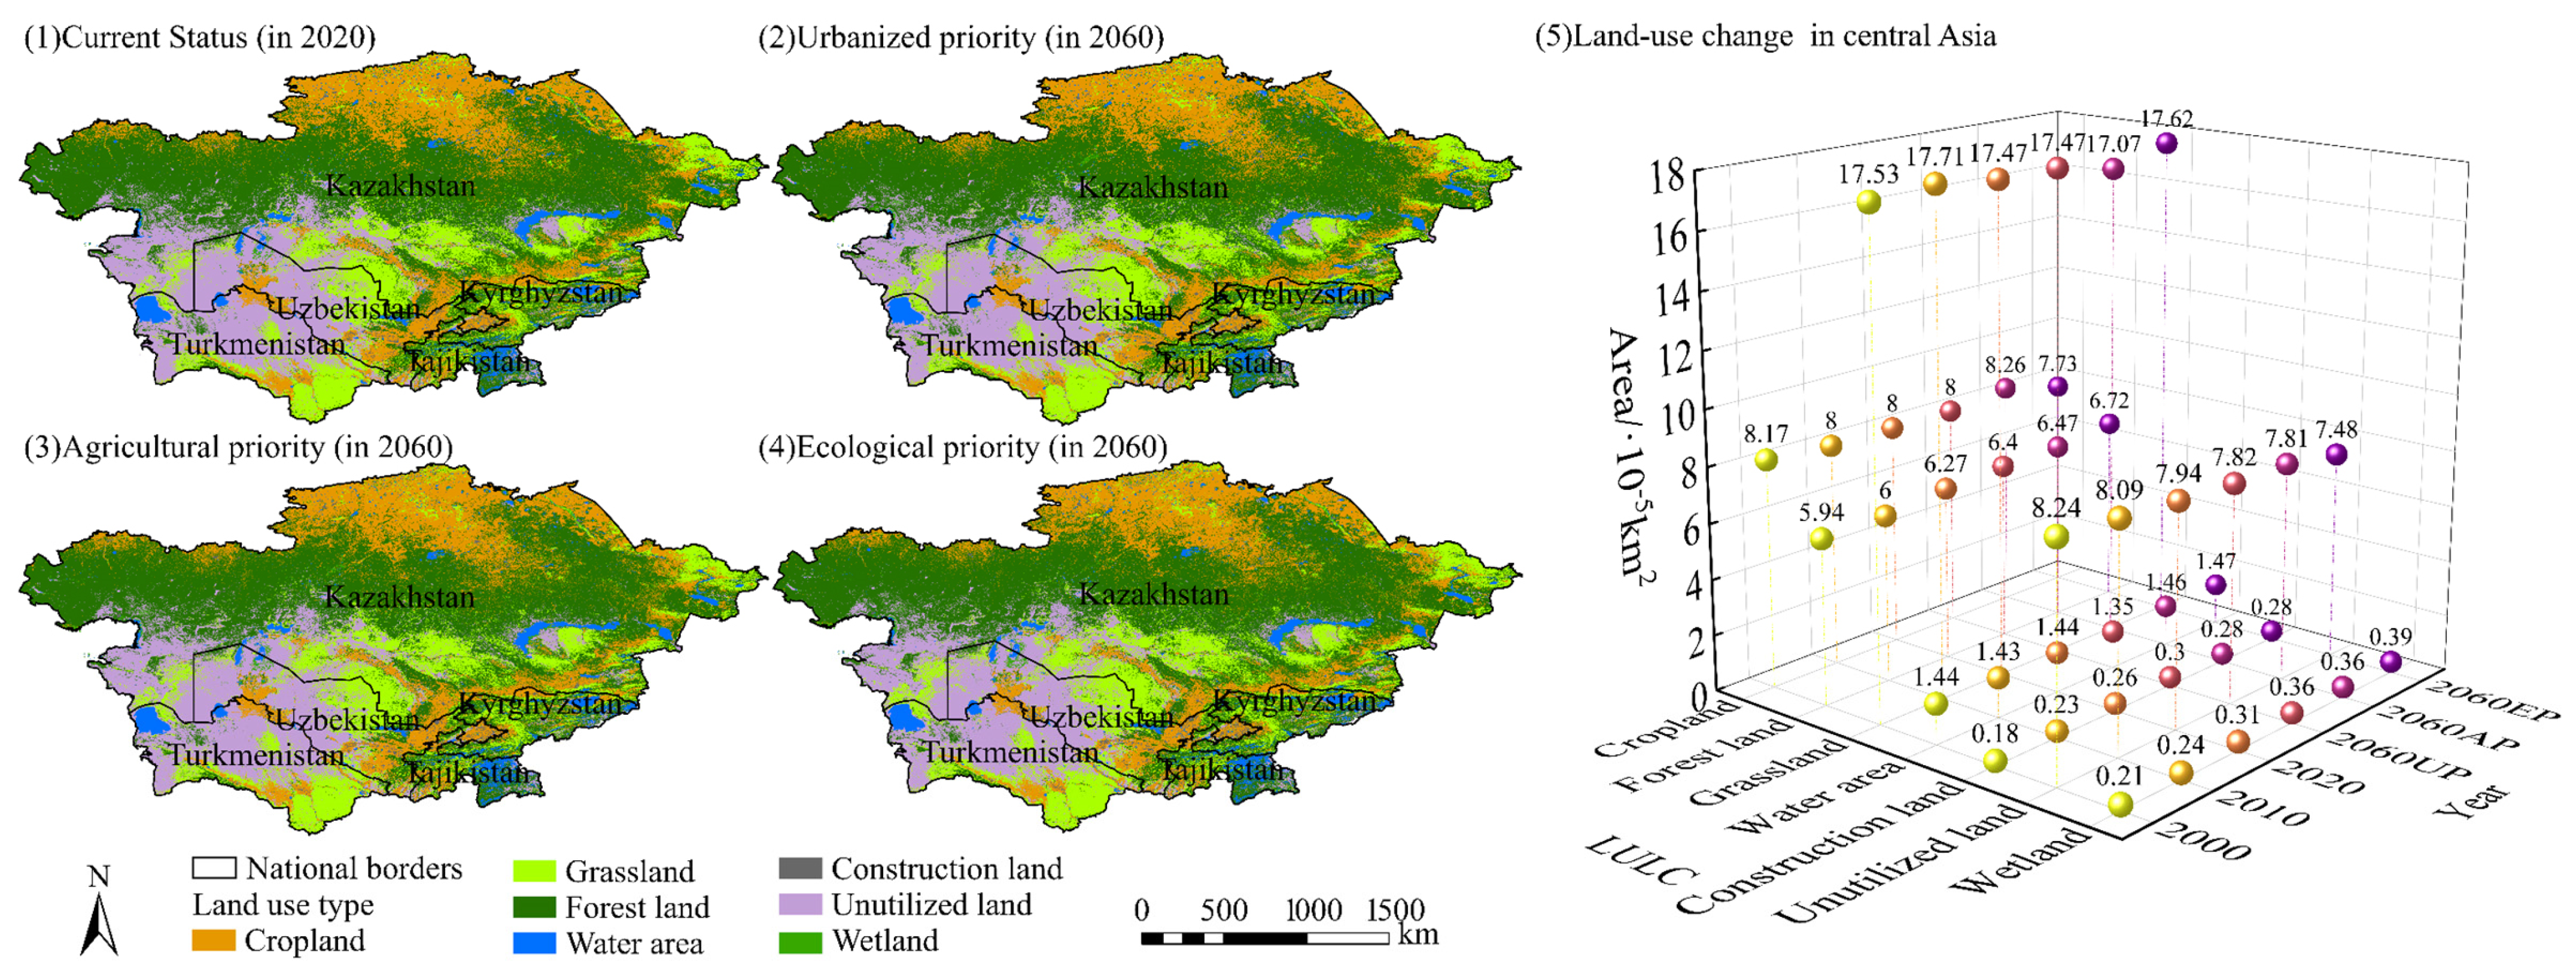
The PLUS model simulated land use transformations in central Asia by 2060 across various scenarios, monitoring alterations in ecological space. The simulation outcomes of land use types under diverse scenarios are presented in Figure 3. Ecological space is extensively spread across central Asia, constituting over 79% of the total land area. The specific composition ratios of ecological space are shown in Table 4.
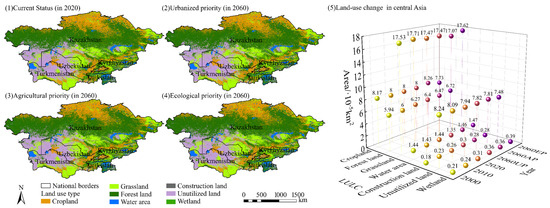
Figure 3.
Simulation results of scenarios in central Asia in 2060.
Table 4.
Ecological space composition area (×10⁵ km2) and proportion.
3.1.2. Changes in Ecological Space Patterns Under Different Scenarios
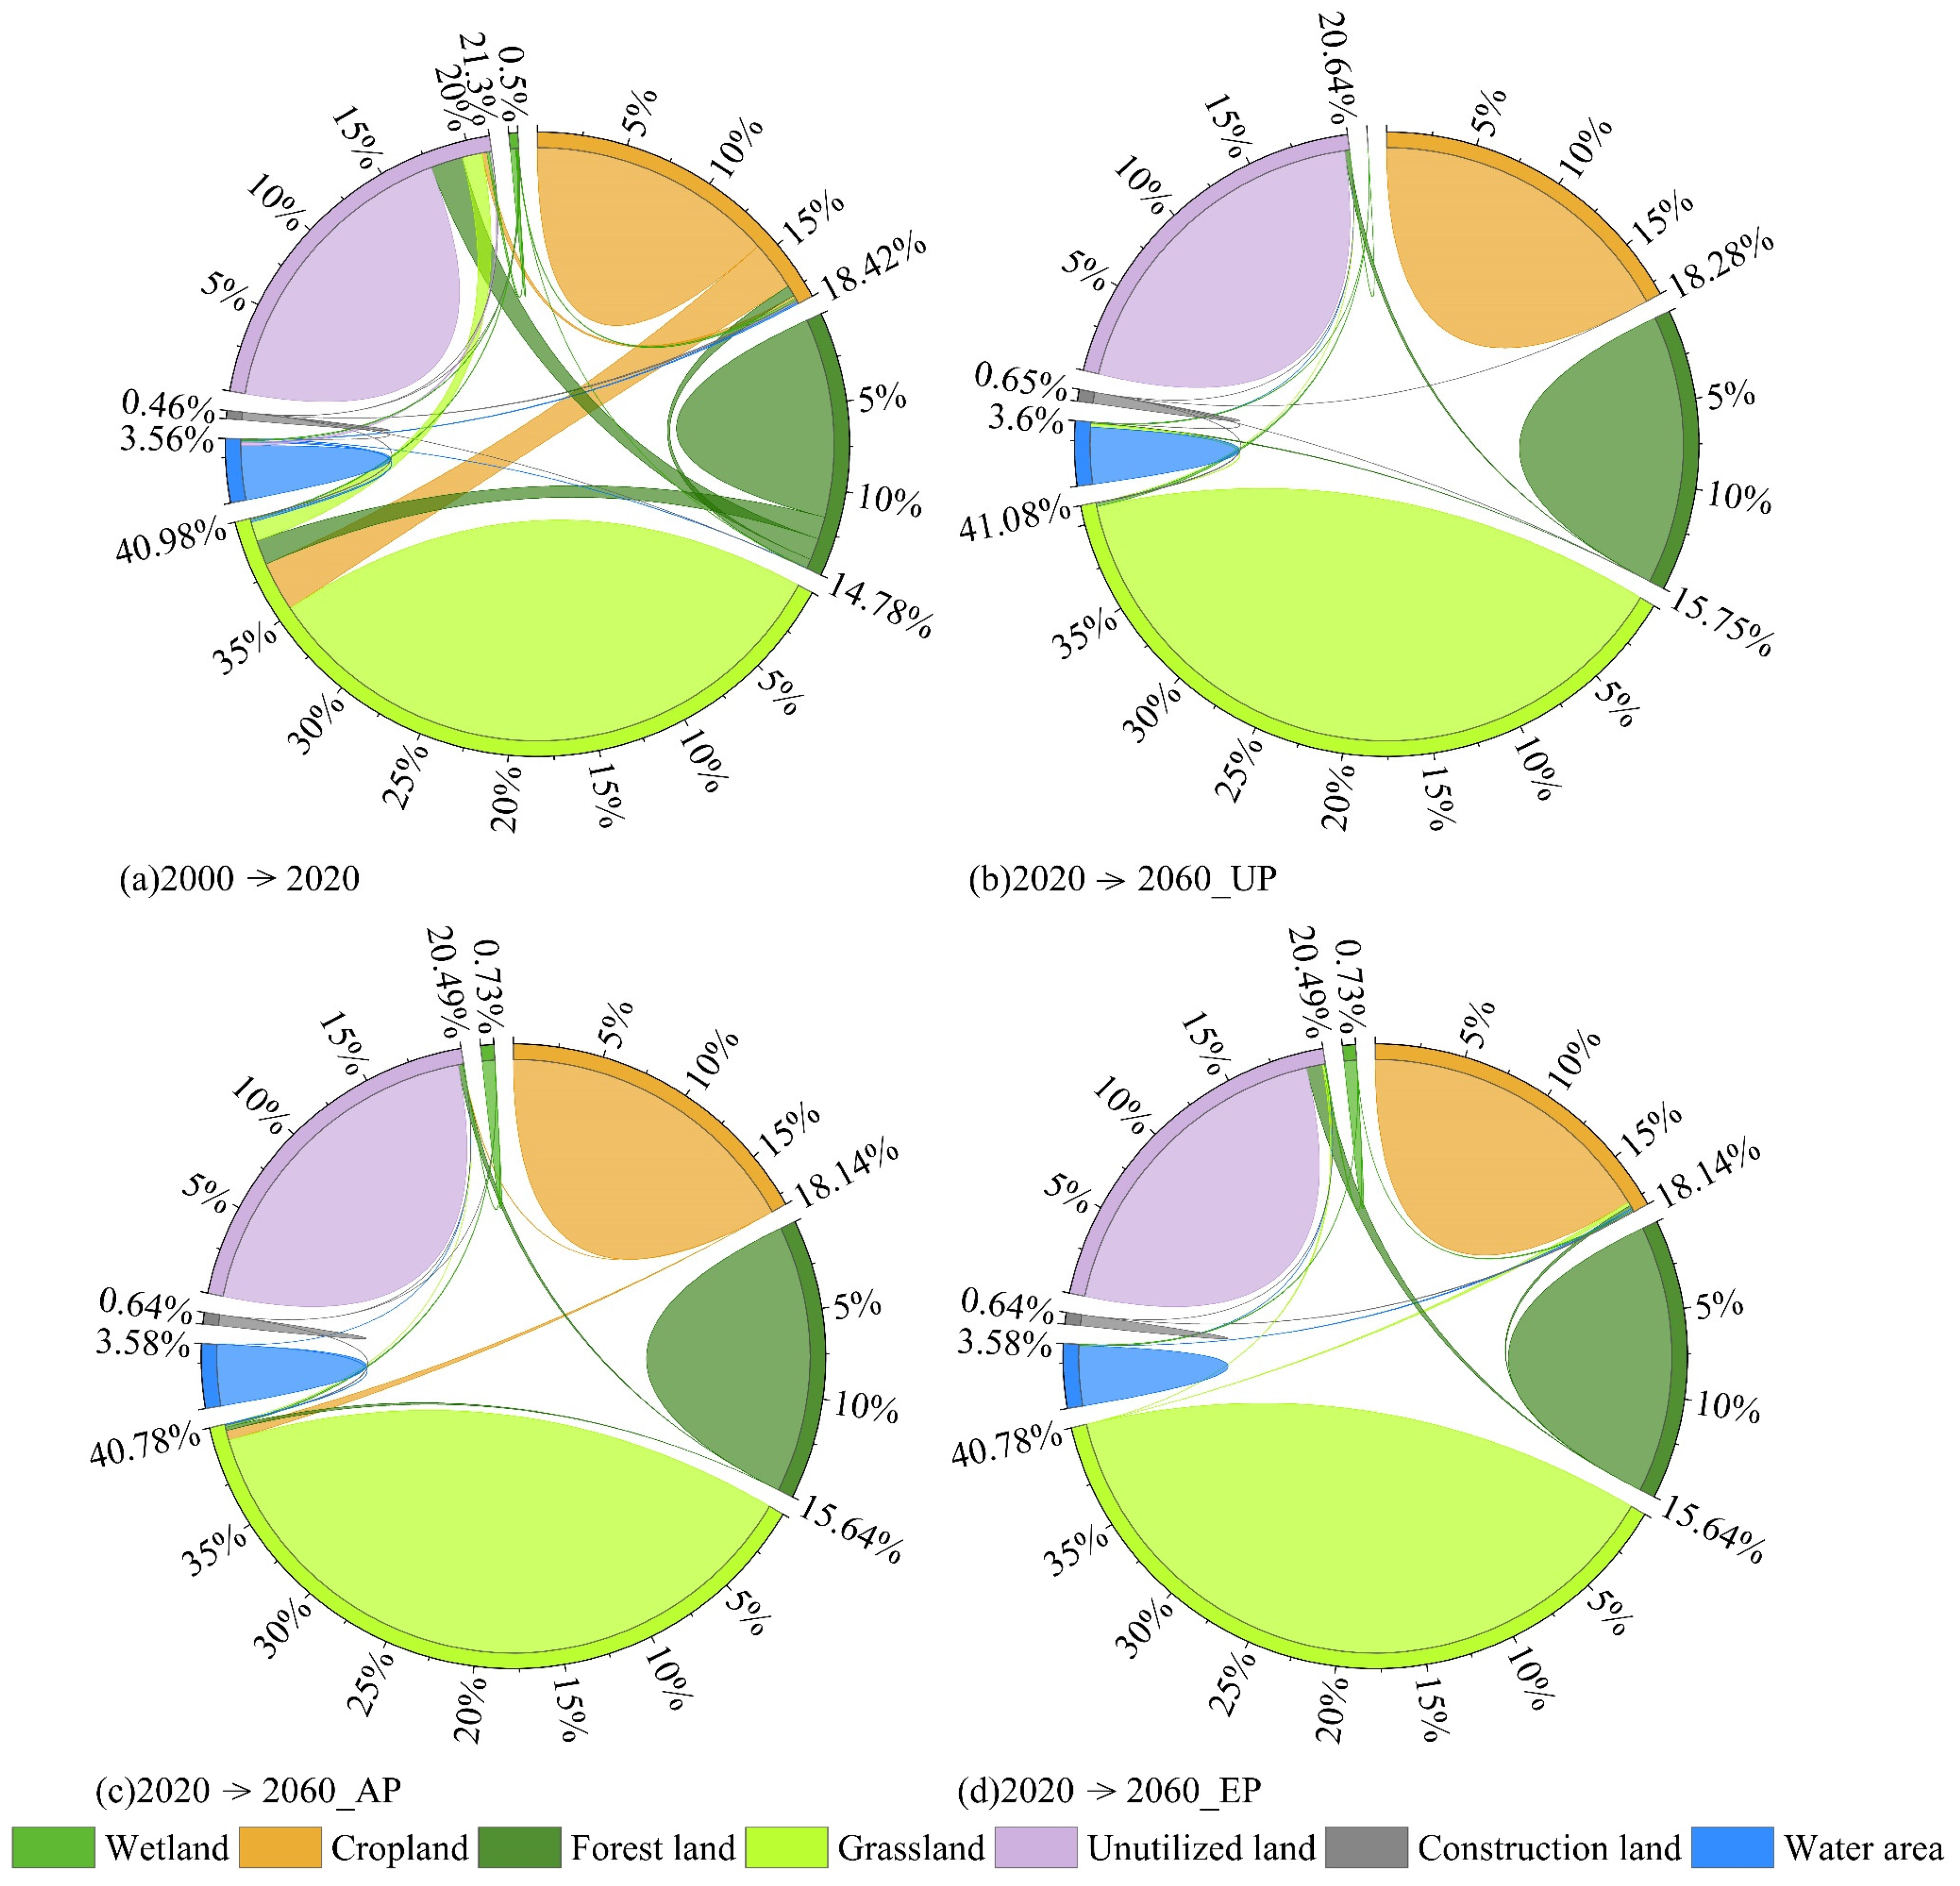
From 2000 to 2020, urbanization represented by construction land increased from 0.44% to 0.62%, while agricultural space represented by cropland decreased from 19.58% to 19.19%. Meanwhile, the total ecological space proportion increased from 79.97% to 80.19%, with forest land and wetlands—areas with high ecosystem service value—showing notable growth. Compared with the year 2000, in 2020, the most significant changes occurred in forest land and unutilized land, followed by wetlands and cropland; the wetland has the highest growth rate, with an increase of 47.62%. The reduction in unutilized land is mainly due to its conversion into forest land, grassland, and cropland (Figure 4).
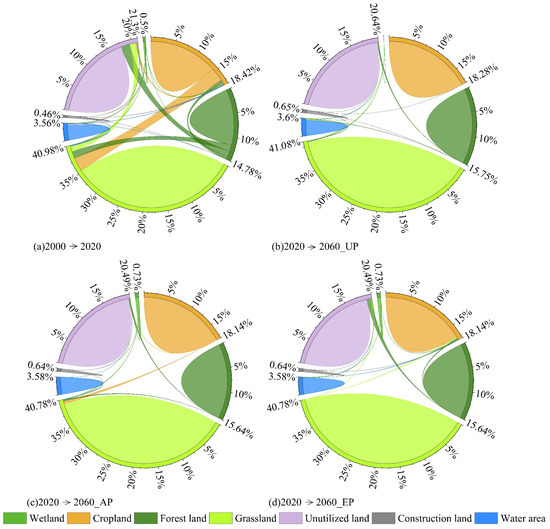
Figure 4.
Land use conversion.
Under the urbanized priority scenario, by 2060, construction land will increase from 0.62% to 0.71%, agricultural space will slightly decrease from 19.19% to 19.18%, and ecological space will decline from 80.19% to 80.10%. Most of the significant changes occur around urban areas, where the expansion of construction land will lead to a decrease in ecological quality. The urbanization expansion in Tajikistan and Kyrgyzstan is relatively prominent, followed by that in Uzbekistan and Kazakhstan, while the expansion in Turkmenistan is relatively small (Table 5). Many countries are implementing strategies to mitigate the negative effects of urban expansion through natural ecosystem protection, sustainable urban planning, and green infrastructure development.
Table 5.
The proportion of different land use changes in various central Asian countries (%).
Under the agricultural priority scenario, cropland is expected to increase from 19.19% to 19.82%, while ecological space will decrease from 80.19% to 79.51%, and urban space will rise slightly to 0.67%. The expansion of agricultural space is relatively smaller in Turkmenistan and Tajikistan. The reduction in ecological space is mainly due to the conversion of grassland and unused land into cultivated land. There are significant changes in the boundary areas of ecological space. Such a transformation will lead to the loss of habitats, pose a threat to the local biodiversity, and further affect the ecological environment.
Under the ecological priority scenario, ecological space will increase from 80.19% to 80.78%, while agricultural space will decline from 19.19% to 18.54%, and urban space will grow slightly to 0.67%. Ecological space expansion will be relatively limited in Tajikistan and Kyrgyzstan. Despite the continued urban expansion, the agricultural space will decrease, and ecological space will be better protected. However, the increase in ecological space will be moderate, as the demand for construction land and agricultural development driven by urban growth may conflict with ecological expansion, emphasizing the need for long-term planning and ongoing efforts in ecological protection.
3.2. Carbon Storage Analysis
3.2.1. Carbon Storage Change Characteristics and Simulation Results
From 2000 to 2020, carbon storage in central Asia exhibited an increasing trend, with a total increase of 0.82 × 10⁹ t. The expansion of ecological space and the decline in cropland were the main drivers of this growth, resulting in a rapid growth in carbon storage. Moreover, the ongoing spread of urban areas caused a steady growth in carbon storage in construction land.
As depicted in Figure 5, Uzbekistan and Turkmenistan possess more extensive areas of unutilized land, which is associated with their comparatively lower carbon storage levels than those of other countries. Overall, carbon sequestration in forested regions, construction land, and wetlands has been steadily on the rise, with significant growth in forest carbon sequestration. Grassland carbon sequestration witnessed a significant increase from 2000 to 2010 but decreased from 2010 to 2020. Nevertheless, it continues to play a predominant role in the overall carbon sequestration within ecological spaces. Ecological spaces account for around 81.86% of the total carbon sequestration, and the land use change features of these ecological spaces dictated the overall trend of carbon sequestration.
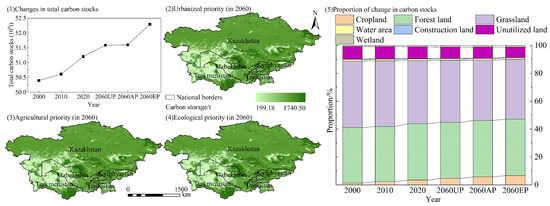
Figure 5.
Carbon Storage Distribution.
By 2060, the spatial distribution patterns of carbon sequestration under the three scenarios in central Asia are largely consistent. Nevertheless, discrepancies in land use changes among different scenarios resulted in variations in carbon sequestration levels (Figure 4). The estimated carbon sequestration amounts for the urbanized priority, agricultural priority, and ecological priority scenarios are 51.5884 × 10⁸ t, 51.6031 × 10⁸ t, and 52.2951 × 10⁸ t, respectively. The simulation outcomes of carbon sequestration in 2060 under various scenarios suggest that the ecological priority scenario experiences the greatest increase in carbon sequestration, reaching 1.076 × 10⁸ t. In comparison, the urbanized priority and agricultural priority scenarios demonstrate increases of 0.3829 × 10⁸ t and 0.3976 × 10⁸ t, respectively.
These findings imply that although carbon sequestration in central Asia is steadily increasing under various scenarios, the growth rate differs. Specifically, the ecological priority scenario shows the most substantial increase in carbon sequestration. This is primarily because of strengthened protective measures for ecological spaces, leading to significant increases in carbon sequestration in forests, grasslands, and wetlands. This trend indicates that the ecological priority scenario is the most efficient strategy for boosting carbon sequestration in central Asia.
3.2.2. Factors Influencing Carbon Storage Changes
Analyzing the ten driving factors of carbon sequestration changes with the MGWR model reveals that the influence extent of each factor on carbon sink pattern alterations has been determined. Among these factors, the digital elevation model (DEM), precipitation, slope, and temperature contribute relatively more significantly (Table 6). The regression coefficients of slope, precipitation, slope direction, temperature, GDP, distance to roads, and distance to railway are positive, whereas those of DEM, population density, and distance to highway are negative.
Table 6.
Factors Influencing Carbon Storage change.
4. Discussion
4.1. Land Use Changes in Central Asia
Against the backdrop of rapid global population growth, urban sprawl, and agricultural modernization, land use transformations are taking place rapidly, subsequently influencing regional ecosystems. This influence is especially evident in central Asia [19]. Currently, 60% of the population in central Asia is engaged in agricultural production, and the cropland has long been a vital agricultural area. However, due to water area scarcity, much of the farmland has been abandoned, resulting in a reduction in agricultural space in the region [35]. Urbanization in central Asia is gradually increasing (Figure 3). From 2000 to 2020, the area increased from 0.18 × 10⁻⁵ km2 to 0.26 × 10⁻⁵ km2, and urban populations have increased by 37.97% [36]. By 2060, this development trajectory, coupled with urban sprawl and escalating resource demands, will generate a compounded effect, potentially affecting regional ecological systems.
The analysis of ecosystem services in central Asia indicates that forest coverage is a significant factor influencing the supply of ecosystem services. Forests have strong carbon sequestration abilities and help control soil erosion. In recent years, the overall ecological service functions have been enhanced, with improvements noted in the ecosystem services of central Asia under climate conditions [30].
Additionally, Table 7 demonstrates the contribution degrees of influencing factors for various land use types. For cropland, precipitation has the highest contribution degree, followed by slope and temperature, indicating that the distribution of cropland is closely related to hydrothermal conditions and terrain. In forest land, temperature and precipitation show prominent contribution degrees, illustrating that the growth of forest land highly depends on climatic conditions. For grassland, precipitation and temperature have significant influences, reflecting that the distribution of grassland is restricted by moisture conditions. In water areas, DEM’s contribution degree far exceeds other factors, indicating that the distribution of water areas is most closely associated with terrain undulation. For construction land, GDP and population density have the highest contribution degrees, reflecting that the expansion of construction land is driven by economic development and population agglomeration. In unutilized land, precipitation has the most significant influence, followed by temperature, indicating that the distribution of unutilized land is related to regional hydrothermal conditions. In wetland, DEM has the highest contribution degree, followed by temperature, showing that the formation of wetland is closely related to terrain (such as low-lying water-accumulating areas) and moisture conditions. Overall, government agencies should strengthen the rational planning of land use, ensure the balanced development of the three types of spaces, and minimize disruptions to ecosystems caused by land development to improve ecological stability.
Table 7.
The influencing factors of various land use types revealed by the LEAS model.
4.2. Response Analysis of Carbon Storage
Many regions around the world have comprehensively carried out carbon balance assessments; however, due to limited data, there is less understanding of central Asia [21]. Fluctuations in carbon stock play a critical role in maintaining ecosystem stability and regional climate regulation across central Asia. The transition of land use has a strong impact on regional carbon storage. For instance, converting grasslands to croplands or built-up areas leads to a reduction in natural vegetation, which decreases the carbon sink capacity of the area. Moreover, climate change-induced extreme weather phenomena, including prolonged droughts and heatwaves, exacerbate the decline in carbon sequestration capabilities of forest, grassland, and wetland ecosystems [35]. However, the trend of increasing carbon storage in central Asia indicates that it is still possible to enhance the carbon absorption capacity of ecosystems through appropriate policy interventions and ecological restoration measures, thereby providing positive references for addressing global climate change. This further underscores the importance of protecting carbon storage in central Asia for global climate and ecosystem services.
The simulation results indicate that the carbon stock under the ecological priority scenario is substantially greater compared to both urban expansion and agricultural development priority scenarios (Figure 4). Protecting ecological space and expanding the area of forests, grasslands, and wetlands are effective ways to enhance regional carbon sink capacity. This finding aligns with the importance of environmental protection against the backdrop of global climate change [37], highlighting the necessity of implementing ecological protection policies in central Asia. In the future, urbanization in central Asia will continue to develop rapidly under the three scenarios, but carbon storage in central Asia will maintain a slow increasing trend. Although the urbanization process can promote economic growth, its negative impact on carbon storage cannot be overlooked.
At the regional scale, a larger slope is often associated with a combination of various topographic forms. It can not only limit the expansion of land use types such as agriculture but also provide conditions for the growth of specific vegetation. Precipitation can increase the vegetation coverage rate by promoting the growth of vegetation. A suitable slope direction is conducive to the growth of vegetation, and an appropriate temperature range can optimize plant growth and biodiversity. In areas close to ordinary roads and railways, with the construction of ecological corridors along the railway lines and shelterbelts on both sides of the roads, ecological protection has been enhanced. These influencing factors have a certain impact on the increase of ecological space, thereby increasing the regional carbon sink capacity. The DEM reflects the terrain elevation. As the elevation increases, the climate conditions (such as temperature and precipitation distribution) become more severe, which inhibits the growth of vegetation and reduces the carbon storage capacity. In addition, during the process of the expansion of the economic scale and urbanization in central Asia, the growth of GDP, the increase in population density, and the development around expressways have intensified environmental pressure, accelerated environmental degradation, and ultimately weakened the regional carbon sink capacity.
To sum up, this study supplies a scientific groundwork to understand the carbon cycling procedures and driving forces in central Asia. In addition, it offers significant references for establishing reasonable ecological protection measures and carbon management strategies within the region.
4.3. Uncertainty Analysis
Overall, this research furnishes a scientific foundation for comprehending the carbon-cycling mechanisms and influencing factors in central Asia. It also supplies crucial references for devising rational ecological conservation policies and carbon management approaches in the area.
This research modeled land use transitions and carbon storage dynamics across central Asia in 2060 under three alternative scenarios. Even though this research provides valuable perspectives for future land use planning and ecological protection in central Asia, some drawbacks still exist.
First, the simulation results of the PLUS model rely on the adjustment of model parameters and weights. However, these adjustments are mainly based on reference documents and experts’ experience, which are highly likely to introduce errors during the simulation process. In addition, it is difficult for multi-scenario simulations to fully take into account the dynamic changes in future national policies, specific natural factors, and the impacts of various land management measures on biomass carbon density and soil organic carbon density. All these factors will lead to changes in the total carbon storage under different scenarios. When simulating future land use changes, there are uncertainties in the time nodes, coverage areas, and change rates of the transformation of various land types. This undoubtedly further exacerbates the complexity and uncertainty of the simulation of total carbon storage.
When using the InVEST model to conduct the assessment of carbon storage, the carbon density data of various land use types within the study area mainly originate from the fixed values in the literature. However, the ecosystem is extremely complex. Key factors such as the dynamic changes in forest structure, the real-time fluctuations in plant photosynthesis, and the continuous alterations in microbial activities in the soil have not been taken into account when evaluating the carbon sequestration capacity with this model [38]. Furthermore, the data referenced from the literature generally come from samples collected within a specific time period. Once they are applied to simulation analysis over a long time scale, there may be a certain degree of deviation. Soil carbon density is jointly affected by many complex factors, such as soil temperature, humidity, and microbial communities. Under different regions and different soil types, the parameters of soil respiration rates have significant differences, which are highly likely to lead to deviations in the soil carbon density finally obtained.
Lastly, the chosen driving factors for land use and carbon sinks are not comprehensive. Subsequent research may incorporate more pertinent driving factors.
5. Conclusions
This study examines the dynamic changes in land use and carbon sinks across central Asia and identifies the main factors shaping carbon sink formation in this region. A strategic spatial planning framework has been formulated to enhance carbon sink resilience and ecological restoration across central Asia. Three scenarios of land use and carbon sequestration in 2060 were simulated and forecasted using the PLUS model and InVEST model to analyze their spatial distributions. The MGWR model was applied to identify the primary driving factors influencing the carbon sink development pattern in central Asia. The key results are outlined as follows.
Based on land use data from 2000, 2010, and 2020, land use in central Asia for 2060 was simulated. From 2000 to 2020, ecological space continuously increased, with its proportion rising from 79.97% to 80.19%. In recent years, central Asia has made certain progress in ecological protection and environmental restoration. In the simulated scenarios for 2060, the proportion of ecological space under the urbanized priority scenario decreases from 80.19% to 80.10%; under the agriculture priority scenario, it decreases from 80.19% to 79.51%; while under the ecological priority scenario, it increases from 80.19% to 80.78%. Overall, the proportion of ecological space in central Asia remains above 70%.
From 2000 to 2020, carbon storage in central Asia showed a year-on-year increase, with a total increase of 0.82 × 10⁹ t. In the simulated scenarios for 2060, the ecological priority scenario shows the largest increase in carbon storage, reaching 1.076 × 10⁹ t, while the increases under the urbanized priority and agricultural priority scenarios are 0.4196 × 10⁹ t and 0.3936 × 10⁹ t, respectively, indicating relatively smaller increments.
The digital elevation model (DEM), precipitation, slope gradient, and temperature contribute relatively more significantly to the carbon storage in central Asia.
This study shows that urbanized priority, agricultural priority, and ecological priority have significantly different impacts on ecological space, with slow expansion and even reductions of varying degrees and scales possible. The ecological priority scenario has a positive effect on the protection of and increase in ecological space, effectively addressing the ecological challenges posed by urbanization and agricultural development. Formulating and implementing policies centered on ecological protection create practical solutions for enhancing carbon sinks and are crucial for maintaining and improving the eco-environment in central Asia. Future development plans should comprehensively consider the balance between urbanization, agricultural development, and ecological protection to ensure the sustainability of regional ecosystems, avoiding excessive development that leads to reductions in ecological space and declines in carbon storage. Promoting a green economy and low-carbon development models is essential.
Author Contributions
Q.B. supervised this study. H.Z. ran the model and wrote the manuscript. Y.S., X.D., and X.L. participated in discussions. All authors have read and agreed to the published version of the manuscript.
Funding
This study was supported by the Open Fund of Key Laboratory of Urban Land Resources Monitoring and Simulation, Ministry of Natural Resources (Grant No. KF-2023-08-01) and the West Light Foundation of The Chinese Academy of Sciences (Grant No. 25JR6KA004).
Data Availability Statement
The original contributions presented in the study are included in the article, further inquiries can be directed to the corresponding author.
Conflicts of Interest
The authors declare no conflicts of interest.
Abbreviations
The following abbreviations are used in this manuscript:
| PLUS | Patch-based land use simulation |
| InVEST | Integrated valuation of ecosystem services and trade-offs |
| MGWR | Multiscale geographic weighted regression |
| UP | Urban development scenario |
| AP | Farmland protection scenario |
| EP | Ecological protection scenario |
References
- Huang, Y.; Li, Z.; Shi, M. Prediction of plant carbon sink potential in Beijing-Tianjin-Hebei region of China. Environ. Dev. Sustain. 2024, 26, 3529–3556. [Google Scholar] [CrossRef]
- Xiang, S.; Wang, Y.; Deng, H.; Yang, C.; Wang, Z.; Gao, M. Response and multi-scenario prediction of carbon storage to land use/cover change in the main urban area of Chongqing, China. Ecol. Indic. 2022, 142, 109205. [Google Scholar] [CrossRef]
- IPCC. Climate Change 2021: The Physical Science Basis. Contribution of Working Group I to the Sixth Assessment Report of the Intergovernmental Panel on Climate Change; Cambridge University Press: Cambridge, UK, 2021. [Google Scholar]
- Guo, W.; Teng, Y.; Yan, Y.; Zhao, C.; Zhang, W.; Ji, X. Simulation of Land Use and Carbon Storage Evolution in Multi-Scenario: A Case Study in Beijing-Tianjin-Hebei Urban Agglomeration, China. Sustainability 2022, 14, 13436. [Google Scholar] [CrossRef]
- Wang, Y.; Luo, G.; Wang, Y.; Han, Q.; Fan, B.; Chen, Y. Vegetation and soil carbon density of central Asia of central Asia. Arid. Land Geogr. 2014, 37, 239–249. [Google Scholar]
- Yin, G.; Hu, Z.; Chen, X.; Tiyip, T. Vegetation dynamics and its response to climate change in Central Asia. J. Arid. Land 2016, 8, 375–388. [Google Scholar] [CrossRef]
- Lu, C.; Qi, X.; Zheng, Z.; Jia, K. PLUS-Model Based Multi-Scenario Land Space Simulation of the Lower Yellow River Region and Its Ecological Effects. Sustainability 2022, 14, 6942. [Google Scholar] [CrossRef]
- Wisloff, T.; Robberstad, B. Re: Markov modeling. Tidsskr. Den Nor. Laegeforening Tidsskr. Prakt. Med. ny Raekke 2015, 135, 1432. [Google Scholar] [CrossRef]
- Xing, W.; Qian, Y.; Guan, X.; Yang, T.; Wu, H. A novel cellular automata model integrated with deep learning for dynamic spatio-temporal land use change simulation. Comput. Geosci. 2020, 137, 9. [Google Scholar] [CrossRef]
- Tan, J.; Lavidas, G. A modified spectral-domain model for nonlinear hydrostatic restoring force of heaving wave energy converters. Ocean. Eng. 2024, 309, 19. [Google Scholar] [CrossRef]
- Xu, X.; Kong, W.; Wang, L.; Wang, T.; Luo, P.; Cui, J. A novel and dynamic land use/cover change research framework based on an improved PLUS model and a fuzzy multiobjective programming model. Ecol. Inform. 2024, 80, 102460. [Google Scholar] [CrossRef]
- Tang, H.; Halike, A.; Yao, K.; Wei, Q.; Yao, L.; Tuheti, B.; Luo, J.; Duan, Y. Ecosystem service valuation and multi-scenario simulation in the Ebinur Lake Basin using a coupled GMOP-PLUS model. Sci. Rep. 2024, 14, 5071. [Google Scholar] [CrossRef] [PubMed]
- Liu, J.; Liu, B.; Wu, L.; Miao, H.; Liu, J.; Jiang, K.; Ding, H.; Gao, W.; Liu, T. Prediction of land use for the next 30years using the PLUS model’s multi-scenario simulation in Guizhou Province, China. Sci. Rep. 2024, 14, 13143. [Google Scholar]
- Yu, Z.; Zhao, M.; Gao, Y.; Wang, T.; Zhao, Z.; Wang, S. Multiscenario Simulation and Prediction of Land Use in Huaibei City Based on CLUE-S and PLUS Models. Appl. Sci. 2023, 13, 15. [Google Scholar] [CrossRef]
- Lin, X. and Fu, H. Multi-scenario simulation analysis of cultivated land based on PLUS model-a case study of Haikou, China. Front. Ecol. Evol. 2023, 11, 15. [Google Scholar] [CrossRef]
- Wang, Z.; Zeng, J.; Chen, W. Impact of urban expansion on carbon storage under multi-scenario simulations in Wuhan, China. Environ. Sci. Pollut. Res. 2022, 29, 45507–45526. [Google Scholar] [CrossRef]
- Li, X.; Guli, J.; Tao, Y.; Yin, H.; Tu, H. Spatiotemporal dynamic monitoring and driving factor analysis of ecological carrying capacity in five Central Asian countries. J. Univ. Chin. Acad. Sci. 2023, 40, 474–485. [Google Scholar]
- Tu, H.; Jiapaer, G.; Yu, T.; Zhang, L.; Chen, B.; Lin, K.; Li, X. Effects of Land Cover Change on Vegetation Carbon Source/Sink in Arid Terrestrial Ecosystems of Northwest China, 2001–2018. Remote Sens. 2023, 15, 24. [Google Scholar] [CrossRef]
- Li, J.; Chen, H.; Zhang, C.; Pan, T. Variations in ecosystem service value in response to land use/land cover changes in Central Asia from 1995–2035. Peerj 2019, 7, e7665. [Google Scholar] [CrossRef]
- Zhang, S.; Meng, L.; Zhao, Y.; Yang, X.; Huang, A. The Influence of the Tibetan Plateau Monsoon on Summer Precipitation in Central Asia. Front. Earth Sci. 2022, 10, 11. [Google Scholar] [CrossRef]
- Li, C.; Zhang, C.; Luo, G.; Chen, X.; Maisupova, B.; Madaminov, A.A.; Han, Q.; Djenbaev, B.M. Carbon stock and its responses to climate change in Central Asia. Glob. Change Biol. 2015, 21, 1951–1967. [Google Scholar] [CrossRef]
- Zhang, R.; Zhao, C.; Ma, X.; Brindha, K.; Han, Q.; Li, C.; Zhao, X. Projected Spatiotemporal Dynamics of Drought under Global Warming in Central Asia. Sustainability 2019, 11, 19. [Google Scholar] [CrossRef]
- Chen, A.; Zhang, Y.; Chu, Z. Spatiotemporal distribution of precipitation in five Central Asian countries based on FY-4A quantitative precipitation estimates. Arid. Zone Res. 2023, 40, 1369–1381. [Google Scholar]
- Qi, J.; Kulmatov, R. An overview of environmental issues in central Asia. In NATO Advanced Research Workshop on Environmental Problems of Central Asia and Their Economic, Social and Security Impacts; Springer: Tashkent, Uzbekistan, 2007. [Google Scholar] [CrossRef]
- Zhang, X.; Liu, L.; Chen, X.; Gao, Y.; Xie, S.; Mi, J. GLC_FCS30: Global land-cover product with fine classification system at 30m using time-series Landsat imagery. Earth Syst. Sci. Data Discuss. 2021, 13, 2753–2776. [Google Scholar] [CrossRef]
- Yang, Y.; Bao, W.; Liu, Y. Coupling coordination analysis of rural production-living-ecological space in the Beijing-Tianjin-Hebei region. Ecol. Indic. 2020, 117, 13. [Google Scholar] [CrossRef]
- Cheng, S.; Pan, S. Land Use Change and Scenario Simulation Based on PLUS Model: A Case Study of Central Kaifeng. J. Nat. Resour. 2024, 54, 303–313. [Google Scholar]
- He, C.; Zhang, D.; Huang, Q.; Zhao, Y. Assessing the potential impacts of urban expansion on regional carbon storage by linking the LUSD-urban and InVEST models. Environ. Model. Softw. 2016, 75, 44–58. [Google Scholar] [CrossRef]
- Zhao, M.; He, Z.; Du, J.; Chen, L.; Lin, P.; Fang, S. Assessing the effects of ecological engineering on carbon storage by linking the CA-Markov and InVEST models. Ecol. Indic. 2019, 98, 29–38. [Google Scholar] [CrossRef]
- Ding, Q. Ecosystem Services Evaluation and Trade-Offs Effects in Central Asia. Ph.D. Thesis, China University of Geosciences, Beijing, China, 2021. [Google Scholar]
- Tao, Y.; Zhang, Y.M. Evaluation of vegetation biomass carbon storage in deserts of Central Asia. Arid. Land Geogr. 2013, 36, 615–622. [Google Scholar]
- Huang, Z.Y.; Yang, Q.Y.; Wei, H.Y. Analysis of Key Influencing Factors of Wuhan Urban Waterlogging Based on Multi-scale Geographically Weighted Regression. J. Chang. River Sci. Res. Inst. 2024, 1–7. Available online: http://ckyyb.crsri.cn/EN/10.11988/ckyyb.20240146 (accessed on 10 April 2025).
- Zhang, L.M.; Li, Y.S.; Li, R.Y. Driving forces analysis of urban ground deformation using satellite monitoring and multiscale geographically weighted regression. Measurement 2023, 214, 16. [Google Scholar] [CrossRef]
- Niu, Y.; Wang, Y. Spatial differentiation patterns and traditional villages in Taihang Mountain area and influencing mechanisms: A MGWR model based analysis. J. Arid. Land Resour. Environ. 2024, 38, 87–96. [Google Scholar]
- Zhu, S.; Li, C.; Shao, H.; Ju, W.; Lv, N. The response of carbon stocks of drylands in Central Asia to changes of CO2 and climate during past 35 years. Sci. Total Environ. 2019, 687, 330–340. [Google Scholar] [PubMed]
- Yushanjiang, A.; Zhang, F.; Tan, M.L. Spatial-temporal characteristics of ecosystem health in Central Asia. Int. J. Appl. Earth Obs. Geoinf. 2021, 105, 14. [Google Scholar] [CrossRef]
- Tadese, S.; Soromessa, T.; Aneseye, A.B.; Gebeyehu, G.; Noszczyk, T.; Kindu, M. The impact of land cover change on the carbon stock of moist afromontane forests in the Majang Forest Biosphere Reserve. Carbon Balance Manag. 2023, 18, 20. [Google Scholar] [CrossRef]
- Wang, Y.; Liang, D.; Wang, J.; Zhang, Y.; Chen, F.; Ma, X. An analysis of regional carbon stock response under land use structure change and multi-scenario prediction, a case study of Hefei, China. Ecol. Indic. 2023, 151, 110293. [Google Scholar] [CrossRef]


Disclaimer/Publisher’s Note: The statements, opinions and data contained in all publications are solely those of the individual author(s) and contributor(s) and not of MDPI and/or the editor(s). MDPI and/or the editor(s) disclaim responsibility for any injury to people or property resulting from any ideas, methods, instructions or products referred to in the content. |
© 2025 by the authors. Licensee MDPI, Basel, Switzerland. This article is an open access article distributed under the terms and conditions of the Creative Commons Attribution (CC BY) license (https://creativecommons.org/licenses/by/4.0/).