


Spatial Coupling and Resilience Differentiation Characteristics of Landscapes in Populated Karstic Areas in Response to Landslide Disaster Risk: An Empirical Study from a Typical Karst Province in China


Abstract
:1. Introduction
2. Materials and Methods
2.1. Study Area
2.2. Data Sources
2.3. Research Methods
2.3.1. Evaluation Index of LDR and DAL
2.3.2. Frequency Ratio-Random Forest Model
2.3.3. Weighted Variance
2.3.4. Bivariate Spatial Autocorrelation
2.3.5. Geographical Detector Model
3. Results
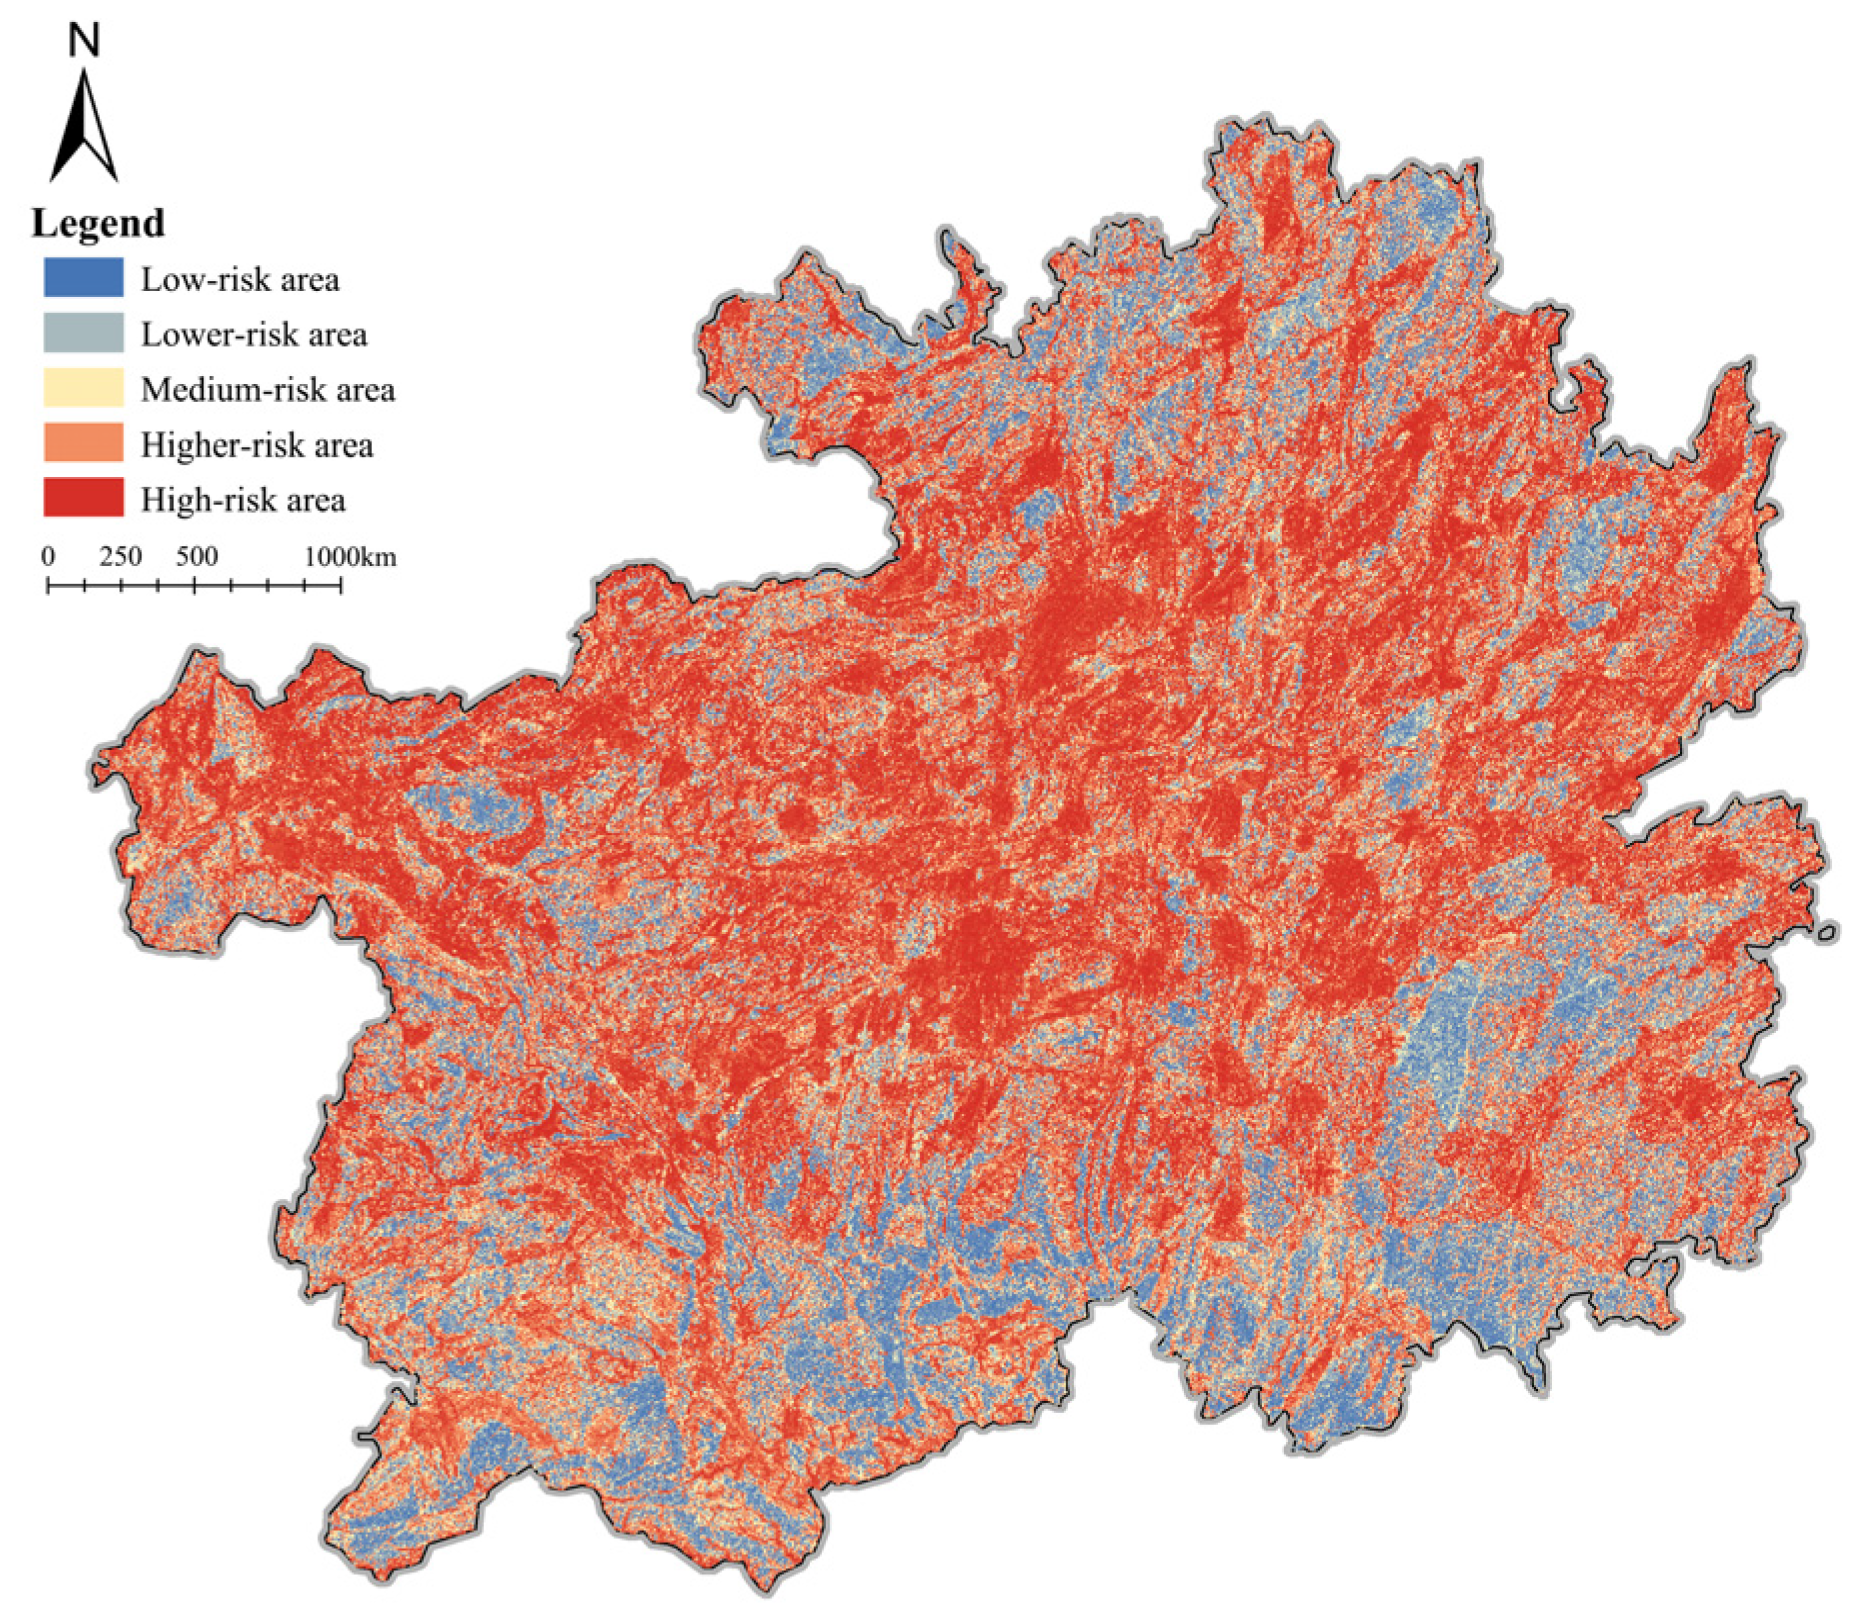
3.1. LDR Map
3.1.1. Evaluation of the Frequency Ratio-Random Forest Model
3.1.2. Analysis of Risk Results
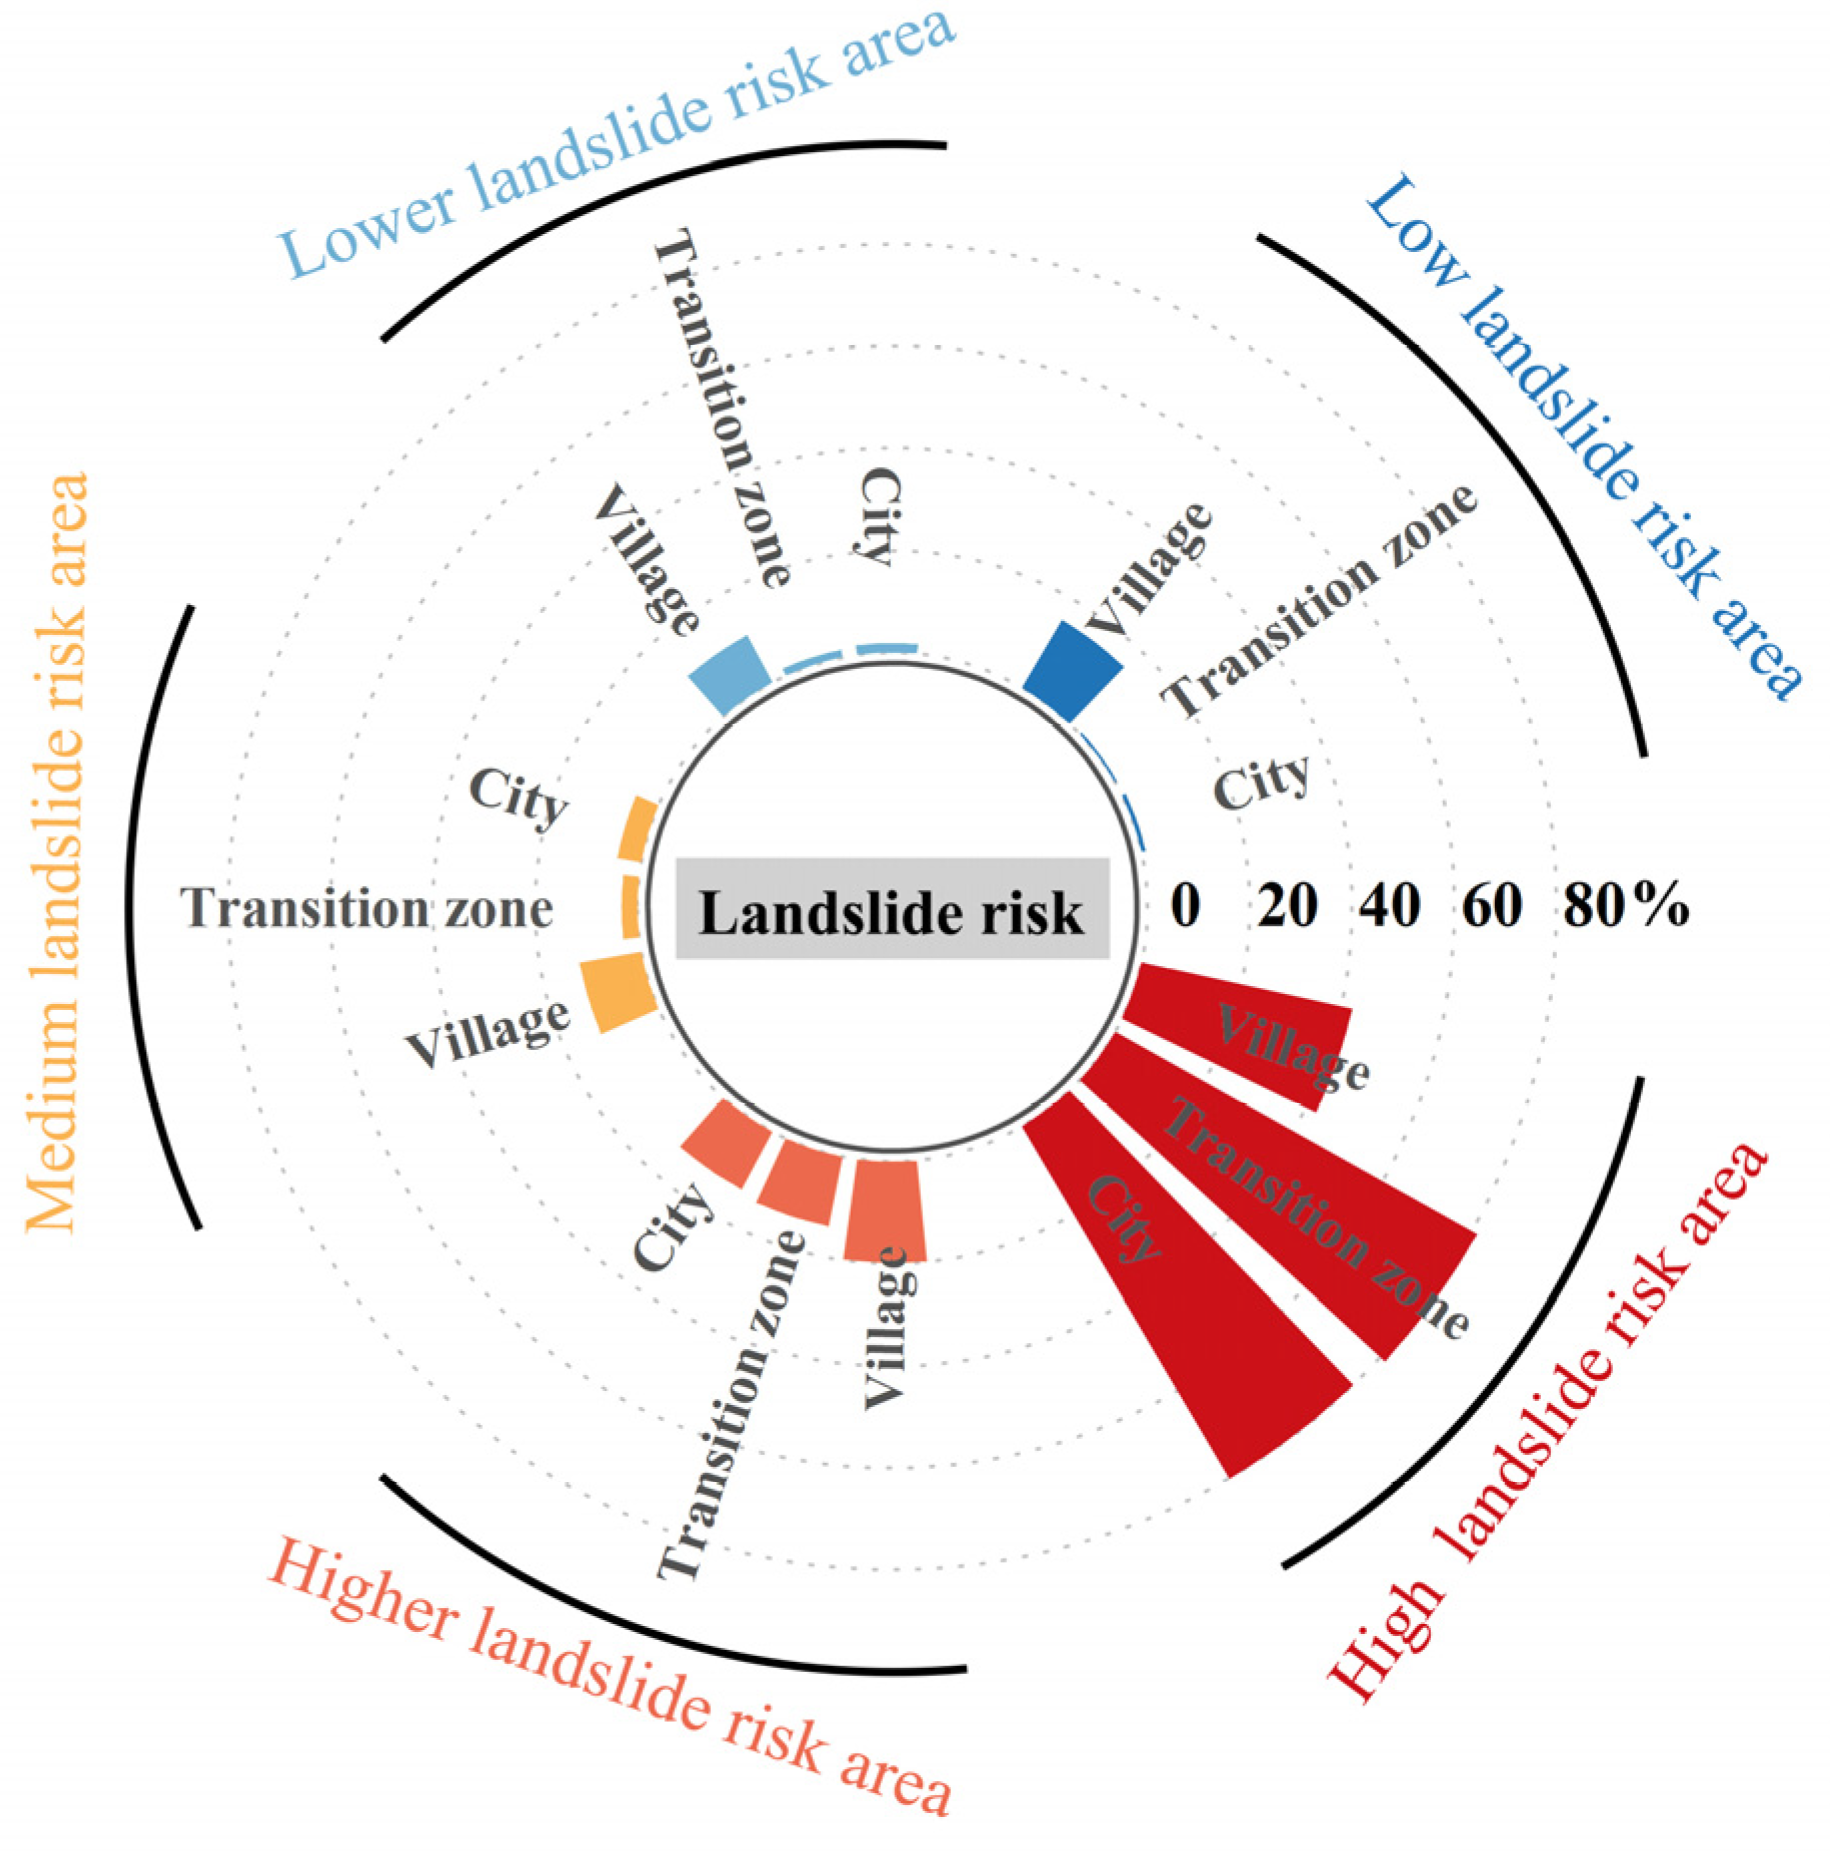
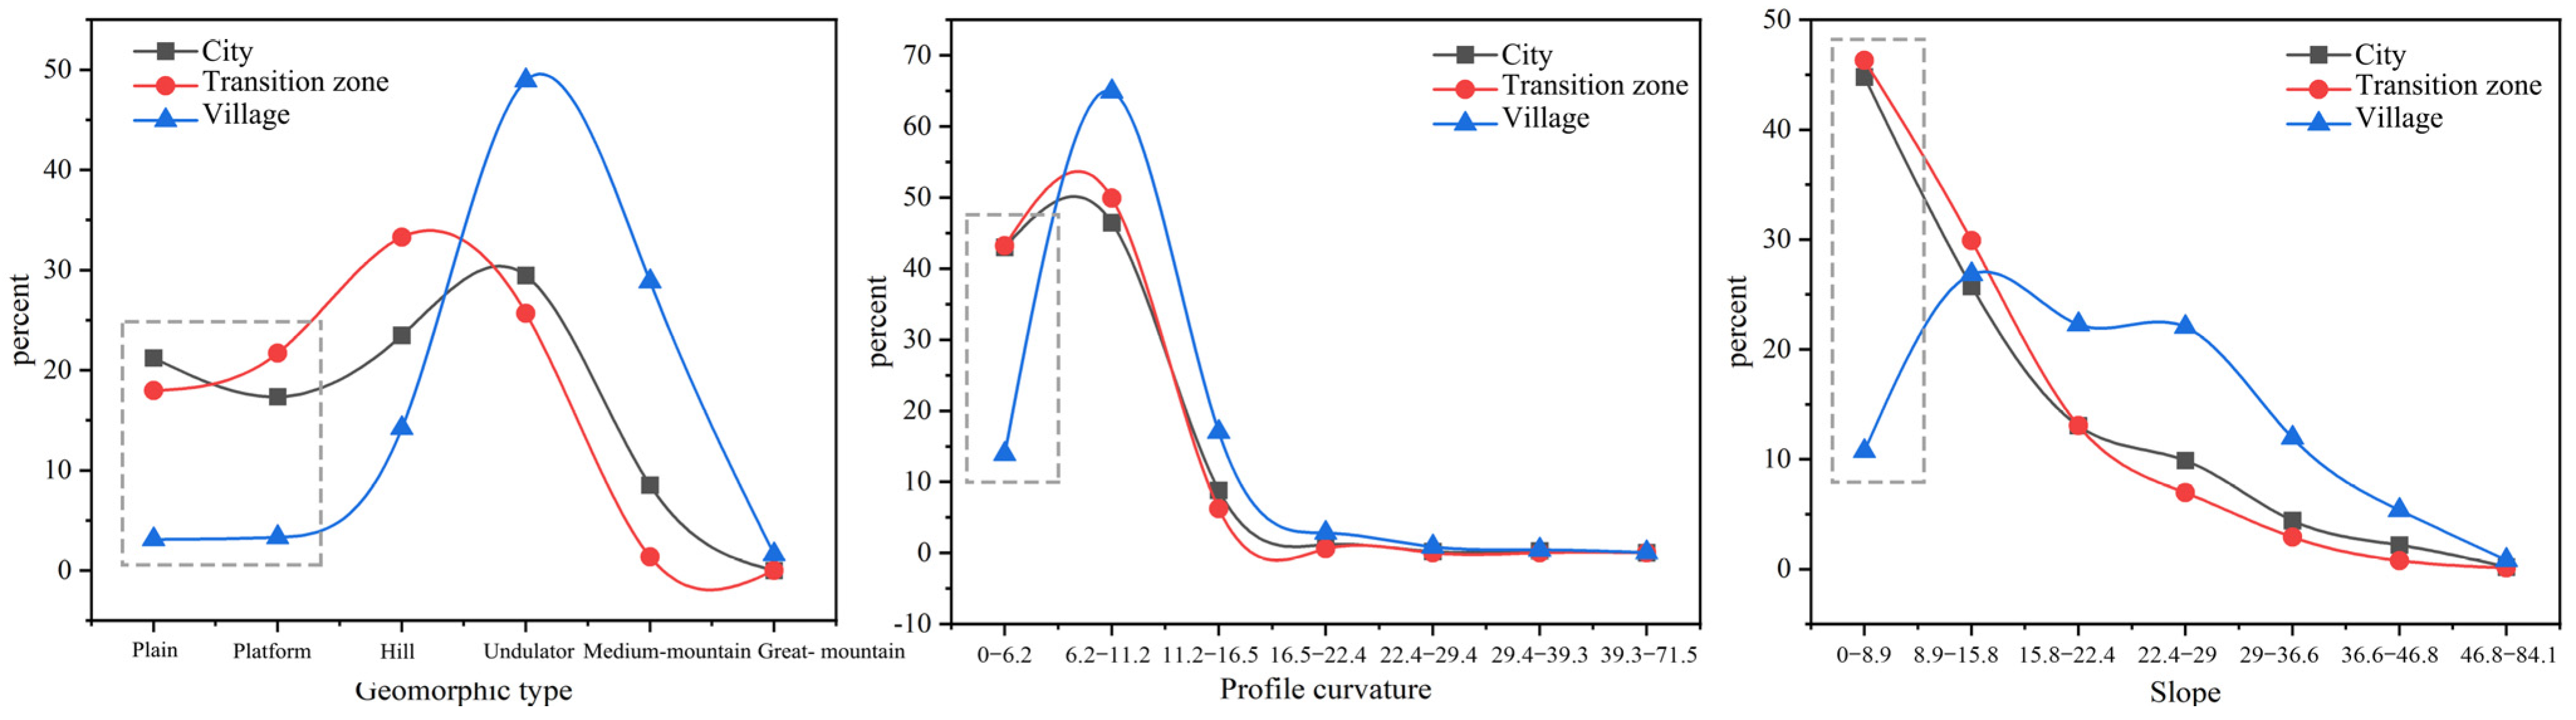
3.2. DAL Results
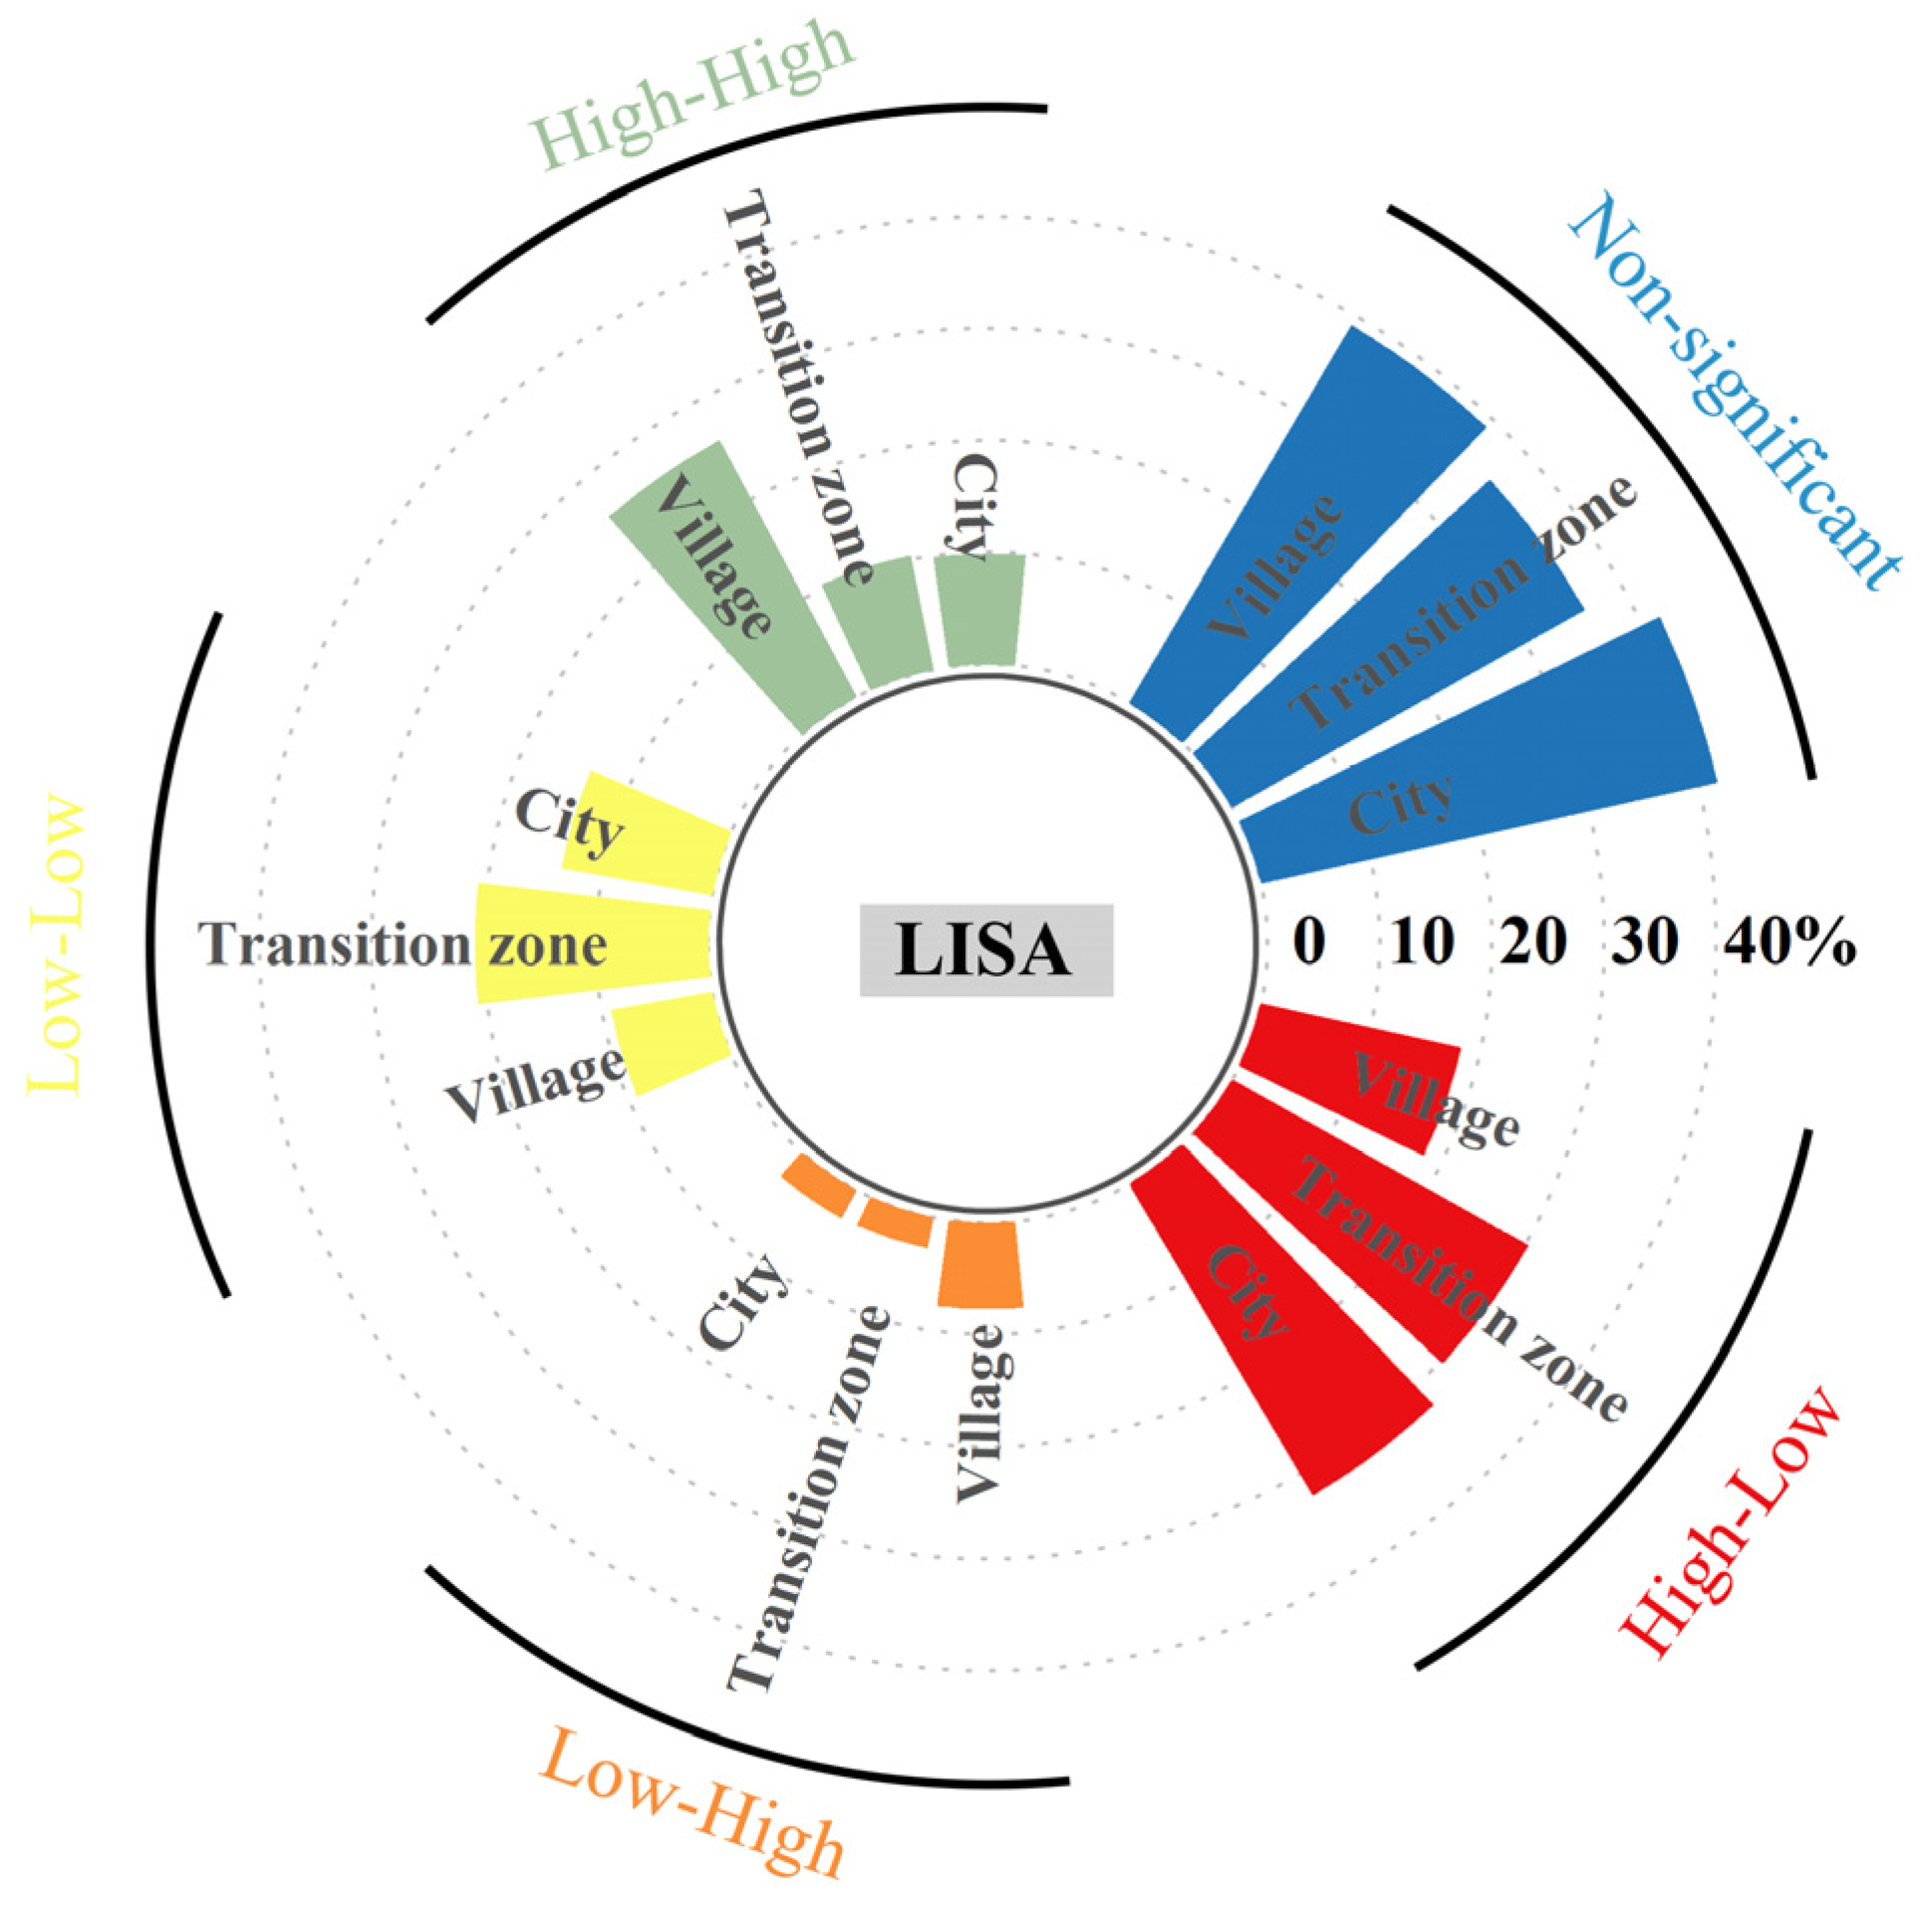
3.3. Spatial Autocorrelation Results
3.4. Analysis of Driving Factors
4. Discussion
5. Conclusions
Author Contributions
Funding
Data Availability Statement
Acknowledgments
Conflicts of Interest
Abbreviations
| LDR | —Landslide disaster risk |
| DAL | —Disaster-adaptive landscape |
References
- Kalhor, K.; Ghasemizadeh, R.; Rajic, L.; Alshawabkeh, A. Assessment of groundwater quality and remediation in karst aquifers: A review. Groundw. Sustain. Dev. 2019, 8, 104–121. [Google Scholar] [CrossRef]
- Froude, M.J.; Petley, D.N. Global fatal landslide occurrence from 2004 to 2016. Nat. Hazards Earth Syst. Sci. 2018, 18, 2161–2181. [Google Scholar] [CrossRef]
- Fang, Z.; Morales, A.B.; Wang, Y.; Lombardo, L. Climate change has increased rainfall-induced landslide damages in central China. Int. J. Disaster Risk Reduct. 2025, 119, 105320. [Google Scholar] [CrossRef]
- Li, Y.; Wang, X.; Mao, H. Influence of human activity on landslide susceptibility development in the Three Gorges area. Nat. Hazards 2020, 104, 2115–2151. [Google Scholar] [CrossRef]
- Weici, S. Rocky Land Desertification and Its Controlling Measurements in the Karst Mountainous Region, Southwest of China. J. Soil Water Conserv. 2002, 2, 29–32+79. [Google Scholar] [CrossRef]
- Huang, M.; Qi, S.; Shang, G. Karst landslides hazard during 1940-2002 in the mountainous region of Guizhou Province, Southwest China. Nat. Hazards 2012, 60, 781–784. [Google Scholar] [CrossRef]
- He, X.J.; Wang, L.; Ke, B.; Yue, Y.M.; Wang, K.L.; Cao, J.H.; Xiong, K.N. Progress on ecological conservation and restoration for China Karst. Acta Ecol. Sin. 2019, 39, 6577–6585. [Google Scholar]
- Deng, L.Z.; Yuan, H.Y.; Zhang, M.Z.; Chen, J.G. Research progress on landslide deformation monitoring and early warning technology. J. Tsinghua Univ. (Sci. Technol.) 2023, 63, 849–864. [Google Scholar] [CrossRef]
- Xu, J.; Sun, D.; Zhang, H.; Wen, H.; Wu, J.; Hang, Y. Multi-scale ecological risk assessment and risk management oflandslide disasters: A case study of Wanzhou-Wushan section in theThree Gorges Reservoir area. Acta Ecol. Sin. 2023, 43, 4594–4603. [Google Scholar]
- Wu, J.; Luo, Y.; Wang, X.; Zhao, Y. Uncertainty analysis and risk management of ecological risk of urban landslide disaster: A case of Shenzhen City. Acta Ecol. Sin. 2020, 40, 3612–3621. [Google Scholar]
- Ma, Y.; Li, C. Construction of Geological Hazard Risk Management Framework andDisaster Prevention and Mitigation System in Mountain Tourism AreasA Case Study of Leshan City, Sichuan Province. Sci. Technol. Eng. 2023, 23, 9719–9727. [Google Scholar]
- Zhou, L. Resilient City:Risk Management and Its Indicators. J. Beijing Adm. Inst. 2016, 2, 13–20. [Google Scholar] [CrossRef]
- Wang, H.; Zhang, L.; Yin, K.; Luo, H.; Li, J. Landslide identification using machine learning. Geosci. Front. 2021, 12, 351–364. [Google Scholar] [CrossRef]
- Kavzoglu, T.; Sahin, E.K.; Colkesen, I. Landslide susceptibility mapping using GIS-based multi-criteria decision analysis, support vector machines, and logistic regression. Landslides 2014, 11, 425–439. [Google Scholar] [CrossRef]
- Hong, H.; Pourghasemi, H.R.; Pourtaghi, Z.S. Landslide susceptibility assessment in Lianhua County (China): A comparison between a random forest data mining technique and bivariate and multivariate statistical models. Geomorphology 2016, 259, 105–118. [Google Scholar] [CrossRef]
- Ye, B.F.; Qiu, H.J.; Tang, B.Z.; Liu, Y.; Liu, Z.J.; Jiang, X.Y.; Yang, D.D.; Ullah, M.; Zhu, Y.R.; Kamp, U. Creep deformation monitoring of landslides in a reservoir area. J. Hydrol. 2024, 632, 130905. [Google Scholar] [CrossRef]
- Uhlemann, S.; Smith, A.; Chambers, J.; Dixon, N.; Dijkstra, T.; Haslam, E.; Meldrum, P.; Merritt, A.; Gunn, D.; Mackay, J. Assessment of ground-based monitoring techniques applied to landslide investigations. Geomorphology 2016, 253, 438–451. [Google Scholar] [CrossRef]
- Tofani, V.; Raspini, F.; Catani, F.; Casagli, N. Persistent Scatterer Interferometry (PSI) Technique for Landslide Characterization and Monitoring. Remote Sens. 2013, 5, 1045–1065. [Google Scholar] [CrossRef]
- Martelloni, G.; Segoni, S.; Fanti, R.; Catani, F. Rainfall thresholds for the forecasting of landslide occurrence at regional scale. Landslides 2012, 9, 485–495. [Google Scholar] [CrossRef]
- Thiebes, B.; Bell, R.; Glade, T.; Jäger, S.; Mayer, J.; Anderson, M.; Holcombe, L. Integration of a limit-equilibrium model into a landslide early warning system. Landslides 2014, 11, 859–875. [Google Scholar] [CrossRef]
- Intrieri, E.; Gigli, G.; Mugnai, F.; Fanti, R.; Casagli, N. Design and implementation of a landslide early warning system. Eng. Geol. 2012, 147, 124–136. [Google Scholar] [CrossRef]
- Yang, Y.L.; Xie, F.H.; Wu, Q.H.; Wan, S.M. Stability Analysis and Treatment of a Landslide Engineering Along a Highway. In Proceedings of the 2nd International Conference on Civil Engineering, Architecture and Building Materials (CEABM 2012), Yantai, China, 25–27 May 2012; pp. 1076–1081. [Google Scholar]
- Xiao, J. The Typical Landslide Accelerating Deformation Period Emergency Treatment Engineering Technology And Its Effect Analysis. In Proceedings of the 2nd International Conference on Civil Engineering and Transportation (ICCET 2012), Guilin, China, 27–28 October 2012; pp. 2692–2699. [Google Scholar]
- Wang, C.T.; Wang, H.; Qin, W.M.; Wei, S.; Tian, H.N.; Fang, K. Behaviour of pile-anchor reinforced landslides under varying water level, rainfall, and thrust load: Insight from physical modelling. Eng. Geol. 2023, 325, 107293. [Google Scholar] [CrossRef]
- He, H.; Xu, Y.; Huang, Z.Z.; Li, Z. A Study on Micro Pile Reinforcement Technology for the Accumulative landslide of Expansive Soil. In Proceedings of the 4th International Conference on Civil Engineering, Architecture and Building Materials (CEABM), Haikou, China, 24–25 May 2014; pp. 544–551. [Google Scholar]
- Wang, M.Y.; Wang, W.K.; Dai, C.Y.; Ma, C.L.; Luo, Y.; Xu, M. Risk analysis and evaluation of emergency rescue in landslide disaster. Nat. Hazards 2024, 120, 14809–14835. [Google Scholar] [CrossRef]
- Huang, Y.J.; Yi, S.; Li, Z.Y.; Shao, S.G.; Qin, X.C. Design of highway landslide warning and emergency response systems based on UAV. In Proceedings of the 17th China Conference on Remote Sensing—Remote Sensing of the Environment, Hangzhou, China, 27–31 August 2010. [Google Scholar]
- Chae, B.G.; Park, H.J.; Catani, F.; Simoni, A.; Berti, M. Landslide prediction, monitoring and early warning: A concise review of state-of-the-art. Geosci. J. 2017, 21, 1033–1070. [Google Scholar] [CrossRef]
- Ciftcioglu, G.C. Evaluating resilience for the management of social-ecological production landscapes and seascapes in Lefke Region of North Cyprus through adaptive comanagement. Sustain. Sci. 2019, 14, 1117–1130. [Google Scholar] [CrossRef]
- Ahern, J. Urban landscape sustainability and resilience: The promise and challenges of integrating ecology with urban planning and design. Landsc. Ecol. 2013, 28, 1203–1212. [Google Scholar] [CrossRef]
- Yan, J.N.; Wang, S.; Feng, J.X.; He, H.X.; Wang, L.Z.; Sun, Z.Y.; Zheng, C.M. The 30 m annual soil water erosion dataset in Chinese mainland from 1990 to 2022. Sci. Data Bank 2024. [Google Scholar] [CrossRef]
- Zhang, X.S. Vegetation Map of the People’s Republic of China (1:1,000,000); Geology Press: Beijing, China, 2007. [Google Scholar] [CrossRef]
- Shangguan, W.; Dai, Y.J.; Liu, B.Y.; Zhu, A.X.; Duan, Q.Y.; Wu, L.Z.; Ji, D.Y.; Ye, A.Z.; Yuan, H.; Zhang, Q.; et al. A China dataset of soil properties for land surface modelling (version 2, CSDLv2). Earth Syst. Sci. Data 2013, 17, 517–543. [Google Scholar] [CrossRef]
- Reichenbach, P.; Rossi, M.; Malamud, B.D.; Mihir, M.; Guzzetti, F. A review of statistically-based landslide susceptibility models. Earth-Sci. Rev. 2018, 180, 60–91. [Google Scholar] [CrossRef]
- Fidan, S.; Tanyas, H.; Akbas, A.; Lombardo, L.; Petley, D.N.; Görüm, T. Understanding fatal landslides at global scales: A summary of topographic, climatic, and anthropogenic perspectives. Nat. Hazards 2024, 120, 6437–6455. [Google Scholar] [CrossRef]
- Yue, X.-L.; Wu, S.-H.; Huang, M.; Gao, J.-B.; Yin, Y.-H.; Feng, A.-Q.; Gu, X.-P. Spatial association between landslides and environmental factors over Guizhou Karst Plateau, China. J. Mt. Sci. 2018, 15, 1987–2000. [Google Scholar] [CrossRef]
- Du, Y.Y.; Peng, J.; Zhao, S.Q.; Hu, Z.C.; Wang, Y.L. Ecological risk assessment of landslide disasters in mountainous areasof Southwest China:A case study in Dali Bai Autonomous Prefecture. Acta Geogr. Sin. 2016, 71, 1544–1561. [Google Scholar]
- Liu, L.; Bian, Z.; Ding, S. Effects of landscape spatial heterogeneity on the generation andprovision of ecosystem services. Acta Ecol. Sin. 2018, 18, 6412–6421. [Google Scholar]
- Chen, L.; Xie, G.; Pei, X.; Zhang, C.; Fan, N.; Zhang, C.; Li, S. Ecosystem’s soil conservation function and its spatial distribution inLancang River Basin, Southwest China. Chin. J. Appl. Ecol. 2012, 23, 2249–2256. [Google Scholar] [CrossRef]
- Li, Y.Y.; Zhao, W.M. Research on Moutainous Urban Space Adapting to Disasters: Problemshouahts and Theoretical Framework. Urban Dev. Stud. 2017, 24, 54–62. [Google Scholar]
- Jiao, H.; Zou, T.; Li, Y. Simulation of Urban Disaster Prevention Spatial Unit Risk ZoningPrevention and Control Algorithm. Comput. Simul. 2021, 38, 465–469. [Google Scholar]
- Zhou, Y.; Liu, J.; Liang, J. Comprehensive Suitability Evaluation for Emergency Shelters Based onImproved Gray Relational Analysis Method in Fuzhou. Geogr. Geo-Inf. Sci. 2018, 34, 63–70+61. [Google Scholar]
- Satgada, C.P.; Egusa, T.; Yamakawa, Y.; Imaizumi, F. Forest harvesting affects soil organic carbon and total nitrogen transports by facilitating landslides. Catena 2023, 233, 107517. [Google Scholar] [CrossRef]
- Blonska, E.; Lasota, J.; Piaszczyk, W.; Wiechec, M.; Klamerus-Iwan, A. The effect of landslide on soil organic carbon stock and biochemical properties of soil. J. Soils Sediments 2018, 18, 2727–2737. [Google Scholar] [CrossRef]
- Zhai, W.H.; Wang, X.D.; Wu, M.T.; Wu, X.L.; Li, Q.Q. Geological disaster susceptibility evaluation based on coupling of frequency ratio model and random forest model. J. Nat. Disasters 2022, 32, 74–82. [Google Scholar] [CrossRef]
- Belgiu, M.; Dragut, L. Random forest in remote sensing: A review of applications and future directions. ISPRS J. Photogramm. Remote Sens. 2016, 114, 24–31. [Google Scholar] [CrossRef]
- Wu, Y.; Wu, Y.M.; Gao, B.P.; Li, C.; Zheng, K.J.; Li, C. Spatial Relationship Between Human Activity Intensities and Ecosystem Services Value in Chengdu-Chongqing Urban Agglomeration. Res. Soil Water Conserv. 2023, 30, 173–182. [Google Scholar] [CrossRef]
- Wang, J.F.; Xu, C.D. Geodetector: Principle and prospective. Acta Geogr. Sin. 2017, 72, 116–134. [Google Scholar]


| Refuge Space | Evacuation Route | Vegetation | Soil Organic Matter Content (%) |
|---|---|---|---|
| Park | Highway | Forest land | 7.3–14.0 |
| Plaza | National Road | Orchard | 14.0–15.4 |
| Museum | Provincial Road | Shrubland | 15.4–17.2 |
| School | County Road | Grassland | 17.2–23.3 |
| Hospital | Township Road | — | 23.3–28.9 |
| — | Other Roads | — | — |
Disclaimer/Publisher’s Note: The statements, opinions and data contained in all publications are solely those of the individual author(s) and contributor(s) and not of MDPI and/or the editor(s). MDPI and/or the editor(s) disclaim responsibility for any injury to people or property resulting from any ideas, methods, instructions or products referred to in the content. |
© 2025 by the authors. Licensee MDPI, Basel, Switzerland. This article is an open access article distributed under the terms and conditions of the Creative Commons Attribution (CC BY) license (https://creativecommons.org/licenses/by/4.0/).
Share and Cite
Zhou, H.; Wang, S.; Gao, M.; Zhang, G. Spatial Coupling and Resilience Differentiation Characteristics of Landscapes in Populated Karstic Areas in Response to Landslide Disaster Risk: An Empirical Study from a Typical Karst Province in China. Land 2025, 14, 847. https://doi.org/10.3390/land14040847
Zhou H, Wang S, Gao M, Zhang G. Spatial Coupling and Resilience Differentiation Characteristics of Landscapes in Populated Karstic Areas in Response to Landslide Disaster Risk: An Empirical Study from a Typical Karst Province in China. Land. 2025; 14(4):847. https://doi.org/10.3390/land14040847
Chicago/Turabian StyleZhou, Huanhuan, Sicheng Wang, Mingming Gao, and Guangli Zhang. 2025. "Spatial Coupling and Resilience Differentiation Characteristics of Landscapes in Populated Karstic Areas in Response to Landslide Disaster Risk: An Empirical Study from a Typical Karst Province in China" Land 14, no. 4: 847. https://doi.org/10.3390/land14040847
APA StyleZhou, H., Wang, S., Gao, M., & Zhang, G. (2025). Spatial Coupling and Resilience Differentiation Characteristics of Landscapes in Populated Karstic Areas in Response to Landslide Disaster Risk: An Empirical Study from a Typical Karst Province in China. Land, 14(4), 847. https://doi.org/10.3390/land14040847