Article

Ecosystem Service Values and Wheat Agroecosystem Management Types in a Semi-Arid Region, Iran

1
Department of Environment Science and Engineering, Arak University, Arak 38156879, Iran
2
Department of Agronomy Science, University of Zabol, Zabol 9861335856, Iran
3
School of Geosciences, The University of Sydney, Sydney 2006, Australia
*
Author to whom correspondence should be addressed.
Land 2025, 14(4), 865; https://doi.org/10.3390/land14040865
Submission received: 21 December 2024 / Revised: 28 March 2025 / Accepted: 12 April 2025 / Published: 15 April 2025

Abstract

:
Global demand for ecosystem services like food and clean water is increasing, and it is crucial to economically value these services for the purposes of environmental conservation, land-use planning, and the implementation of green taxes. Focusing on a monoculture wheat agroecosystem, the economic value of ecosystem services and environmental damage from different farm management types is here compared with natural ecosystems in a semi-arid region in Iran during the 2019–2020 agricultural year. Using field survey data collected from 203 wheat farms with varying management practices, we estimated the economic value of six ecosystem services, along with three environmental damages. The net value of provisioning/regulating services less environmental disservices in wheat agroecosystems was highest for farms with a conservation management system, followed (in rank order) by intensive, traditional, organic, and industrial management types. Wheat agroecosystems recorded net values of 41.94% to 66.92% below those of natural ecosystems in the region. The findings show that converting natural ecosystems into wheat agroecosystems increases the value of provisioning services (food and forage) but also substantially increases environmental costs. These costs rose linearly with the value of increases in provisioning services.

1. Introduction

The assessment of ecosystem services (ESs) has become a crucial aspect of understanding the multifaceted contributions of ecosystems to human well-being, particularly in agricultural contexts. Over the past decade, various methods have been developed to estimate the economic value of ecosystem services, ranging from direct market valuation to integrated modeling approaches. These methods include non-market valuation techniques, such as contingent valuation [1] and choice experiments [2], as well as modeling tools like the Integrated Valuation of Ecosystem Services and Trade-offs (InVEST) model [3] and the Millennium Ecosystem Assessment [4] framework. In valuation studies, researchers have emphasized the importance of this latter framework as an approach when considering provisioning services (e.g., food), regulating services (e.g., carbon sequestration), cultural services (e.g., recreation opportunities), and supporting services (e.g., soil formation). Each of the ecosystem service categories is underpinned by numerous contributing components beyond the examples cited here.
Agricultural ecosystems represent the largest managed ecosystems globally, traditionally oriented principally toward the provisioning of material outputs such as food, forage, fiber, and fuel. However, beyond these tangible products, agroecosystems contribute a diverse array of regulatory, supporting, and cultural services that sustain ecological balance and human well-being [5]. Sustainable agricultural practices, including agroecology and conservation tillage, can enhance ecosystem service provision while minimizing environmental degradation. Conversely, intensive agricultural systems, which prioritize high productivity, have been shown to reduce the delivery of critical ecosystem services such as soil fertility, biodiversity, and carbon sequestration [6]. As the global population continues to rise, the pressure to expand and intensify agricultural practices has become inevitable if the growing demand for food security is to be met [7]. Such agricultural intensification has led to habitat destruction and significant negative environmental impacts, including land degradation, fertilizer and pesticide contamination of soil and water, groundwater depletion, soil erosion, loss of endemic vegetation and biodiversity, weakened social fabric, and increased greenhouse gas emissions [8,9,10,11]. The environmental and social costs of intensification, often referred to as “external costs”, represent hidden expenses that are typically not borne by producers alone but are also passed on to society at large [12,13]. The valuation of ecosystem services provides critical insight into the often overlooked costs associated with the degradation or restoration of these services [14] and allows for the identification of the trade-offs involved [15,16].
Given the broad spectrum of ecosystem services, which encompass ecological, economic, and cultural dimensions, assigning monetary value to these services has emerged as a vital tool for raising awareness among policymakers, stakeholders, and the public. By monetizing these benefits and costs, it becomes easier to encourage the adoption of sustainable agricultural practices that align with the principles of ecological stewardship and sustainable development. Sustainability in agricultural ecosystems is deeply intertwined with their capacity to balance the provision and consumption of ecosystem services while preserving long-term ecological integrity and resilience [17]. Achieving this desirable outcome is complicated and requires care in devising and evaluating diverse potential pathways. An ecosystem and service-based management framework offers a possible approach by acknowledging the complex interdependencies between services, recognizing the trade-offs involved, and integrating both economic and ecological considerations into decision-making [18]. While most research on ecosystem service valuation has concentrated on natural ecosystems, agroecosystems—despite their significant contribution to human livelihoods—had remained underexplored in earlier research [19]. Even so, Norris et al. [8] estimated the global economic value of ecosystem services, encompassing both natural and managed systems, at approximately USD 33 trillion annually. They also noted that food production relies on ecosystem services which are thereby being adversely impacted, leading to problems in ensuring long-term sustainability.
In the delivery of agroecosystem services, particularly in food and feed production and natural resource conservation, farms in Bulgaria have a pivotal role in providing significant socio-economic and environmental benefits crucial for long-term development [20]. However, the management of these services is hindered by high production and transaction costs, which complicate the effective implementation of governance mechanisms. These trade-offs between crop productivity and ecosystem services have been consistently recognized in agricultural systems worldwide [21]. Studies identifying challenges in balancing agro-environmental measures with fertilizer use [22], and in maintaining biodiversity with wood production from restored forests [23], have highlighted that trade-offs are being extended to include compromises between ecosystem services and climate change policy goals.
Within agroecosystem services more broadly, understanding the impact of different agricultural management practices is important in planning for long-term production and resource use. Agroecosystems incorporate both crops and livestock, with diverse systems characterized by cropping only, livestock only, and combinations within and between each of these groups. Within cropping-only agriculture, a combination of crop types requires a different management approach from monoculture, which itself may be practiced under varying management systems. Some studies have considered the ecosystem disservices and benefits of different management systems applied to a single crop. For example, Pathak et al. [24] compared the results of conventional and conservation agricultural practices for wheat-growing in an Indian region, and Panwar et al. [25] examined organic and inorganic farming practices in a combined rice–wheat agroecosystem. In examining different land-use systems, it has been found that imbalances occur between crop profitability and environmental costs [26], and over time in ecosystem services between regenerating tropical forest and pasture [27].
Semi-arid regions, where the valuation of ecosystem services in agricultural systems has not been thoroughly investigated, present a critical opportunity for such analysis. This study thus focuses on estimating the economic value of ecosystem services provided by wheat agroecosystems in a semi-arid region. Such research is particularly relevant in the context of Iran’s agricultural landscape, where balancing productivity with environmental conservation is essential for food security and the future development of the economy. Although ecosystem services have recently been used as a tool for land-use planning and conservation management in Iran [28], no investigation has assessed the impacts on the value of ecosystem services under different management systems within a specific agricultural land use involving a single crop.
This study aims to make a broad initial estimate of the economic value of ecosystem services generated by varying management types in a monocultural wheat agroecosystem, with an emphasis on provisioning, regulatory, supporting, and, to a lesser degree, cultural services. A key consideration is to highlight the environmental externalities associated with conventional farming practices, such as chemical fertilizer and pesticide use, which have often been ignored in traditional agricultural valuation models [11]. The current approach thus integrates aspects of ecological, economic, and cultural dimensions to assess agroecosystem services, incorporating both positive contributions and negative externalities. By considering both ecosystem services and environmental damage, this research contributes to the growing body of literature focused on placing a value on the benefits provided by agroecosystems and assessing the trade-offs associated with particular agricultural practices.

2. Materials and Methods

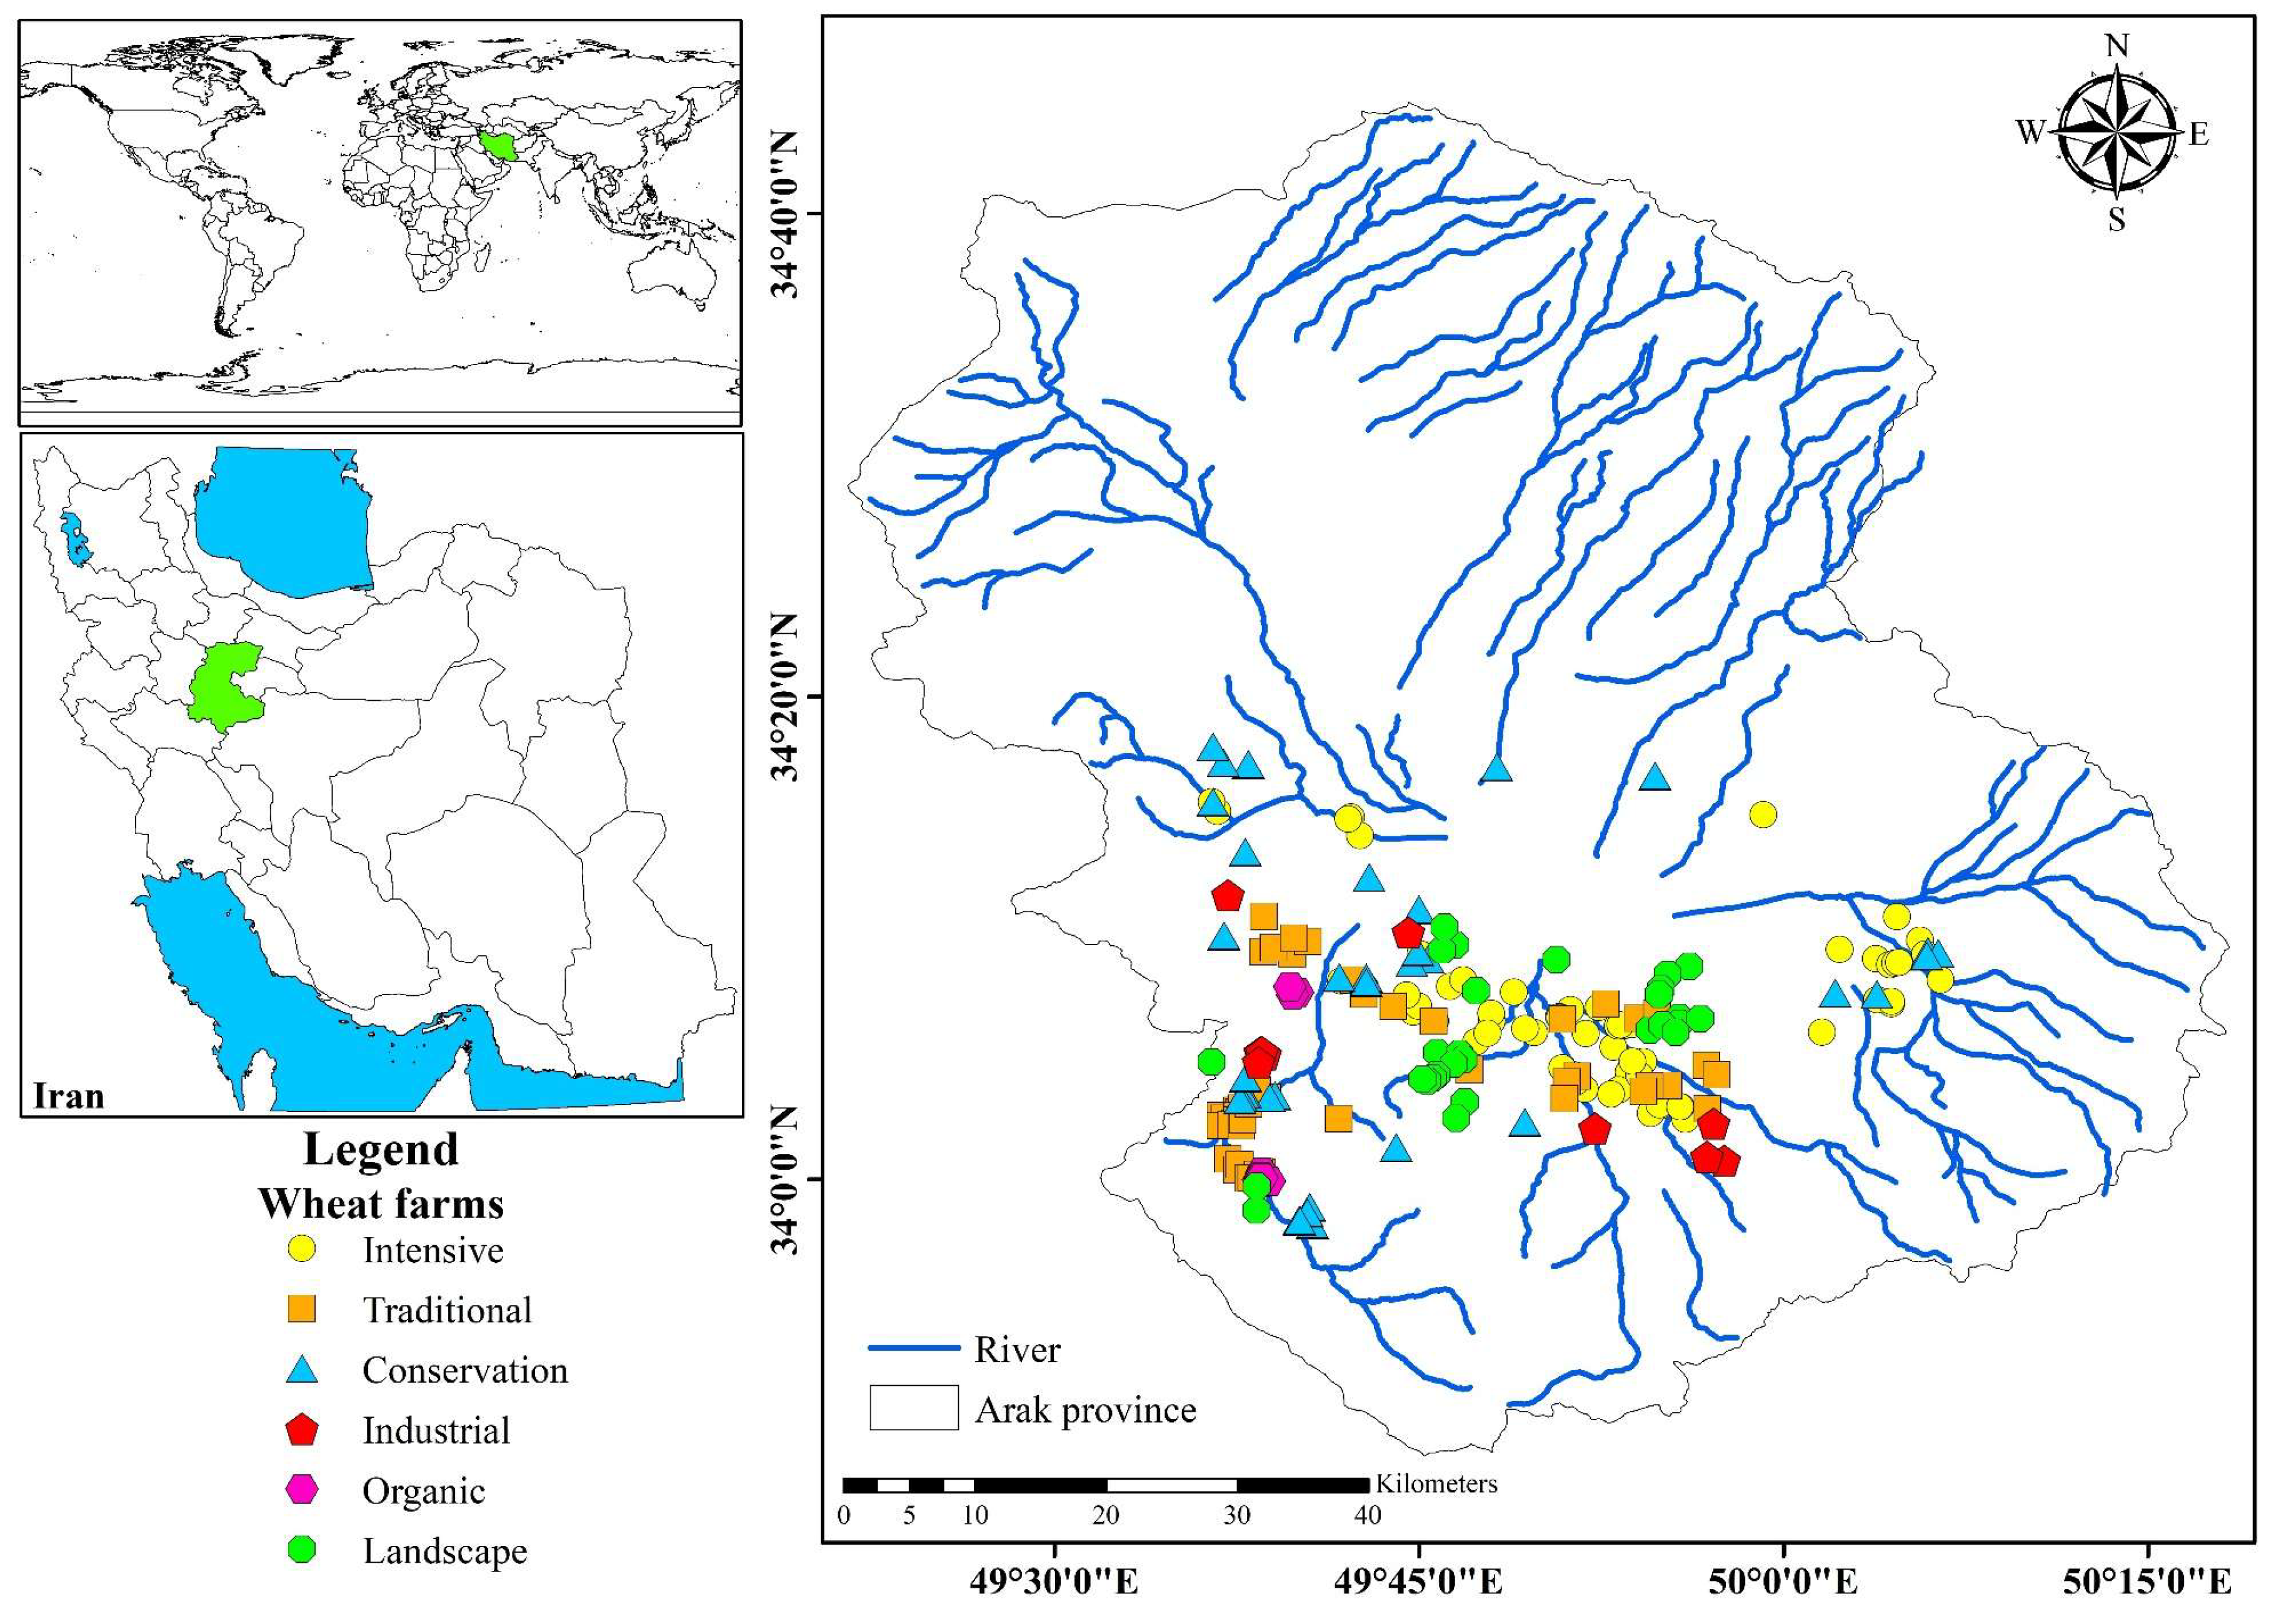
2.1. Study Area and Agronomy Conditions

This study aims to assess the value of the ecosystem services provided by wheat agroecosystems under different management practices in a semi-arid region in Arak County, Markazi Province, Iran (Figure 1). Arak County is located between latitudes 34°5′ N and 44°41′ E. The climate of the region, based on Dumarten’s climate classification, is arid; according to the Ambergris climate classification, it is arid and cold. The annual average temperature in Arak is 13.9 °C, with July being the warmest month (mean 27.3 °C) and January the coldest (−0.8 °C). The average annual rainfall throughout the study area in the crop year 2019–2020 was 379 mm, with a winter maximum and a dry summer [29].
Agriculture is one of the County’s thriving economic sectors, supported by favorable climatic conditions, making it a key agricultural hub in Markazi Province. Various farming systems, including traditional, fully mechanized, and conservation systems, coexist alongside natural ecosystems in the region. The collection of farm data was constrained by the lack of grant funding, limited cooperation from farmers, and the region’s agricultural and topographic diversity, with surrounding steep areas and the cultivation of various crops other than wheat. These difficulties were coupled with uncontrolled urban and industrial expansion and declining rainfall in recent years (to below 150 mm) that had a profound negative impact on the agricultural sector. No farms in urban zones, steeply sloping lands, or industrial areas were included. Despite these challenges, every effort was made to ensure that sampled farms were representative of monocultural wheat-growing farms in the region.

2.2. Data Collection

Official figures were not available for the total number of farms that were devoted to wheat-growing. As this absence of data precluded the sampling of a known and documented agricultural population, information was obtained from literature reviews, field surveys, and interviews with locally based agricultural agents and experts who were also able to provide estimates of farm numbers managed under different systems.
Based on these estimates of wheat farm numbers under different management types, the sample size was determined using Cochran’s formula (Equation (1)):
n = z 2 p q d 2 1 + 1 N z 2 p q d 2 1
where n is the sample size, N is the total population of farmers in the region, z is the Z-value corresponding to the confidence level (95% confidence level was used), pq is the proportion of the population possessing the characteristic of interest, and d is the margin of error or standard error.
Potential respondents were approached, and questionnaires were completed by farmers. Information collected at the farm level included farm size; farm ownership; farmer characteristics (literacy, education level); farm labor (number, days/weeks); farm machinery (traditional tools, fully mechanized); length of wheat/fallow rotation; fertilizer use—type (NPK chemical, organic), annual quantities; pesticides used (frequency, quantity); soil and water conservation practices; presence of windbreaks; crop yield (grain and straw); and recreational use (number of visitors, duration of stay).

2.3. Ecosystem Services and Environmental Impacts

According to the Millennium Ecosystem Assessment [4] report, 22 ecosystem services are defined in five main groups, which can be used to assess the economic value of ecosystems. Accurately valuing these services is highly challenging [19,30], especially as some services cannot be directly priced. For example, the production of medicinal plants or aromatic substances, which are services of natural ecosystems, is only provided by agricultural ecosystems where these products are cultivated. Similarly, fuel and clothing (plant fibers) are not services provided by all agricultural ecosystems. On the other hand, while the services of natural ecosystems are considered positive, agricultural ecosystems contribute to negative impacts such as greenhouse gas emissions, pollution from chemical fertilizers, and the loss of biodiversity. Therefore, in this study, only those services or negative impacts that could occur in wheat agroecosystems and for which data were available were examined. These criteria limited consideration to aspects of food and fodder production, oxygen production, moisture preservation, carbon sequestration, biodiversity, cultural services, greenhouse gas emissions, soil erosion, and pollution from chemical fertilizer use. Once monetary values were estimated for each of the services, these values were converted to US dollars for ease of comparison with other studies, as suggested by De Groot et al. [19]. Ultimately, the costs associated with ecosystem damage were subtracted from the positive service values to estimate the net value of ecosystem services in the wheat agroecosystems studied.
(1) Food and fodder production: The value of food and fodder was determined based on questionnaire results, using the base price per kilogram of wheat grain and straw, and was considered as a value contributing to provisioning services in the farms under study.
(2) Oxygen production: For every kilogram of dry crop matter produced, approximately 1.2 kg of oxygen is released into the atmosphere [31]. Therefore, the amount of oxygen produced was calculated based on the total dry matter (grain and straw) produced, and its value was determined based on the price per kilogram of oxygen [32].
(3) Moisture preservation: In farms with windbreaks, soil moisture storage was calculated as one of the ecosystem services. According to Kumar [33], each row of windbreak trees with medium density reduces evaporation and transpiration by around 10% of the total water used for the crop. Based on this, the amount of water saved in farms with windbreaks was priced based on the cost of water per unit (cubic meter) [34].
(4) Carbon sequestration: The amount of carbon sequestered was estimated based on the carbon content of the produced plant biomass (approximately 45%). Dry plant matter was obtained using the method described for oxygen production. In farms where plant residues were added to the soil, soil carbon content was also calculated using this method. The total carbon sequestered in plant dry matter and soil was then converted to CO2, and the value of carbon sequestration was estimated based on the standard carbon tax price [31]. The price per ton of CO2 was determined according to European carbon tax rates.
(5) Biodiversity: Within monocultural agroecosystems, a decline in biodiversity has been attributed to the use of chemical inputs [35], including fertilizers, herbicides, and pesticides. According to the criteria introduced by Kumar [33], each pesticide application in agricultural ecosystems reduces biodiversity by 10–15%, depending on the type of pesticide used. Accordingly, the value of biodiversity was considered to be the equivalent of 15% of the total ecosystem services from an area [4]. The value of biodiversity in farms where no chemical pesticides were used was taken as the baseline, and other farm values were adjusted according to the number of pesticide applications. Due to wheat’s self-pollination, this service was not calculated for wheat farms, though the role of pollinator insects contributes to biodiversity.
(6) Cultural services: Natural ecosystems offer valuable cultural services due to their tourism and aesthetic appeal, though these services are much less significant in agroecosystems compared to natural ecosystems. Nevertheless, in the questionnaires used in this study, questions were included about the number of visitors to farms and their length of stay. In cases where visitors were recorded, the value of these services was estimated based on the travel costs of each visitor to the area (average bus fare) [19].
(7) Greenhouse gas emissions: Reference [36] reported that in a study of four crops (barley, soybean, cotton, and maize) under conventional management, N2O emissions from soil were approximately 0.036 kg per square meter per year. Additionally, Lv et al. [37] estimated CO2 emissions from wheat field soil at 264.7 g per square meter per year. Based on these values, greenhouse gas emissions (CO2 equivalent) from each hectare of the wheat agroecosystem were calculated using Equation (2):
V G H G = C T × T C e q
where VGHG represents the price of greenhouse gases, CT refers to the carbon tax (the price per unit of CO2 based on the global standard price), and TCeq denotes the total amount of greenhouse gases produced, equivalent to CO2. The value of TCeq is derived from Equation (3):
T C e q = ( E N 2 O + N 2 O e q ) + E C O 2 × C O 2 e q
where E N 2 O represents the amount of N2O emissions, E C O 2 represents the amount of CO2 emissions, N 2 O e q is the CO2 equivalent for N2O, which, according to the IPCC report, is equal to 310 [38], and C O 2 e q is also the CO2 equivalent, which was considered to be 1.
(8) Soil erosion: Various indices have been devised to calculate soil loss, but the Universal Soil Loss Equation (USLE) has widespread acceptance and has proven reliable in estimating soil erosion across diverse agricultural landscapes. This equation is as follows (Equation (4)):
U S L E = R K L S C P
where USLE represents the annual average soil erosion (t ha−1 y−1), R is the rainfall and erosivity index for the geographical region, K is the soil erodibility factor, L is the slope length, S is the slope angle, C is the vegetation cover, and P is the soil conservation practice factor.
In the absence of government-issued soil erosion maps, the input parameters were derived using a combination of available data sources and field-based estimations for sampled farms, as outlined in the following:
  • R factor (rainfall erosivity): This was estimated based on historical rainfall records from the local meteorological station (Arak).
  • K factor (soil erodibility): Soil texture and organic matter content were obtained from local agricultural reports, and interviewed farmers provided soil analysis reports; any other soil survey records available were also used.
  • L-S factor (slope length and slope steepness): These values were extracted from farm slopes.
  • C factor (cover and management): This was determined based on land-use classification and crop residue data, which were collected through field observations and farmer consultations.
  • P factor (conservation practices): The impact of existing conservation measures was estimated based on farmer-reported practices and secondary data sources including agricultural ministry reports.
Estimated soil loss values were then attributed to each farm as accurately as possible within the constraints of available data.
The reduction in soil organic carbon (SOC) was measured down to a depth of 30 cm in two stages: before planting and after planting wheat. This reduction in SOC is mainly due to biological and microbial activities within the soil, and the loss of soil organic matter (SOM) is primarily released into the air as CO2. In commercial farms, various tillage operations, increased use of nitrogen fertilizers, and intensified biological and chemical reactions lead to greater consumption and oxidation of SOC. The prevention of weed growth in the field, which serves as a source of SOM, and other factors also contribute to higher SOC losses.
The estimation of soil erosion was performed using Equation (4), based on the USLE model [39,40]. Additionally, the calculation of SOM loss during the production period was performed by estimating the reduced weight of SOM per hectare, using Equation (5):
S O M L = C O M × S B D × S L T × A r e a
where SOML is soil organic matter lost, COM is the changed organic content (%), SBD represents soil bulk density (kg m−3), SLT is soil layer thickness (m), and Area is the area of cultivation (m2 ha−1 10,000) × (ha).
(9) Pollution from fertilizer use: The value of pollution caused by fertilizers was estimated based on the efficiency of nutrient uptake and the solubility of fertilizers in the soil. Since nitrogen and phosphorus are two key elements that leach from agroecosystems into soil and water resources, nutrient uptake efficiency was used to calculate their leaching levels. Generally, the nitrogen uptake efficiency in wheat agroecosystems in Iran is estimated to be around 40% [41]. Therefore, the remaining 60% is exposed to leaching into soil and water resources. Based on the data obtained from questionnaires, the average nitrogen fertilizer consumption in the wheat agroecosystem under study was 200 kg ha−1 (with an N content of 45%). Additionally, the annual phosphorus leaching rate is estimated to be around 17% of the fertilizer used [37] and, considering the average application rate of 100 kg ha−1 for phosphorus fertilizers, the leached amount was estimated. Due to the lower solubility of phosphorus fertilizers, around 17% of the applied phosphorus acts as a pollution source [37]. Thus, based on the fertilizer usage in the studied wheat fields, the annual pollution was estimated, and its value was determined using the global standard environmental costs for nitrogen and phosphorus pollution [33].
The US dollar was used as the basis for calculating the value of all ecosystem services. The costs associated with ecosystem damage were then subtracted from the positive service values to estimate the net value of ecosystem services in the varying wheat agroecosystems.

2.4. Data Analysis

The analysis in this study utilized the AAA software package (Version 2.5) [42], a widely recognized tool for environmental and agricultural modeling. Specifically designed to perform complex data analysis, the software facilitates non-linear regression modeling, optimization of agroecosystem service valuation, and impact assessments of various agricultural management practices. Key features of the software include its user-friendly interface, ability to handle large datasets, and adaptability to various modeling approaches. It supports a range of statistical and machine learning techniques, making it an excellent choice for analyzing multi-dimensional agricultural and environmental data. Previous research has demonstrated its accuracy in modeling agricultural systems, particularly in arid and semi-arid regions [43,44]. The use of this software in the current study enhances the reliability of the results, and its versatility ensures the analysis is robust and applicable across different regions and crop types.
To assess the relationship between marketable value and crop yield, both Gaussian and plane equations were employed. The selection of these models was based on their ability to capture the non-linear nature of the data, as well as their proven effectiveness in agricultural and environmental modeling:
(1) Gaussian equation: The Gaussian model was chosen for its effectiveness in fitting data that exhibit a bell-shaped curve or are influenced by natural variability. This model is particularly useful when the relationship between variables follows a symmetric distribution, which is often observed in crop yield data in semi-arid environments. It allows for a more accurate representation of peak values and aids in understanding the saturation effects common in agricultural systems.
(2) Plane equation: The plane equation was selected to model linear relationships in the data, particularly where yield and value tend to increase or decrease in a linear manner with respect to one another. This model is suitable for agricultural data that reflect relatively consistent changes in output (e.g., marketable goods value) as input factors such as grain yield and total dry matter yield change.
Both the Gaussian and plane models were evaluated for their goodness of fit and predictive accuracy. The Gaussian model proved particularly effective in capturing the curvilinear relationships often present in crop yield data, while the plane equation provided a simpler linear approximation that was useful for broader generalizations. The results from both models were cross-validated to ensure robustness, and their comparative performance is discussed in the subsequent analysis.

3. Results

3.1. Management of Wheat Agroecosystems

The economic value of six agroecosystem provisioning/regulating services and three environmental costs were determined for each of the five different wheat agroecosystems and a single landscape (non-crop) system. Based on information collected from 203 farms, 83% of farms were farmer-owned, 76% of farmers were literate, and 42% had a tertiary education. The management characteristics of these farming systems are as follows:
(1) Intensive farms: Small farms (less than 5 ha) with high inputs and outputs per m−3 of land. These farms are characterized by low fallow ratios, higher use of inputs such as capital and labor, and higher yields per unit of land (63 farms).
(2) Traditional farms: Farms of less than 1 ha, managed using indigenous knowledge, traditional tools, and natural resources, including organic fertilizers (54 farms).
(3) Conservation farms: Farms between 10 and 30 ha that implement soil and water conservation practices (35 farms).
(4) Industrial farms: Large-scale farms (greater than 100 ha), where all agricultural processes are fully mechanized (10 farms).
(5) Organic agriculture: Very small farms where no chemical or mechanical inputs are used (13 farms).
(6) Landscape farms: These include non-cultivated lands with trees and grasslands located near agricultural fields having similar environmental and soil characteristics to neighboring croplands and are considered as ‘benchmarks’ in this study (180–190 ha: 28 landscape farms).

3.2. Wheat Agroecosystem Services

Table 1 provides a summary of the minimum and maximum values, coefficients of variation, and the shares of total and net values estimated for various ecosystem services and environmental impacts within the wheat agroecosystems studied. These values include the monetary value of the provisioning services of grain and straw production and estimated values for those of oxygen production, moisture preservation, carbon sequestration, biodiversity, and limited cultural services. Of the positive values, (non-monetary) oxygen production constituted the largest component for all management systems. Of the negative (disservice) values, N and P leaching comprised more than 33% of the negative totals in industrial and intensive systems.
Figure 2 shows the economic valuation of agroecosystem services and disservices (in USD/ha/yr) of various agroecosystem services provided in wheat cropping systems under different management practices. The data are categorized by farm management type: intensive, traditional, industrial, conservation, organic, and landscape systems.
The results of this study indicate that food and fodder production is a key provisioning service in wheat agricultural ecosystems, contributing between 11% and 26% of the total ecosystem service value within different farm types. Despite these substantial contributions, atmospheric services—particularly oxygen production and carbon sequestration—dominated total ecosystem service values, contributing up to 74% of the total. The highest economic values for the food and fodder service per hectare were observed in organic (USD 14.96), industrial (USD 10.19), and landscape (USD 10.47) systems, while the lowest were recorded in conservation (USD 8.41) and traditional (USD 9.12) systems (Figure 2). Oxygen production contributed between 32% and 53% of the total ecosystem service value across different farm types, with the highest values observed in intensive (USD 41.37), conservation (USD 39.12), and traditional (USD 35.32) systems, and the lowest in organic (USD 15.66) and industrial (USD 15.23) systems. Carbon sequestration accounted for 5% to 21% of the total ecosystem service value. The highest values were found in conservation (USD 7.01), organic (USD 5.97), and landscape (USD 5.23) systems, while significantly lower levels were recorded in intensive (USD 4.04) and industrial (USD 4.27) farms. Compared to conservation systems, carbon sequestration in intensive and industrial systems was 42% and 39% lower, respectively.
This economic valuation highlights the significant contribution of wheat agroecosystems to both provisioning and regulatory services. The findings indicate that intensive and industrial systems lag behind in carbon sequestration, which may adversely affect soil health.

3.3. Soil Moisture Conservation

Soil moisture conservation represented approximately 13% of the total value of ecosystem services provided by wheat agroecosystems. The highest values for soil moisture retention were observed in landscape and conservation farming systems, whereas intensive agricultural systems showed the lowest values. In farms equipped with windbreaks, moisture retention due to reduced evapotranspiration was estimated at 10% per row of windbreaks [33]. Given the standard irrigation requirement of 6000 cubic meters per hectare for wheat cultivation, the economic value of this service was estimated at USD 2710 per hectare annually. However, the findings indicate that only 7.3% of the farms surveyed utilized tree windbreaks, suggesting that the moisture retention value associated with their presence was perceived to be relatively minor, or that farm size/local topography or financial constraints prevented adoption.

3.4. Biodiversity

The contribution of biodiversity to total ecosystem service value varied across different farm types. In this study, biodiversity accounted for 1.62% of the total ecosystem service value contributed by all farm types. However, when the all-farm biodiversity total was apportioned to specific farming systems, organic (5.28%) and landscape (18.02%) agroecosystems made the largest contributions (Figure 2).

3.5. Cultural Services

Cultural services encompass a range of benefits, including aesthetic, recreational, and spiritual values, which are often overlooked in traditional economic assessments of agricultural systems. Cultural services, as represented here by a single visitor parameter, constituted a minimal portion of the total value of ecosystem services in the studied agroecosystems, amounting to less than 0.47%. This highlights a significant gap in the recognition of these services (Figure 2). Nevertheless, the findings indicated that both cultural services and biodiversity held greater value in landscape and organic systems than in industrial agricultural systems.

3.6. Net Value of Services in Wheat Agroecosystems

The economic valuation of agroecosystem services across different wheat cropping management systems demonstrates that no single wheat farming system is ranked above all others in relation to all positive ecosystem services. In particular, organic (USD 14.96 per hectare) and industrial (USD 10.19) farming systems exhibit the highest economic value for food and feed production. Oxygen production is highest in intensive (USD 41.37) and conservation (USD 39.12) systems, while industrial and organic systems show lower values. The capacity for moisture preservation is most pronounced in industrial (USD 4.16) and conservation (USD 4.06) systems. Carbon sequestration varies significantly across management systems, with conservation (USD 7.01) and organic (USD 5.97) farming capturing the highest amounts. Biodiversity is best supported in conservation (USD 2.24) and traditional (USD 2.05) systems. Cultural services, encompassing aesthetic and recreational benefits, are most valued in conservation (USD 0.81) and organic (USD 0.69) systems.
Agroecosystems generate varying environmental costs across different management systems. Greenhouse gas emissions are highest in conservation (−USD 2.00), industrial (−USD 1.91), and intensive (−USD 1.86) systems. Soil erosion is most severe in intensive systems (−USD 3.02), compared with conservation (−USD 0.41) and organic (−USD 1.08) farm managements, which demonstrate significantly lower rates. Nutrient leaching, primarily from nitrogen and phosphorus, is highest in intensive (−USD 2.58) and industrial (−USD 1.85) systems, exacerbating water pollution risks.
The cumulative impact of these negative externalities results in a reduction in total ecosystem service values, ranging from −4.15% in organic systems to −16.29% in intensive systems, with greenhouse gas emissions accounting for an average of 38.55% of this decline. The total CO2 emissions from wheat agroecosystems, when evaluated using a carbon tax rate of USD 14.25 per ton of CO2, amount to an estimated annual cost of −USD 1570 per hectare. Notably, greenhouse gas emissions in organic and landscape-based systems are 17% and 28% lower, respectively, than in industrial and intensive systems. The combined environmental damage from greenhouse gas emissions and nutrient leaching in the wheat agroecosystems studied here amounted to a cost of USD 4080, resulting in the higher yields and profits of high input agroecosystems being outweighed by the accompanying larger environmental costs. These differences in positive and negative ecosystem valuations across wheat agroecosystems emphasize the need to consider mechanisms to maximize trade-off benefits between productivity and environmental sustainability.

3.7. Relationship Between Grain and Forage Yield and Relative Service Value

In the wheat agroecosystem, the relative service value—defined as the ratio of net service value to the value of marketable services (grain and forage)—ranged from 2.84 in organic agroecosystems to 7.33 in conservation agroecosystems. These variations were significantly influenced by dry matter production and grain yield (Figure 3). Figure 3 illustrates the correlation between the economic value of ecosystem services and the marketable goods value (in USD) derived from wheat production. The relationship is modeled on two key yield components: total dry matter (TDM) and grain yield (GY). The figure includes two separate curves for each yield component (TDM and GY), highlighting their respective impacts on both ecosystem service value and marketable goods value. It appears that the reduction in input use, and consequently the decrease in negative externalities from agricultural management practices, is the primary factor contributing to the increased service value in conservation agroecosystems. Conversely, despite having lower marketable outputs, organic agroecosystems demonstrated a higher economic value compared to other agroecosystems.
An analysis of the contribution to the marketable value of grain yield and total dry matter in different wheat agroecosystems showed considerable variation. The results from applying non-linear regression models using Gaussian and plane equations revealed that both intensive and traditional systems had a modest R value of 0.56, which was significant (p < 0.05) for the traditional and conservation systems (Table 2). Although the industrial system demonstrated the highest R value, this was not significant (p = 0.979). These results contrasted with those of the organic system with R = 0.933 (p = 0.052), suggesting that this model is relatively strong but its statistical significance is somewhat uncertain. Overall, the conservation system provides the most reliable and statistically significant model (R = 0.95, p < 0.05), followed by the traditional system, while the intensive, industrial, and organic systems show moderate to weak significance.

4. Discussion

The results from this study show that wheat agroecosystems managed primarily for high grain production are estimated to contribute less to ecosystem services in all categories (except for oxygen production) than organic or landscape systems contribute. This is consistent with previous investigations in which researchers have found that converting natural ecosystems into agroecosystems typically results in a 40–60% loss of soil carbon in the form of CO2 [45], thereby exacerbating climate change through increased greenhouse gas emissions [46]. Although grain production and other marketable services are critical functions of agroecosystems, evidence indicates that maximizing these services in intensive agroecosystems adversely affects other ecosystem services [47]. This imbalance may be alleviated by plant breeding for higher-yielding species with lower demands for chemical fertilizers. Beyond food and forage, the share of other ecosystem services in organic and natural agroecosystems examined here was generally higher than for others, a discrepancy also reported in other studies [48,49]. Intensive farming illustrates the trade-off between increased yield and reduced ecosystem services [46], which is shown in simulations between widely different land uses [50]. In addition, intensive farming may reduce soil organic matter, degrade biological properties, and contribute to long-term declines in soil quality [51,52]. The environmental costs of industrialized farming practices could be reduced by transitioning to more sustainable agricultural practices with significant environmental benefits, given that these regulating, cultural, and supporting agroecosystem services can far exceed the market value of crops themselves (e.g., [38,53,54]).
Of the ecosystem services considered in this study, most of the value is accounted for by food and forage and oxygen production, with lesser contributions from moisture preservation, carbon sequestration, biodiversity, and cultural services. Soil moisture retention using windbreaks accounts for 13% of the total ecosystem value, demonstrating the importance of maintaining soil moisture as a critical service, particularly in agricultural contexts where water scarcity can limit biomass production, where the efficient use of rainfall is essential, and where improved moisture management may potentially enhance agricultural resilience against climate change [55]. Estimates of windbreak value in Canterbury, New Zealand, revealed the variability in ecosystem service valuation across different geographical contexts and farming practices [56,57], emphasizing the need for localized studies to accurately assess the complex relationships of windbreaks and moisture availability in surrounding areas [58]. In this context, the low adoption rate of tree windbreaks among the surveyed farms (only 7.3%) requires a local assessment of their potential for improving soil moisture retention and agricultural productivity. If soil moisture retention was demonstratively favorable, then farmers should be encouraged through education and financial incentives to introduce windbreaks. Such a process would also stimulate policy support for potentially adopting other more sustainable agricultural practices [59,60].
The uneven distribution of ecosystem services between different wheat agroecosystems in this study appears to be linked to the gradual decline in biodiversity associated with agricultural intensification. This decline, driven by changes in vegetation management and the increasing use of chemical inputs, is evident in other regions around the globe. Between 1970 and 2000, for example, biodiversity in European agricultural lands declined by 23%, which significantly decreased the ecosystem services provided in these areas [61]. Biodiversity constitutes only 1.62% of the total value of ecosystem services in the studied wheat agroecosystems, with lower values in industrial systems than in organic and conservation systems. This suggests that farming practices that rely on the use of chemical inputs adversely influence biodiversity levels and consequently the services supplied by these ecosystems. The observed biodiversity decline due to intensive farming practices not only jeopardizes the ecosystem services provided but also points to the need for action to integrate biodiversity conservation into agricultural policies and practices for sustainable food production and ecosystem functionality [62,63,64,65].
The disparities in biodiversity services between different farming systems found in this study are reflected in the associated cultural service values which are important in broader discussions of ecosystem valuation. Industrial agricultural practices, often characterized by monocultures and heavy reliance on chemical inputs, tend to diminish the aesthetic and cultural values of a landscape, resulting in lower perceived benefits [66]. By promoting biodiversity, organic and landscape systems typically enhance an area’s natural beauty, which can lead to greater engagement and connection to the land among communities [67]. The simple measure of visitation used in this study does not include more complex valuations which are also captured within cultural services. These involve attitudes in relation to present and past material culture (archaeological remains, sites of importance for local history), as well as traditional crafts and other practices that contribute to local or regional identity. Fully integrating cultural services into the valuation of agricultural systems may encourage farmers to adopt more effective long-term practices, leading to enhanced community well-being and fostering a stronger connection between people and their environment. While cultural services on farms in this study are currently estimated to represent a minor fraction of the total ecosystem service value, their importance in promoting community connection, environmental appreciation, and overall well-being cannot be underestimated. Acknowledging and enhancing these services contributes to fostering agricultural practices intended to ensure the longevity of productive agroecosystems [68].
The negative services associated with wheat agroecosystems in this study reflect the significant environmental costs incurred by various agricultural practices, costs which are expected to be exacerbated by climate change [69]. The substantial reduction in ecosystem service values, particularly in intensive systems, underscores the need for management approaches that address greenhouse gas emissions, soil erosion, and nutrient leaching. Some researchers have argued that the disruption of nutrient cycles in agroecosystems is the most significant factor leading to the loss of ecosystem integrity and the impairment of ecosystem service delivery [70], a problem that may be partly addressed through integrated nutrient management [71]. Generally, the greater the input consumption in ecosystems, the higher the environmental impacts, including lower carbon sequestration, reduced soil biodiversity, and increased global warming potential [32,72,73,74]. Optimizing the use of chemical inputs and fossil fuels will conserve these valuable resources [75,76]. The finding here that, in aggregate, greenhouse gas emissions contribute an average of 38.55% in overall negative service values highlights the profound impact of agricultural practices on climate change. Worldwide, agricultural activities and the use of non-renewable energy in this sector are responsible for one-fourth of global pollutant emissions [77]. With intensive systems exhibiting the highest emissions due to their increased reliance on chemical fertilizers [78] and fossil fuels [79], lower greenhouse emissions are associated with alternative practices that have low or organic inputs while also supporting biodiversity and ecosystem resilience [80,81]. The observed costs of nutrient leaching to soil and water resources in intensive systems far exceed those in organic or landscape systems (Figure 2), a problem requiring the reassessment of input use and management strategies. Strategies such as integrated pest management, minimal tillage, soil moisture retention, and organic farming can play a pivotal role in reducing nutrient losses while maintaining productivity.
A major challenge confronting agricultural management relates to decisions around balancing trade-offs between agricultural productivity and environmental sustainability. De Moraes Sá et al. [82] considered that enhanced input management would lead to economic savings, lower production costs, and climate change mitigation. Researchers have pointed to the need for concerted efforts to prioritize the adoption of sustainable practices to ensure long-term food security while reducing adverse environmental impacts to maintain enhanced agroecosystem services (e.g., [69,83,84,85,86]). The higher relative service value in conservation agroecosystems found in this study and others (e.g., [87]) suggests that reducing the negative externalities associated with intensive agricultural practices can significantly enhance overall ecosystem benefits. Conversely, the pursuit of high yields in intensive systems as currently practiced often results in the degradation of essential services.
Capable management of inputs to complex cropping systems at various scales has demonstrated multiple benefits. In a study on corn–soybean–wheat ecosystems with cover crops in rotation, it was found that, in addition to improving crop yields, the rotations reduced pest populations by 40–60% (biological pest control) and decreased nitrogen and phosphorus leaching by 70% and 32%, respectively [88]. Skillful management of agricultural ecosystems thus plays a critical role in increasing organic matter, reducing fertilizer leaching, and improving biodiversity [89]. In a single-crop system, a finer-resolution study using 16 wheat varieties identified that groups of varieties differed in their ability to deliver a tested bundle of ecosystem services [90], thus confirming that further opportunities exist for effective agroecosystem management.
In arid and semi-arid areas, major challenges to agroecosystem sustainability are presented by soil erosion, unreliable rainfall, and socio-economic systems [91,92]. Pursuing high yields at the expense of environmental health has ecological costs that may ultimately compromise the capacity of these systems to support future agricultural production [93,94]. However, reducing the negative externalities associated with intensive agricultural practices can lead to significant improvements in ecosystem function [95,96]. Encouraging conservation-oriented practices, such as reduced tillage and organic farming, can enhance carbon sequestration and improve soil health while maintaining the productivity of wheat agroecosystems [97]. Emphasizing the importance of effective management approaches will be vital in mitigating the adverse impacts of agriculture on ecosystems while ensuring food security [84,85,86].
The relationship observed in this study between grain and forage yield and relative ecosystem service value highlights the intricate balance between productivity and ecosystem health within wheat agroecosystems in arid and semi-arid environments. The variations in relative service value between different wheat agroecosystem types emphasize the potential benefits of adopting conservation and organic practices, which enhance service value despite having lower marketable outputs than intensive systems.

5. Conclusions and Recommendations

This study of wheat agroecosystems in a province of Iran reveals significant disparities in resource use efficiency between farm management types. The analysis indicates that while high-input agricultural systems produce higher yields, they also lead to considerable environmental costs, including increased greenhouse gas emissions, soil erosion, and nutrient runoff. Conversely, organic farming systems, although associated with lower yields, exhibit considerable environmental benefits, with lower negative externalities. No management type provided the maximum outcome for all the ecosystem services examined, confirming that trade-offs are operating in all management types. Although balancing trade-offs between the goals of productivity and environmental conservation is a challenge for farm management everywhere, the increasing problems of land degradation and nutrient leaching have forced further consideration of sustainable agricultural practices to maintain productivity and provide greater food security. In this study, attention is directed towards potential improvements in key factors such as soil health and water use. The implementation of specific strategies that consider variations in regional and local biophysical environments and farm management types is essential for successful policy interventions. The management type can be selected for maximizing ecosystem services and minimizing negative externalities, and policy settings can incorporate encouraging and educating farmers into applying optimal combinations.
In light of these findings for wheat agroecosystem types in a semi-arid climate, future research for assisting in maintaining these productive agroecosystems would ideally involve the following:
  • Continuing to investigate the performance of different wheat species, with selection for robust, high-yielding, drought-resistant varieties having low (chemical) fertilizer requirements;
  • Examining the potential for reducing monoculture through introducing an additional crop and/or grazing rotation;
  • Analyzing tillage and cropping practices to maximize soil organic carbon;
  • Assessing water management practices, including field studies of tree windbreaks and their long-term role in assisting moisture retention under specific environmental and social conditions;
  • Investigating mechanisms for changed practices to reduce reliance on chemical fertilizers, including principles of integrated nutrient management;
  • Exploring possibilities for enhancing ecosystem benefits from increases in the provisioning role of cultural services;
  • Maintaining strong cooperation between researchers, farmers, and policymakers.

Author Contributions

Conceptualization, S.S.; methodology, S.S., Z.M. and D.D.; formal analysis, S.S. and Z.M.; investigation, S.S. and Z.M.; data curation, S.S. and Z.M.; writing—original draft preparation, S.S. and Z.M.; writing— review and editing, S.S., Z.M. and D.D. All authors have read and agreed to the published version of the manuscript.

Funding

This research received no external funding.

Institutional Review Board Statement

This study did not involve any invasive procedures or sensitive personal data. According to Arak University, ethical approval was not required for this type of non-interventional research. However, all participants were informed about the purpose of the study, the voluntary nature of their participation, and the measures taken to ensure the confidentiality and anonymity of their responses.

Informed Consent Statement

Informed consent was obtained from all participants involved in this study. Participants were assured that their anonymity would be maintained and that the data collected would be used solely for research purposes.

Data Availability Statement

Data used can be requested from the corresponding author.

Conflicts of Interest

The authors declare no conflicts of interest.

References

  1. Spash, C.L. Ecosystems, contingent valuation and ethics: The case of wetland re-creation. Ecol. Econ. 2000, 34, 195–215. [Google Scholar] [CrossRef]
  2. Petcharat, A.; Lee, Y.; Chang, J.B. Choice experiments for estimating the non-market value of ecosystem services in the Bang Kachao Green Area, Thailand. Sustainability 2020, 12, 7637. [Google Scholar] [CrossRef]
  3. Dashtbozorgi, F.; Hedayatiaghmashhadi, A.; Dashtbozorgi, A.; Ruiz–Agudelo, C.A.; Fürst, C.; Cirella, G.T.; Naderi, M. Ecosystem services valuation using InVEST modeling: Case from southern Iranian mangrove forests. Reg. Stud. Mar. Sci. 2023, 60, 102813. [Google Scholar] [CrossRef]
  4. Millenium Ecosystem Assessment. Ecosystems and Human Well-Being: Current State and Trends: Findings of the Condition and Trends Working Group; Island Press: Washington, DC, USA, 2005; ISBN 1559632275. [Google Scholar]
  5. Jiang, L.; Wang, Z.; Zuo, Q.; Du, H. Simulating the impact of land use change on ecosystem services in agricultural production areas with multiple scenarios considering ecosystem service richness. J. Clean. Prod. 2023, 397, 136485. [Google Scholar] [CrossRef]
  6. Gebhardt, S.; van Dijk, J.; Wassen, M.J.; Bakker, M. Agricultural intensity interacts with landscape arrangement in driving ecosystem services. Agric. Ecosyst. Environ. 2023, 357, 108692. [Google Scholar] [CrossRef]
  7. Ali, M.A.; Kamraju, M. Natural Resources and Society: Understanding the Complex Relationship Between Humans and the Environment; Springer Nature: Berlin/Heidelberg, Germany, 2023; ISBN 3031467205. [Google Scholar]
  8. Norris, K.; Potts, S.G.; Mortimer, S.R. Ecosystem services and food production. Issues Environ. Sci. Technol. 2010, 30, 52–69. [Google Scholar]
  9. Comberti, C.; Thornton, T.F.; De Echeverria, V.W.; Patterson, T. Ecosystem services or services to ecosystems? Valuing cultivation and reciprocal relationships between humans and ecosystems. Glob. Environ. Chang. 2015, 34, 247–262. [Google Scholar] [CrossRef]
  10. Baude, M.; Meyer, B.C.; Schindewolf, M. Land use change in an agricultural landscape causing degradation of soil based ecosystem services. Sci. Total Environ. 2019, 659, 1526–1536. [Google Scholar] [CrossRef]
  11. Marzban, Z.; Asgharipour, M.R.; Ghanbari, A.; Ramroudi, M.; Seyedabadi, E. Determining cropping patterns with emphasis on optimal energy consumption using LCA and multi-objective planning: A case study in eastern Lorestan Province, Iran. Energy Ecol. Environ. 2021, 7, 489–507. [Google Scholar] [CrossRef]
  12. DeClerck, F.A.J.; Jones, S.K.; Attwood, S.; Bossio, D.; Girvetz, E.; Chaplin-Kramer, B.; Enfors, E.; Fremier, A.K.; Gordon, L.J.; Kizito, F. Agricultural ecosystems and their services: The vanguard of sustainability? Curr. Opin. Environ. Sustain. 2016, 23, 92–99. [Google Scholar] [CrossRef]
  13. Sharafi, S.; Kazemi, A.; Amiri, Z. Estimating energy consumption and GHG emissions in crop production: A machine learning approach. J. Clean. Prod. 2023, 408, 137242. [Google Scholar] [CrossRef]
  14. Ahammad, R.; Tomscha, S.A.; Gergel, S.E.; Baudron, F.; Duriaux-Chavarría, J.-Y.; Foli, S.; Gumbo, D.; Rowland, D.; van Vianen, J.; Sunderland, T.C.H. Do provisioning ecosystem services change along gradients of increasing agricultural production? Landsc. Ecol. 2024, 39, 5. [Google Scholar] [CrossRef]
  15. Sanou, J.; Tengberg, A.; Bazié, H.R.; Mingasson, D.; Ostwald, M. Assessing trade-offs between agricultural productivity and ecosystem functions: A review of science-based tools? Land 2023, 12, 1329. [Google Scholar] [CrossRef]
  16. Segre, H.; Segoli, M.; Carmel, Y.; Shwartz, A. Experimental evidence of multiple ecosystem services and disservices provided by ecological intensification in Mediterranean agro-ecosystems. J. Appl. Ecol. 2020, 57, 2041–2053. [Google Scholar] [CrossRef]
  17. Beillouin, D.; Ben-Ari, T.; Malézieux, E.; Seufert, V.; Makowski, D. Positive but variable effects of crop diversification on biodiversity and ecosystem services. Glob. Change Biol. 2021, 27, 4697–4710. [Google Scholar] [CrossRef] [PubMed]
  18. Shah, S.M.; Liu, G.; Yang, Q.; Wang, X.; Casazza, M.; Agostinho, F.; Lombardi, G.V.; Giannetti, B.F. Emergy-based valuation of agriculture ecosystem services and dis-services. J. Clean. Prod. 2019, 239, 118019. [Google Scholar] [CrossRef]
  19. De Groot, R.; Brander, L.; Van Der Ploeg, S.; Costanza, R.; Bernard, F.; Braat, L.; Christie, M.; Crossman, N.; Ghermandi, A.; Hein, L. Global estimates of the value of ecosystems and their services in monetary units. Ecosyst. Serv. 2012, 1, 50–61. [Google Scholar] [CrossRef]
  20. Bachev, H. Agro-ecosystem services management of Bulgarian farms. Bulg. J. Agric. Sci. 2021, 27, 1023–1038. [Google Scholar]
  21. Viana, C.M.; Freire, D.; Abrantes, P.; Rocha, J.; Pereira, P. Agricultural land systems importance for supporting food security and sustainable development goals: A systematic review. Sci. Total Environ. 2022, 806, 150718. [Google Scholar] [CrossRef]
  22. Longo, M.; Dal Ferro, N.; Lazzaro, B.; Morari, F. Trade-offs among ecosystem services advance the case for improved spatial targeting of agri-environmental measures. J. Environ. Manag. 2021, 285, 112131. [Google Scholar] [CrossRef]
  23. Hua, F.; Bruijnzeel, L.A.; Meli, P.; Martin, P.A.; Zhang, J.; Nakagawa, S.; Miao, X.; Wang, W.; McEvoy, C.; Peña-Arancibia, J.L. The biodiversity and ecosystem service contributions and trade-offs of forest restoration approaches. Science 2022, 376, 839–844. [Google Scholar] [CrossRef]
  24. Pathak, H.; Chakrabarti, B.; Mina, U.; Pramanik, P.; Sharma, D.K. Ecosystem services of wheat (Triticum aestivum) production with conventional and conservation agricultural practices in the Indo-Gangetic Plains. Indian J. Agric. Sci. 2017, 87, 987–991. [Google Scholar] [CrossRef]
  25. Panwar, A.S.; Ansari, M.A.; Ravisankar, N.; Babu, S.; Prusty, A.K.; Ghasal, P.C.; Choudhary, J.; Shamim, M.; Singh, R.; Raghavendra, K.J. Effect of organic farming on the restoration of soil quality, ecosystem services, and productivity in rice–wheat agro-ecosystems. Front. Environ. Sci. 2022, 10, 972394. [Google Scholar] [CrossRef]
  26. Rasul, G. Ecosystem services and agricultural land-use practices: A case study of the Chittagong Hill Tracts of Bangladesh. Sustain. Sci. Pract. Policy 2009, 5, 15–27. [Google Scholar] [CrossRef]
  27. Naime, J.; Mora, F.; Sánchez-Martínez, M.; Arreola, F.; Balvanera, P. Economic valuation of ecosystem services from secondary tropical forests: Trade-offs and implications for policy making. For. Ecol. Manag. 2020, 473, 118294. [Google Scholar] [CrossRef]
  28. Abolmaali, S.M.; Tarkesh, M.; Mousavi, S.A.; Karimzadeh, H.; Pourmanafi, S.; Fakheran, S. Identifying priority areas for conservation: Using ecosystem services hotspot mapping for land-use/land-cover planning in central of Iran. Environ. Manag. 2024, 73, 1016–1031. [Google Scholar] [CrossRef]
  29. Sharafi, S.; Mohammadi Ghaleni, M. Revealing accuracy in climate dynamics: Enhancing evapotranspiration estimation using advanced quantile regression and machine learning models. Appl. Water Sci. 2024, 14, 162. [Google Scholar] [CrossRef]
  30. Costanza, R.; d’Arge, R.; De Groot, R.; Farber, S.; Grasso, M.; Hannon, B.; Limburg, K.; Naeem, S.; O’neill, R.V.; Paruelo, J. The value of the world’s ecosystem services and natural capital. Nature 1997, 387, 253–260. [Google Scholar] [CrossRef]
  31. Thornes, J. Atmospheric services. Ecosyst. Serv. 2010, 30, 70–103. [Google Scholar]
  32. Thornes, J.; Bloss, W.; Bouzarovski, S.; Cai, X.; Chapman, L.; Clark, J.; Dessai, S.; Du, S.; van der Horst, D.; Kendall, M. Communicating the value of atmospheric services. Meteorol. Appl. 2010, 17, 243–250. [Google Scholar] [CrossRef]
  33. Kumar, P. The Economics of Ecosystems and Biodiversity: Ecological and Economic Foundations; Routledge: Abingdon-on-Thames, UK, 2012; ISBN 1849775486. [Google Scholar]
  34. Sharafi, S.; Nahvinia, M.J. Sustainability insights: Enhancing rainfed wheat and barley yield prediction in arid regions. Agric. Water Manag. 2024, 299, 108857. [Google Scholar] [CrossRef]
  35. Kremen, C. Managing ecosystem services: What do we need to know about their ecology? Ecol. Lett. 2005, 8, 468–479. [Google Scholar] [CrossRef] [PubMed]
  36. De Groot, R.S.; Wilson, M.A.; Boumans, R.M.J. A typology for the classification, description and valuation of ecosystem functions, goods and services. Ecol. Econ. 2002, 41, 393–408. [Google Scholar] [CrossRef]
  37. Lv, Y.; Gu, S.; Guo, D. Valuing environmental externalities from rice–wheat farming in the lower reaches of the Yangtze River. Ecol. Econ. 2010, 69, 1436–1442. [Google Scholar] [CrossRef]
  38. IPCC. IPCC Special Report on Carbon Dioxide Capture and Storage; Metz, B., Davidson, O., de Coninck, H.C., Loos, M., Meyer, L.A., Eds.; Cambridge University Press: Cambridge, UK; New York, NY, USA, 2005; ISBN 9780521866439. [Google Scholar]
  39. Vaezi, A.R.; Sadeghi, S.H.R.; Bahrami, H.A.; Mahdian, M.H. Modeling the USLE K-factor for calcareous soils in northwestern Iran. Geomorphology 2008, 97, 414–423. [Google Scholar] [CrossRef]
  40. Ostovari, Y.; Ghorbani-Dashtaki, S.; Bahrami, H.-A.; Naderi, M.; Dematte, J.A.M.; Kerry, R. Modification of the USLE K factor for soil erodibility assessment on calcareous soils in Iran. Geomorphology 2016, 273, 385–395. [Google Scholar] [CrossRef]
  41. Mahallati, M.N.; Koocheki, A. Trend analysis of nitrogen use and productivity in wheat (Triticum aestivum L.) production systems of Iran. Agroecology 2017, 8, 612–627. [Google Scholar]
  42. Liu, H.; Li, X.; Chen, F.; Härdle, W.; Liang, H. A comprehensive comparison of goodness-of-fit tests for logistic regression models. Stat. Comput. 2024, 34, 175. [Google Scholar] [CrossRef]
  43. Bernardes, R.C.; Botina, L.L.; Ribas, A.; Soares, J.M.; Martins, G.F. Artificial intelligence-driven tool for spectral analysis: Identifying pesticide contamination in bees from reflectance profiling. J. Hazard. Mater. 2024, 480, 136425. [Google Scholar] [CrossRef]
  44. El Afandi, G.; Ismael, H.; Fall, S. Application of OpenAir and AgDRIFT models to estimate organophosphate pesticide spray drift: A case study in Macon County, Alabama. Agriculture 2023, 13, 1763. [Google Scholar] [CrossRef]
  45. Murty, D.; Kirschbaum, M.U.F.; Mcmurtrie, R.E.; Mcgilvray, H. Does conversion of forest to agricultural land change soil carbon and nitrogen? A review of the literature. Glob. Change Biol. 2002, 8, 105–123. [Google Scholar] [CrossRef]
  46. Randall, A. Valuing the outputs of multifunctional agriculture. Eur. Rev. Agric. Econ. 2002, 29, 289–307. [Google Scholar] [CrossRef]
  47. Tilman, D.; Cassman, K.G.; Matson, P.A.; Naylor, R.; Polasky, S. Agricultural sustainability and intensive production practices. Nature 2002, 418, 671–677. [Google Scholar] [CrossRef] [PubMed]
  48. Koocheki, A.; Nassiri Mahallati, M.; Amin Ghafoori, A.; Mahlooji, M.; Fallahpour, F. Economic value of agroecosystem services within wheat fields in Khorasan Razavi province. J. Agroecol. 2016, 8, 612–627. [Google Scholar]
  49. Grandy, A.S.; Loecke, T.D.; Parr, S.; Robertson, G.P. Long-term trends in nitrous oxide emissions, soil nitrogen, and crop yields of till and no-till cropping systems. J. Environ. Qual. 2006, 35, 1487–1495. [Google Scholar] [CrossRef]
  50. Jin, G.; Chen, K.; Wang, P.; Guo, B.; Dong, Y.; Yang, J. Trade-offs in land-use competition and sustainable land development in the North China Plain. Technol. Forecast. Soc. Change 2019, 141, 36–46. [Google Scholar] [CrossRef]
  51. Bapiri, D.; Khodaverdiloo, H.; Barin, M.; Ghoosta, Y. The Impact of Cultivation on Some Soil Biological Properties: A Case Study in West Azarbaijan Province, Iran. Appl. Soil Res. 2020, 8, 96–108. [Google Scholar]
  52. Tang, F.H.M.; Crews, T.E.; Brunsell, N.A.; Vico, G. Perennial intermediate wheatgrass accumulates more soil organic carbon than annual winter wheat–a model assessment. Plant Soil 2024, 494, 509–528. [Google Scholar] [CrossRef]
  53. Pretty, J.N.; Brett, C.; Gee, D.; Hine, R.E.; Mason, C.F.; Morison, J.I.L.; Raven, H.; Rayment, M.D.; van der Bijl, G. An assessment of the total external costs of UK agriculture. Agric. Syst. 2000, 65, 113–136. [Google Scholar] [CrossRef]
  54. Melchior, I.C.; Newig, J. Governing transitions towards sustainable agriculture—Taking stock of an emerging field of research. Sustainability 2021, 13, 528. [Google Scholar] [CrossRef]
  55. Sikka, A.K.; Alam, M.F.; Mandave, V. Agricultural water management practices to improve the climate resilience of irrigated agriculture in India. Irrig. Drain. 2022, 71, 7–26. [Google Scholar] [CrossRef]
  56. Sandhu, H.S.; Wratten, S.D.; Cullen, R.; Case, B. The future of farming: The value of ecosystem services in conventional and organic arable land. An experimental approach. Ecol. Econ. 2008, 64, 835–848. [Google Scholar] [CrossRef]
  57. Mackay-Smith, T.H.; Burkitt, L.; Reid, J.; López, I.F.; Phillips, C. A framework for reviewing silvopastoralism: A New Zealand hill country case study. Land 2021, 10, 1386. [Google Scholar] [CrossRef]
  58. Weninger, T.; Scheper, S.; Lackóová, L.; Kitzler, B.; Gartner, K.; King, N.W.; Cornelis, W.; Strauss, P.; Michel, K. Ecosystem services of tree windbreaks in rural landscapes—A systematic review. Environ. Res. Lett. 2021, 16, 103002. [Google Scholar] [CrossRef]
  59. Smith, M.M.; Bentrup, G.; Kellerman, T.; MacFarland, K.; Straight, R.; Ameyaw, L. Windbreaks in the United States: A systematic review of producer-reported benefits, challenges, management activities and drivers of adoption. Agric. Syst. 2021, 187, 103032. [Google Scholar] [CrossRef]
  60. Bagheri, A.; Teymouri, A. Farmers’ intended and actual adoption of soil and water conservation practices. Agric. Water Manag. 2022, 259, 107244. [Google Scholar] [CrossRef]
  61. Fitter, A.; Elmqvist, T.; Haines-Young, R.; Potschin, M.; Rinaldo, A.; Setala, H.; Stoll-Kleemann, S.; Zobel, M.; Murlis, J. An assessment of ecosystem services and biodiversity in Europe. Issues Environ. Sci. Technol. 2010, 30, 1–28. [Google Scholar]
  62. Carpenter, S.R.; DeFries, R.; Dietz, T.; Mooney, H.A.; Polasky, S.; Reid, W.V.; Scholes, R.J. Millennium ecosystem assessment: Research needs. Science 2006, 314, 257–258. [Google Scholar] [CrossRef]
  63. Emmerson, M.; Morales, M.B.; Oñate, J.J.; Batary, P.; Berendse, F.; Liira, J.; Aavik, T.; Guerrero, I.; Bommarco, R.; Eggers, S. How agricultural intensification affects biodiversity and ecosystem services. In Advances in Ecological Research; Elsevier: Amsterdam, The Netherlands, 2016; Volume 55, pp. 43–97. [Google Scholar]
  64. Berbeć, A.K.; Staniak, M.; Feledyn-Szewczyk, B.; Kocira, A.; Stalenga, J. Organic but also low-input conventional farming systems support high biodiversity of weed species in winter cereals. Agriculture 2020, 10, 413. [Google Scholar] [CrossRef]
  65. Kremen, C. Ecological intensification and diversification approaches to maintain biodiversity, ecosystem services and food production in a changing world. Emerg. Top. Life Sci. 2020, 4, 229–240. [Google Scholar]
  66. Mueller, L.; Eulenstein, F.; Dronin, N.M.; Mirschel, W.; McKenzie, B.M.; Antrop, M.; Jones, M.; Dannowski, R.; Schindler, U.; Behrendt, A. Agricultural landscapes: History, status and challenges. In Exploring and Optimizing Agricultural Landscapes; Springer: Berlin/Heidelberg, Germany, 2021; pp. 3–54. [Google Scholar]
  67. Sharma, I.; Birman, S. Biodiversity Loss, Ecosystem Services, and Their Role in Promoting Sustainable Health. In The Climate-Health-Sustainability Nexus: Understanding the Interconnected Impact on Populations and the Environment; Springer: Berlin/Heidelberg, Germany, 2024; pp. 163–188. [Google Scholar]
  68. Rani, K.; Rani, A.; Sharma, P.; Dahiya, A.; Punia, H.; Kumar, S.; Sheoran, S.; Banerjee, A. Legumes for agroecosystem services and sustainability. In Advances in Legumes for Sustainable Intensification; Elsevier: Amsterdam, The Netherlands, 2022; pp. 363–380. [Google Scholar]
  69. Yang, Y.; Tilman, D.; Jin, Z.; Smith, P.; Barrett, C.B.; Zhu, Y.-G.; Burney, J.; D’Odorico, P.; Fantke, P.; Fargione, J. Climate change exacerbates the environmental impacts of agriculture. Science 2024, 385, eadn3747. [Google Scholar] [CrossRef]
  70. Dale, V.H.; Polasky, S. Measures of the effects of agricultural practices on ecosystem services. Ecol. Econ. 2007, 64, 286–296. [Google Scholar] [CrossRef]
  71. Wu, W.; Ma, B. Integrated nutrient management (INM) for sustaining crop productivity and reducing environmental impact: A review. Sci. Total Environ. 2015, 512, 415–427. [Google Scholar] [CrossRef] [PubMed]
  72. Lal, R.; Griffin, M.; Apt, J.; Lave, L.; Morgan, M.G. Managing soil carbon. Science 2004, 304, 393. [Google Scholar] [CrossRef] [PubMed]
  73. Crossman, N.D.; Bryan, B.A.; Summers, D.M. Carbon payments and low-cost conservation. Conserv. Biol. 2011, 25, 835–845. [Google Scholar] [CrossRef]
  74. Nemecek, T.; Dubois, D.; Huguenin-Elie, O.; Gaillard, G. Life cycle assessment of Swiss farming systems: I. Integrated and organic farming. Agric. Syst. 2011, 104, 217–232. [Google Scholar] [CrossRef]
  75. Mohammadi, A.; Rafiee, S.; Jafari, A.; Keyhani, A.; Mousavi-Avval, S.H.; Nonhebel, S. Energy use efficiency and greenhouse gas emissions of farming systems in north Iran. Renew. Sustain. Energy Rev. 2014, 30, 724–733. [Google Scholar] [CrossRef]
  76. Yousefi, M.; Mahdavi Damghani, A.; Khoramivafa, M. Comparison greenhouse gas (GHG) emissions and global warming potential (GWP) effect of energy use in different wheat agroecosystems in Iran. Environ. Sci. Pollut. Res. 2016, 23, 7390–7397. [Google Scholar] [CrossRef]
  77. Kirchmann, H.; Thorvaldsson, G. Challenging targets for future agriculture. Eur. J. Agron. 2000, 12, 145–161. [Google Scholar] [CrossRef]
  78. Menegat, S.; Ledo, A.; Tirado, R. Greenhouse gas emissions from global production and use of nitrogen synthetic fertilisers in agriculture. Sci. Rep. 2022, 12, 14490. [Google Scholar]
  79. Goossens, Y.; Annaert, B.; De Tavernier, J.; Mathijs, E.; Keulemans, W.; Geeraerd, A. Life cycle assessment (LCA) for apple orchard production systems including low and high productive years in conventional, integrated and organic farms. Agric. Syst. 2017, 153, 81–93. [Google Scholar] [CrossRef]
  80. Bennett, E.M.; Baird, J.; Baulch, H.; Chaplin-Kramer, R.; Fraser, E.; Loring, P.; Morrison, P.; Parrott, L.; Sherren, K.; Winkler, K.J. Ecosystem services and the resilience of agricultural landscapes. In Advances in Ecological Research; Elsevier: Amsterdam, The Netherlands, 2021; Volume 64, pp. 1–43. ISBN 978-0-12-822979-8. [Google Scholar]
  81. El Chami, D.; Daccache, A.; El Moujabber, M. How can sustainable agriculture increase climate resilience? A systematic review. Sustainability 2020, 12, 3119. [Google Scholar] [CrossRef]
  82. de Moraes Sá, J.C.; Lal, R.; Cerri, C.C.; Lorenz, K.; Hungria, M.; de Faccio Carvalho, P.C. Low-carbon agriculture in South America to mitigate global climate change and advance food security. Environ. Int. 2017, 98, 102–112. [Google Scholar]
  83. Lin, J.; Huang, L.; Zheng, Y.; Chen, C.; Wang, L.; Wang, K.; Qiu, J. Integrating ecosystem services, stakeholders’ perspective, and land-use scenarios to safeguard sustainability of the Mulberry-Dyke and Fish-Pond System. Landsc. Ecol. 2024, 39, 127. [Google Scholar] [CrossRef]
  84. Datta, P.; Behera, B. Assessing the role of agriculture-forestry-livestock nexus in improving farmers’ food security in South Asia: A systematic literature review. Agric. Syst. 2024, 213, 103807. [Google Scholar] [CrossRef]
  85. Javaid, Q. Sustainable Solutions for a Warming Planet Climate Smart Agriculture as a Tool for Global Food Security. MZ Comput. J. 2024, 5, 1–7. Available online: https://mzresearch.com/index.php/MZCJ/article/view/238 (accessed on 11 April 2025).
  86. Nkansah-Dwamena, E. Why small-scale circular agriculture is central to food security and environmental sustainability in sub-saharan Africa? The case of Ghana. Circ. Econ. Sustain. 2024, 4, 995–1019. [Google Scholar] [CrossRef]
  87. Chabert, A.; Sarthou, J.-P. Conservation agriculture as a promising trade-off between conventional and organic agriculture in bundling ecosystem services. Agric. Ecosyst. Environ. 2020, 292, 106815. [Google Scholar] [CrossRef]
  88. Smith, R.G.; Gross, K.L.; Robertson, G.P. Effects of crop diversity on agroecosystem function: Crop yield response. Ecosystems 2008, 11, 355–366. [Google Scholar] [CrossRef]
  89. Srivastav, A.L.; Patel, N.; Rani, L.; Kumar, P.; Dutt, I.; Maddodi, B.S.; Chaudhary, V.K. Sustainable options for fertilizer management in agriculture to prevent water contamination: A review. Environ. Dev. Sustain. 2024, 26, 8303–8327. [Google Scholar] [CrossRef]
  90. Dubs, F.; Enjalbert, J.; Barot, S.; Porcher, E.; Allard, V.; Pope, C.; Gauffreteau, A.; Niboyet, A.; Pommier, T.; Saint-Jean, S. Unfolding the link between multiple ecosystem services and bundles of functional traits to design multifunctional crop variety mixtures. Agron. Sustain. Dev. 2023, 43, 71. [Google Scholar] [CrossRef]
  91. Rinaldi, M.; Almeida, A.S.; Álvaro Fuentes, J.; Annabi, M.; Annicchiarico, P.; Castellini, M.; Cantero Martinez, C.; Cruz, M.G.; D’Alessandro, G.; Gitsopoulos, T. Open questions and research needs in the adoption of conservation agriculture in the mediterranean area. Agronomy 2022, 12, 1112. [Google Scholar] [CrossRef]
  92. Lawal, T.O.; Mustapha Abdulsalam, A.M.; Sundararajan, S. Economic and Environmental Implications of Sustainable Agricultural Practices in Arid Regions: A Cross-disciplinary Analysis of Plant Science, Management, and Economics. Int. J. 2023, 10, 3100–3114. [Google Scholar] [CrossRef]
  93. Ekins, P.; Zenghelis, D. The costs and benefits of environmental sustainability. Sustain. Sci. 2021, 16, 949–965. [Google Scholar] [CrossRef]
  94. Hasan, M.M.; Tarannum, M.N. Adverse impacts of microplastics on soil physicochemical properties and crop health in agricultural systems. J. Hazard. Mater. Adv. 2024, 17, 100528. [Google Scholar] [CrossRef]
  95. Cárceles Rodríguez, B.; Durán-Zuazo, V.H.; Soriano Rodríguez, M.; García-Tejero, I.F.; Gálvez Ruiz, B.; Cuadros Tavira, S. Conservation agriculture as a sustainable system for soil health: A review. Soil Syst. 2022, 6, 87. [Google Scholar] [CrossRef]
  96. MacLaren, C.; Mead, A.; van Balen, D.; Claessens, L.; Etana, A.; de Haan, J.; Haagsma, W.; Jäck, O.; Keller, T.; Labuschagne, J. Long-term evidence for ecological intensification as a pathway to sustainable agriculture. Nat. Sustain. 2022, 5, 770–779. [Google Scholar] [CrossRef]
  97. Hussain, S.; Hussain, S.; Guo, R.; Sarwar, M.; Ren, X.; Krstic, D.; Aslam, Z.; Zulifqar, U.; Rauf, A.; Hano, C. Carbon sequestration to avoid soil degradation: A review on the role of conservation tillage. Plants 2021, 10, 2001. [Google Scholar] [CrossRef] [PubMed]
Figure 1. Location of the studied farms in Arak County, Iran.
Land 14 00865 g001
Figure 2. Economic value of agroecosystem services per hectare (USD/ha/yr) in different wheat cropping management systems, study area in Arak County, Iran.
Land 14 00865 g002
Figure 3. Relationship between ecosystem service value and marketable goods value (USD/ha/yr) as a function of total dry matter (TDM) and grain yield (GY) for wheat in a semi-arid region, study area in Arak County, Iran.
Land 14 00865 g003aLand 14 00865 g003b
Table 1. Economic evaluation of ecosystem services and environmental impacts in wheat agroecosystems in Arak County, Iran.
Agroecosystem ServicesMin (USD)Max (USD)CV (%)Portion of Total Value (%)Portion of Net Value (%)
Intensive Agroecosystem
Food and feed1.83 × 10312.11 × 10313.316.5618.97
Oxygen production 10.36 × 10348.58 × 10319.670.6981.02
Moisture preservation 0.2 × 1031.73 × 10312.42.122.42
Carbon sequestration1.21 × 1035.36 × 1039.86.907.91
Biodiversity 0.76 × 1032.87 × 1037.42.653.03
Cultural 0.1 × 1030.69 × 1033.31.081.23
Total Positive Value (I)14.46 × 10371.34 × 10310.96--
Emission of greenhouse gases−1.89 × 10³−1.89 × 1036.424.93−3.64
Soil erosion−2.21 × 10³−3.65 × 10312.140.48−5.91
Nitrogen and phosphor leaching −1.25 × 10³−3.14 × 1035.834.58−5.05
Total Negative Value (II) −5.35 × 10³−8.68 × 1038.1--
Net services value 9.11 × 10362.66 × 103---
Traditional Agroecosystem
Food and feed3.2 × 10310.54 × 10311.317.3518.47
Oxygen production12.54 × 10342.01 × 10313.467.2171.54
Moisture preservation 0.1 × 1031.5 × 1039.51.841.96
Carbon sequestration2.13 × 1036.57 × 10311.19.249.84
Biodiversity 0.89 × 1032.25 × 1036.23.94.15
Cultural0.09 × 1030.55 × 1033.640.430.46
Total Positive Value (I)18.95 × 10363.42 × 1039.19--
Emission of greenhouse gases−1.44 × 10³−1.44 × 103045.28−2.91
Soil erosion−1.35 × 10³−1.63 × 10312.338.36−2.47
Nitrogen and phosphor leaching −0.27 × 10³−1.09 × 10318.216.35−1.05
Total Negative Value (II) −3.06 × 10³−4.16 × 10310.1--
Net services value 15.89 × 10359.26 × 103 --
Industrial Agroecosystem
Food and feed4.23 × 10311.21 × 10315.329.9835.02
Oxygen production16.41 × 10317.02 × 10314.444.852.35
Moisture preservation 2.36 × 1035.14 × 1038.712.2414.3
Carbon sequestration3.61 × 1035.5 × 1031012.5614.67
Biodiversity 0.12 × 1030.15 × 1035.90.410.48
Cultural003.400
Total Positive Value (I)26.73 × 10339.02 × 10314.5--
Emission of greenhouse gases−1.96 × 10³−1.85 × 1038.238.87−6.54
Soil erosion−1.02 × 10³−1.23 × 1039.523.46−3.95
Nitrogen and phosphor leaching −1.26 × 10³−2.12 × 10312.837.75−6.35
Total Negative Value (II) −4.24 × 10³−5.2 × 10310.1--
Net services value 22.49 × 10333.82 × 103---
Conservation Agroecosystem
Food and feed3.46 × 1039.64 × 10316.513.6414.32
Oxygen production12.64 × 10346.91 × 10313.863.4566.65
Moisture preservation 3.19 × 1034.78 × 1039.36.586.91
Carbon sequestration6.59 × 1037.12 × 10311.811.3711.94
Biodiversity 1.15 × 1032.36 × 10312.23.633.81
Cultural0.25 × 1030.86 × 10315.31.311.38
Total Positive Value (I)27.28 × 10371.67 × 10313.1--
Emission of greenhouse gases−1.99 × 10³−2.12 × 1036.667.56−3.4
Soil erosion−0.34 × 10³−0.56 × 1039.713.85−0.69
Nitrogen and phosphor leaching −0.51 × 10³−0.63 × 10311.918.58−0.93
Total Negative Value (II) −2.84 × 10³−3.31 × 1039.4--
Net services value 24.44 × 10368.36 × 103---
Organic Agroecosystem
Food and feed5.61 × 10315.29 × 10323.235.1236.76
Oxygen production12.44 × 10316.25 × 10316.936.7638.48
Moisture preservation 2.33 × 1033.75 × 1035.17.427.76
Carbon sequestration5.21 × 1036.12 × 1039.314.0114.67
Biodiversity 1.32 × 1032.53 × 10319.65.045.28
Cultural0.33 × 1030.87 × 10313.21.621.69
Total Positive Value (I)27.24 × 10344.81 × 10314.55--
Emission of greenhouse gases−0.66 × 10³−0.68 × 10317.334.73−1.62
Soil erosion−0.98 × 10³−1.26 × 1039.656.84−2.65
Nitrogen and phosphor leaching −0.1 × 10³−0.2 × 10310.18.42−0.39
Total Negative Value (II) −1.74 × 10³−2.14 × 10312.3--
Net services value 25.5 × 10342.67 × 103 --
Landscape
Food and feed1.51 × 1032.14 × 10312.32.232.25
Oxygen production13.22 × 10366.79 × 10317.661.0561.52
Moisture preservation 3.14 × 1033.68 × 10314.43.913.94
Carbon sequestration7.14 × 1039.25 × 10321.310.1110.18
Biodiversity 3.69 × 10318.21 × 10325.917.8818.02
Cultural2.34 × 1036.23 × 10313.34.794.83
Total Positive Value (I)31.04 × 103106.3 × 10317.46--
Emission of greenhouse gases−0.55 × 10³−0.55 × 1039.382.08−0.62
Soil erosion−0.25 × 10³−0.41 × 1036.849.25−0.37
Nitrogen and phosphor leaching −0.11 × 10³−0.3 × 10312.5−31.340.23
Total Negative Value (II) −0.91 × 10³−1.26 × 1039.5--
Net services value 30.13 × 103105.04 × 103---
Table 2. Non-linear regression results for marketable value based on grain and total dry matter yield in various wheat agroecosystems in Arak County, Iran.
AgroecosystemEquation TypeSuitable EquationRMSEMSp Value
IntensiveGaussian f ( M V ) = 8.25 e 0.5 G Y 3.17 1.37 2 + T D M 3.35 1.44 2 0.5631.93544.60.69
TraditionalGaussian f ( M V ) = 178.42 e 0.5 G Y 188.36 98.58 2 + T D M 184.39 96.5 2 0.561.451467.60.001
IndustrialGaussian f ( M V ) = 10.67 e 0.5 G Y 311.47 6.76 2 + T D M 35.38 460776.65 2 0.9650.407514.490.979
ConservationPlane f ( M V ) = 2.82 + 0.431 × G Y + 0.391 × T D M 0.950.3111313.80.046
OrganicGaussian f ( M V ) = 7.19 e 0.5 G Y 5.4 2.62 2 + T D M 6.88 12.73 2 0.9330.202588.730.052
MV is marketable value; GY is grain yield; TDM is total dry matter; R: regression; MSE: mean squared error; MS: mean square; p value: significance level.
Disclaimer/Publisher’s Note: The statements, opinions and data contained in all publications are solely those of the individual author(s) and contributor(s) and not of MDPI and/or the editor(s). MDPI and/or the editor(s) disclaim responsibility for any injury to people or property resulting from any ideas, methods, instructions or products referred to in the content.

