Article

An Ecological Risk Assessment of the Dianchi Basin Based on Multi-Scenario Land Use Change Under the Constraint of an Ecological Defense Zone

1
Faculty of Geography, Yunnan Normal University, Kunming 650500, China
2
GIS Technology Engineering Research Centre for West-China Resources and Environment of Educational Ministry, Kunming 650500, China
3
Geomatics Engineering Faculty, Kunming Metallurgy College, Kunming 650033, China
4
School of Economics and Management, Lijiang Culture and Tourism College, Lijiang 674199, China
*
Authors to whom correspondence should be addressed.
Land 2025, 14(4), 868; https://doi.org/10.3390/land14040868
Submission received: 20 February 2025 / Revised: 9 April 2025 / Accepted: 10 April 2025 / Published: 15 April 2025
(This article belongs to the Special Issue Spatial-Temporal Evolution Analysis of Land Use)

Abstract

:
Ecological risk evaluation is a prerequisite for the rational allocation of land resources, which is of great significance for safeguarding ecosystem integrity and achieving ecological risk prevention and control. However, existing research lacks analysis of the ecosystem state after land use simulation within the restricted conversion zone, making it impossible to determine whether ecological risks have been mitigated under these constraints. Therefore, we selected the Dianchi basin as the study area, extracted the ecological defense zone as the restricted conversion zone, and used the PLUS (Patch-generating Land Use Simulation) model to simulate land use for 2030 under multiple scenarios. We then evaluated ecological risks based on landscape pattern indices, and analyzed ecological risks under multiple scenarios with and without the restricted conversion zone. By comparing ecological risks across scenarios with and without constraints, we clarified the critical role of ecological risk evaluation in the rational allocation of land resources. The results show the following: (1) The ecological defense zone was obtained by overlaying no-development zones (such as forest parks and nature reserves), areas of extreme importance in the evaluation of water resource protection, soil and water conservation, and biodiversity, as well as areas of extreme importance in the evaluation of soil and water erosion and rocky desertification sensitivity. (2) Cultivated land and woodland cover significant portions of the Dianchi basin. Overall, ecological risk deterioration was more pronounced in the economic scenario (ES), while the ecological scenario (PS) exhibited lower ecological risk compared to the natural scenario (NS). (3) After importing the ecological defense zone into the PLUS model as the restricted conversion zone for land use simulation, ecological risks in all scenarios showed a trend of improvement. The improvement trend was strongest in the NS, followed by the PS, and weakest in the ES. The results of this study can help to identify the most suitable land use planning model and provide a more effective strategy for ecological risk prevention and control.

1. Introduction

The dual economic and natural attributes of land make human activities the primary driver of land use change across 75% of the world [1]. Human interventions on land directly impact ecosystems, thereby inducing ecological risks [2,3]. Ecological risk is a recently developed natural resource management tool that enables the quantitative assessment of the negative consequences of natural or human-induced impacts on ecosystems based on land use change [4,5]. Higher ecological risks often hinder the ability of land to maintain biodiversity, water retention, and other ecological functions, leading to habitat fragmentation and the near-collapse of sustainable land management [6,7]. Initially, the study of ecological risk primarily focused on the impact of pollution sources on human health and the environment [8]. However, as research has progressed, constructing ecological risk evaluation models based on landscape patterns has gradually become feasible. These models can comprehensively consider the characteristics of landscape structure and type, and can be integrated with land use simulations. Thus, they provide a more comprehensive and precise perspective for ecological risk assessment [9]. Land use simulation and prediction can effectively explore future land use patterns, thereby revealing potential conflicts between ecological preservation and human activities [10]. By adjusting land use patterns and formulating corresponding land use plans, we can optimize land utilization and reduce the pressure exerted by human activities on land resources, thus mitigating ecological risks [11,12]. Therefore, optimizing future land use and rationally controlling ecological risks have become critical research priorities for sustainable land development.
Completion of the above research requires the synthesis of two parts: the first part involves setting up a multi-scenario model in the process of land use simulation, including an NS, an ES, and a PS. The NS refers to the transformation between land types by following the rules of land type conversion after considering the relationship between society, ecology, economy, and land without policy constraints [13,14]. The ES aims to guarantee the highest economic value for regional development, and usually increases the likelihood of converting anthropogenic land uses, such as construction land, into other land categories, while simultaneously reducing the possibility of transferring ecological land to man-made land [15,16]. The PS aims to maintain the stability of the ecosystem, and achieves this goal by increasing the probability of shifting construction land and cultivated land to other land types, or decreasing the probability of shifting ecological land, such as woodland, to artificial land [17,18]. Some studies often do not take the restriction of conversion zones as a hard constraint after setting up the scenarios, resulting in simulation results that may overestimate the ecological risk of future land use changes and fail to accurately reflect the ecological security pattern under policy intervention.
The other part involves setting up restricted conversion zones. Relevant studies have shown that the inclusion of restriction zones in the land use simulation process can effectively maintain the ecological function of the land [19,20]. Therefore, in order to realize the goal of land planning, it is necessary to extract specific areas according to actual needs and ensure that the land use types of these areas remain unchanged in the simulation process. Currently, the extraction of restricted zones is divided into two categories. The first is the extraction of restricted conversion zones by the direct identification method. For example, the Yangtze River is designated as a restricted conversion zone so that it is not converted to other land use types [21]. Water bodies and wetlands are also designated as restricted zones to protect them from encroachment by other land types [22]. Additionally, all nature reserves and reservoirs are set as restricted conversion areas [23,24]. However, this direct identification method only protects intuitive areas such as water and nature reserves, a process which is highly subjective and makes it difficult to comprehensively address complex ecological problems. It may also lead to the continuous deterioration of ecological conditions. The second category involves conducting a multi-dimensional comprehensive evaluation to extract restricted zones. For example, combining the importance of ecosystem services with ESs can be used to evaluate the suitability of construction land, with unsuitable areas serving as constraints to limit the conversion and redistribution of various pieces of land [25]. Another approach is to integrate the ecological protection red line, cultivated land, and urban development suitability as constraints on ecological space, thereby restricting the transfer to construction land [26]. The above multi-dimensional considerations for extracting restricted conversion areas break away from the single protection of ecosystem functions to some extent. This approach can effectively reduce ecosystem sensitivity and enhance the stability and resilience of the ecosystem. However, the effectiveness of ecological restoration cannot be clearly assessed solely from the results of land use simulation.
The above analysis shows that, although the importance of multi-scenario models and restricted conversion zones has been fully considered in land use simulation projections, the results of these simulations are still insufficient to reflect whether the ecosystem has been improved. The existing land use simulation results can only reveal the transformations across land use, but cannot directly reflect whether the ecological condition has been improved. The core of this problem lies in the fact that most current studies are limited to the simulation of land use changes, but neglect in-depth investigation of the ecosystem status. Therefore, after comprehensively extracting restricted zones by a multi-dimensional approach and incorporating them into the constraints of land use simulation, finding a suitable method to explore changes in ecological conditions is not only an urgent need for current research, but also a key direction for future research.
Of course, reliable predictive models are indispensable to realize the above analysis. The theory of cellular automata (CA) was proposed by John von Neumann in the 1940s. Initially, CA were used as mathematical models mainly to simulate complex phenomena such as physics, chemistry, and living systems. The study of land use models began to introduce the concept of CA, especially for modeling urbanization processes and landscape evolution [27]. The CA-based land use simulation method was proposed and used to simulate the urban expansion process, which opened up the application of land use CA modeling [28]. The mainstream integrated CA-based models are as follows: the FLUS model is a land use change simulation model developed based on the theory of CA. It has been improved and extended on the basis of traditional CA, and the total probability of each land use type conversion on each image element is calculated by combining the suitability probability, neighborhood effect, conversion cost, and inertia coefficient, so as to realize the land use change simulation with high accuracy [29]. The PLUS model mines the driving factors of land expansion through the random forest algorithm, and combines the multiple types of random seeds and the threshold-decreasing mechanism to dynamically simulate patch generation; the simulation results have high accuracy and similar landscape patterns [30]. The PLUS model was chosen in this study for three reasons. First, based on its advancement, the stochastic deep forest algorithm is used to mine the rules, which can efficiently and accurately derive the conversion rules. The second is based on its applicability: the PLUS model constructs CA based on automatic generation of patches, which can adapt to spatial heterogeneity and improve the simulation effect of land use change. Third, the PLUS model is highly compatible with the objective of this study: the ecological risk in this study is calculated based on the landscape pattern index, and the results obtained by choosing this model better simulate the patch formation in the landscape.
In view of this, this study further explores the ecological risk of the Dianchi basin based on land use simulation. The study is mainly carried out in the following three aspects: First, the ecological defense zone is extracted as the restriction zone for land use simulation by integrating the ecological function importance (EFI) and ecological sensitivity (ESE). Second, three scenarios—namely, NS, ES, and PS—are set to simulate for 2030 and compare the land use situation under the constraints of the ecological defense zone. Third, an ecological risk evaluation is conducted for 2030. Finally, the ecological risk evaluation is carried out, and the ecosystem state change characteristics under the constraints of the ecological defense zone are compared. Through the above studies, we aim to establish a scientific foundation for the optimization of land use patterns and the sustainable management of ecosystems going forward.

2. Study Area

The Dianchi basin is located in southwestern China (Figure 1), where the sixth-largest freshwater lake, known as the Pearl of the Chinese Plateau, is situated [31]. The basin is narrow in the north and south, and broad in the east and west, surrounded by mountains [32]. The geographic location of the basin is between 24°28′~25°27′ N and 102°29′~103°00′ E. The altitude ranges from 1864 to 2789 m, and the terrain is rich in geomorphology. The natural conditions are relatively complex. Cultivated land and woodland are the main land use types in the region, and the distribution of construction land is relatively concentrated, mainly in the junction of Wuhua District, Panlong District, Guandu District, and Xishan District. Although the abundant water resources and vegetation give the region a relatively low ecological risk value, the basin has a total population exceeding 4.06 million, which accounts for approximately 64% of the population of Kunming. Moreover, with the increasing intensity of human activities in recent years, the ecological risk in certain areas has significantly increased, creating challenges for the protection of its ecological environment. Therefore, identifying ecological defense zones within the Dianchi basin and evaluating the effects of land use alterations on ecological risk are of considerable importance for research.

3. Materials and Methods

3.1. Data

The main data types used were data for modeling land use and data for ecological risk assessment (Table 1). These data were selected for three main purposes. First, the historical land use data and drivers selected based on previous studies were used as the basis for simulating land use for 2030. Second, corresponding data were selected to evaluate EFI and ESE. The resulting ecological defense zone were then used as a restricted conversion zone for the 2030 land use simulation. Lastly, the simulated land use data for 2030 were used as the basis for ecological risk evaluation.

3.2. Simulation and Evaluation Methods

3.2.1. Evaluation of EFI and ESE

According to the “Guidelines for the Delineation of Ecological Red Lines” (GDERI) issued by the Ministry of Natural Resources of China, and following the principles of data accessibility and validity, water source protection, soil and water conservation, and biodiversity were selected as indicators for the evaluation of EFI. Additionally, soil and water erosion and rock desertification were selected as indicators for the evaluation of ESE. The EFI aims to identify areas that are important for ecological sustainable development, while the evaluation of ESE is used to identify the problems facing the ecological environment [34,35]. The specific classification process is as follows:
Indicator calculation: First, based on relevant data and scientific methods, the values of each indicator are calculated. The specific evaluation indicators and formulas are shown in Table 2.
Classification method: The results are classified using the natural breaks method, which divides the region into five levels: general importance, importance, medium importance, high importance, and extreme importance.

3.2.2. PLUS Model

The PLUS model [39] is a high-precision spatial model for simulating future land use change, with the core objective of predicting the dynamic evolution of land types under different policy-related, natural, and socio-economic drivers. It consists of two components: the Land Expansion Analysis Strategy (LEAS)-based model and the CARS model based on multi-class stochastic patch seeds. The former is able to analyze the driving factors for the expansion of different land types by mining historical land use data, and to quantify the influence weights of each factor on land expansion. The latter is able to simulate the competition and conversion between different land types and generate a model closer to reality by combining the “Adaptive Inertia Mechanism” and the “Patch Generation Algorithm”. In addition, the PLUS model supports different constraints (e.g., prohibited waters, nature reserves) and policy scenarios (e.g., PS), making it highly applicable to this study.
In terms of rule and parameter settings, the LEAS module uses random sampling, with the number of decision trees, sampling rate, and number of features used for training the random forest set to the model’s default values of 20, 0.01, and 5, respectively. In the CARS module, the neighborhood size, threshold reduction decay coefficient, and expansion coefficient are set to the model’s default values of 3, 0.2, and 0.1, respectively. The neighborhood weights set for arable land, woodland, grassland, water bodies, built-up land, and unused land are 0.2815, 0.5747, 0.9888, 0.0001, 0.0492, and 0.6553, respectively. The transition matrix is shown in Table 3, where 0 indicates that the land use type cannot be converted to another land use type, and 1 indicates that conversion can occur. The relevant calculation formulas can be found in [40].
Therefore, the model was chosen to simulate land use in the Dianchi Basin for the year 2030. To validate the model’s accuracy, the CARS module was employed to predict the 2020 land use, utilizing land use data from 2000 and 2010 as the baseline. The predicted results were compared with the actual 2020 land use pattern for accuracy assessment. It revealed an overall accuracy of 0.8109 and a Figure of Merit (FoM) of 4.4336, demonstrating high predictive performance. The main steps of the operation were as follows: Firstly, data were selected as the driving factors. Secondly, the extracted ecological defense zone was restricted from land type conversion. Lastly, the probability of conversion of land use types was adjusted several times to select the most appropriate probability for setting up the NS, ES, and PS to simulate the land use for 2030.

3.2.3. Ecological Risk Evaluation

Based on relevant studies and considering the actual situation of the study area, it was finally divided into 2373 blocks with a grid size of 1.2 km × 1.2 km. Afterward, the landscape disturbance index ( E i ), landscape vulnerability index ( Q i ), and landscape loss index ( R i ) were selected to construct the ecological risk value. Specific formulas can be found in the literature [41,42,43]. Taking 2000 as the baseline, the values were classified into five grades using the natural breaks method: lower (0~0.0582), low (0.0582~0.0717), medium (0.0717~0.0905), high (0.0905~0.1246), and higher (0.1246~1).

4. Results

4.1. Extraction of Restricted Conversion Areas in Dianchi Basin

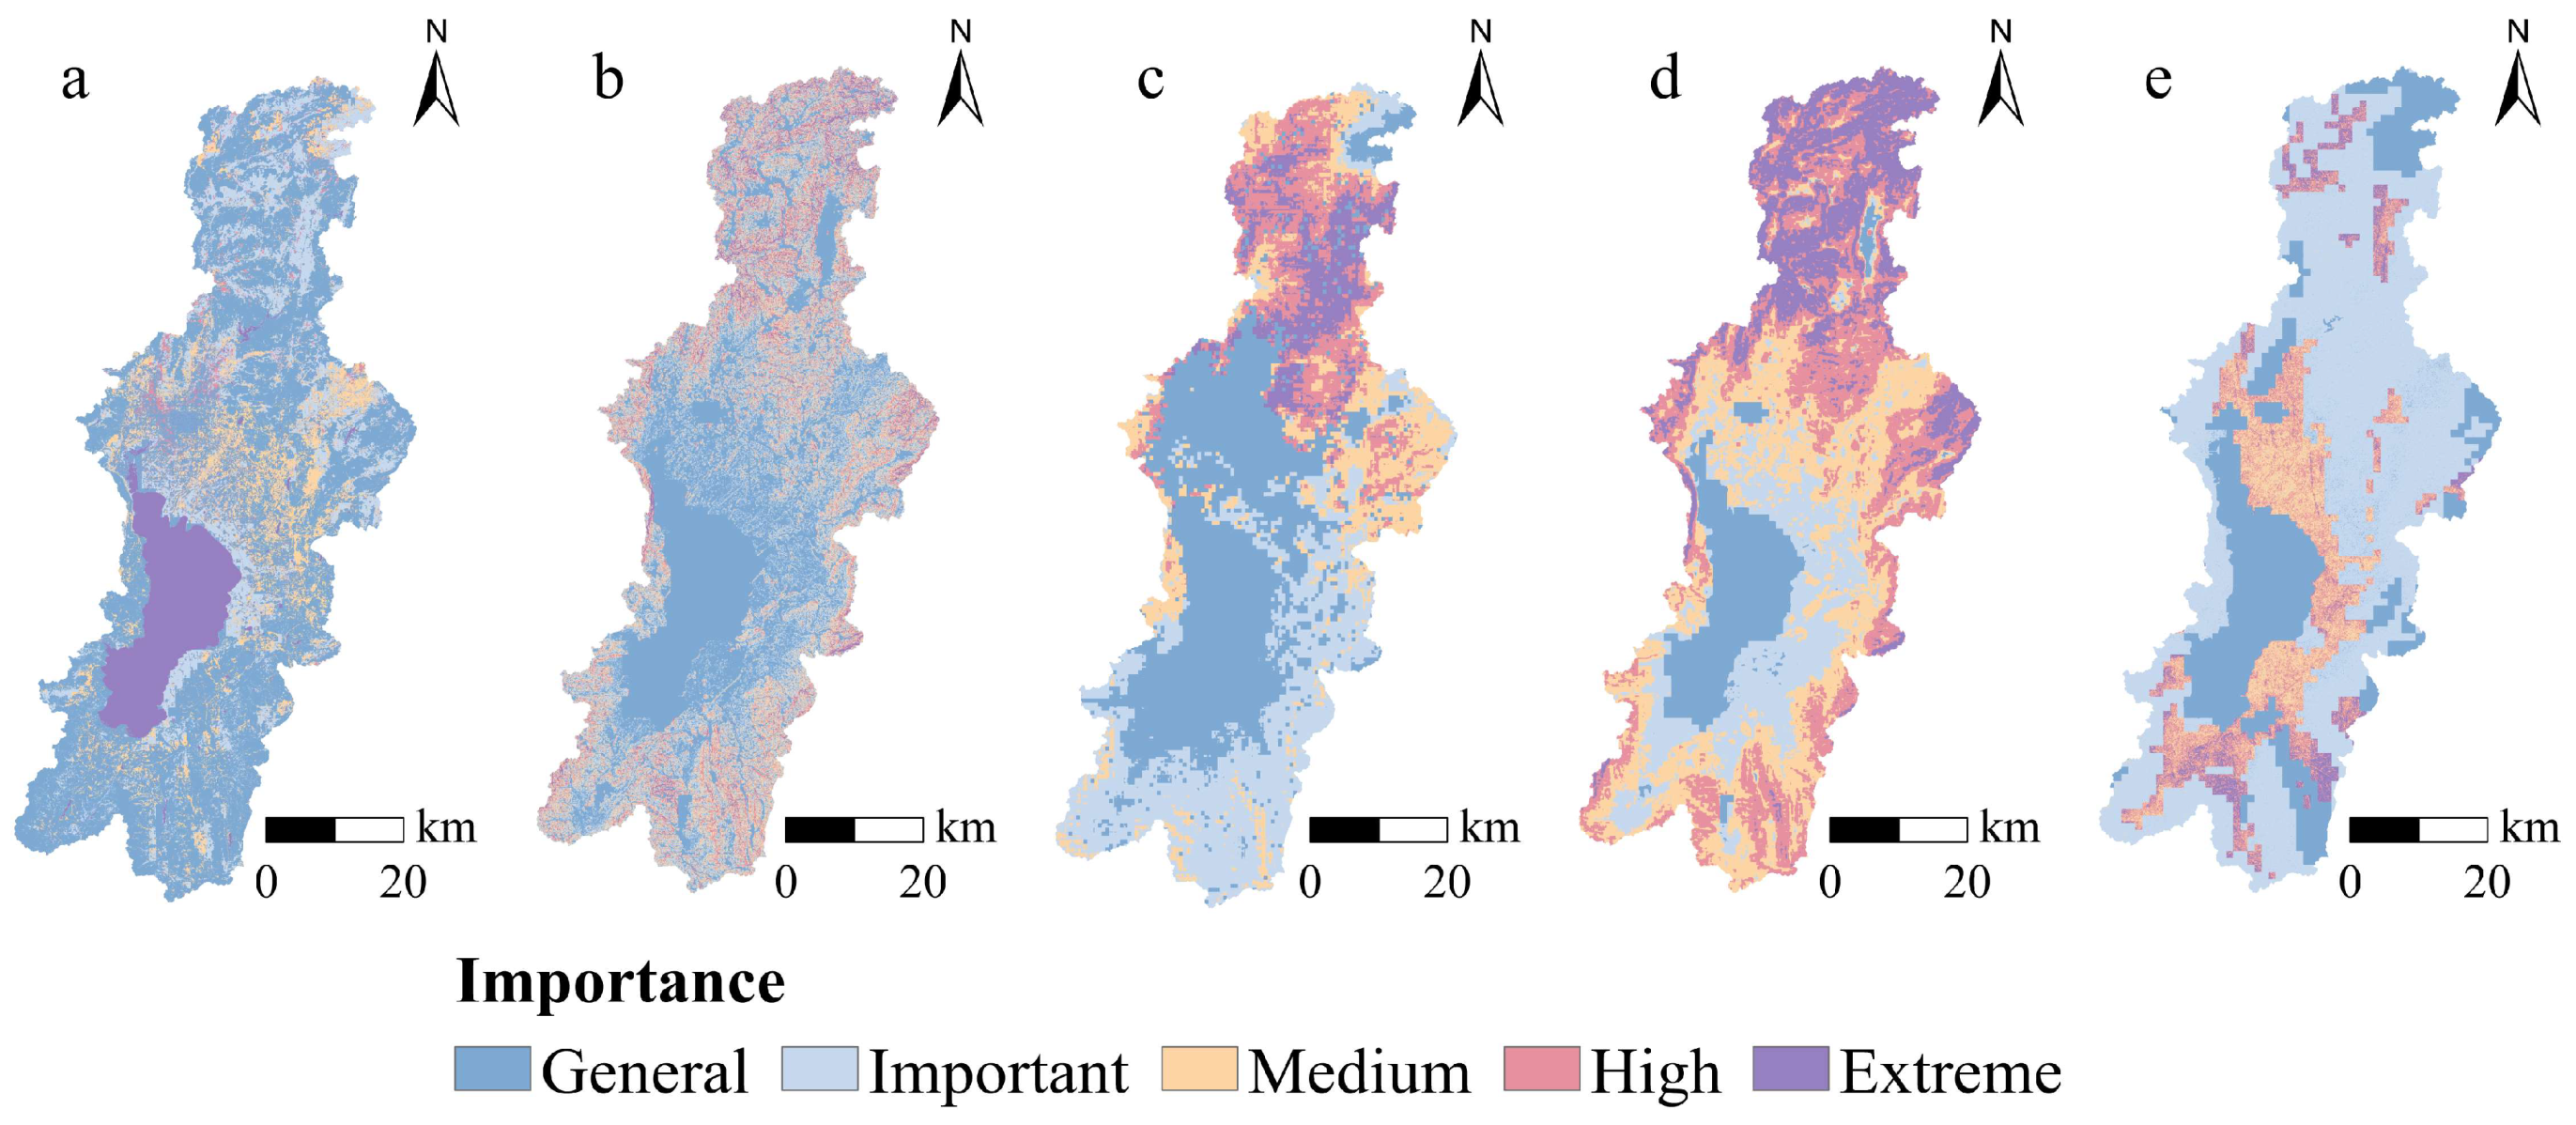
4.1.1. Spatial Patterns of EFI and ESE

To safeguard the integrity and sustainability of the ecosystem, the distribution pattern of EFI and ESE was identified (Figure 2). The distribution pattern is as follows: medium-importance areas for water source protection are distributed in lakes and reservoirs with sufficient water sources; highly important areas are distributed in some grassland areas in the northern part of the Dianchi basin; medium-importance areas are centrally distributed near construction sites; and important and general areas are distributed in a staggered pattern throughout the entire basin. The distribution of extremely important and highly important areas for soil and water conservation is highly consistent, mainly concentrated in high-altitude areas with high vegetation cover. Important areas surround the generally important areas, which are mainly distributed in areas with low altitude and gentle terrain. The extremely important, highly important, and medium-importance areas for biodiversity are concentrated in the northern part of the Dianchi basin, with sporadic medium-importance areas distributed around the basin. Important areas are distributed in a belt-like pattern around the medium and lower parts of the basin. Generally important areas are mainly located around the Dianchi basin and in the northern part of the area with concentrated construction, which is a region with frequent human activities and a low degree of vegetation cover, posing a certain threat to biodiversity.
The ESE pattern of the Dianchi basin is as follows: the extremely important areas for soil and water erosion are distributed in the upper and middle parts of the basin; the highly important areas are distributed around the extremely important areas; the moderately important areas, characterized as transition zones, are distributed between the highly important areas and the important areas; and the generally important areas are located in the waters of lakes and reservoirs. The extremely important areas for rocky desertification are scattered throughout the basin in small patches; the highly important areas are sporadically distributed within the moderately important areas; the important areas are distributed in a continuous pattern throughout the entire basin; and the generally important areas are predominantly situated around the lakes and in the surroundings of the basin. Overall, the pattern in the Dianchi basin shows obvious spatial differences, and the superposition of extremely important areas can effectively identify the key ecological zone in the Dianchi basin.

4.1.2. Identification of Ecological Defense Zone

According to the GDERI, the core scenic areas of scenic spots, national parks, nature reserves, and primary protection zones of drinking water sources are included in the prohibited development zone. These areas include the Kunming World Horticultural Expo, Dianchi, and the National Tourism Resort (as scenic spots); the Yunnan Qipanshan National Forest Park and the Kunming Financial National Forest Park (as forest parks); Jinning Meishucun Nature Reserve (as a nature reserve); and the Songhuaba Reservoir, Dianchi, Caohai, and the Chaihe Reservoir (as primary protection zones of drinking water sources). Adhering to the principle of “should be included as much as possible”, the prohibited development zones, extremely important zones in terms of EFI and ESE, were spatially superimposed. Surrounding areas with a map area of less than 1 km2 were eliminated, and the remaining areas were included in the prevention zone (Figure 3). It was then imported into the PLUS model as restricted zone.

4.2. Land Use Change Under the Constraint of the Ecological Defense Zone in the Dianchi Basin

4.2.1. Multi-Scenario Simulation of Land Use for 2030

In this study, based on the land use data and driver data from 2020, three development scenarios were designed for simulation by adjusting the neighborhood weights, transfer moments matrix, and land demand. These scenarios include the NS, ES, and PS. The ecological defense zone was then added to each scenario to constrain the conversion of land use types. Each scenario compared land use changes with and without ecological defense zones (Figure 4). Local details were selected for analysis, and it was found that the land use distribution patterns with and without the ecological defense zone were roughly the same. However, the changes in each category in the NS and ES were insignificant, while the area of construction land in the PS was significantly reduced compared to the other two scenarios. Localization analysis revealed differences in detail. In regions I and II, the area of cultivated land was larger in the ES than in the NS, and construction land was more compact in the NS than in the ES. In contrast, construction land was relatively fragmented in the PS. The enhanced protection of ecological land under the PS constrained the expansion of human-interference land categories, such as larger areas of construction land, making it difficult for these areas to merge into larger patches.
As shown in Figure 5, under the NS, the area of water increased slightly, transforming from grassland after the addition of the ecological defense zone, while the rest of the land categories remained unchanged. In the ES, after the inclusion of the ecological defense zone, the area of woodland exceeded that of cultivated land and became the most extensive. Accordingly, the area of natural landscapes, such as grassland and water, increased slightly, while the area of cultivated land decreased. In the PS, after incorporating the ecological defense zone, the area of woodland and grassland increased significantly, while the area of construction land decreased significantly. Overall, in the ES, the difference in the area of cultivated land and woodland was not significant. The rest of the scenarios showed that the area of woodland was the largest, followed by cultivated land, grassland, water, construction land, and unused land. The area of construction land was the highest under the ES, at 289.32 km2, and the lowest under the PS, at 220.82 km2. In short, the land use distribution was influenced by the ecological defense zone. Extracting the zone as a restricted conversion zone effectively inhibited the erosion of natural landscapes by man-made landscapes. Compared with the multi-scenario simulation, the introduction of the ecological defense zone optimized land use allocation and provided a feasible solution to alleviate the conflict between land protection and human development.

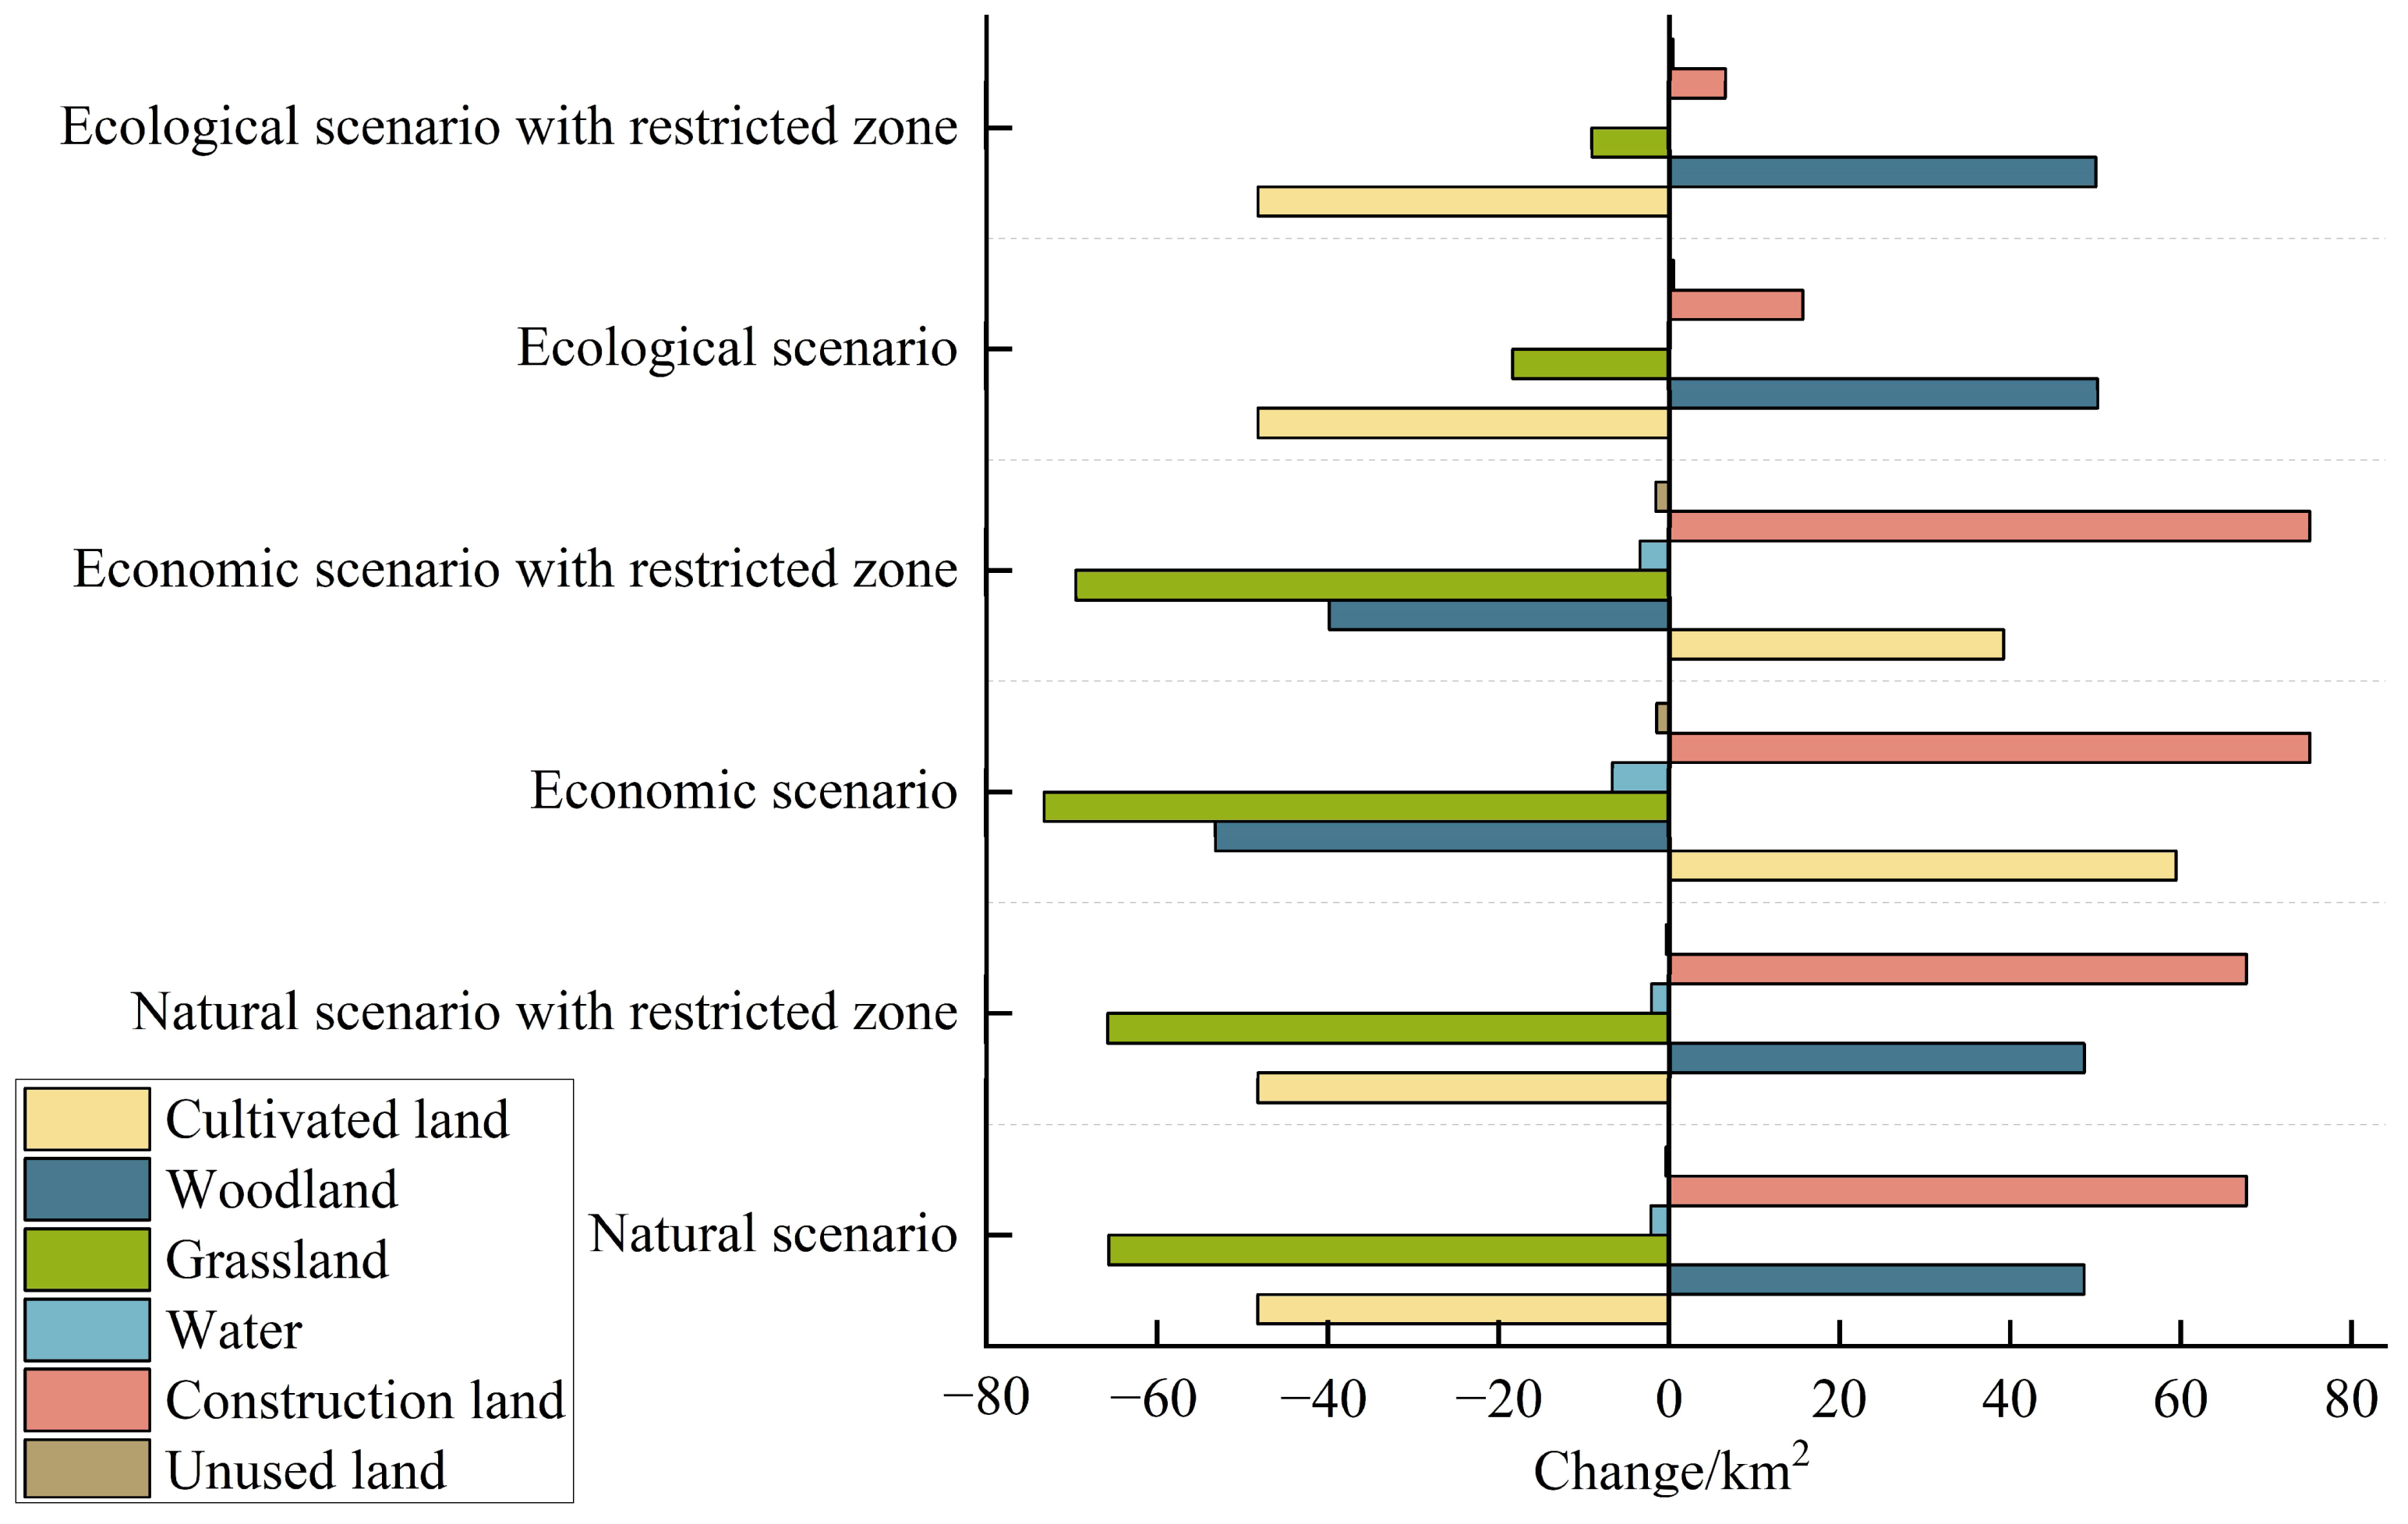
4.2.2. Land Use Changes Between 2020 and 2030

The trend of changes in each land use type in the Dianchi basin from 2020 to 2030 is shown in Figure 6. According to the scenarios alone, cultivated land and construction land see the greatest increase under the ES, with the area of construction land increasing the most significantly, by 75.13 km2. Under the PS, woodland, water, and unused land experience the greatest increase, with woodland increasing by 50.25 km2. Grassland shows a decreasing trend in all scenarios, with the largest decrease occurring in the ES, at 73.26 km2. After the addition of the ecological defense zone, grassland and water increase in the NS compared to the ecological defense zone scenario, while the rest of the land categories remain unchanged. Under the ES, except for construction land and unused land, the remaining land categories change significantly. Under the PS, all land categories change, except for cultivated land. Overall, compared to 2020, ecological land under the ES and the PS increases significantly under the ecological defense zone constraints, compared to scenarios with no constraints.

4.3. Analysis of Ecological Risk Changes Under the Ecological Defense Zone in the Dianchi Basin

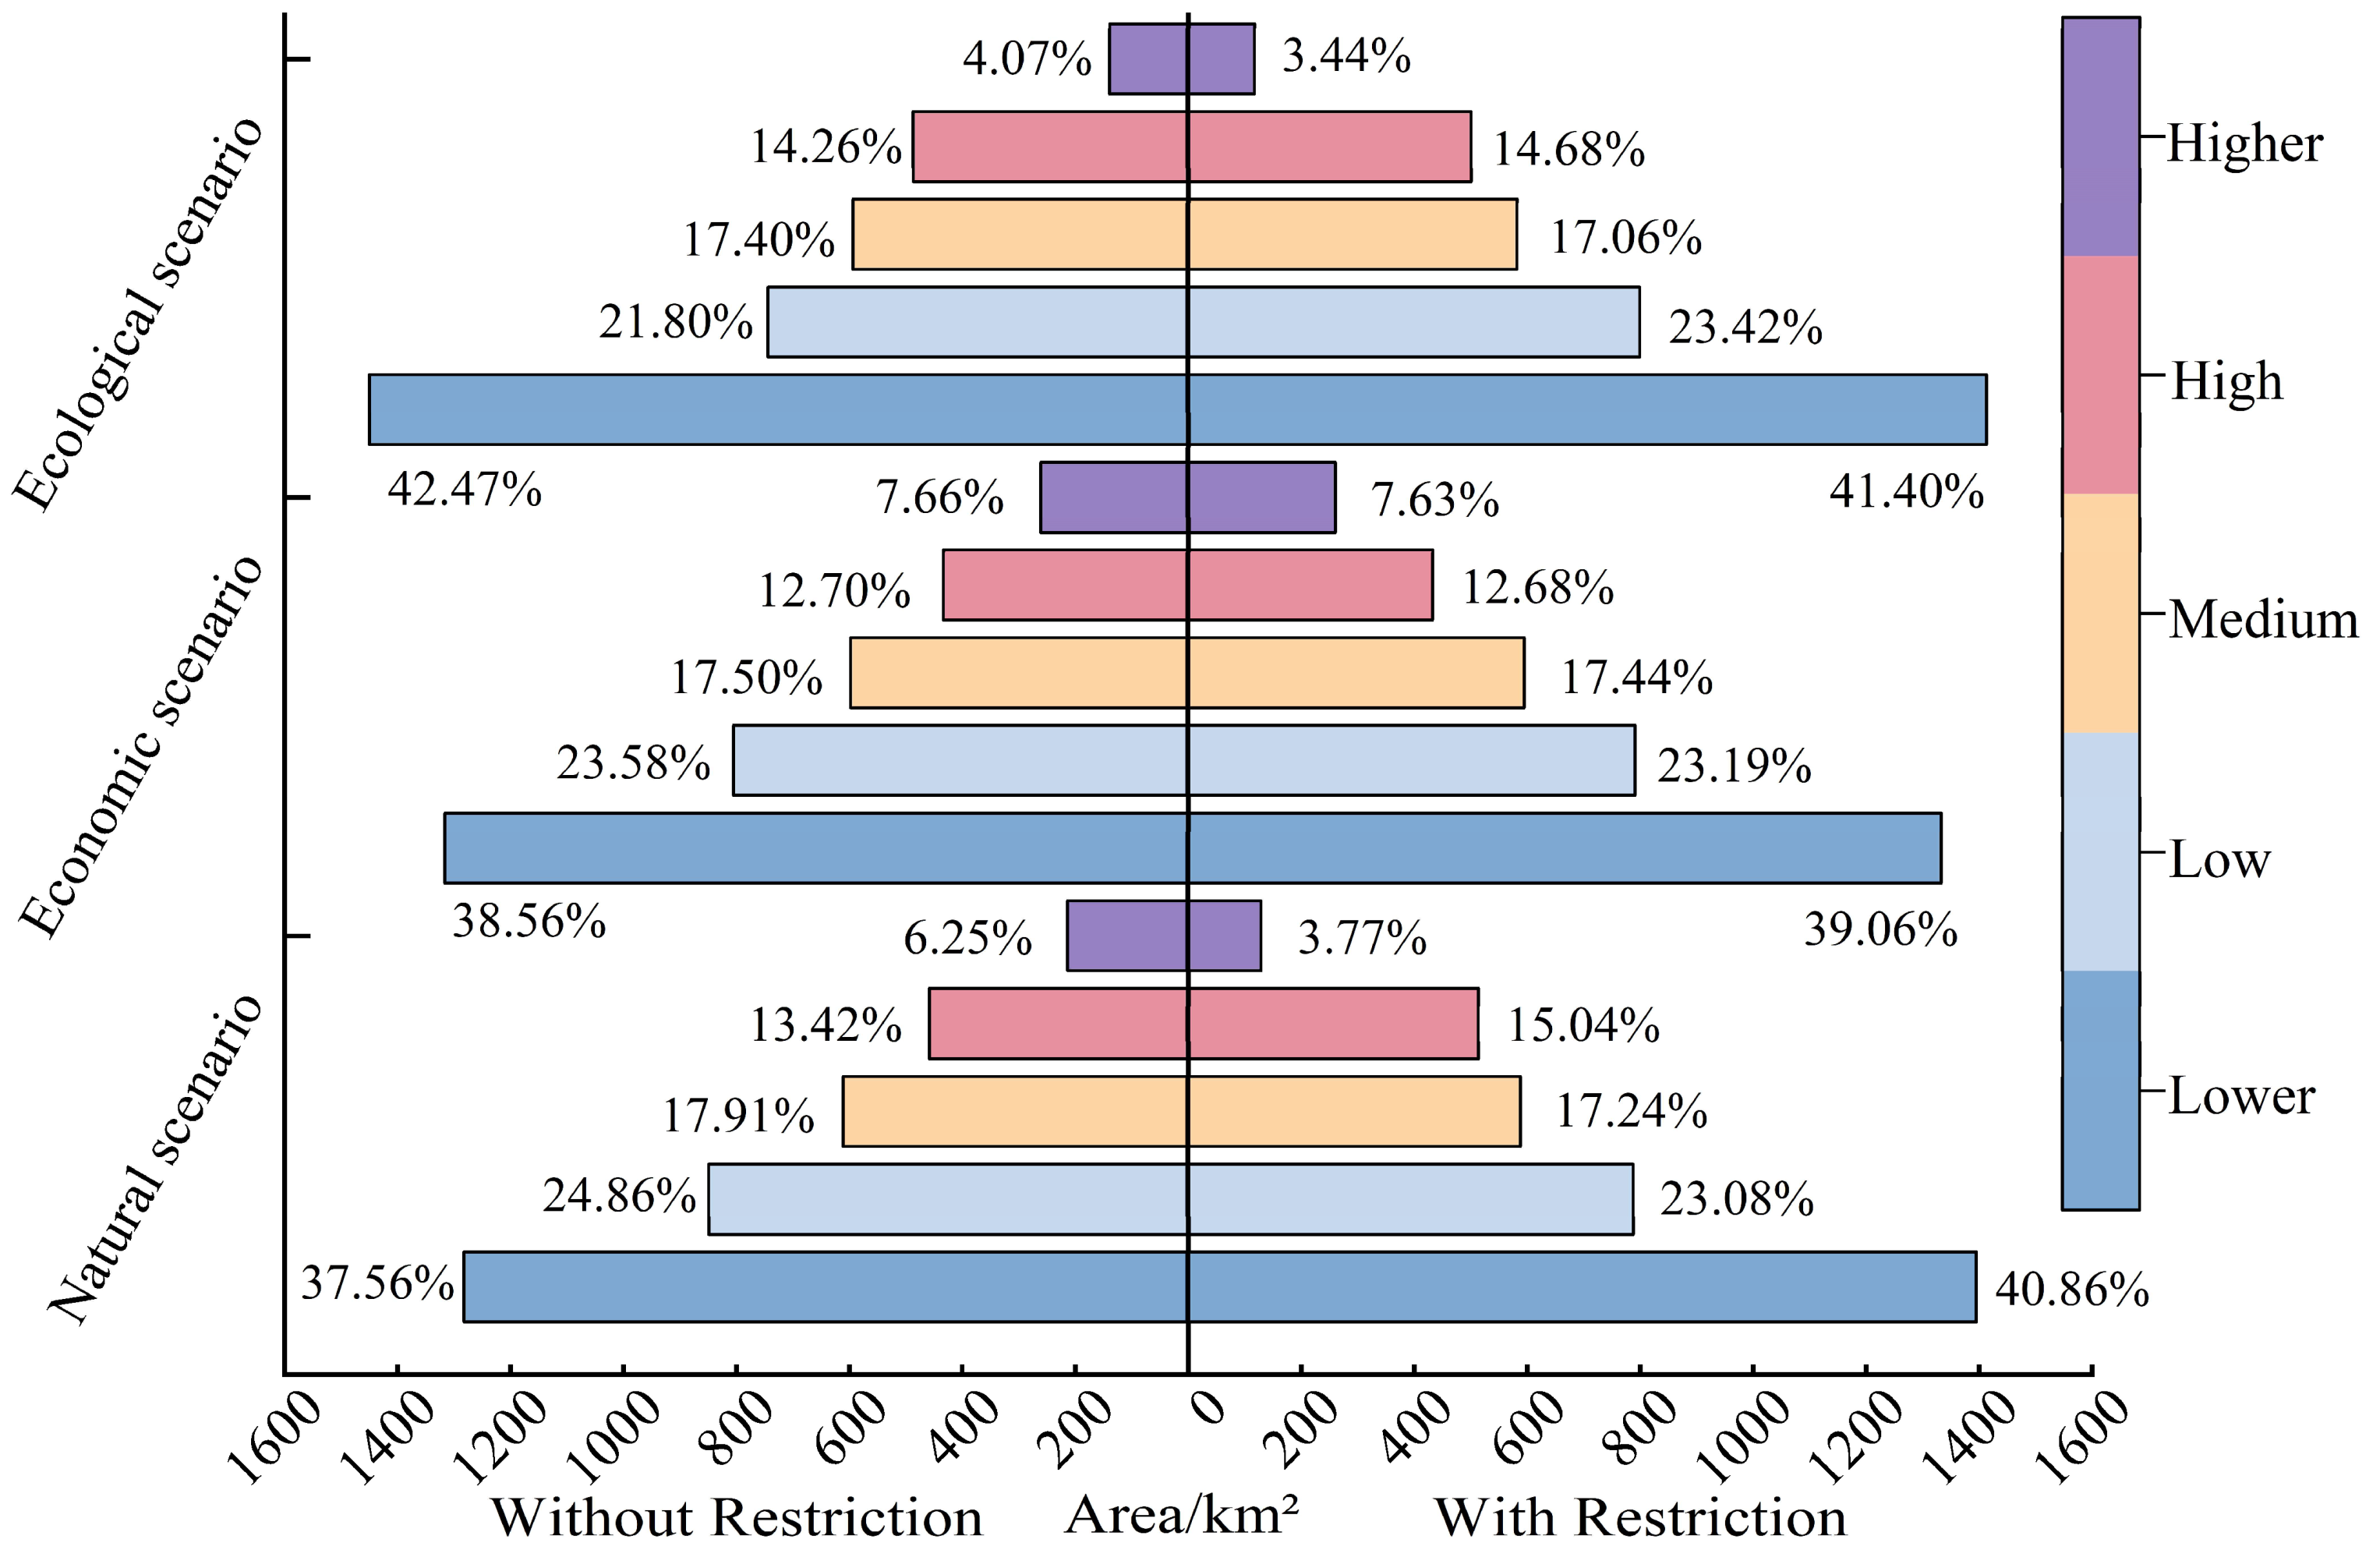
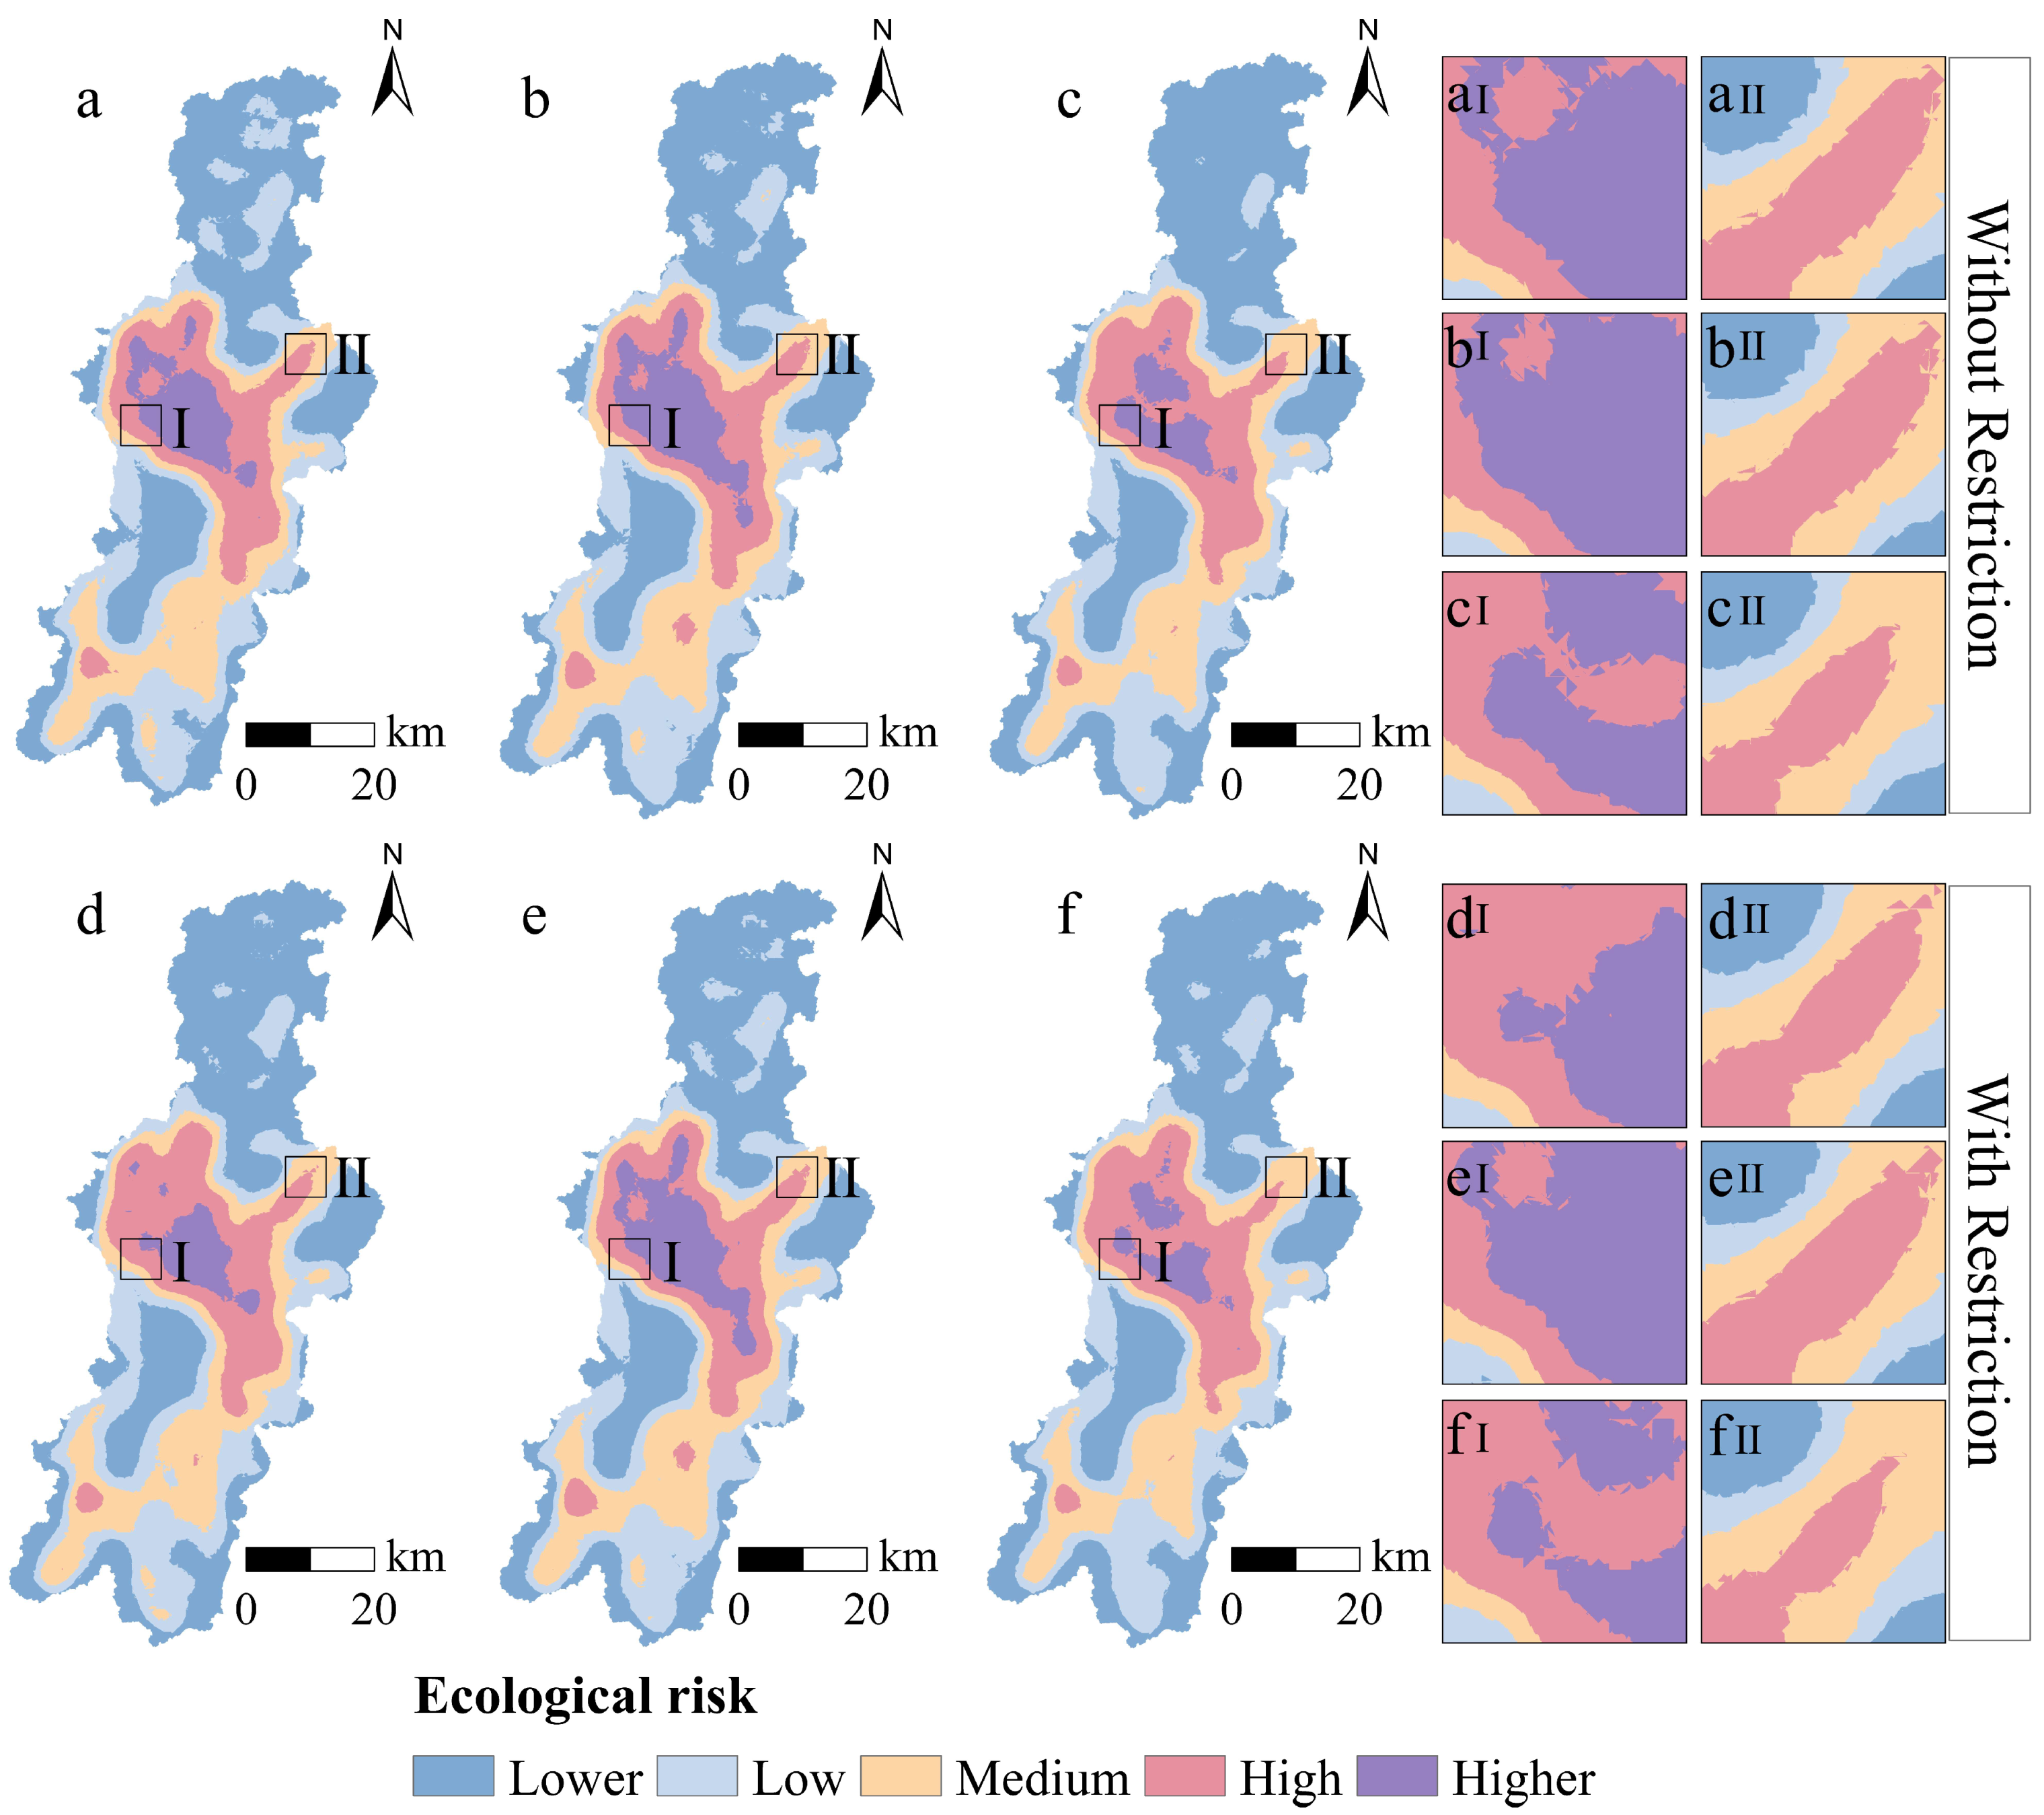
4.3.1. Ecological Risk Evaluation Under Multiple Scenarios for 2030

Under different scenarios for 2030, regardless of whether the ecological defense zone is established or not, the results of land use simulation can only indicate the area changes for each category, and do not directly show improvements in ecological conditions. Ecological risk evaluation, based on land use data, can intuitively reflect the pressure exerted on the ecosystem by human activities and natural factors, as shown in Figure 7 and Figure 8. A vertical comparison reveals that the overall ecological risk of the Dianchi basin for 2030 is at a low level, with varying risk situations under different scenarios. The ecological risk under the PS is lower than that under the NS, and is also lower than that under the ES. This is reflected in the areas with higher risk: 117.45 km2, 213.47 km2, and 261.42 km2, respectively. The distribution pattern of ecological risks in the Dianchi basin is generally similar, with higher risks concentrated at the northern junction of the lake. High risks are distributed around these areas, and a small number of them are scattered in the medium and lower parts of the Dianchi basin. Low risks and lower risks are distributed throughout the Dianchi basin, in the northern part of the basin, and along the edges.
In the horizontal comparison, the ecosystem condition within the ecological defense zone is significantly better than that in scenarios without an ecological defense zone, particularly regarding changes in higher-risk areas. In the NS, the percentage of higher-risk areas without an ecological defense zone (6.25%) is significantly higher than that within the ecological defense zone (3.77%). The higher-risk areas in the Wuhua District and Xishan District are significantly reduced when compared to areas that include the ecological defense zone. In the PS, the higher-risk area without an ecological defense zone accounts for 0.63% more than that with an ecological defense zone. The higher risk at the junction of Guandu, Panlong, Wuhua, and Xishan districts shows a contraction when compared to the condition without ecological defense zone constraints. The difference in the area of high risk with and without an ecological defense zone is minimal (only 0.03% higher), and the higher risk at the junction of Wuhua District and Xishan District is mitigated by the presence of an ecological defense zone. The above results demonstrate that the establishment of an ecological defense zone has a significant effect on reducing ecological risks and protecting ecosystems.

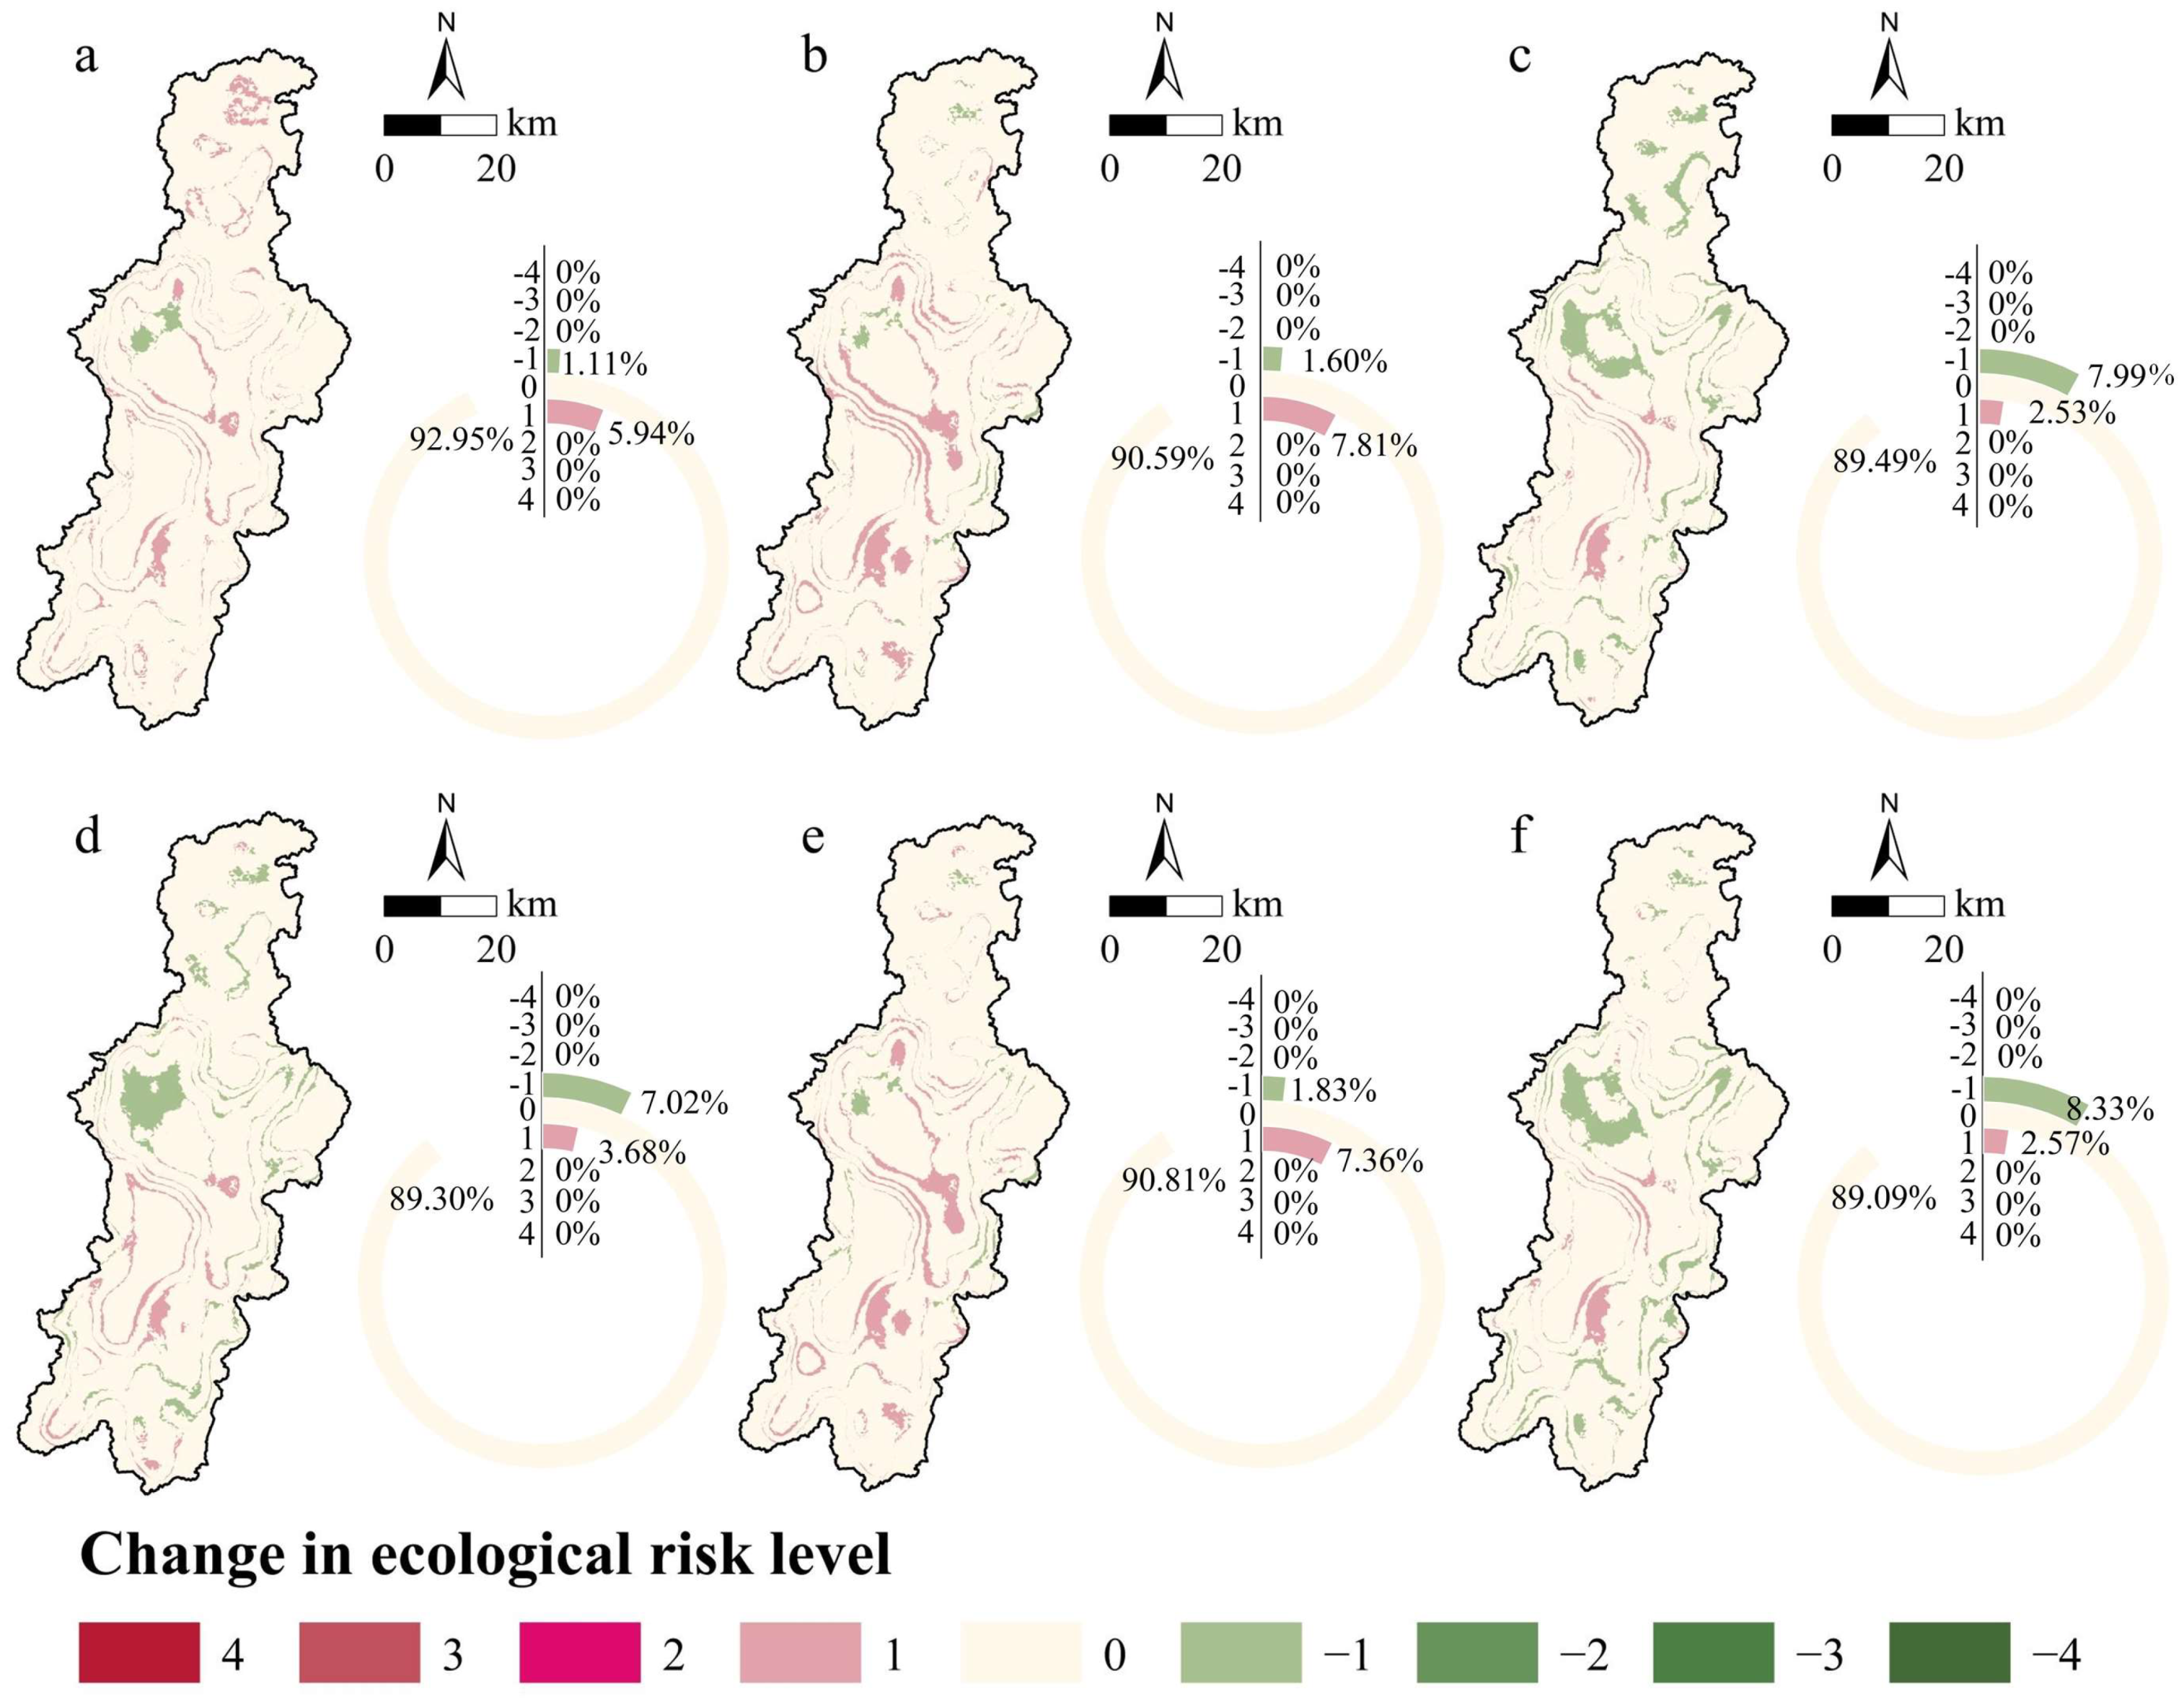
4.3.2. Ecological Risk Changes Between 2020 and 2030

A comparison of the study’s end results with the projections indicates which model is most effective in improving ecological risk (Figure 9). Compared to 2020, changes in ecological risk levels for 2030 under different scenarios primarily occur between neighboring levels, and the proportion of area where the ecological risk level remains unchanged is consistently the highest. Without the constraint of an ecological defense zone, only the PS has more areas with decreasing ecological risk levels than increasing levels. Under the constraints of an ecological defense zone, only the ES has more areas where the ecological risk level increases than decreases.
Specifically, in the NS, the area with reduced ecological risk levels in the northern part of Dianchi Lake significantly expands under the condition of ecological defense zone constraints, and the percentage of area with reduced ecological risk rises from 1.11% to 7.02%. In the ES, the area with an elevated ecological risk rating is always more than the area with a reduced ecological risk rating. Compared with the condition without ecological defense zone constraints, the proportion of area with reduced ecological risk increases by 0.23%, mainly distributed in the northern part of the Dianchi basin. Under the PS, the area with reduced ecological risk levels in the northern part of the Dianchi basin shrinks, while the area with reduced risk levels in the medium and lower parts of the basin shows an expansion trend. The percentage of area with reduced ecological risk rank expands from 7.99% to 8.33%; the area with an elevated rank slightly increases from 2.53% to 2.57%. These results indicate that, considering the connection between predicted and historical data, the establishment of ecological defense zones has a significant effect on reducing ecological risks and improving ecosystem conditions, especially in the NS and PS. Ecological defense zone are able to effectively contribute to a reduction in ecological risk grades over a large area.

5. Discussion

5.1. Significance of Ecological Defense Zone for Future Land Layout Optimization

The ecological defense zone serves as a constraint for land use, and the relevant literature was combined to establish the land use scenarios for 2030 [44,45,46]. By comparing the NS, ES, and PS both with and without the ecological defense zone, a significant difference in land use area was observed. The ecological defense zone extracted in this study not only restricts the conversion of land use types, but also takes into account the constraining effects of prohibited development, EFI, and ESE on land use change. On the one hand, it protects the ecological land areas with higher elevation and maintains the stability of ecologically valuable areas. On the other hand, it safeguards water areas and reduces the damage caused by human activities to water quality and the environment. It can be seen that the ecological defense zone can coordinates the development of economy, society, and ecology. By maintaining the EFI and protecting the vulnerability of ecosystems, it not only prevents ecosystem destruction due to land development, but also provides a scientific spatial layout scheme for ecological restoration and natural recovery.
Some findings of this study are highly consistent with the conclusions of existing research, further confirming the pivotal role of the ecological priority strategy in optimizing land resource allocation and mitigating ecological risks. For instance, compared to 2020, the area of construction land increases under both scenarios, with or without the restriction of an ecological defense zone, and cultivated land and woodland remain the predominant land use types in the study area [47]. Under the ES, the area of cultivated land and construction land increases further. However, due to the lack of effective ecological constraints, overexploitation and irrational land use patterns exacerbate the ecological pressure in the region, making the risk of ecological degradation more severe than in the NS [11]. In contrast, the PS achieves synergistic growth of woodland, water, and construction land through scientific planning and a strategy of ecological prioritization. Despite the increase in construction land compared to 2020, ecological risk is effectively regulated, and the regional ecological quality is the best among the three scenarios [48].

5.2. Implications of Ecological Risk Assessment for Future Sustainable Management of Ecological Ecosystems

Previous scholars have analyzed land use changes to assess improvements in regional ecological status [49,50,51]. The theoretical basis is that there is a linear correspondence between land use type and ecosystem status. However, in this study, we found that relying solely on the conversion of land use types in statistical results could not fully reflect the complex state of regional ecosystems. This was particularly true after the introduction of ecological risk assessment, as the two approaches yielded different conclusions.
Our results show that with the superimposed ecological defense zone, the area of ecological land (woodland, waters, etc.) under both the ES and the PS increased significantly from 2020 to 2030, compared to scenarios without ecological defense zones. Only the grassland (+0.10 km2) and water (−0.10 km2) under the NS showed small changes. Empirically, a significant increase in the area of ecological land with the inclusion of the ecological defense zone should directly correspond to an overall improvement in the quality of the ecosystem. However, after evaluating the ecological risk, it was found that under the NS, the ecological risk was most significantly improved after the addition of ecological control zones compared to the other scenarios, with the area of reduced ecological risk increasing by 5.91%. This was different from the ecosystem improvement results obtained from the land use analysis. This indicates that it is too one-sided to conclude the ecosystem status solely from the trend of land use change. Ecological risk is considered to be related to the adverse effects of land use layout and ecological dynamic processes [52]. Therefore, ecological risk evaluation was added in this study, which can more accurately explore the ecosystem status behind land use.
The heterogeneity of the assessment results stems from the limitations of traditional research models: firstly, they ignore the non-linear impacts of the spatial configuration of land use on ecological processes, such as the hidden risks of landscape fragmentation and landscape loss; secondly, they fail to take into account the synergistic and antagonistic effects generated by different combinations of land types, such as the biodiversity maintenance function of the cultivated land–woodland intertwined zone; thirdly, they lack dynamic considerations of ecosystem resilience. This study innovatively constructs an integrated framework of “ecological defense zone, land use, and risk identification”. By introducing the landscape pattern index, the risk status of the study area is effectively delineated, and these areas can often be developed with different development strategies depending on the level of risk.

5.3. Management Strategies for Ecological Vulnerability and Ecological Risks in Urban-Type Lake Basin Environments

As a typical urban lake, Dianchi Lake’s water environment exhibits close linkage between ecological vulnerability and ecological risk. Ecological vulnerability refers to an ecosystem’s high sensitivity to external disturbances and its relatively weak recovery capacity [53]. Dianchi Lake is heavily affected by factors such as urban domestic sewage and industrial wastewater discharge, making its water quality highly susceptible to degradation. Once damaged, restoring it to its original state often requires a long time and substantial effort. The connection between ecological vulnerability and ecological risk is evident. Ecological risk denotes the probability of harm to ecosystems [54], including threats like biodiversity loss and water quality deterioration. Lakes with higher ecological vulnerability tend to face greater ecological risks. For instance, due to its ecological fragility, Dianchi Lake is prone to eutrophication when heavy rainfall washes large quantities of pollutants into the lake—a clear manifestation of ecological risk.
From a landscape pattern perspective, ecological risk is primarily reflected in landscape fragmentation and disturbance [55]. Issues such as sewage inflow and excessive land development within the basin have severely damaged the natural landscape, reducing connectivity between patches and thereby elevating ecological risk. Ecologically, Dianchi Lake’s severe eutrophication correlates with its low biodiversity (see Figure 2c). Once a “Pearl of the Plateau”, Dianchi’s low-lying topography, combined with sustained wastewater discharge from Kunming and overdevelopment, has compromised its ecosystem integrity. At its worst, the water quality degraded to Class V, ranking it among China’s most polluted freshwater lakes. According to Yunnan Province’s monthly water quality reports for plateau lakes, Dianchi’s water quality remains highly unstable and heavily polluted. While Caohai’s water quality has reached Class V, the outer lake remains below Class V.
To mitigate these ecological risks, the Chinese government has introduced policies in recent years. In 2018, the Opinions of the Central Committee of the Communist Party of China and the State Council on Strengthening Ecological Environmental Protection and Resolutely Fighting the Battle of Pollution Prevention and Control explicitly advocated for the intensification of environmental management, emphasizing the holistic concept of “mountains, rivers, forests, farmlands, lakes, and grasslands as a life community”. In 2019, Yunnan’s Implementation Plan for the Battle of Nine Plateau Lakes Governance prioritized protection to ensure ecological quality “only improves, never deteriorates”, shifting from “lake-specific” to “basin-wide” governance. The 2021 Opinions on the “Lake Revolution” Campaign called for a comprehensive overhaul of governance concepts, measures, and mechanisms, underscoring Yunnan’s resolve. The basin features stunning landscapes and is a key tourist hub in Yunnan. Its unique geography and strategic position make it vital for Yunnan’s ecological civilization construction and regional ecological security. Government policies have effectively curbed risks from eutrophication.

5.4. Limitations

Of course, there are limitations to this research. Within the PLUS model’s parameter configuration, the conversion rule from grassland to construction land significantly influenced the final simulation results. Adjusting the parameters several times revealed that this phenomenon may be closely related to the spatial heterogeneity of the study area. Both types of land in the northern region of Dianchi are highly spatially neighboring, which led to the mutual reinforcement of the conversion probabilities of the two land classes in the neighborhood effect calculation of the CA. This amplified the sensitivity of the grassland conversion parameter to the simulation results. To address this, future studies need to further optimize the neighborhood weighting algorithm or introduce a spatial heterogeneity calibration module into the model framework to reduce the excessive interference of specific land class distributions on simulation results.

6. Conclusions

This study integrates various ecological conditions to determine the restricted conversion zones for land use change in the Dianchi basin. It conducts multi-scenario simulations of land use in the basin for 2030 and, based on these, performs ecological risk evaluations. The study compares the trends of change with and without ecological defense zones, to identify the most suitable land planning mode for the Dianchi basin and to provide theoretical support for its ecological rehabilitation and sustainable development. The main conclusions are as follows: (1) Except for water source conservation, the rest of the generally important zones include the Dianchi area. The extremely important zones for water source conservation, soil and water conservation, and biodiversity evaluation were overlaid to identify the most critical areas for ecosystem function. The mountainous areas with higher elevations exhibit the highest sensitivity to soil and water erosion, while the overall sensitivity to rocky desertification in the basin is lower. (2) The land use types in the Dianchi basin for 2030 are dominated by cultivated land and woodland, and the distribution of ecological risks under different scenarios is similar to the historical distribution. Compared to the NS and ES, the PS shows a decreasing trend in ecological risk, which is more conducive to alleviating the ecological risk of the basin and aligns better with the needs of ecological management. (3) With the addition of ecological defense zones as constraints, ecological risks in all scenarios show an improving trend. The NS shows greater improvement than the PS, which, in turn, shows greater improvement than the ES. The most significant improvement is observed in the northern part of Dianchi lake. In summary, adding an ecological prevention zone as a constraint in the PS offers greater advantages in the efficient allocation of land resources, and highlights their scientific and prospective importance in optimizing the ecological environment, which is particularly evident in ecological risk evaluations.

Author Contributions

Conceptualization, S.W., Q.X., J.Y., Q.W., Q.R., Y.L. (Youyou Li) and Z.G.; methodology, S.W., Q.X., and J.Y.; validation, S.W., Q.X. and J.Y.; formal analysis, S.W. and Q.X.; investigation, S.W. and J.Y.; data curation, S.W., Q.W., Y.L. (You Li) and H.W.; writing—original draft preparation, S.W.; writing—review and editing, Q.X. and J.Y.; visualization, S.W., Q.W., Q.R., Y.L. (Youyou Li) and Z.G.; supervision, Q.X. and J.Y.; funding acquisition, Q.X. and J.Y. All authors have read and agreed to the published version of the manuscript.

Funding

This research was funded by the National Natural Science Foundation of China (grant numbers: 42161065 and 41461038), the Major Science and Technology Special Project in the Yunnan Province (202202AD080010), the Yunnan Province Basic Research Key Program (202401AS070037), and the Research project of Lijiang Culture and Tourism College (2025XY20).

Data Availability Statement

The datasets used and/or analyzed during the current study are available from the corresponding author upon reasonable request.

Acknowledgments

We would like to express our sincere gratitude to the editors and reviewers who invested considerable time and effort into their comments on this paper. We have gained useful insights from and would like to express our sincere gratitude to A-Xing Zhu for his lecture “Condensation of scientific problems and writing of SCI papers and grant projects”.

Conflicts of Interest

The authors declare no conflicts of interest.

Abbreviations

The following abbreviations are used in this manuscript:
NSNatural scenario
ESEconomic scenario
PSEcological scenario
EFIEcological function importance
ESEEcological sensitivity
GDERIGuidelines for the Delineation of Ecological Red Lines

References

  1. Wu, J.; Han, P.; Zhai, J.; Zhang, Q. Innovative Perspectives on Ecological Assessment in the Agro-Pastoral Ecotone of Inner Mongolia: An Integrated Evaluation and Forecast of Landscape and Ecological Risks and Drivers. Land 2024, 13, 1849. [Google Scholar] [CrossRef]
  2. Solomon, K.R.; Baker, D.B.; Richards, R.P.; Dixon, K.R.; Klaine, S.J.; La Point, T.W.; Kendall, R.J.; Weisskopf, C.P.; Giddings, J.M.; Giesy, J.P.; et al. Ecological risk assessment of atrazine in North American surface waters. Environ. Toxicol. Chem. 1996, 15, 31–76. [Google Scholar] [CrossRef]
  3. Abdullah, S.; Adnan, M.S.G.; Barua, D.; Murshed, M.M.; Kabir, Z.; Chowdhury, M.B.H.; Hassan, Q.K.; Dewan, A. Urban green and blue space changes: A spatiotemporal evaluation of impacts on ecosystem service value in Bangladesh. Ecol. Inform. 2022, 70, 101730. [Google Scholar] [CrossRef]
  4. Cervelli, E.; Pindozzi, S.; Sacchi, M.; Capolupo, A.; Cialdea, D.; Rigillo, M.; Boccia, L. Supporting land use change assessment through Ecosystem Services and Wildlife Indexes. Land Use Policy 2017, 65, 249–265. [Google Scholar] [CrossRef]
  5. Guo, J.; Shen, B.; Li, H.; Wang, Y.; Tuvshintogtokh, I.; Niu, J.; Potter, M.A.; Li, F.Y. Past dynamics and future prediction of the impacts of land use cover change and climate change on landscape ecological risk across the Mongolian plateau. J. Environ. Manag. 2024, 355, 120365. [Google Scholar] [CrossRef]
  6. Rahman, M.; Islam, M.M.; Kim, H.-J.; Sadiq, S.; Alam, M.; Siddiqua, T.; Mamun, M.A.; Gazi, M.A.H.; Raju, M.R.; Chen, N.; et al. Assessing the Influence of Land Cover and Climate Change Impacts on Runoff Patterns Using CA-ANN Model and CMIP6 Data. ISPRS Int. J. Geo-Inf. 2023, 12, 401. [Google Scholar] [CrossRef]
  7. Fulford, R.S.; Russell, M.; Myers, M.; Malish, M.; Delmaine, A. Models help set ecosystem service baselines for restoration assessment. J. Environ. Manag. 2022, 317, 115411. [Google Scholar] [CrossRef]
  8. Jing, Z.; Weihua, F.; Peijun, S.; Li, Z. Modeling the impacts of land use change on hydrological processes in fast urbanizing region—A case study of the Buji watershed in Shenzhen City, China. J. Nat. Resour. 2009, 24, 1560–1572. [Google Scholar]
  9. Karimian, H.; Zou, W.; Chen, Y.; Xia, J.; Wang, Z. Landscape ecological risk assessment and driving factor analysis in Dongjiang river watershed. Chemosphere 2022, 307, 135835. [Google Scholar] [CrossRef]
  10. Wu, J.; Luo, J.; Zhang, H.; Qin, S.; Yu, M. Projections of land use change and habitat quality assessment by coupling climate change and development patterns. Sci. Total Environ. 2022, 847, 157491. [Google Scholar] [CrossRef]
  11. Neyret, M.; Peter, S.; Le Provost, G.; Boch, S.; Boesing, A.L.; Bullock, J.M.; Hölzel, N.; Klaus, V.H.; Kleinebecker, T.; Krauss, J.; et al. Landscape management strategies for multifunctionality and social equity. Nat. Sustain. 2023, 6, 391–403. [Google Scholar] [CrossRef]
  12. Cao, M.; Tian, Y.; Wu, K.; Chen, M.; Chen, Y.; Hu, X.; Sun, Z.; Zuo, L.; Lin, J.; Luo, L.; et al. Future land-use change and its impact on terrestrial ecosystem carbon pool evolution along the Silk Road under SDG scenarios. Sci. Bull. 2023, 68, 740–749. [Google Scholar] [CrossRef] [PubMed]
  13. Sui, L.; Yan, Z.; Li, K.; Wang, C.; Shi, Y.; Du, Y. Prediction of ecological security network in Northeast China based on landscape ecological risk. Ecol. Indic. 2024, 160, 111783. [Google Scholar] [CrossRef]
  14. Li, C.; Qin, F.; Liu, Z.; Pan, Z.; Gao, D.; Han, Z. Multi-scenario assessment of landscape ecological risk in the transitional zone between the warm temperate zone and the northern subtropical zone. Front. Ecol. Evol. 2024, 12, 1471164. [Google Scholar] [CrossRef]
  15. You, C.; Qu, H.; Zhang, S.; Guo, L. Assessment of Uncertainties in Ecological Risk Based on the Prediction of Land Use Change and Ecosystem Service Evolution. Land 2024, 13, 535. [Google Scholar] [CrossRef]
  16. Huang, J.; Wang, Y. Ventilation potential simulation based on multiple scenarios of land-use changes catering for urban planning goals in the metropolitan area. J. Clean. Prod. 2024, 483, 144301. [Google Scholar] [CrossRef]
  17. Xu, D.; Yu, C.; Lin, W.; Yao, J.; Zhou, W. Spatiotemporal Evolution and Prediction of Land Use and Carbon Stock in Shanghai. Land 2024, 13, 267. [Google Scholar] [CrossRef]
  18. Xin, X.; Zhou, J.; Johnson, V.C.; Shi, J.; Tan, M.L.; Zhang, F. Multi-scenario land use change simulation and spatial-temporal evolution of carbon storage in the Yangtze River Delta region based on the PLUS-InVEST model. PLoS ONE 2025, 20, e0316255. [Google Scholar] [CrossRef]
  19. Nie, W.; Xu, B.; Yang, F.; Shi, Y.; Liu, B.; Wu, R.; Lin, W.; Pei, H.; Bao, Z. Simulating future land use by coupling ecological security patterns and multiple scenarios. Sci. Total Environ. 2023, 859, 160262. [Google Scholar] [CrossRef]
  20. Li, Y.; Ma, Q.; Song, Y.; Han, H. Bringing conservation priorities into urban growth simulation: An integrated model and applied case study of Hangzhou, China. Resour. Conserv. Recycl. 2019, 140, 324–337. [Google Scholar] [CrossRef]
  21. Gao, L.; Tao, F.; Liu, R.; Wang, Z.; Leng, H.; Zhou, T. Multi-scenario simulation and ecological risk analysis of land use based on the PLUS model: A case study of Nanjing. Sustain. Cities Soc. 2022, 85, 104055. [Google Scholar] [CrossRef]
  22. Kang, L.; Yang, X.; Gao, X.; Zhang, J.; Zhou, J.; Hu, Y.; Chi, H. Landscape ecological risk evaluation and prediction under a wetland conservation scenario in the Sanjiang Plain based on land use/cover change. Ecol. Indic. 2024, 162, 112053. [Google Scholar] [CrossRef]
  23. Hu, S.; Chen, L.; Li, L.; Zhang, T.; Yuan, L.; Cheng, L.; Wang, J.; Wen, M. Simulation of Land Use Change and Ecosystem Service Value Dynamics under Ecological Constraints in Anhui Province, China. Int. J. Environ. Res. Public Health 2020, 17, 4228. [Google Scholar] [CrossRef] [PubMed]
  24. Qi, B.; Yu, M.; Li, Y. Multi-Scenario Prediction of Land-Use Changes and Ecosystem Service Values in the Lhasa River Basin Based on the FLUS-Markov Model. Land 2024, 13, 597. [Google Scholar] [CrossRef]
  25. Song, X.; Zhang, Z.; Wang, Z.; Liu, Y. Development vs. conservation in limited urban sprawl: An integrated framework for resolving the urban boundary dilemma in China. J. Geogr. Sci. 2024, 34, 1371–1393. [Google Scholar] [CrossRef]
  26. Luan, C.; Liu, R.; Sun, J.; Su, S.; Shen, Z. An Improved Future Land-Use Simulation Model with Dynamically Nested Ecological Spatial Constraints. Remote Sens. 2023, 15, 2921. [Google Scholar] [CrossRef]
  27. Tong, X.; Feng, Y. A review of assessment methods for cellular automata models of land-use change and urban growth. Int. J. Geogr. Inf. Sci. 2019, 34, 866–898. [Google Scholar] [CrossRef]
  28. Clarke, K.C.; Gaydos, L.J. Loose-coupling a cellular automaton model and GIS: Long-term urban growth prediction for San Francisco and Washington/Baltimore. Int. J. Geogr. Inf. Sci. 1998, 12, 699–714. [Google Scholar] [CrossRef]
  29. Liu, X.; Liang, X.; Li, X.; Xu, X.; Ou, J.; Chen, Y.; Li, S.; Wang, S.; Pei, F. A future land use simulation model (FLUS) for simulating multiple land use scenarios by coupling human and natural effects. Landsc. Urban Plan. 2017, 168, 94–116. [Google Scholar] [CrossRef]
  30. Yao, Y.; Jiang, Y.; Sun, Z.; Li, L.; Chen, D.; Xiong, K.; Dong, A.; Cheng, T.; Zhang, H.; Liang, X.; et al. Applicability and sensitivity analysis of vector cellular automata model for land cover change. Comput. Environ. Urban Syst. 2024, 109, 102090. [Google Scholar] [CrossRef]
  31. Wang, Q.; Xiao, X.; Yao, A.; Hillman, A.L.; Jiang, Z.; Wang, R.; Yang, X. Unraveling the early human impacts on the ecosystem of Dianchi Lake: A 20,000-year diatom record from the southeastern Tibetan Plateau. Quat. Sci. Rev. 2024, 337, 108813. [Google Scholar] [CrossRef]
  32. Cai, F.; Tang, B.-H.; Sima, O.; Chen, G.; Zhang, Z. Fine Extraction of Plateau Wetlands Based on a Combination of Object-Oriented Machine Learning and Ecological Rules: A Case Study of Dianchi Basin. IEEE J. Sel. Top. Appl. Earth Obs. Remote Sens. 2024, 17, 5364–5377. [Google Scholar] [CrossRef]
  33. Yang, J.; Huang, X. The 30 m annual land cover dataset and its dynamics in China from 1990 to 2019. Earth Syst. Sci. Data 2021, 13, 3907–3925. [Google Scholar] [CrossRef]
  34. Yu, P.; Feng, M.; Liu, B.; Bai, S.; Gu, S.; Chen, Y. Demarcation and administration of watershed ecological protection red line considering the ecological security pattern—A case of the Qilu Lake watershed, Yunnan Province. J. Lake Sci. 2020, 32, 89–99. [Google Scholar]
  35. Wang, Z.; Li, W.; Li, Y.; Qin, C.; Lv, C.; Liu, Y. The “Three Lines One Permit” policy: An integrated environmental regulation in China. Resour. Conserv. Recycl. 2020, 163, 105101. [Google Scholar] [CrossRef]
  36. Shen, M.; Liu, Y.; Zheng, H.; Chen, J. Evaluation of Water Source Conservation Service Value and Its Spatial Transfer in Yangtze River Basin. J. Yangtze River Sci. Res. Inst. 2024, 41, 14–22. [Google Scholar]
  37. Zhang, W.; Fu, J. Rainfall erosivity estimation under different rainfall amount. Resour. Sci. 2003, 25, 35–41. [Google Scholar]
  38. Williams, J.R.; Jones, C.A.; Dyke, P.T. A Modeling Approach to Determining the Relationship Between Erosion and Soil Productivity. Trans. ASAE 1984, 27, 0129–0144. [Google Scholar] [CrossRef]
  39. Liang, X.; Guan, Q.; Clarke, K.C.; Liu, S.; Wang, B.; Yao, Y. Understanding the drivers of sustainable land expansion using a patch-generating land use simulation (PLUS) model: A case study in Wuhan, China. Comput. Environ. Urban Syst. 2021, 85, 101569. [Google Scholar] [CrossRef]
  40. Wang, Z.; Zhong, A.; Li, Q. Optimization of Land Use Structure Based on the Coupling of GMOP and PLUS Models: A Case Study of Lvliang City, China. Land 2024, 13, 1335. [Google Scholar] [CrossRef]
  41. Yang, S.; Jin, Z. Impact of road network expansion on landscape ecological risk and soil erosion sensitivity on the Luochuan Tableland of the Chinese Loess Plateau. Reg. Environ. Change 2024, 24, 37. [Google Scholar] [CrossRef]
  42. Bhardwaj, P.; Yu, Y.; Cui, W.; Liu, S.; Yu, T.; Song, Y. Evolutionary analysis of landscape ecological risk in Baili Rhododendron National Forest Park. PLoS ONE 2025, 20, e0317851. [Google Scholar] [CrossRef]
  43. Yaermaimaiti, A.; Li, X.; Ge, X.; Liu, C. Analysis of landscape pattern and ecological risk change characteristics in Bosten Lake basin based on optimal scale. Ecol. Indic. 2024, 163, 112120. [Google Scholar] [CrossRef]
  44. Hou, X.; Song, B.; Zhang, X.; Wang, X.; Li, D. Multi-scenario Simulation and Spatial-temporal Analysis of LUCC in China’s Coastal Zone Based on Coupled SD-FLUS Model. Chin. Geogr. Sci. 2024, 34, 579–598. [Google Scholar] [CrossRef]
  45. Mutale, B.; Qiang, F. Modeling future land use and land cover under different scenarios using patch-generating land use simulation model. A case study of Ndola district. Front. Environ. Sci. 2024, 12, 1362666. [Google Scholar] [CrossRef]
  46. Koko, A.F.; Han, Z.; Wu, Y.; Zhang, S.; Ding, N.; Luo, J. Spatiotemporal Analysis and Prediction of Urban Land Use/Land Cover Changes Using a Cellular Automata and Novel Patch-Generating Land Use Simulation Model: A Study of Zhejiang Province, China. Land 2023, 12, 1525. [Google Scholar] [CrossRef]
  47. Chen, S.; Yao, S. Identifying the drivers of land expansion and evaluating multi-scenario simulation of land use: A case study of Mashan County, China. Ecol. Inform. 2023, 77, 102201. [Google Scholar] [CrossRef]
  48. Gan, L.; Halik, Ü.; Shi, L.; Welp, M. Ecological risk assessment and multi-scenario dynamic prediction of the arid oasis cities in northwest China from 1990 to 2030. Stoch. Environ. Res. Risk Assess. 2023, 37, 3099–3115. [Google Scholar] [CrossRef]
  49. Wang, Y.; Wang, J.; Hao, B.; Zhang, S.; Ding, J.; He, B. Multi-Scenario Simulation of Future Land Use in the Beijiang River Basin Under Multidimensional Ecological Constraints. Sustainability 2024, 16, 10910. [Google Scholar] [CrossRef]
  50. Gong, J.; Du, H.; Sun, Y.; Zhan, Y. Simulation and prediction of land use in urban agglomerations based on the PLUS model: A case study of the Pearl River Delta, China. Front. Environ. Sci. 2023, 11, 1306187. [Google Scholar] [CrossRef]
  51. Ma, X.; Li, J.; Li, G. Simulation and multi-scenario prediction of land-use change in the Gansu section of the Yellow River Basin, China. Front. Environ. Sci. 2024, 12, 1403248. [Google Scholar] [CrossRef]
  52. Zhang, Z.; Yu, H.; He, N.; Jin, G. Future land use simulation model-based landscape ecological risk prediction under the localized shared socioeconomic pathways in the Xiangjiang River Basin, China. Environ. Sci. Pollut. Res. 2024, 31, 22774–22789. [Google Scholar] [CrossRef] [PubMed]
  53. Han, X.; Pan, B.; Pan, Z.; Xu, N.; Wu, J.; Sun, W.; Hou, B.; Dong, Y. A clustering approach based on high-resolution ecological vulnerability index reveals spatial patterns of per- and polyfluoroalkyl substances pollution in lakes on the Tibetan Plateau. Water Res. 2025, 279, 123461. [Google Scholar] [CrossRef] [PubMed]
  54. Shamuxi, A.; Han, B.; Jin, X.; Wusimanjiang, P.; Abudukerimu, A.; Chen, Q.; Zhou, H.; Gong, M. Spatial pattern and driving mechanisms of dryland landscape ecological risk: Insights from an integrated geographic detector and machine learning model. Ecol. Indic. 2025, 172, 113305. [Google Scholar] [CrossRef]
  55. Yan, J.; Li, J.; Yao, X.; Li, Q.; Zheng, Z.; Li, G.; Qi, G.; Ma, W.; Song, M.; Gao, P. Ecological security pattern construction based on landscape ecological risk assessment in the Yellow River basin. Front. Environ. Sci. 2025, 13, 1514599. [Google Scholar] [CrossRef]
Figure 1. An overview of the Dianchi basin.
Land 14 00868 g001
Figure 2. Distribution of EFI and ESE in Dianchi basin. Note: (ae) represent, respectively, water source protection, soil and water conservation, biodiversity, soil and water erosion, and rock desertification.
Land 14 00868 g002
Figure 3. The ecological defense zone of the Dianchi basin.
Land 14 00868 g003
Figure 4. Land use patterns under multiple scenarios in the Dianchi basin for 2030. Note: (af) represent NS, ES, PS, NS (with restricted zone), ES (with restricted zone), and PS (with restricted zone), respectively, and I and II are localized detail comparisons.
Land 14 00868 g004
Figure 5. Land use area in the Dianchi basin under multiple scenarios for 2030.
Land 14 00868 g005
Figure 6. Changes in land use area under multiple scenarios in the Dianchi basin, 2020–2030.
Land 14 00868 g006
Figure 7. Area and percentage of ecological risk classes under multiple scenarios in Dianchi basin for 2030.
Land 14 00868 g007
Figure 8. Ecological risk evaluation under multiple scenarios for Dianchi basin for 2030. Note: (af) represent NS, ES, PS, NS (with restricted zone), ES (with restricted zone), and PS (with restricted zone), respectively, and I and II are localized detail comparisons.
Land 14 00868 g008
Figure 9. Changes in the ecological risk level under multiple scenarios in the Dianchi basin, 2020–2030. Note: (af) represent NS, ES, PS, NS (with restricted zone), ES (with restricted zone), and PS (with restricted zone), respectively, and I and II are the localized detail comparisons. The number 1 indicates an increase in ecological risk by one level, −1 indicates a decrease in ecological risk by one level.
Land 14 00868 g009
Table 1. Data required for the study.
Data/YearData SourceDescriptionData Type/Resolution
Land use data/2000, 2010, 2020Publicly available datasets at Wuhan University [33]For 2030 land use modeling and ecological risk assessmentRaster/30 m
Distance to roadNational Geographic Information Resources Catalog Service System
(https://www.webmap.cn) accessed on 1 April 2024
For land use modeling for 2030Vector
Distance to town
Population density/2000, 2010, 2020WorldPop
(https://www.worldpop.org/) accessed on 1 April 2024
Raster/1 km
Night light/2000, 2010, 2020Resource and Environmental Science and Data Center of the Chinese Academy of Sciences
(http://www.resdc.cn) accessed on 1 April 2024
ElevationGeospatial Data Cloud
(http://www.gscloud.cn) accessed on 1 April 2024
For land use modeling and EFI and ESE evaluation for 2030Raster/90 m
Slope
Average annual
temperature/2000, 2010, 2020
Resource and Environmental Science and Data Center of the Chinese Academy of Sciences
(http://www.resdc.cn) accessed on 1 April 2024
Raster/1 km
Annual
precipitation
Tibetan Plateau Science Data Center
(https://data.tpdc.ac.cn/home) accessed on 1 April 2024
Evaporation/2000, 2010, 2020Tibetan Plateau Science Data Center
(https://data.tpdc.ac.cn/home) accessed on 1 April 2024
For ecological importance and sensitivity assessment
SoilHarmonized World Soil Database
(https://gaez.fao.org/pages/hwsd) accessed on 1 April 2024
Table 2. Construction of index system of EFI and ESE.
IndexFormulaDescription
EFIWater source protection P A W C = 54.509 0.132 s a n d % 0.003 s a n d % 2 0.055 s i l t % 0.006 s i l t % 2 0.738 c l a y % + 0.007 c l a y % 2 2.688 O M % + 0.501 O M % 2
W i = Y i L i
Y i = F p r e E T i
L i = min X i × F p r e , Y i
The average annual precipitation, evapotranspiration, root depth, and effective water content of plants were imported into the InVEST model to calculate the water yield. The formula for calculating the importance of water source protection ecological function was taken from [36].
Soil and water conservation R i = 0.0668 × F p r e 1.6266
K i = 0.01383 + 0.51575 K E P I C × 0.1317
K E P I C = 0.2 + 0.3 e x p 0.0256 m s 1 m s i l t 100 × m s i l t m c + m s i l t 0.3 × 1 0.25 o r g C o r g C + e x p 3.72 2.95 o r g C × 1 0.7 1 m s 100 / 1 m s 100 + e x p 5.51 + 2.2.9 1 m s 100
The formula for calculating the erosive power of average annual rainfall was taken from [37], and the formula for calculating soil erodibility was taken from [38]. These formulas, along with other relevant data, were imported into the InVEST model for calculation. Finally, the results of the EFI of soil and water conservation were obtained.
Biodiversity S i = N P P m e a n × F p r e × F t e m × 1 F a l t This part can be calculated by referring to the formula in the GDERI.
ESESoil and water erosion T i = R i × K i × L S i × C i 4
C l = N D V I N D V I s o i l / N D V I v e g N D V I s o i l
Rock desertification M i = D i × P i × C i 3
Note: P A W C is the plant-available water content; sand%, silt%, and clay% are the proportions of soil sand, silt, and clay, respectively; and OM is the soil organic matter content. W i is the water yield, Y i is the water production, L i is the surface runoff, F p r e is the average annual rainfall, E T i is the evapotranspiration, R i is the average annual rainfall erosive power, and X i is the surface runoff coefficient. K E P I C is the pre-amended soil erodibility, and K i is the post-amended soil erodibility. m c , m s i l t , m s , and orgC are the percentage contents of clay, silt, sand, and organic carbon, respectively. N P P m e a n is the average multi-year net primary productivity of vegetation, F t e m is the average annual temperature, and F a l t is the slope factor; R i is the rainfall erodibility, L S i is the slope length and gradient, C i is the surface vegetation cover, N D V I v e g is the information contributed by a fully vegetated surface, and N D V I s o i l is the information contributed by an unvegetated surface. D i is the percentage of the area of regional carbonate outcrops, and P i is the slope of the terrain. Data for which no formulas are listed were obtained directly.
Table 3. Multiple scenario land use transition matrices.
Land UseCultivated LandWoodlandGrasslandWaterConstruction LandUnused Land
NSCultivated land111000
Woodland111101
Grassland111111
Water000111
Construction land000011
Unused land111111
ESCultivated land100011
Woodland010000
Grassland011000
Water000000
Construction land010110
Unused land111111
PSCultivated land101010
Woodland111010
Grassland111111
Water101111
Construction land111111
Unused land000001
Disclaimer/Publisher’s Note: The statements, opinions and data contained in all publications are solely those of the individual author(s) and contributor(s) and not of MDPI and/or the editor(s). MDPI and/or the editor(s) disclaim responsibility for any injury to people or property resulting from any ideas, methods, instructions or products referred to in the content.

