Article

Does Intercity Transportation Accessibility Matter? Its Effects on Regional Network Centrality in South Korea

LX Spatial Information Research Institute, Korea Land and Geospatial Informatix Corporation, Jeonju 54870, Republic of Korea
*
Author to whom correspondence should be addressed.
Land 2025, 14(4), 873; https://doi.org/10.3390/land14040873
Submission received: 20 March 2025 / Revised: 11 April 2025 / Accepted: 14 April 2025 / Published: 16 April 2025
(This article belongs to the Special Issue Territorial Space and Transportation Coordinated Development)

Abstract

:
This study investigates the relationship between intercity transportation accessibility and network centrality across South Korea by integrating Global Positioning System (GPS)-based mobility data with graph-theoretic centrality measures, including degree, PageRank, local clustering coefficient, harmonic, Katz, and information centrality. Employing both statistical modeling and machine learning techniques, this analysis uncovers key structural patterns and interaction effects within the national mobility network. The findings yield several important insights. First, the Seoul Metropolitan Area emerges as the dominant mobility hub, with Busan, Daegu, and Daejeon functioning as secondary centers, reflecting a polycentric urban configuration. Second, intermediary transfer hubs—despite having lower direct connectivity—substantially enhance overall network efficiency and interregional mobility. Third, transportation accessibility, particularly in relation to regional transit and highway infrastructure, exhibits a significant association with centrality measures and strong feature importance, identifying these modes as primary determinants of spatial connectivity. Fourth, the impact of accessibility on centrality is characterized by nonlinear relationships and threshold effects. By elucidating the complex interplay between mobility infrastructure and spatial network dynamics, this study contributes to a more comprehensive understanding of regional connectivity and network centrality and offers policy-relevant insights for future transportation planning.

1. Introduction

Cities operate as complex systems comprising numerous interdependent components, including transportation networks, streets, buildings, and public spaces [1]. The dynamic interactions among these elements continuously shape urban form and function, influencing spatial organization and the distribution of human activities [2,3,4]. Among these, the spatial configuration of transportation infrastructure plays a particularly critical role in shaping patterns of accessibility, mobility, and land use [5]. Well-planned and strategically located transportation infrastructure plays a critical role in enhancing the efficient movement of people and goods, stimulating economic activity, mitigating spatial fragmentation, and guiding patterns of urban expansion by strengthening regional connectivity and spatial integration [6,7]. As such, transportation accessibility, determined by the location of transportation infrastructures, is fundamental to regional development, as it facilitates economic integration, population movement, and spatial connectivity [8,9].
Beyond their operational role, transportation systems also structure the spatial distribution of opportunity, directly shaping regional connectivity and influencing the geographic allocation of resources and populations [10]. Empirical studies have consistently shown that improved accessibility is associated with economic growth, productivity gains, and increased urban competitiveness [11]. However, the effects of enhanced transportation accessibility are not uniformly positive across all regions [12]. While it can support regional integration, it can also exacerbate spatial inequalities by disproportionately benefiting major metropolitan areas while leaving peripheral or rural regions behind [13,14].
Indeed, large urban centers often capture the bulk of the benefits generated by new or improved transportation infrastructure, while less connected regions may experience stagnation or even decline [15,16]. This uneven distribution of accessibility benefits has been documented in the context of multimodal transportation hubs, which tend to reinforce existing regional advantages and deepen disparities [16,17]. For instance, research in Greece has shown that improvements in transportation infrastructure can exacerbate socio-spatial inequalities by reinforcing hierarchical urban systems rather than fostering balanced development [18]. As regional inequalities deepen—especially between metropolitan cores and declining rural areas [19,20]—it becomes increasingly important to understand how transportation accessibility shapes the spatial structure of regional systems in order to promote equitable and sustainable development.
Parallel to discussions on accessibility, the concept of network centrality has gained increasing prominence in transportation and spatial network analysis. Centrality metrics are used to evaluate the structural importance of nodes (e.g., cities or regions) within a broader network based on their position and connectivity [21,22,23]. The degree to which a location is centrally positioned within a transportation network can influence its economic potential, accessibility to other regions, and vulnerability to spatial inequality [24]. Empirical research has demonstrated that regions with higher network centrality are often characterized by greater economic activity, denser urban development, and more substantial infrastructure investment [25,26,27]. In this context, centrality measures such as degree, betweenness, and PageRank have been applied to analyze the efficiency and functional hierarchy of urban and regional networks [28,29].
While accessibility describes the ease with which people and goods move between locations [30], centrality captures the strategic significance of a city or region within the transportation system [31]. The former is typically examined in relation to outcomes such as economic growth, land use, travel behavior, and housing markets [32,33,34], while the latter is employed to assess the structural integration and spatial embeddedness of cities [35,36]. Despite the conceptual overlap and practical interdependence of these two constructs, limited research has explicitly examined their interaction. Few studies have investigated how transportation accessibility influences the regional centrality within the network, and even fewer have attempted this using high-resolution spatial data in the context of rapidly evolving national urban systems.
To address these gaps, this study examines the relationship between intercity transportation accessibility—specifically, access to regional transit, intercity buses, and highways—and regional network centrality in South Korea. The study quantifies six network centrality indices using Global Positioning System (GPS)-based mobility data and evaluates them within three conceptual frameworks: (1) node importance and influence (degree and PageRank centrality), (2) network embeddedness and structural cohesion (local clustering coefficient and harmonic centrality), and (3) destination reachability and network efficiency (Katz and information centrality). This analysis employs correlation analysis (COR), ordinary least squares (OLS) regression, and spatial lag models (SLMs) to estimate the effect size and statistical significance of intercity transportation accessibility on these network centrality measures. Additionally, advanced machine learning (ML) techniques—including extreme gradient boosting (XGB), permutation-based feature importance (PBFI), and partial dependence plots (PDP)—are incorporated to identify feature importance and nonlinear and threshold relationships.
This study makes three contributions. First, it advances network theory in urban and transportation planning by integrating transportation accessibility and network centrality within a unified analytical framework. Second, it provides empirical insights into how intercity transit, buses, and highways collectively shape regional connectivity and spatial organization. Third, it offers actionable policy insights to support more balanced infrastructure development, mitigate regional disparities, and enhance the functional efficiency of transportation systems.

2. Materials and Methods

2.1. Study Area

This study focuses on South Korea, which is characterized by a highly developed yet spatially imbalanced transportation system [37,38]. It offers a valuable empirical setting for investigating the interaction between intercity transportation accessibility and network centrality for several reasons. First, its well-developed but unevenly utilized transportation infrastructure allows for a comparative analysis of regions with varying levels of accessibility [39]. Second, despite significant investments in high-speed rail (Korean Train eXpress, KTX), intercity bus services, and highways [40,41], regional disparities, shown in Figure 1, remain a persistent challenge [42,43], making South Korea an ideal case for examining the relationship between intercity transportation accessibility and regional network centrality.

2.2. Variables

2.2.1. Dependent Variables

This study examines the relationship between transportation accessibility and regional network centrality by employing six network centrality indices as dependent variables (see Table 1). Network centrality serves as a fundamental theoretical framework for understanding regional connectivity by quantifying the structural and functional significance of individual locations within a transportation or mobility network [29]. Among the various centrality indices, measures such as degree and PageRank have been widely adopted to evaluate the extent of a node’s connectedness and its influence within a networked system [44,45]. These indicators are instrumental in identifying the relative importance of locations based on both direct and indirect connections [46].
Moreover, recent advances in network science suggest that relying on a limited set of centrality metrics may oversimplify the complex dynamics of spatial systems. Accordingly, emerging measures—such as harmonic, load, or percolation centrality—offer additional insights into dimensions such as network robustness, spatial embeddedness, and system-wide efficiency [47,48]. To comprehensively capture the multifaceted nature of regional connectivity, this study employs six key centrality indices, organized into three conceptual dimensions: positional accessibility, structural importance, and spatial cohesion (see Table 1).
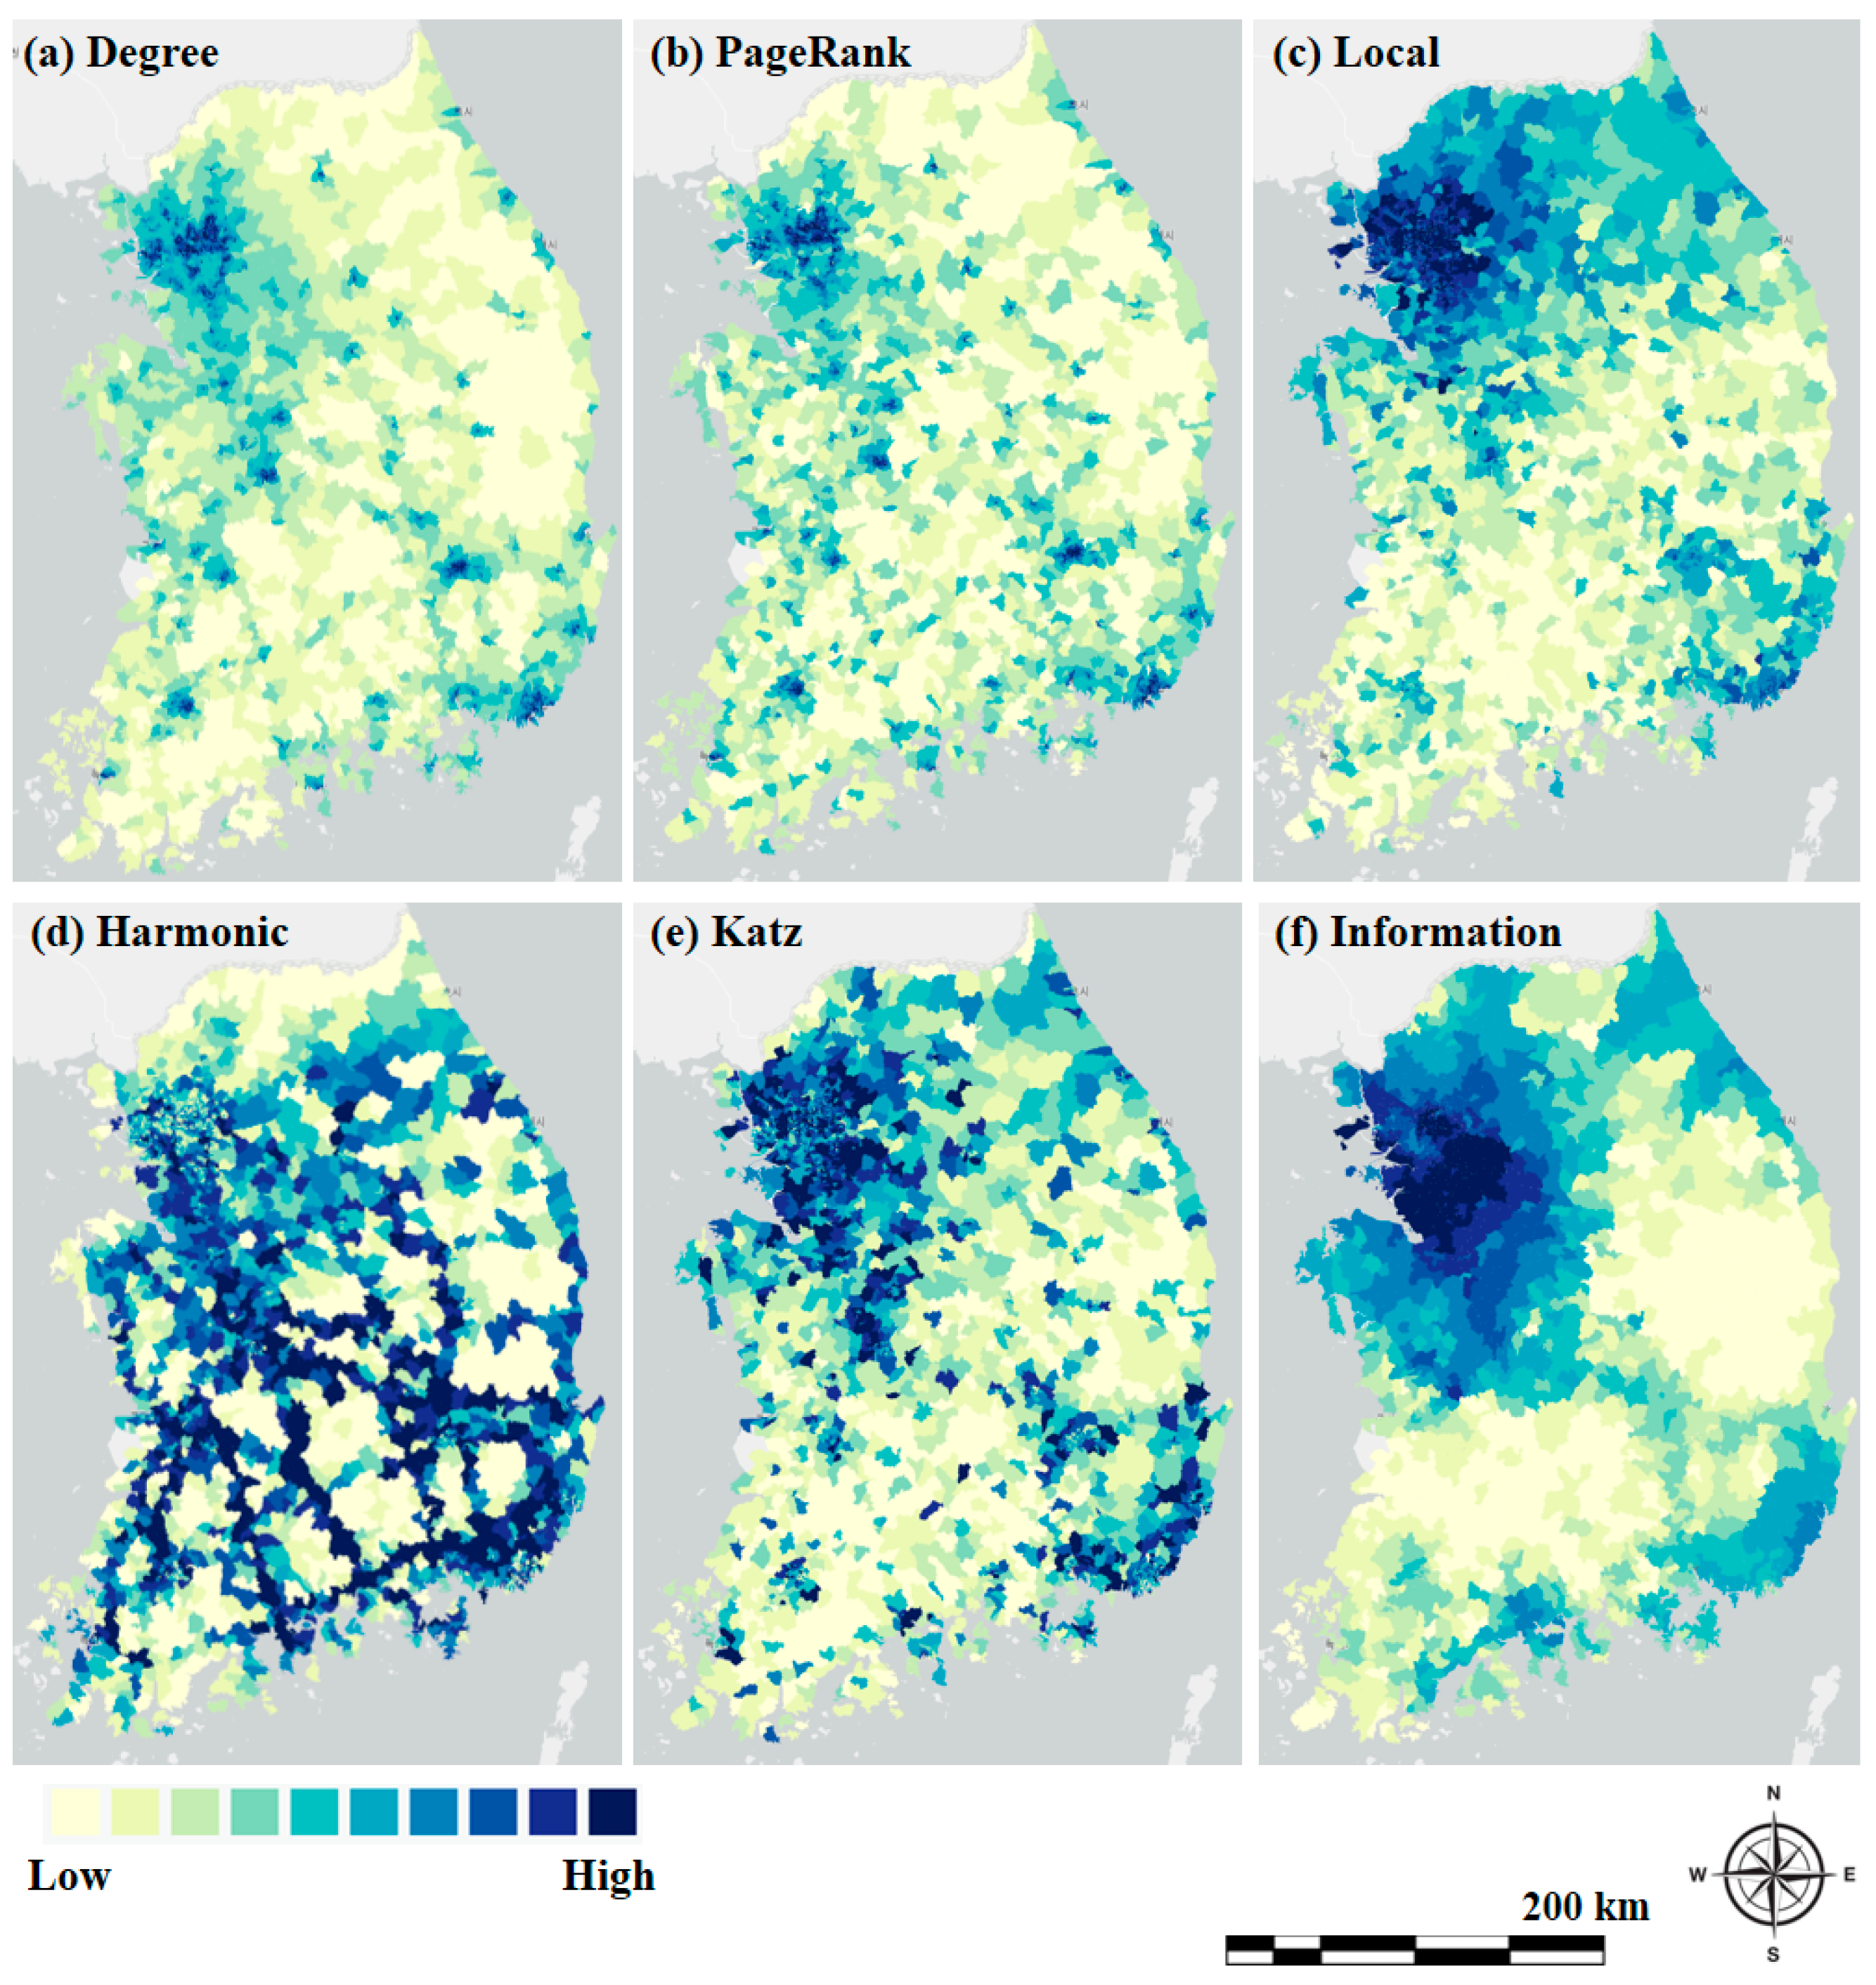
  • Node Importance and Influence: Degree centrality and PageRank centrality measure the prominence of a node within a network, indicating its connectivity and influence in facilitating mobility flows.
  • Network Embeddedness and Structural Cohesion: Local clustering coefficient and harmonic centrality assess the extent to which a node contributes to regional cohesion and the overall network structure.
  • Destination Reachability and Network Efficiency: Katz centrality and information centrality evaluate how effectively a node enables movement beyond its immediate connections, reflecting its role in ensuring network-wide accessibility and efficiency.
Table 1. Conceptual frameworks and descriptions of the six network centrality indices.
CategoryIndexConceptualizationMeanS. D.
Centrality
(Influence and Importance of Node)
Degree
Centrality
This quantifies the number of direct connections a node has, providing a fundamental measure of network prominence. In transportation networks, high-degree nodes correspond to major transit hubs or well-connected urban centers that serve as primary points of access within the system [49].3.620.61
PageRank
Centrality
This extends degree centrality by considering not just the number of connections but also the influence of those connections [50].2.100.56
Proximity
(Network Embeddedness and Structure)
Local
Clustering
Coefficient
This measures the tendency of nodes to form tightly knit clusters, indicating regional integration and resilience. A high clustering coefficient suggests that a node’s neighbors are well connected, reinforcing spatial cohesion and localized accessibility [51].2.310.71
Harmonic
Centrality
This accounts for the inverse of the shortest path distances from a node to all other nodes, emphasizing the efficiency of information or mobility flow within the network. Unlike closeness centrality, harmonic centrality remains well defined for disconnected networks, making it particularly relevant for assessing transportation accessibility in spatially fragmented regions [52].4.400.14
Accessibility
(Destination Reachability and Network Efficiency)
Katz
Centrality
This extends degree centrality by incorporating indirect connections, assigning greater importance to nodes that are connected to other influential nodes. This metric is particularly relevant in transportation networks as it captures the long-range accessibility of regions beyond their immediate connections [53].0.650.49
Information
Centrality
This evaluates the efficiency of information flow by considering all possible paths within the network rather than just shortest paths. In transportation systems, information centrality has been used to assess redundancy and resilience, ensuring that mobility networks remain functional despite disruptions [54]3.910.45

2.2.2. Independent Variables

The independent variables selected for this study—network distances to the nearest transit station, intercity bus station, and highway interchange—reflect key components of intercity transportation accessibility (see Table 2). These variables were chosen based on their critical roles in shaping regional mobility patterns, influencing accessibility, and determining network centrality within urban and rural contexts [55,56]. Prior research has shown that proximity to transportation nodes such as rail and bus stations significantly affects spatial inequality, transit usage, and accessibility-related development outcomes [57,58]. By incorporating these three modes of intercity transportation—regional transit, intercity buses, and highways—this study seeks to provide a comprehensive assessment of how varying forms of intercity accessibility shape regional centrality patterns within the national spatial network.

2.3. Method

2.3.1. Method 1: Network Centrality and Accessibility Estimation

We first construct an empirical mobility network using GPS-based origin–destination (OD) data provided by Korea Telecom (KT), covering the period from 13 June to 19 June 2022, at the Eup/Myeon/Dong (EMD) level. The dataset captures the actual movement patterns of individuals across South Korea. By leveraging these GPS-derived OD matrices, we calculate a suite of centrality indices (see Table 3)—including betweenness, closeness, and PageRank—that reflect not only the structural position of each node (i.e., city or region) but also its functional role in facilitating the circulation of people [59]. These indices were estimated using Python packages such as NetworkX, scaled to a 0–100 range for comparability, and subsequently log-transformed to address skewed distributions prior to statistical modeling and machine learning.
Moreover, we compute the accessibility using network analysis techniques in ArcGIS Pro 3.3, incorporating national-level road network and transit infrastructure datasets to reflect actual travel paths. This measure is quantified by calculating the shortest network distance, in meters, from the centroid of each EMD administrative unit to the nearest node of each respective transportation mode. Also, to account for the highly skewed nature of raw distance values and to better capture the nonlinear relationship between accessibility and regional connectivity, all distance measures were log-transformed. The resulting maps in Figure 2 illustrate clear spatial disparities, with higher accessibility (i.e., shorter distances) concentrated around major metropolitan regions and limited accessibility observed in peripheral or rural areas.

2.3.2. Method 2: Econometrics Models

To explore the effect size and statistical significance of transportation accessibility on network centrality indices, this study first conducts a correlation analysis by using packages in R Studio 4.4.1, such as spdep and spatialreg. The correlation analysis provides an initial understanding of the linear relationships between transportation accessibility (measured by KTX, intercity buses, and highways) and the six network centrality indices [60]. Following this, an OLS regression model is applied to estimate the direct effects of transportation accessibility on each network centrality index, while controlling for potential confounding variables [61]. The OLS model helps quantify the impact of accessibility variables on the centrality of regions within the transportation network, with separate models being built for each centrality index to capture the unique dynamics associated with different dimensions of network centrality. Furthermore, to account for potential spatial dependencies—where the centrality of one region may be influenced by neighboring regions—this study employs an SLM. The SLM incorporates spatial interactions between regions, providing a more nuanced understanding of how transportation accessibility in one area may influence the centrality of surrounding regions [58,62].

2.4. Method 3: Machine Learning

This study also uses ML techniques, specifically XGB, an ensemble learning method that builds a series of decision trees, to predict complex, nonlinear relationships by using Python 3.13 packages, including Scikit-learn and XGBoost [63,64]. The decision to employ ML in this study, rather than conventional econometric approaches such as OLS, stems from the complex and potentially nonlinear nature of the relationships between network centrality metrics, transportation accessibility, and floating population patterns [65,66]. Traditional econometric methods, while statistically robust and interpretable, generally assume linearity and rely on predefined functional forms [67]. Although spatial regression models can account for spatial dependence [62], they still face limitations in capturing intricate nonlinear interactions or variable thresholds unless explicitly modeled [68]. In contrast, ML techniques, particularly ensemble methods like random forests and gradient boosting, offer greater flexibility in modeling high-dimensional and nonlinear patterns without requiring strict assumptions about data distribution or variable interactions [69,70].
To find the most optimal algorithm for this study, 10-fold cross-validation is employed to evaluate and compare the performance of three ML algorithms [71]: Random Forest, Gradient Boosting, and XGB. The results of the cross-validation, summarized in Table 4, demonstrate that XGB outperforms the other algorithms in terms of predictive accuracy and robustness, making it the optimal choice for this study. To further enhance model performance, hyper-parameter tuning is conducted through grid search, a method that systematically tests a predefined set of hyper-parameters to identify the configuration that maximizes the model performance [72,73]. We selected four key hyperparameters for XGB—Number of Estimators (NE), Maximum Depth (MD), Learning Rate (LR), and Subsample (SS)—based on their commonly recognized influence on model performance and generalization. The optimal hyperparameter values identified are presented in Table 5.
Once the XGB model is optimized, PBFI and PDP are used to explore feature importance and nonlinear relationships between transportation accessibility and network centrality indices. First, to evaluate the relative importance of each feature—specifically, transportation accessibility measures and control variables—this study employs PBFI. This technique assesses the impact of each feature by randomly permuting its values and measuring the corresponding changes in model performance, thereby revealing the significance of individual variables [74]. Additionally, PDPs are utilized to explore the nonlinear relationships between transportation accessibility and network centrality indices. PDPs visualize the marginal effect of one or more features on the predicted outcome, providing insights into how variations in transportation accessibility influence network centrality while controlling for other factors [68].

3. Results

3.1. Network Centrality Structure of South Korea

Figure 3 presents the spatial distributions of six network centrality indices estimated from GPS-based mobility data.
The key findings are as follows. Degree centrality exhibits high values in the Seoul Metropolitan Area and other major urban centers, indicating that these locations serve as primary hubs with a dense network of direct connections. PageRank centrality, while generally aligned with degree centrality, also highlights regions that possess fewer direct connections but maintain high importance due to their linkages with critical nodes. The local clustering coefficient is notably high in metropolitan areas and some regional centers, indicating strong intra-regional connectivity. Harmonic centrality exhibits its highest values in densely connected yet non-peripheral urban areas, particularly in areas with extensive transit and road networks. Katz centrality closely mirrors the spatial patterns of PageRank centrality, emphasizing the significance of both direct and indirect connectivity to major hubs. Information centrality is concentrated in large metropolitan areas and along major transportation corridors, particularly in and around Seoul.

3.2. Effect Size and Significance of Transportation Accessibility on Network Centrality

Table 6 presents the associations between transportation accessibility—measured as network distance to regional transit, intercity bus, and highways—and six network centrality indices using COR, OLS, and SLM. The results highlight several notable patterns. First, the negative coefficients across most models indicate that shorter distances to transit, bus, and highway infrastructure are generally associated with higher network centrality. This suggests that areas with better transportation accessibility tend to function as key nodes in the mobility network, facilitating movement and interaction. Second, Katz centrality, which captures both direct and indirect connections, is significantly influenced by transit, bus, and highway accessibility, with shorter distances corresponding to higher connectivity (coefficient of −0.018, −0.036, and −0.063 in SLM).
Third, harmonic centrality, which emphasizes global efficiency in shortest-path distances, displays the strongest response to transit accessibility, with a coefficient of −1.922 in the COR model and significant effects in the OLS and SLM. This suggests that proximity to regional transit hubs enhances the overall efficiency of the mobility network by reducing travel distances across the system. Fourth, a key insight from the findings is that the local clustering coefficient, which measures neighborhood-level connectivity, is negatively associated with transportation accessibility across all modes. This suggests that areas with strong transit and highway accessibility tend to be more integrated into the broader network rather than functioning as self-contained clusters.

3.3. Feature Importance of Accessibility Factors in Predicting Network Centrality

Table 7 presents the PBFI results from the XGB, assessing the relative contributions of the accessibility in predicting network centrality indices. Some of the major findings are as follows. First, highway accessibility emerges as the most influential factor, exhibiting the highest feature importance values for degree (0.555), PageRank (0.556), harmonic (0.562), information (0.501), and Katz (0.526) centralities. These findings suggest that proximity to highways is a primary determinant of network centrality, likely due to the extensive spatial coverage and direct connectivity that highways provide.
Second, transit accessibility exhibits notable significance, particularly in the local clustering coefficient (0.533), reinforcing the notion that transit infrastructure fosters localized network cohesion. This finding suggests that areas with higher transit accessibility are more likely to exhibit strong intra-regional connectivity, likely driven by dense transit-oriented development patterns and frequent service intervals. Additionally, transit accessibility contributes moderately to degree (0.410) and harmonic (0.409) centrality, indicating its role in both direct network connectivity and overall accessibility efficiency.
Third, intercity bus accessibility demonstrates the lowest influence, a marginal one, among the three transportation modes. The feature importance values for bus accessibility remain relatively low across all centrality measures, with the highest being 0.272 for the local clustering coefficient. This suggests that intercity bus services, while relevant for localized connectivity, do not exert a dominant influence on the broader mobility network compared to highways and transit systems.

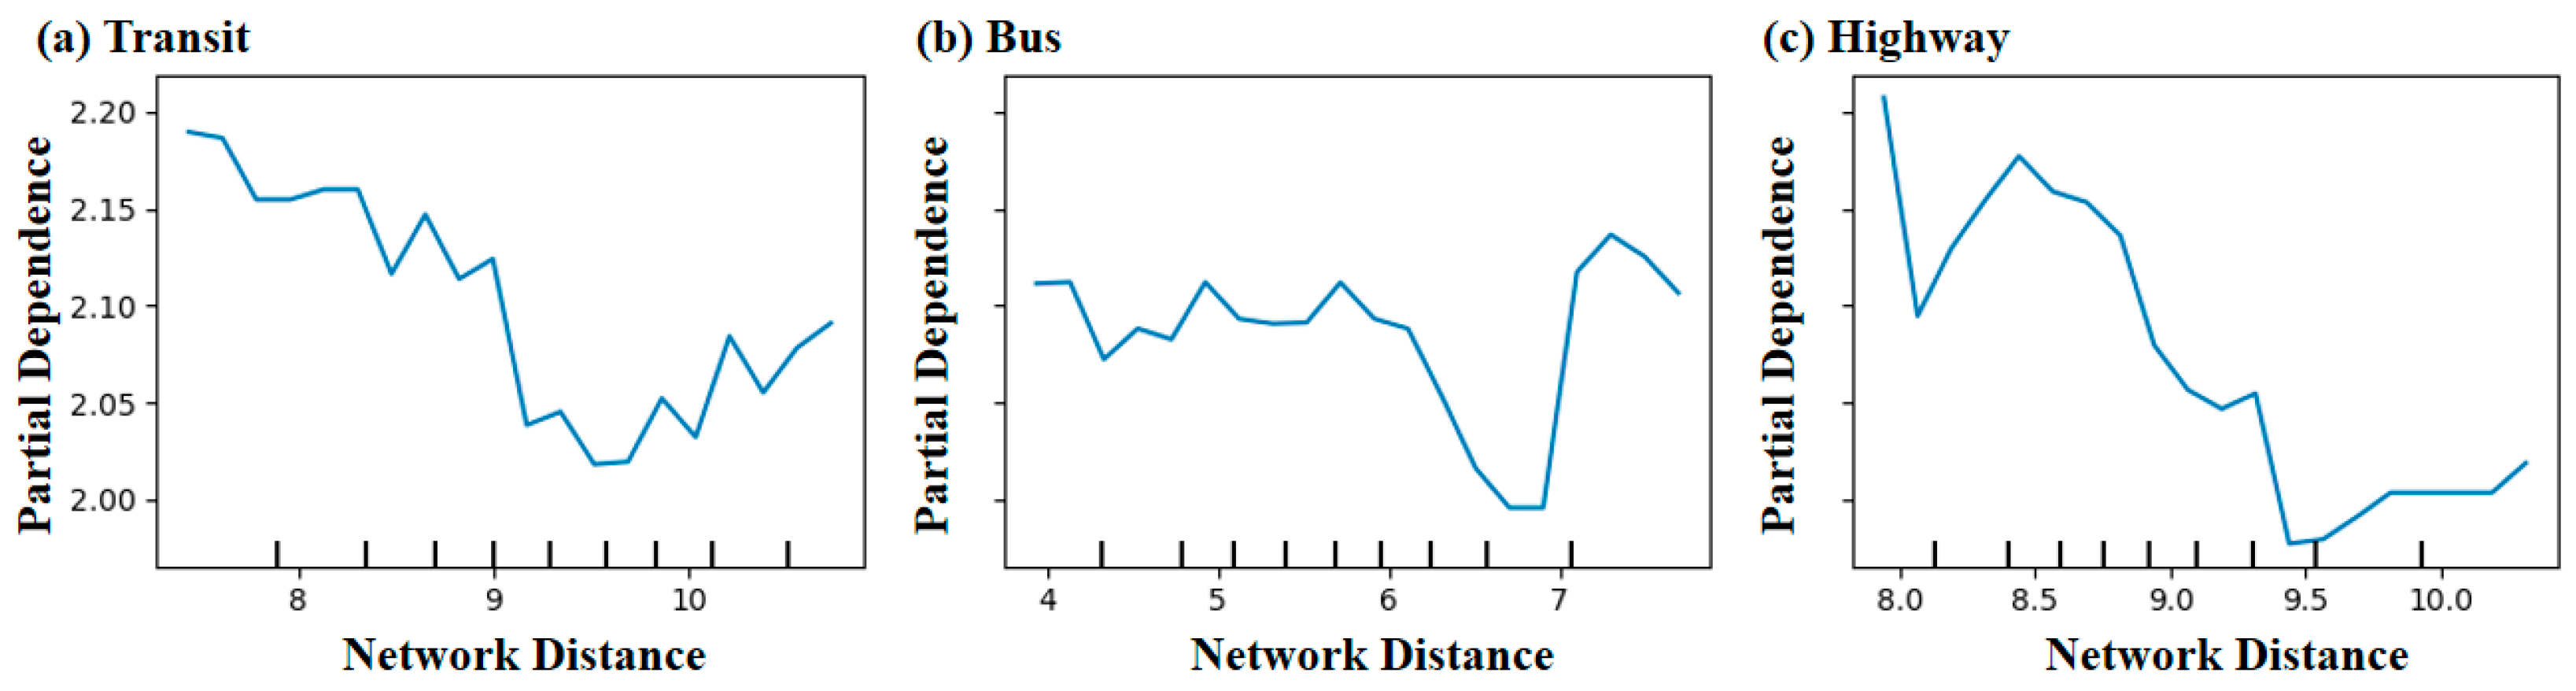
3.4. Nonlinear Associations Between Transportation Accessibility and Network Centrality

The following subsections present the results of PDPs, illustrating the nonlinear associations between network distance to transit, bus, and highway infrastructures and six network centrality indices. The PDP results in Figure 4 indicate that degree centrality initially increases slightly with transit accessibility but starts to decline beyond a certain threshold. This pattern suggests that while proximity to transit infrastructure enhances local connectivity, excessive distance weakens it, reinforcing the presence of a threshold effect. Similarly, degree centrality declines as distance from highways increases, with a steep drop at a specific point. In contrast, the bus network exhibits a relatively stable effect on degree centrality, implying that bus accessibility has a less pronounced impact on regional connectivity.
Figure 5 presents the PDP results for PageRank centrality, revealing a general declining trend for transit accessibility. As distance from transit increases, the relative influence of nodes within the network diminishes, suggesting that accessibility plays a key role in maintaining central nodes. Additionally, the highway PDP demonstrates a sharp decline, reinforcing the idea that highway proximity contributes significantly to maintaining network importance.
Figure 6 illustrates the PDPs for the local clustering coefficient, a measure of network embeddedness and cohesion. Transit accessibility exhibits a gradual decline beyond a certain threshold, indicating that increased distance from transit reduces the likelihood of nodes forming tightly clustered sub-networks. Similarly, bus accessibility follows a consistent downward trend. Highway accessibility demonstrates a clear decreasing trend beyond a certain threshold, highlighting that nodes near highways tend to be more locally embedded, whereas those farther away exhibit reduced cohesion.
PDPs in Figure 7 reveal that harmonic centrality, which captures the efficiency of a node in reaching other nodes, declines sharply with increasing distance from transit infrastructure and highways. For transit, this decline begins beyond a critical threshold, indicating a significant loss of efficiency as accessibility decreases. In contrast, the bus network exhibits a relatively stable effect, with minor variations suggesting a weaker relationship between bus accessibility and harmonic centrality.
Figure 8 presents the PDP results for Katz centrality. Transit accessibility initially increases Katz centrality, peaking at a specific threshold before declining significantly. This suggests that moderate proximity to transit infrastructure enhances network influence, while excessive distance weakens it. The bus network exhibits a steady decline. Highways display a pronounced threshold effect, beyond which Katz centrality sharply drops, reinforcing the importance of highway proximity for regional influence.
Figure 9 illustrates the PDP results for information centrality, which evaluates the role of a node in efficient information transfer within the network. Transit accessibility exhibits a declining trend, with a significant drop beyond a threshold distance. Similarly, bus accessibility reveals a gradual decline with a steeper drop beyond a certain threshold, indicating a critical threshold beyond which network efficiency deteriorates. Highways demonstrate the strongest threshold effect, with a sharp decline beyond a certain distance, suggesting that highway proximity is essential for maintaining network-wide communication efficiency.

4. Discussions

4.1. Network Hierarchy and Structure of South Korea

Consistent with findings from previous studies [37,75], the pronounced concentration of high centrality values in the Seoul Metropolitan Area reaffirms its dominant position as the principal hub for both regional and national mobility. In addition, the emergence of secondary hubs in cities such as Busan, Daegu, and Daejeon reflects a polycentric urban structure that promotes inter-regional connectivity and reduces overdependence on a single metropolitan core.
Beyond reinforcing the findings from the existing literature, this study also reveals the strategic significance of intermediary cities that exhibit high centrality despite having relatively few direct connections. In particular, the results derived from Katz centrality emphasize the critical role of indirect linkages, suggesting that network-wide accessibility is sustained not only by direct connections but also through cumulative, long-range interactions. Such findings highlight the necessity of incorporating measures of indirect access when assessing the functional importance of nodes within the national transportation system.
Furthermore, the spatial heterogeneity observed in harmonic and information centrality underscores the multifaceted nature of an efficient and resilient transportation network. While certain regions enhance network performance by contributing to efficient shortest-path routing, others strengthen overall robustness by providing redundant pathways that can mitigate the impacts of localized disruptions. This balance between efficiency and resilience is vital for ensuring stable and equitable connectivity across regions.

4.2. The Role of Intermediary Transfer Hubs in Spatial Hierarchy

Departing from conventional accessibility research that primarily focuses on metropolitan cores such as Seoul [76], this study underscores the strategic role of intermediary transfer hubs in enhancing regional connectivity and mitigating spatial inequality. Although these hubs may not exhibit the highest levels of direct connectivity, they play a pivotal role in strengthening network centrality by facilitating efficient interregional linkages. By serving as critical junctions within the national transportation system, these intermediary nodes help redistribute mobility flows and reduce the excessive concentration of accessibility benefits in core metropolitan areas. This decentralizing effect not only enhances the structural cohesion of the network but also supports more balanced regional development.
These findings align with the existing literature on urban mobility systems [77,78], which highlights the significance of well-integrated transfer hubs in improving overall network performance. In the context of South Korea—where long-standing disparities between urban cores and peripheral regions persist [41,79]—strengthening such intermediary hubs offers a practical pathway toward more equitable spatial outcomes. Strategic investments in multimodal transfer infrastructure, such as express bus terminals and high-speed rail stations, can enhance the connectivity and functional importance of semi-core regions, thereby elevating their centrality within the broader transportation network.
Looking forward, the emergence of advanced mobility solutions, including urban air mobility (UAM), may present opportunities to further reinforce the role of intermediary cities. Recent studies on vertiport location optimization and UAM-integrated urban design [80,81,82] suggest that these cities could become increasingly important nodes in future hybrid mobility systems. By positioning intermediary hubs as central components of both current and next-generation transport networks, policymakers can advance a more resilient, connected, and spatially inclusive national development strategy.

4.3. Nonlinear Dynamics and Multifacted Impacts of Accessibility on Network Centrality

This analysis reveals that the relationship between transportation accessibility and network centrality is characterized by distinct nonlinear patterns, suggesting the presence of threshold effects that have been largely underexplored in previous studies. In particular, degree centrality exhibits a sharp increase with improved transit accessibility up to a certain threshold, beyond which the marginal gains in centrality diminish. This pattern reflects the saturation point at which additional transit proximity yields limited improvements in nodal influence within the network. Similarly, PageRank centrality shows a steep decline as the distance from highway infrastructure increases, reaffirming the foundational role that expressways play as structural backbones in the national mobility system. In contrast, intercity bus accessibility demonstrates more stable and moderate effects across various centrality indices, implying a dispersed yet consistently supportive role in enhancing connectivity—particularly for regions that may lack access to high-capacity transit infrastructure.
Beyond reaffirming the established association between transportation accessibility and network centrality [16,57,83], this study contributes to the literature by disentangling the heterogeneous effects of different transportation modes across a range of centrality measures. Notably, transit accessibility emerges as the most influential determinant of the local clustering coefficient, highlighting its key role in strengthening intra-regional cohesion and connectivity between proximate nodes.
Intercity bus accessibility, while exhibiting a comparatively weaker influence, nonetheless enhances the continuity of the national network by facilitating linkages in underserved or peripheral areas. Highway accessibility, on the other hand, exerts the most substantial influence across multiple centrality metrics—including degree, PageRank, and harmonic centrality—underscoring its central role in maintaining large-scale spatial integration and supporting the hierarchical structure of the transportation network.

4.4. Policy Implications for Transportation Infrastructure and Spatial Inequality

The findings provide several policy implications. First, enhancing regional transportation networks—especially high-frequency regional rail and intercity bus systems—can significantly improve national network performance by elevating centrality measures such as harmonic and Katz centrality, which reflect systemic resilience and indirect accessibility. These investments have the potential to redistribute connectivity more equitably across regions, especially benefiting peripheral or structurally disadvantaged areas that have experienced sustained population decline and economic stagnation.
Second, while the positive association between transportation accessibility and network centrality underscores the developmental benefits of proximity to major transport infrastructure, this relationship also poses risks. Infrastructure investments that disproportionately concentrate in already-centralized urban cores can exacerbate spatial polarization, reinforcing the dominance of major metropolitan regions such as Seoul and accelerating the marginalization of rural and shrinking cities. This pattern aligns with the core–periphery dynamic often observed in the theory of spatial polarization. As such, infrastructure planning needs to be guided by principles of spatial equity, ensuring that underdeveloped regions are not further excluded from the benefits of regional connectivity.
Third, large-scale infrastructure projects can produce dual outcomes in lagging regions. On one hand, improved accessibility can catalyze economic revitalization; on the other, such projects may bypass smaller towns or reinforce the concentration of resources and services in dominant hubs. To mitigate these unintended consequences, complementary policies—such as the development of local feeder networks, regional multimodal transfer hubs, and last-mile connectivity—should be implemented to ensure that smaller municipalities are meaningfully integrated into the broader mobility system.
Fourth, the expansion of highway networks offers targeted potential to reconnect shrinking cities and rural areas, particularly in regions that lack robust transit options. However, these investments must be accompanied by land use coordination and environmental safeguards to prevent negative externalities such as sprawl, ecological degradation, and infrastructure redundancy. A strategic integration of transportation planning with broader regional development goals is critical to promote long-term territorial cohesion.
Finally, future mobility strategies must be adaptive and forward-looking, particularly as emerging technologies reshape intercity connectivity. The development of multimodal mobility corridors that integrate traditional modes with novel services—such as UAM—could enhance accessibility and resilience for intermediary and declining regions. Planning frameworks should prioritize inclusivity and balanced development, ensuring that innovation in mobility infrastructure does not amplify existing inequalities but rather contributes to a more spatially equitable and sustainable national development strategy.

4.5. Limitations of This Study

Despite its contributions, this study has several limitations. First, the analysis is based on a cross-sectional dataset, limiting the ability to infer causal relationships over time. A longitudinal approach incorporating temporal dynamics would provide deeper insights into how transportation accessibility influences network centrality across different periods. Second, while this study controls for spatial dependencies, it does not fully account for other socio-economic factors—such as land use patterns, economic activity, and demographic shifts—that may also shape network centrality. Incorporating these factors in future research could provide a more comprehensive understanding of regional mobility patterns. Lastly, although this study centers on South Korea, its insights hold broader relevance. While the core mechanism—where enhanced accessibility increases regional network centrality—may be widely applicable, context-specific factors such as governance capacity, population distribution, and planning regimes should be accounted for.

4.6. Future Research Direcitons

Future research can build upon this study in several key directions. First, incorporating longitudinal data would facilitate dynamic analyses of how transportation investments influence regional connectivity over time. Second, integrating additional socio-economic and land use variables could provide a more comprehensive understanding of the multifaceted drivers of network centrality. Third, combining network analysis with agent-based modeling or simulation techniques may offer deeper insights into the interplay between transportation accessibility, mobility behavior, and regional development trajectories. Fourth, future studies should explore the implications of emerging mobility technologies—particularly UAM vertiport—on regional network structures. Lastly, comparative cross-national research could offer valuable contributions to the evolving discourse on transportation infrastructure and regional equity.

5. Conclusions

This study examines the relationship between intercity transportation accessibility and regional network centrality in South Korea. Specifically, it evaluates how access to regional transit, intercity buses, and highways influences the structural positioning of regions within transportation networks. We employ both econometric models—such as COR, OLS, and SLM—and ML techniques, including XGB with PBFI and PDP. This study contributes by (1) advancing network theory in urban and transportation planning through the introduction of a novel analytical framework, (2) offering empirical evidence on the influence of transit, buses, and highways in shaping regional connectivity and spatial structure, and (3) providing policy recommendations for optimizing transportation networks, mitigating regional inequalities, and enhancing infrastructure planning.

Author Contributions

Conceptualization, S.L., J.J., K.C. and J.I.; methodology, S.L., J.J. and K.C.; software, S.L., J.J. and J.I.; validation, K.C. and J.I.; formal analysis, S.L. and J.J.; investigation, S.L. and J.J.; data curation, J.J. and J.I.; writing—original draft preparation, S.L. and J.J.; writing—review and editing, K.C. and J.I.; visualization, S.L.; supervision, J.J. and J.I.; project administration, K.C.; funding acquisition, K.C. All authors have read and agreed to the published version of the manuscript.

Funding

This research was supported by the Ministry of Trade, Industry, and Energy in the Republic of Korea (grant number: P0020670, Research Title: Establishing a Demonstration Infrastructure of Autonomous Cargo Transportation Service for Commercial Vehicles in Saemangeum).

Data Availability Statement

The data presented in this study are available on request from the corresponding author.

Conflicts of Interest

Authors Sangwan Lee, Jeongbae Jeon, Kuk Cho and Junhyuck Im were employed by the company Korea Land and Geospatial Informatix Corporation. The remaining authors declare that the research was conducted in the absence of any commercial or financial relationships that could be construed as a potential conflict of interest.

References

  1. Bettencourt, L.M.A. Introduction to Urban Science: Evidence and Theory of Cities as Complex Systems; MIT Press: Cambridge, MA, USA, 2021; ISBN 978-0-262-04600-8. [Google Scholar]
  2. Anas, A.; Arnott, R.; Small, K.A. Urban Spatial Structure. J. Econ. Lit. 1998, 36, 1426–1464. [Google Scholar]
  3. Hou, Q.; Li, S.-M. Transport Infrastructure Development and Changing Spatial Accessibility in the Greater Pearl River Delta, China, 1990–2020. J. Transp. Geogr. 2011, 19, 1350–1360. [Google Scholar] [CrossRef]
  4. Bardaka, E.; Delgado, M.S.; Florax, R.J.G.M. A Spatial Multiple Treatment/Multiple Outcome Difference-in-Differences Model with an Application to Urban Rail Infrastructure and Gentrification. Transp. Res. Part A Policy Pract. 2019, 121, 325–345. [Google Scholar] [CrossRef]
  5. Rode, P.; Floater, G.; Thomopoulos, N.; Docherty, J.; Schwinger, P.; Mahendra, A.; Fang, W. Accessibility in Cities: Transport and Urban Form. In Disrupting Mobility: Impacts of Sharing Economy and Innovative Transportation on Cities; Meyer, G., Shaheen, S., Eds.; Springer International Publishing: Cham, Switzerland, 2017; pp. 239–273. ISBN 978-3-319-51602-8. [Google Scholar]
  6. Zhou, H.; Gao, H. The Impact of Urban Morphology on Urban Transportation Mode: A Case Study of Tokyo. Case Stud. Transp. Policy 2020, 8, 197–205. [Google Scholar] [CrossRef]
  7. Liu, X.; Derudder, B.; Wu, K. Measuring Polycentric Urban Development in China: An Intercity Transportation Network Perspective. Reg. Stud. 2016, 50, 1302–1315. [Google Scholar] [CrossRef]
  8. Levine, J.; Grengs, J.; Merlin, L.A. From Mobility to Accessibility: Transforming Urban Transportation and Land-Use Planning; Cornell University Press: Ithaca, NY, USA, 2019; ISBN 978-1-5017-1610-2. [Google Scholar]
  9. Dadhich, P.N.; Hanaoka, S. Spatial Investigation of the Temporal Urban Form to Assess Impact on Transit Services and Public Transportation Access. Geo-Spat. Inf. Sci. 2012, 15, 187–197. [Google Scholar] [CrossRef]
  10. Gil, J. Analyzing the Configuration of Multimodal Urban Networks. Geogr. Anal. 2014, 46, 368–391. [Google Scholar] [CrossRef]
  11. Vickerman, R.; Spiekermann, K.; Wegener, M. Accessibility and Economic Development in Europe. Reg. Stud. 1999, 33, 1–15. [Google Scholar] [CrossRef]
  12. Yang, J.; Lee, S.; Im, J.; Cho, K.; Park, H. Perceptual Disparities in Transportation Accessibility, Neighborhood Quality, and Satisfaction across Metro, Urban, and Rural Areas. Sens. Mater. 2024, 36, 3899. [Google Scholar] [CrossRef]
  13. Câmara, P.; and Banister, D. Spatial Inequalities in the Provision of Public Transport in Latin American Cities. Transp. Rev. 1993, 13, 351–373. [Google Scholar] [CrossRef]
  14. Chang, Z.; Chen, J.; Li, W.; Li, X. Public Transportation and the Spatial Inequality of Urban Park Accessibility: New Evidence from Hong Kong. Transp. Res. Part D Transp. Environ. 2019, 76, 111–122. [Google Scholar] [CrossRef]
  15. Israel, E.; Frenkel, A. Social Justice and Spatial Inequality: Toward a Conceptual Framework. Prog. Hum. Geogr. 2017, 42, 030913251770296. [Google Scholar] [CrossRef]
  16. Lee, S. Literature Review on High-Speed Rail and Regional Uneven Development. J. Korea Plan. Assoc. 2023, 58, 5–18. [Google Scholar] [CrossRef]
  17. Quiroz Villanueva, M.J.; Guglielmi, F.; De Fabiis, F.; Coppola, P. Social and Economic Impacts of Transportation Multi-Modal and Multi-Service Hub Development. Sustainability 2025, 17, 1767. [Google Scholar] [CrossRef]
  18. Panagiotopoulos, G.; Kaliampakos, D. Accessibility and Spatial Inequalities in Greece. Appl. Spat. Anal. 2019, 12, 567–586. [Google Scholar] [CrossRef]
  19. Modai-Snir, T.; van Ham, M. Neighbourhood Change and Spatial Polarization: The Roles of Increasing Inequality and Divergent Urban Development. Cities 2018, 82, 108–118. [Google Scholar] [CrossRef]
  20. Wei, Y.D.; Wu, Y.; Liao, F.H.; Zhang, L. Regional Inequality, Spatial Polarization and Place Mobility in Provincial China: A Case Study of Jiangsu Province. Appl. Geogr. 2020, 124, 102296. [Google Scholar] [CrossRef]
  21. Jang, S.; An, Y. Influence of Centrality Indices of Urban Railway Stations: Social Network Analysis of Transit Ridership and Travel Distance. J. Reg. City Plan. 2023, 33, 323–344. [Google Scholar] [CrossRef]
  22. Piraveenan, M.; Saripada, N.B. Transportation Centrality: Quantifying the Relative Importance of Nodes in Transportation Networks Based on Traffic Modeling. IEEE Access 2023, 11, 142214–142234. [Google Scholar] [CrossRef]
  23. Pflieger, G.; Rozenblat, C. Introduction. Urban Networks and Network Theory: The City as the Connector of Multiple Networks. Urban Stud. 2010, 47, 2723–2735. [Google Scholar] [CrossRef]
  24. Fleming, D.K.; Hayuth, Y. Spatial Characteristics of Transportation Hubs: Centrality and Intermediacy. J. Transp. Geogr. 1994, 2, 3–18. [Google Scholar] [CrossRef]
  25. Joseph, A.; Chen, G. Network Centrality and Key Economic Indicators: A Case Study. In Network Models in Economics and Finance; Kalyagin, V.A., Pardalos, P.M., Rassias, T.M., Eds.; Springer International Publishing: Cham, Switzerland, 2014; pp. 159–180. ISBN 978-3-319-09683-4. [Google Scholar]
  26. Wang, H.; Zhao, Y.; Dang, B.; Han, P.; Shi, X. Network Centrality and Innovation Performance: The Role of Formal and Informal Institutions in Emerging Economies. J. Bus. Ind. Mark. 2019, 34, 1388–1400. [Google Scholar] [CrossRef]
  27. Burger, M.J.; Meijers, E.J. Agglomerations and the Rise of Urban Network Externalities. Pap. Reg. Sci. 2016, 95, 5–16. [Google Scholar] [CrossRef]
  28. Tsiotas, D.; Polyzos, S. Introducing a New Centrality Measure from the Transportation Network Analysis in Greece. Ann. Oper. Res. 2015, 227, 93–117. [Google Scholar] [CrossRef]
  29. Rodrigues, F.A. Network Centrality: An Introduction. In A Mathematical Modeling Approach from Nonlinear Dynamics to Complex Systems; Macau, E.E.N., Ed.; Springer International Publishing: Cham, Switzerland, 2019; pp. 177–196. ISBN 978-3-319-78512-7. [Google Scholar]
  30. Ana, V. Accessibility Concepts and Indicators in Transportation Strategic Planning Issues: Theoretical Framework and Literature Review. Logist. Sustain. Transp. 2016, 7, 58–67. [Google Scholar]
  31. Chakrabarti, S.; Kushari, T.; Mazumder, T. Does Transportation Network Centrality Determine Housing Price? J. Transp. Geogr. 2022, 103, 103397. [Google Scholar] [CrossRef]
  32. Saif, M.A.; Zefreh, M.M.; Torok, A. Public Transport Accessibility: A Literature Review. Period. Polytech. Transp. Eng. 2019, 47, 36–43. [Google Scholar] [CrossRef]
  33. Lee, S. Measuring the Influence of Transit Accessibility on Housing and Transportation Expenditures in the U.S.: A Propensity Score Matching Approach. Case Stud. Transp. Policy 2023, 14, 101092. [Google Scholar] [CrossRef]
  34. He, S.Y. Regional Impact of Rail Network Accessibility on Residential Property Price: Modelling Spatial Heterogeneous Capitalisation Effects in Hong Kong. Transp. Res. Part A Policy Pract. 2020, 135, 244–263. [Google Scholar] [CrossRef]
  35. Zhong, C.; Arisona, S.M.; Huang, X.; Batty, M.; Schmitt, G. Detecting the Dynamics of Urban Structure through Spatial Network Analysis. Int. J. Geogr. Inf. Sci. 2014, 28, 2178–2199. [Google Scholar] [CrossRef]
  36. Ding, R.; Ujang, N.; Hamid, H.B.; Manan, M.S.A.; Li, R.; Albadareen, S.S.M.; Nochian, A.; Wu, J. Application of Complex Networks Theory in Urban Traffic Network Researches. Netw. Spat. Econ. 2019, 19, 1281–1317. [Google Scholar] [CrossRef]
  37. Lee, S.; Im, J.; Cho, K. Understanding Spatial Inequalities and Stratification in Transportation Accessibility to Social Infrastructures in South Korea: Multi-Dimensional Planning Insights. Sci. Rep. 2024, 14, 18445. [Google Scholar] [CrossRef] [PubMed]
  38. Lee, S. Spatial and Socioeconomic Inequalities in Accessibility to Healthcare Services in South Korea. Healthcare 2022, 10, 2049. [Google Scholar] [CrossRef]
  39. Kim, H.; Sultana, S. The Impacts of High-Speed Rail Extensions on Accessibility and Spatial Equity Changes in South Korea from 2004 to 2018. J. Transp. Geogr. 2015, 45, 48–61. [Google Scholar] [CrossRef]
  40. Kim, H.; Lee, K.; Park, J.S.; Song, Y. Transit Network Expansion and Accessibility Implications: A Case Study of Gwangju Metropolitan Area, South Korea. Res. Transp. Econ. 2018, 69, 544–553. [Google Scholar] [CrossRef]
  41. Lee, S.; Ock, Y.; Kim, M.; Schrock, G. The Regional Uneven Development and the State Intervention to Reshape the Spatial Hierarchy. Int. J. Reg. Dev. 2021, 8, 1. [Google Scholar] [CrossRef]
  42. van Geenhuizen, M. Interconnectivity of Transport Networks: A Conceptual and Empirical Exploration. Transp. Plan. Technol. 2000, 23, 199–213. [Google Scholar] [CrossRef]
  43. Alstadt, B.; Weisbrod, G.; Cutler, D. Relationship of Transportation Access and Connectivity to Local Economic Outcomes: Statistical Analysis. Transp. Res. Rec. 2012, 2297, 154–162. [Google Scholar] [CrossRef]
  44. Bergamini, E.; Crescenzi, P.; D’angelo, G.; Meyerhenke, H.; Severini, L.; Velaj, Y. Improving the Betweenness Centrality of a Node by Adding Links. ACM J. Exp. Algorithmics 2018, 23, 1.5:1–1.5:32. [Google Scholar] [CrossRef]
  45. Evans, T.S.; Chen, B. Linking the Network Centrality Measures Closeness and Degree. Commun. Phys. 2022, 5, 172. [Google Scholar] [CrossRef]
  46. van der Grinten, A.; Angriman, E.; Meyerhenke, H. Scaling up Network Centrality Computations—A Brief Overview. It-Inf. Technol. 2020, 62, 189–204. [Google Scholar] [CrossRef]
  47. Lin, H.; Xia, Y.; Li, X.; Gao, X. A Routing Strategy for Spatial Networks Based on Harmonic Centrality. Front. Phys. 2023, 11, 1203665. [Google Scholar] [CrossRef]
  48. Zhan, J.; Gurung, S.; Parsa, S.P.K. Identification of Top-K Nodes in Large Networks Using Katz Centrality. J. Big Data 2017, 4, 16. [Google Scholar] [CrossRef]
  49. Zhang, J.; Luo, Y. Degree Centrality, Betweenness Centrality, and Closeness Centrality in Social Network. In Proceedings of the 2017 2nd International Conference on Modelling, Simulation and Applied Mathematics (MSAM2017), Bangkok, Thailand, 26–27 March 2017; Atlantis Press: Bangkok, Thailand, 2017. [Google Scholar]
  50. Zhang, P.; Wang, T.; Yan, J. PageRank Centrality and Algorithms for Weighted, Directed Networks. Phys. A Stat. Mech. Its Appl. 2022, 586, 126438. [Google Scholar] [CrossRef]
  51. Zhao, X.; Liu, F.; Wang, J.; Li, T. Evaluating Influential Nodes in Social Networks by Local Centrality with a Coefficient. ISPRS Int. J. Geo-Inf. 2017, 6, 35. [Google Scholar] [CrossRef]
  52. Rochat, Y. Closeness Centrality Extended To Unconnected Graphs: The Harmonic Centrality Index; University of Lausanne: Lausanne, Switzerland, 2009. [Google Scholar]
  53. Sharkey, K.J. A Control Analysis Perspective on Katz Centrality. Sci. Rep. 2017, 7, 17247. [Google Scholar] [CrossRef]
  54. Fortunato, S.; Latora, V.; Marchiori, M. Method to Find Community Structures Based on Information Centrality. Phys. Rev. E 2004, 70, 056104. [Google Scholar] [CrossRef]
  55. Beaudoin, J.; Lin Lawell, C.-Y.C. The Effects of Public Transit Supply on the Demand for Automobile Travel. J. Environ. Econ. Manag. 2018, 88, 447–467. [Google Scholar] [CrossRef]
  56. Cervero, R.; Kang, C.D. Bus Rapid Transit Impacts on Land Uses and Land Values in Seoul, Korea. Transp. Policy 2011, 18, 102–116. [Google Scholar] [CrossRef]
  57. Liu, C.; Duan, D. Spatial Inequality of Bus Transit Dependence on Urban Streets and Its Relationships with Socioeconomic Intensities: A Tale of Two Megacities in China. J. Transp. Geogr. 2020, 86, 102768. [Google Scholar] [CrossRef]
  58. Wang, C.; Park, J. A Multi-Level Analysis of Bus Ridership in Buffalo, New York. ISPRS Int. J. Geo-Inf. 2024, 13, 443. [Google Scholar] [CrossRef]
  59. Wang, M.; Wang, H.; Zheng, H. A Mini Review of Node Centrality Metrics in Biological Networks. Int. J. Netw. Dyn. Intell. 2022, 1, 99–110. [Google Scholar] [CrossRef]
  60. Asuero, A.G.; Sayago, A.; and González, A.G. The Correlation Coefficient: An Overview. Crit. Rev. Anal. Chem. 2006, 36, 41–59. [Google Scholar] [CrossRef]
  61. Leng, L.; Zhang, T.; Kleinman, L.; Zhu, W. Ordinary Least Square Regression, Orthogonal Regression, Geometric Mean Regression and Their Applications in Aerosol Science. J. Phys. Conf. Ser. 2007, 78, 012084. [Google Scholar] [CrossRef]
  62. Anselin, L. Spatial Econometrics. In A Companion to Theoretical Econometrics; Baltagi, B.H., Ed.; Blackwell Publishing Ltd.: Malden, MA, USA, 2003; pp. 310–330. ISBN 978-0-470-99624-9. [Google Scholar]
  63. Chang, Y.-C.; Chang, K.-H.; Wu, G.-J. Application of eXtreme Gradient Boosting Trees in the Construction of Credit Risk Assessment Models for Financial Institutions. Appl. Soft Comput. 2018, 73, 914–920. [Google Scholar] [CrossRef]
  64. Lee, S.; Yang, J.; Cho, K.; Cho, D. The Influence of Transportation Accessibility on Traffic Volumes in South Korea: An Extreme Gradient Boosting Approach. Urban Sci. 2023, 7, 91. [Google Scholar] [CrossRef]
  65. Ding, C.; Cao, X.; Næss, P. Applying Gradient Boosting Decision Trees to Examine Non-Linear Effects of the Built Environment on Driving Distance in Oslo. Transp. Res. Part A Policy Pract. 2018, 110, 107–117. [Google Scholar] [CrossRef]
  66. Dong, W.; Wang, N.; Dong, Y.; Cao, J. Examining the Nonlinear and Interactive Effects of Built Environment Characteristics on Travel Satisfaction. J. Transp. Geogr. 2025, 123, 104111. [Google Scholar] [CrossRef]
  67. Murdoch, W.J.; Singh, C.; Kumbier, K.; Abbasi-Asl, R.; Yu, B. Definitions, Methods, and Applications in Interpretable Machine Learning. Proc. Natl. Acad. Sci. USA 2019, 116, 22071–22080. [Google Scholar] [CrossRef]
  68. Lee, S. Transportation Mode Choice Behavior in the Era of Autonomous Vehicles: The Application of Discrete Choice Modeling and Machine Learning. Ph.D. Thesis, Portland State University, Portland, OR, USA, 2022. [Google Scholar]
  69. Bhavsar, P.; Safro, I.; Bouaynaya, N.; Polikar, R.; Dera, D. Machine Learning in Transportation Data Analytics. In Data Analytics for Intelligent Transportation Systems; Elsevier: Amsterdam, The Netherlands, 2017; pp. 283–307. ISBN 978-0-12-809715-1. [Google Scholar]
  70. Bi, Q.; Goodman, K.E.; Kaminsky, J.; Lessler, J. What Is Machine Learning? A Primer for the Epidemiologist. Am. J. Epidemiol. 2019, 188, 2222–2239. [Google Scholar] [CrossRef]
  71. Malakouti, S.M.; Menhaj, M.B.; Suratgar, A.A. The Usage of 10-Fold Cross-Validation and Grid Search to Enhance ML Methods Performance in Solar Farm Power Generation Prediction. Clean. Eng. Technol. 2023, 15, 100664. [Google Scholar] [CrossRef]
  72. Shams, M.Y.; Elshewey, A.M.; El-kenawy, E.-S.M.; Ibrahim, A.; Talaat, F.M.; Tarek, Z. Water Quality Prediction Using Machine Learning Models Based on Grid Search Method. Multimed. Tools Appl. 2024, 83, 35307–35334. [Google Scholar] [CrossRef]
  73. Lee, S. Relationships between Transportation Expenditures and Built Environment in the United States: Insights from Interpretable Machine-Learning Approach. J. Plan. Educ. Res. 2024. [Google Scholar] [CrossRef]
  74. Huang, N.; Lu, G.; Xu, D. A Permutation Importance-Based Feature Selection Method for Short-Term Electricity Load Forecasting Using Random Forest. Energies 2016, 9, 767. [Google Scholar] [CrossRef]
  75. Lee, Y.; Seo, D. Identifying Relationship between Regional Centrality and POI Facilities: A Case Study of Seoul Metropolitan Area. ISPRS Int. J. Geo-Inf. 2024, 13, 12. [Google Scholar] [CrossRef]
  76. Kang, C.-D. The Effects of Spatial Accessibility and Centrality to Land Use on Walking in Seoul, Korea. Cities 2015, 46, 94–103. [Google Scholar] [CrossRef]
  77. O’Connor, K. Global City Regions and the Location of Logistics Activity. J. Transp. Geogr. 2010, 18, 354–362. [Google Scholar] [CrossRef]
  78. Yuan, G.; Sun, L.; Kong, D.; Bai, Z.; Shao, J. Supernetwork Perspective on Studying the Method of Identifying the Important Urban Transport Hub. J. Highw. Transp. Res. Dev. (Engl. Ed.) 2023, 17, 82–91. [Google Scholar] [CrossRef]
  79. Chun, Y.; Kim, K. Temporal Changes in the Urban System in South Korea. Front. Sustain. Cities 2022, 4, 1013465. [Google Scholar] [CrossRef]
  80. Zhao, Y.; Feng, T. Commuter Choice of UAM-Friendly Neighborhoods. Transp. Res. Part A Policy Pract. 2025, 192, 104338. [Google Scholar] [CrossRef]
  81. Coppola, P.; De Fabiis, F.; Silvestri, F. Urban Air Mobility Demand Forecasting: Modeling Evidence from the Case Study of Milan (Italy). Eur. Transp. Res. Rev. 2025, 17, 2. [Google Scholar] [CrossRef]
  82. Jiang, Y.; Li, Z.; Wang, Y.; Xue, Q. Vertiport Location for eVTOL Considering Multidimensional Demand of Urban Air Mobility: An Application in Beijing. Transp. Res. Part A Policy Pract. 2025, 192, 104353. [Google Scholar] [CrossRef]
  83. Liu, T.-Y. Spatial Structure Convergence of China’s Transportation System. Res. Transp. Econ. 2019, 78, 100768. [Google Scholar] [CrossRef]
Figure 1. Characteristics of study area (South Korea).
Land 14 00873 g001
Figure 2. Spatial distributions of the transportation accessibility of South Korea.
Land 14 00873 g002
Figure 3. Spatial distributions of the network centrality indices of South Korea.
Land 14 00873 g003
Figure 4. Partial dependence plots on degree centrality Index.
Land 14 00873 g004
Figure 5. Partial dependence plots on PageRank centrality index.
Land 14 00873 g005
Figure 6. Partial dependence plots on local clustering coefficient centrality index.
Land 14 00873 g006
Figure 7. Partial dependence plots on harmonic centrality index.
Land 14 00873 g007
Figure 8. Partial dependence plots on Katz centrality index.
Land 14 00873 g008
Figure 9. Partial dependence plots on information centrality index.
Land 14 00873 g009
Table 2. Descriptive statistics of independent variables.
NameDescriptionMeanS. D.
TransitLog-transformed network distance, in meters, from the centroid of each EMD to the nearest regional transit station, including a high-speed rail (KTX) station9.201.00
BusLog-transformed network distance, in meters, from the centroid of each EMD to the nearest intercity bus station5.721.11
HighwayLog-transformed network distance, in meters, from the centroid of each EMD to the nearest highway interchange9.010.77
Table 3. Equations of the six network centrality indices.
IndicesEquation
Degree
Centrality
s t o t a l i = s i n i + s o u t i = j w j i + j w i j
where   s total i   represents   the   weighted   total   degree   of   node   i ,   s in i   represents   the   weighted   in - degree   of   node   i   ( the   sum   of   weights   of   incoming   edges ) ,   s out i   represents   the   weighted   out - degree   of   node   i   ( the   sum   of   weights   of   outgoing   edges ) ,   w j i   is   the   edge   weight   from   node   j   to   node   i ,   and   w i j   is   the   edge   weight   from   node   i   to   node   j .
PageRank
Centrality
P R i = 1 d N + d j M i P R j w j i k w j k
where   P R i   represents   the   PageRank   value   of   node   i ,   d   is   the   damping   factor   ( typically   0.85 ) ,   N   is   the   total   number   of   nodes   in   the   graph ,   M i   is   the   set   of   nodes   that   have   links   ( edges )   coming   into   node   i ,   w j i   is   the   edge   weight   from   node   j   to   node   i ,   and   k w j k   is   the   sum   of   weights   of   all   edges   going   out   from   node   j .
Local
Clustering
Coefficient
C w i = 1 s i k i 1 j , h w i j + w i h 2 a i j a i h a j h
where   C w i   represents   the   weighted   local   clustering   coefficient   of   node   i ,   s i   is   the   strength   of   node   i   ( the   sum   of   all   connected   edge   weights ) ,   k i   is   the   degree   of   node   i ,   a i j   is   an   adjacency   matrix   element   ( 1   if   there   is   a   connection   between   nodes   i   and   j ,   0   if   not ) ,   w i j   is   the   edge   weight   between   nodes   i   and   j ,   and   a i j a i h a j h   indicates   whether   nodes   i ,   j ,   and   h form a triangle.
Harmonic Centrality H i = j i 1 d w i , j
where   H i   represents   the   harmonic   centrality   value   of   node   i ,   d i , j   is   the   shortest   path   distance   from   node   i   to   node   j ,   and   the   sum   is   calculated   for   all   j nodes ,   excluding   node   i .   If   there   is   no   path   from   node   i   to   node   j ,   1 d i , j is treated as 0.
Katz
Centrality
I i = j = 1 n 1 D i j 1
where   I i   represents   the   information   centrality   value   of   node   i ,   D i j   is   the   information   distance   between   nodes   i   and   j   ( calculated   as   D i j = R i i + R j j 2 R i j ) ,   and   R is the resistance matrix of the network.
Information Centrality K i = k = 1 j α k A k j i
where   K i   represents   the   Katz   centrality   value   of   node   i ,   α   is   the   attenuation   factor   ( typically   α < 1 / λ m a x ) ,   λ m a x   is   the   largest   eigenvalue   of   the   adjacency   matrix   A ,   A   is   the   adjacency   matrix   of   the   network ,   A k j i   is   the   j , i element   of   the   k - th   power   of   matrix   A ,   k   is   the   path   length ,   and   the   sum   is   calculated   for   all   k 1 up to infinity.
Table 4. Model performance comparisons using R-Squared.
ModelsDegreePageRankLocalHarmonicInformationKatz
RF0.2550.3530.2890.1180.2500.193
GB0.2820.4800.2950.1770.2660.207
XGB0.2920.4850.3040.2090.2680.215
Table 5. Hyper-parameters of optimal XGB algorithms.
ParametersDegreePageRankLocalHarmonicInformationKatz
LR0.10.010.10.010.10.1
MD353533
NE50200501005050
SS0.80.80.80.80.80.9
Hyper-parameters: number of estimators (NE), maximum depth (MD), learning rate (LR), and sub-sample (SS).
Table 6. Results of correlation, ordinary least squares regression, and spatial lag models.
ModelsDegreePageRankLocalHarmonicKatzInformation
Effect of Regional Transit Accessibility
COR−0.542 ***−0.213 ***−0.541 ***−1.922 **−0.556 ***−0.610 ***
OLS−0.118 ***−0.042 ***−0.176 ***−0.029 ***−0.064 ***−0.056 ***
SLM−0.033 ***−0.023 **−0.025 ***−0.016 ***−0.018 ***−0.003 *
Effect of Intercity Bus Accessibility
COR−0.470 ***−0.184 **−0.570 **−1.438 **−0.673 **−0.693 **
OLS−0.055 ***−0.020 ***−0.144 ***−0.010 ***−0.076 ***−0.059 ***
SLM−0.017 ***−0.018 **−0.033 ***−0.005 **−0.036 ***−0.005 *
Effect of Highway Accessibility
COR−0.461 **−0.153 **−0.286 **0.983 **−0.492 **−0.606 **
OLS−0.216 ***−0.055 ***−0.110 ***−0.018 ***−0.140 ***−0.157 ***
SLM−0.092 ***−0.045 ***−0.004 *−0.006 **−0.063 ***−0.025 ***
Models: correlation (COR), ordinary least squares regression (OLS) model, and spatial lag model (SLM), Significance level: * p < 0.1; ** p < 0.05; *** p < 0.01.
Table 7. Permutation-based feature importance results.
VariablesDegreePageRankLocalHarmonicKatzInformation
Transit0.4100.3430.5330.4090.2290.349
Bus0.0350.1010.2720.0290.2450.150
Highway0.5550.5560.1950.5620.5260.501
Disclaimer/Publisher’s Note: The statements, opinions and data contained in all publications are solely those of the individual author(s) and contributor(s) and not of MDPI and/or the editor(s). MDPI and/or the editor(s) disclaim responsibility for any injury to people or property resulting from any ideas, methods, instructions or products referred to in the content.

