Article

Measuring and Modeling Soil Carbon Changes on Dutch Dairy Farms

1
Wageningen Plant Research, Droevendaalsesteeg 1, 6708 PB Wageningen, The Netherlands
2
Agro-Innovation Centre De Marke, Roessinkweg 2, 7255 PC Hengelo, The Netherlands
3
Louis Bolk Institute, Kosterijland 3-5, 3981 AJ Bunnik, The Netherlands
*
Author to whom correspondence should be addressed.
Land 2025, 14(4), 874; https://doi.org/10.3390/land14040874
Submission received: 18 March 2025 / Revised: 10 April 2025 / Accepted: 11 April 2025 / Published: 16 April 2025

Abstract

:
Soil carbon sequestration is one of the pathways for the dairy sector to mitigate climate change. Soil carbon measures have been reviewed extensively, including estimates of their impacts on regional or national scales. Eventually, these measures are to be implemented by the farmers themselves, justifying an assessment at farm and field level. Here, we used soil and management data from 96 fields on nine dairy farms to quantify annual stock changes under current management and the effect of several carbon measures on soil carbon sequestration in relation to farm configurations. The fields were in use as permanent grassland or grass-arable rotation with forage maize or other crops. We compared the observed changes in the soil layer of 0–25 cm with the RothC simulated changes, and we also simulated the effect of carbon measures on soil carbon stocks. We found a moderate (R2 = 0.30) relation between simulated and measured soil carbon changes. Factors that contribute to the uncertainties are the estimates of field-specific carbon inputs from crop residues and manures, especially for farms that temporarily exchange land with other farmers. The current standard agronomic soil sampling program is unable to reliably detect soil carbon changes at a farm or field level. The annual changes in simulated soil carbon were negatively related to the initials carbon stocks, which has important implications for the potential of additional carbon storage. Therefore, we propose an indicator that expresses the current soil carbon stock in relation to the location-specific maximal achievable carbon stock for permanent grassland that receives an equivalent of 170 kg nitrogen per ha per year from animal manure. This can be used to compare farms and indicate whether a farmer’s focus should be on additional carbon storage or the protection of existing stocks. The simulation of carbon measures showed that the proportion of grassland is key in soil carbon storage.

1. Introduction

Soil carbon sequestration is important for land-based agriculture to mitigate climate change by capturing atmospheric carbon dioxide (CO2) [1]. Following the Paris Climate Agreement (2015), policies to stimulate the uptake of soil carbon sequestration practices are being developed by supranational or national governments [2]. The European Union (EU) began developing its climate policy in the 1990s, and now, soil carbon is addressed as part of sustainable soil management in the Soil Deal for Europe [3] and the Green Deal [4,5]. The recent Climate Agreement in the Netherlands [6] includes a goal for mineral soils relating to a 0.5 Mt CO2 additional annual reduction by 2030 from carbon sequestration, compared to a total reduction of 3.5 Mt CO2 for the agricultural sector as a whole. Dairy farming organizations in the Netherlands also recognize the role of carbon farming and have adopted a dairy sector goal of 0.2 Mt CO2 additional soil carbon storage by 2030 [7]. These sector initiatives include plans for accountability at the farm level; however, the feasibility of those plans needs to be further explored. Irrespective of the reporting level (national, sector, or farm), it is evident that measures are implemented by the farmers themselves, justifying an assessment at the farm and field level. Despite the complex landscape of carbon farming incentive schemes, dairy farmers are interested in implementing different carbon farming activities if it contributes to their income [8]. Soil carbon measures have been reviewed extensively, including estimates of their impact on regional or national scales [9,10]. A recent study for mineral soils in the Netherlands [11] modeled a potential 0.9 Mt CO2 annual additional soil sequestration compared to the reference year 2017. For the dairy sector, the most promising measures are increasing the proportion of permanent grassland and the use of green manure crops in forage maize crops. Measures with relatively lower impacts include the application of farm yard manure or compost and strip seeding forage maize into a grass sward. The actual effect varies considerably between farms due to the differences in farm configuration, i.e., soil type, land use, and management. Hence, farm-specific estimates of the effects of carbon measures on soil carbon stocks are required to inform farmers, farm consultants, and policy makers. However, farm- and field-specific model analyses of dairy systems are often hampered by the limited data availability for model input and parameterization, complicating the correct representation of the complex interactions between animal and crop management.
Here, we used the RothC model [12] on nine different dairy farms across the Netherlands, all with intensive data collection plans. The objective of the present study was to quantify the effect of several carbon measures on soil carbon sequestration in relation to farm configuration. First, we compared model outcomes with measured carbon stock changes based on farm data. Then, we simulated the effect of the carbon measures on soil carbon stocks and related the outcomes to differences in the farm setups.

2. Methods

2.1. Dairy Farms

We selected 96 fields from nine dairy farms on mineral soils from the Cows and Opportunities network (Table 1 and Table S1, Figure S1), a group of commercial dairy farms aiming to bridge the gap in environmental performance between experimental farms and commercial farms [13]. The network currently comprises 17 dairy farms, in addition to researchers, consultants from private extension services and the agro-industry, as well as policy makers. All farms are thoroughly monitored, analyzed, and evaluated in terms of agronomic, environmental, and economic performance [14]. The farms and fields were selected to give a reasonable representation of the varying mineral soil types and land use on dairy farms in the Netherlands. The fields were monitored for 10 years on average, with a range between 2 and 20 years. Moreover, the farmers needed to show interest in mitigating carbon emissions from soil.
The proportion of grassland varied between 80 and 100%, of which 4 to 87% was permanent grassland. Forage maize was grown on most farms, up to 20% of the area. The proportion of other arable crops was mostly less than 10%, but a couple of farms grew considerably more arable crops, even up to a third of the area, by renting out land to a neighboring arable farmer once every three years. Potatoes were grown on five farms, while tulips, cereals, or beans were grown occasionally on individual farms. The rotations always included grass, ranging from one year of grass every six years to one year of arable cropping every 19 years.

2.2. Soil Data

Soils of individual fields were routinely sampled at least once every four years, in autumn [15]. A composite sample consisted of 40 to 50 cores per field. The average field size was 4.9 ha with a range from 0.4 to 12.9 ha. The average number of samples per field was 4.3, with a range from 2 to 11. We used the available soil data on soil organic matter (SOM) and clay content. While arable land is sampled at a depth of 25 cm, grasslands are routinely sampled to a depth of 10 cm. The organic matter contents of grasslands were converted to 0–25 cm using Equation (1) [16].
SOM_25ij = SOM_10ij × CDij
Here, SOM_25ij and SOM_10ij are the soil organic matter content (%) for soil type i and land use j, to a depth of 25 or 10 cm, respectively. The conversion factor CDij equals 0.67 for permanent grasslands on clay soils and 0.81 on sandy soils, respectively. For temporary grasslands, CDij equals 0.97, irrespective of soil type. The bulk density was calculated with soil type-specific pedotransfer functions for clay [17] and sand [18].
BDclay = 1/(0.6117 + 0.003601 × CLAY + 0.002172 × SOM2 + 0.01715 × LN(SOM))
BDsand = 1/(0.667 + (0.021 × SOM))
In Equations (2) and (3), BD is the bulk density (g/L), CLAY is the clay content (%), and SOM is the soil organic matter content (%).
The soil organic carbon (SOC) stock to a depth of 25 cm was calculated from SOM and BD using Equation (4), assuming a carbon content of 54% in SOM [19].
SOC_25 = SOM_25 × BD × 0.54 × 25

2.3. Crop Management Data

Data regarding land use, manure application, and grazing were collected for each field. The organic matter input from crop residues was standardized (Table S2), based on the existing data for arable crops [20] and a recent calibration for grassland [16]. Annual carbon inputs from manure were based on registered field applications and the analysis of farm-specific manure. Monthly soil cover was based on the average growing patterns for each crop (Table S2).

2.4. Weather Data

The average monthly temperature, precipitation sum, and Makkink evaporation sum [21] were collected from the closest weather station [22]. For the model simulations, we used the 15-year average between 2001 and 2015. The Makkink evaporation was converted to open water evaporation using a conversion factor of 1.25 [23].

2.5. Soil Carbon Model Simulations

We used RothC [12] to simulate changes in soil carbon stocks in the layer of 0–25 cm. RothC is a recognized model for predicting SOC changes in response to environmental conditions and management. It is applied at various scales and has been validated across different climate zones [12,24,25]. Moreover, we selected RothC as it was recently selected as a suitable tool under Dutch conditions [26].
First, we assessed model outcomes against the measured soil carbon data on 96 fields across the nine dairy farms (Table 1). Fields were considered suitable if there were at least two historical soil samples available and they were not resized through splitting or joining fields. The oldest available soil sample was used to calculate the initial total soil carbon stock and its distribution among the following five soil carbon compartments in the RothC model: Degradable Plant Material (DPM), Resistant Plant Material (RPM), Microbial Biomass (BIO), Humus (HUM), and Inert Organic Matter (IOM). Other than initial soil carbon content, the model inputs consisted of soil clay content, weather data, and the carbon inputs from crops and manures. Model performance was assessed by the mean absolute error (MAE) and Root Mean Squared Error (RMSE) of observed and simulated carbon stocks.
Second, we simulated the effect of carbon measures on soil carbon stocks, over a period of 50 years. The measures were prioritized by the participating farmers and include (i) increasing the sward age of permanent grassland, (ii) increasing the proportion of grassland in crop rotation, (iii) converting crop rotations to permanent grassland, (iv) the addition of external organic matter from compost, (v) the reduction in export of internally produced manure, and (vi) increasing the proportion of catch crops in rotations. Details on how these measures were applied and parametrized in RothC are presented in Supplementary Materials, Section S1.
Third, we used RothC to calculate a standardized benchmark (SOC_PG170) that expresses the field-specific maximal achievable carbon stock for permanent grassland that receives an equivalent of 170 kg nitrogen per ha per year from animal manures. This follows the concept of carbon saturation and how it is related to soil texture [27]. The application rate of 170 kg per ha was chosen as it aligns with the European Union’s Nitrate Directive [28]. The current soil carbon stock can be expressed as a fraction of the SOC_PG170 benchmark, which we define as the SOC_PG170 index.

3. Results and Discussion

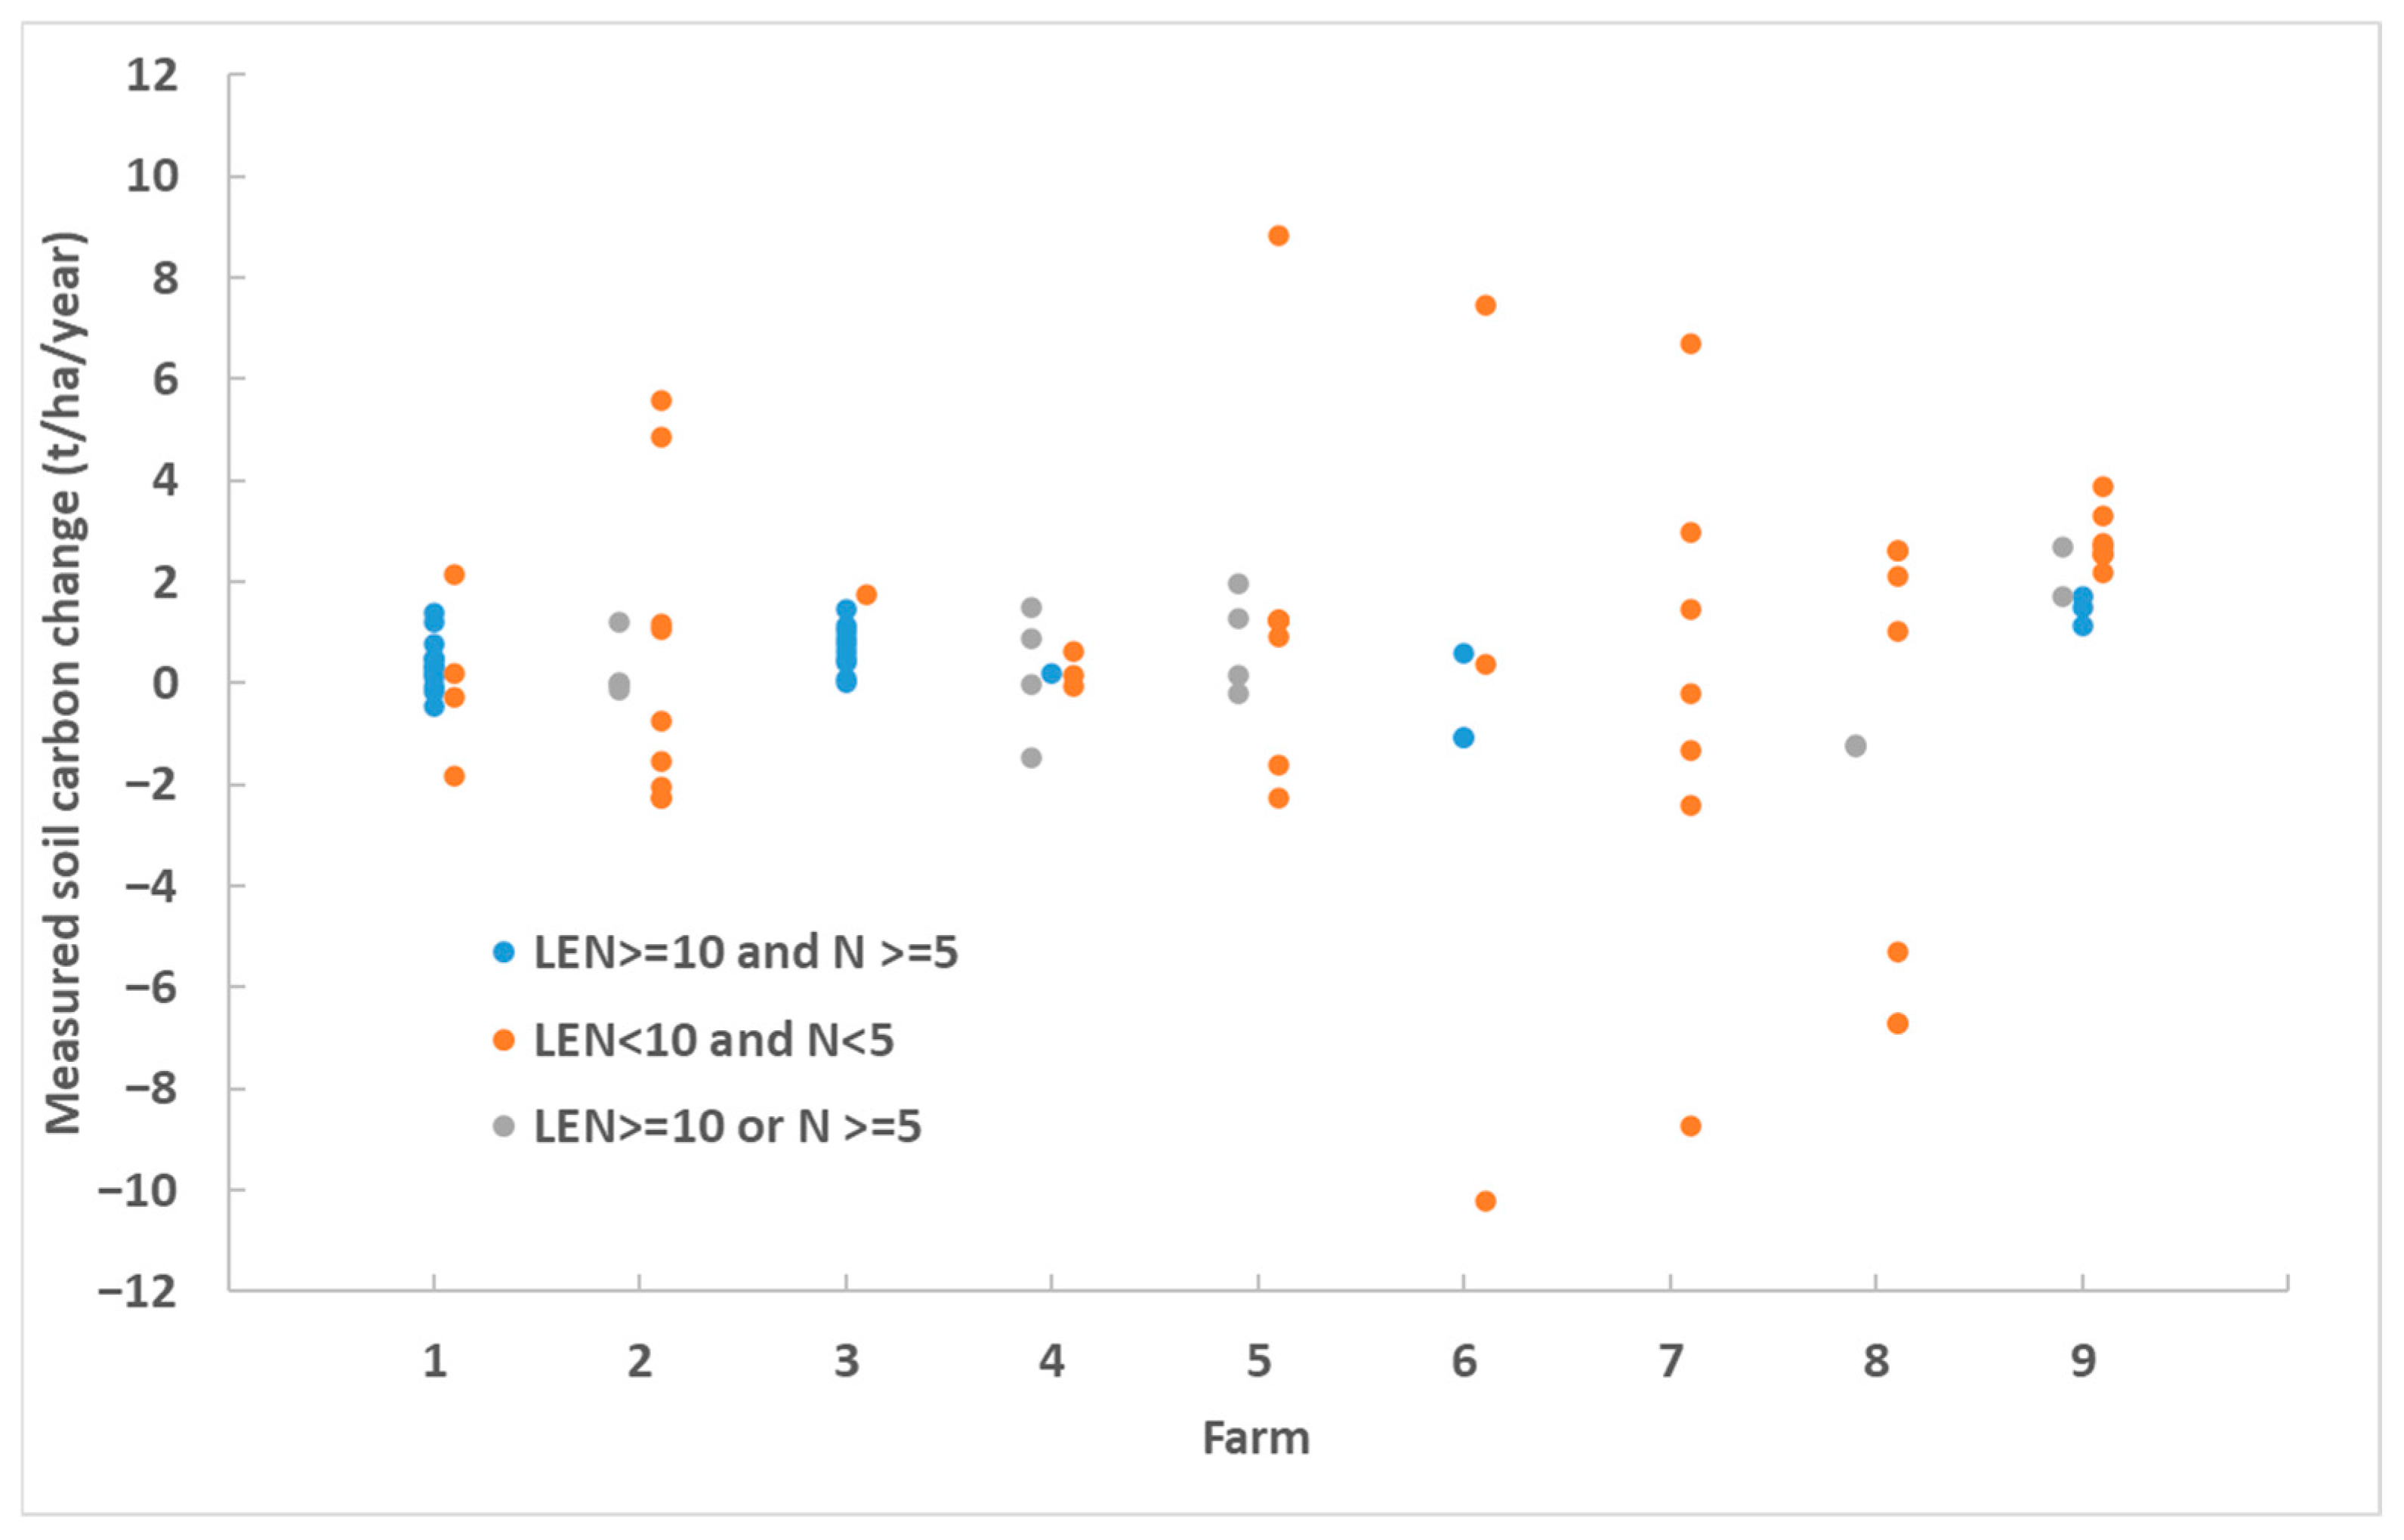
3.1. Measured Changes in Soil Carbon Stocks

The measured annual changes in soil carbon stocks showed a large variation between farms and fields (Figure 1). Despite the known variability of measured changes in soil carbon stocks [29,30,31,32], some individual field estimates can be considered as unlikely values. Therefore, we assessed the observed soil carbon changes against the length of the monitoring period and the number of samples (Figure S1). The variation between fields and the occurrence of outliers were reduced considerably if the length of the monitoring period was at least ten years or the number of samples was at least five. A monitoring period of at least ten years was achieved on 47% of the fields, while a minimal number of five samples was achieved on 31% of the fields. These criteria were confounded and applying both criteria was only marginally better than applying just one of the two; 30% of the fields fulfilled both criteria. A required minimal monitoring period of 10 years is in line with the recommendations for estimating carbon sequestration [33] or recent carbon credit initiatives for grasslands in The Netherlands [34].
The estimates of soil carbon changes are thus affected by whether the outcomes are filtered for the underlying monitoring intensity. The average estimates of the unfiltered set (n = 96) was 0.5 t C/ha/year, with a standard deviation of 2.7 t C/ha/year. Applying the strictest criteria, i.e., at least ten years of monitoring and at least five samples (n = 29), did not change the overall average but reduced the standard deviation to 0.7 t C/ha/year. It should be noted that, for some farms (Figure 1), the filtered dataset is empty, especially for permanent grasslands, which presents an unbalanced comparison between land uses. Therefore, these data do not allow a comparison of the soil carbon change between permanent grassland and grass-arable rotations, or between farms.
Earlier studies in the Netherlands found varying outcomes of measured soil carbon changes. Changes in soil organic carbon in the 0–30 cm and 30–100 cm soil layers were estimated by repeated sampling of 1152 locations in 1998 and 2018 [35]. The soil organic carbon stocks decreased in both the 0–30 cm and the 30–100 cm layer of mineral soils under both cropland and grassland. The authors stated that a conclusion in terms of statistical significance was not possible, as not all uncertainties related to the soil bulk density data could be quantified. They recommended that the accuracy of the bulk density data first needed to be improved. An exploratory analysis of soil carbon monitoring on Dutch grassland farms found significant differences between SOM stocks calculated based on nine different pedotransfer functions. However, the different pedotransfer functions hardly affected the trends in carbon stocks [32]. In another study, changes in soil organic carbon contents were calculated for grassland (0–5 cm) and arable land (0–25 cm) during the period 1984–2004, using a dataset with approximately two million measurements from farmers’ fields [29]. The outcome showed that the mean SOC contents in the top layer of mineral soils of agricultural land in most regions in the Netherlands tended to increase slightly over the measurement period of 20 years. A subset of these data in four adjacent regions on sandy soil was analyzed separately [36]. The dataset was restricted to samples from grass, grass-maize rotation, and maize fields that had been sampled from four to five times during the period 1984–2004. The authors found no single uniform trend in soil organic matter contents for any of the three systems.
The previous studies and current study show the realities of measuring soil carbon change, revealing that it is both hard and leads to inconsistent results. Therefore, recent efforts in Europe are focusing, amongst others, on creating a framework for designing harmonized, but context-specific monitoring, reporting, and verification systems applicable to different land uses [37].

3.2. Simulated Changes in Soil Carbon Stocks

3.2.1. Comparing Simulations and Measurements

The monitoring intensity of the observed data affected the relationship with simulated data. Excluding data points that were based on short monitoring periods (LEN < 10 year) or infrequent sampling (n < 5), resulted in an improvement of the model performance indicators (Table 2) for total soil carbon. The average and standard deviation of the MAE and RMSE were lower with the filtered data.
The simulated soil carbon changes varied among fields between −0.6 and +1.2 t/ha/year, which is lower than the measured ranges (Figure 2). The fit of the regression of simulated values on the observed values improved with the filtered data. We could not determine whether the model fit was affected by land use due to the unbalanced land use within the filtered data. Permanent grasslands represented only 17% of the data, compared to 83% for grass-arable rotations.
It is challenging to determine the exact causes for the moderate relation between measured and simulated soil carbon changes. In the 1960s, astronomer Harlow Shapley exemplified our dilemma by stating the following: “No one trusts a model except the man who wrote it; everyone trusts an observation, except the man who made it” [38]. The RothC model is widely applied across the globe from individual fields up to national, continental, and global scales. In the Netherlands, RothC was validated against medium- to long-term experiments with permanent grasslands (5 to 20 years), continous forage maize (6 to 7 years), and grass-forage maize rotations (9 to 10 years) [16]. Furthermore, the model has been validated in many climate zones, including the Atlantic zone where our farms are located [12,24,25]. Uncertainty in model predictions may also be related to the uncertainty of carbon inputs from crop residues and manures. We have used fixed crop-specific inputs from crop residues, calibrated for the Netherlands. Nevertheless, the actual crop inputs may vary depending on above-ground yields and pasture management [39,40]. Within the filtered data, the average difference between observed and simulated soil carbon changes was −0.06 t C/ha/year, indicating that there was no large systematic under- or overestimation of the simulated carbon decomposition.
The farms used in this study were thoroughly monitored, which meant that field-specific data on land use, crop, and pasture management, including manure application were available. This level of monitoring is far more intense than the average monitoring of dairy farms in the Netherlands, where field-specific management data are often not available. Still, the uncertainty of farm data increases with the increasing complexity of the farms. For example, farm number 9 only grew grass and forage maize, mostly on the same fields. In constrast, farm number 2 grew grass and more than five arable crops, rotating across the farm itself but also across neighboring farms. In the latter case, the management is recorded by another farmer, rendering correct data collection more difficult. Finally, we used soil samples from an agronomically orientated sampling program designed to support good agricultural practice by farmers, thus not specifically designed to detect soil carbon changes. For these agronomic sampling programs, the overall error of SOC determination (sampling and analyses errors) is estimated at ±5 g/kg for SOC contents < 50 g/kg and at ±10% of the SOC content for SOC contents > 50 g/kg [29]. The dataset contained samples at varying depths between 10 and 20 cm and lacked bulk density measurements. Moreover, additional variation may have been introduced to different sampling months [32].
Our findings demonstrate that the current standard agronomic soil sampling program is not suitable for reliable soil carbon monitoring at the farm and field level. While there are many monitoring schemes that are implemented on national scales, tracking on a farm and field level will require intensified monitoring at farm and field scales, including the appropriate depths [41].

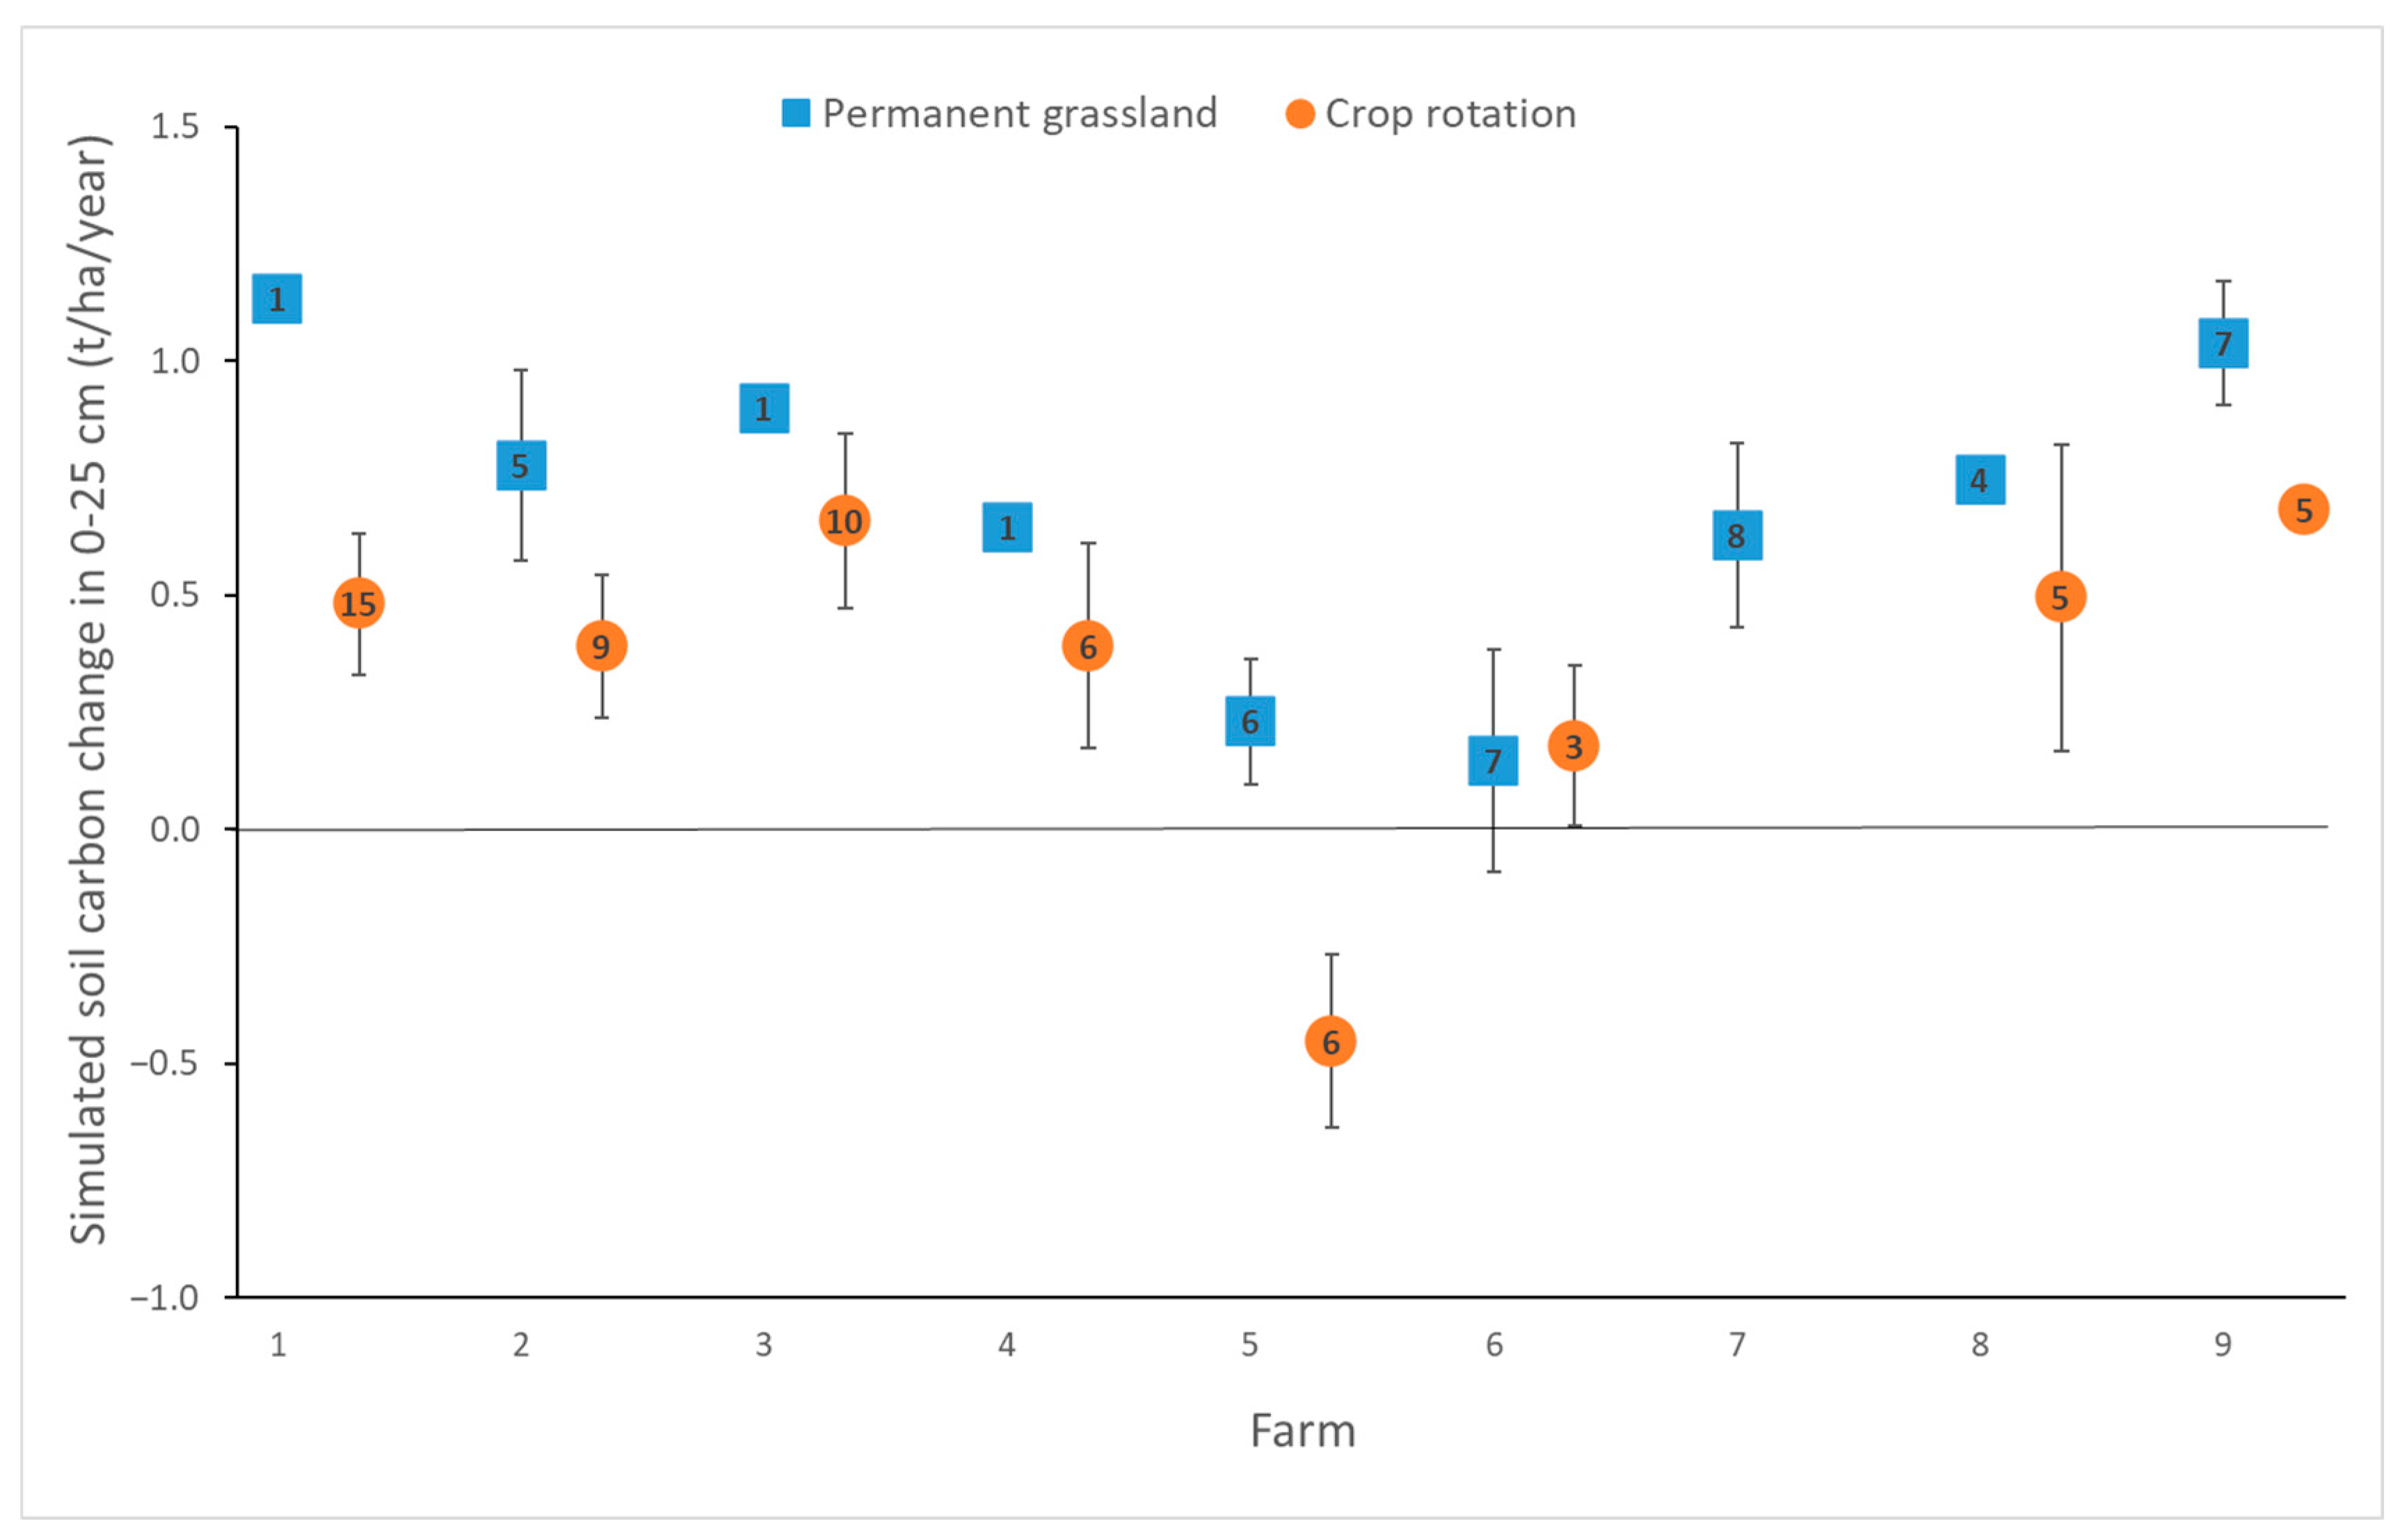
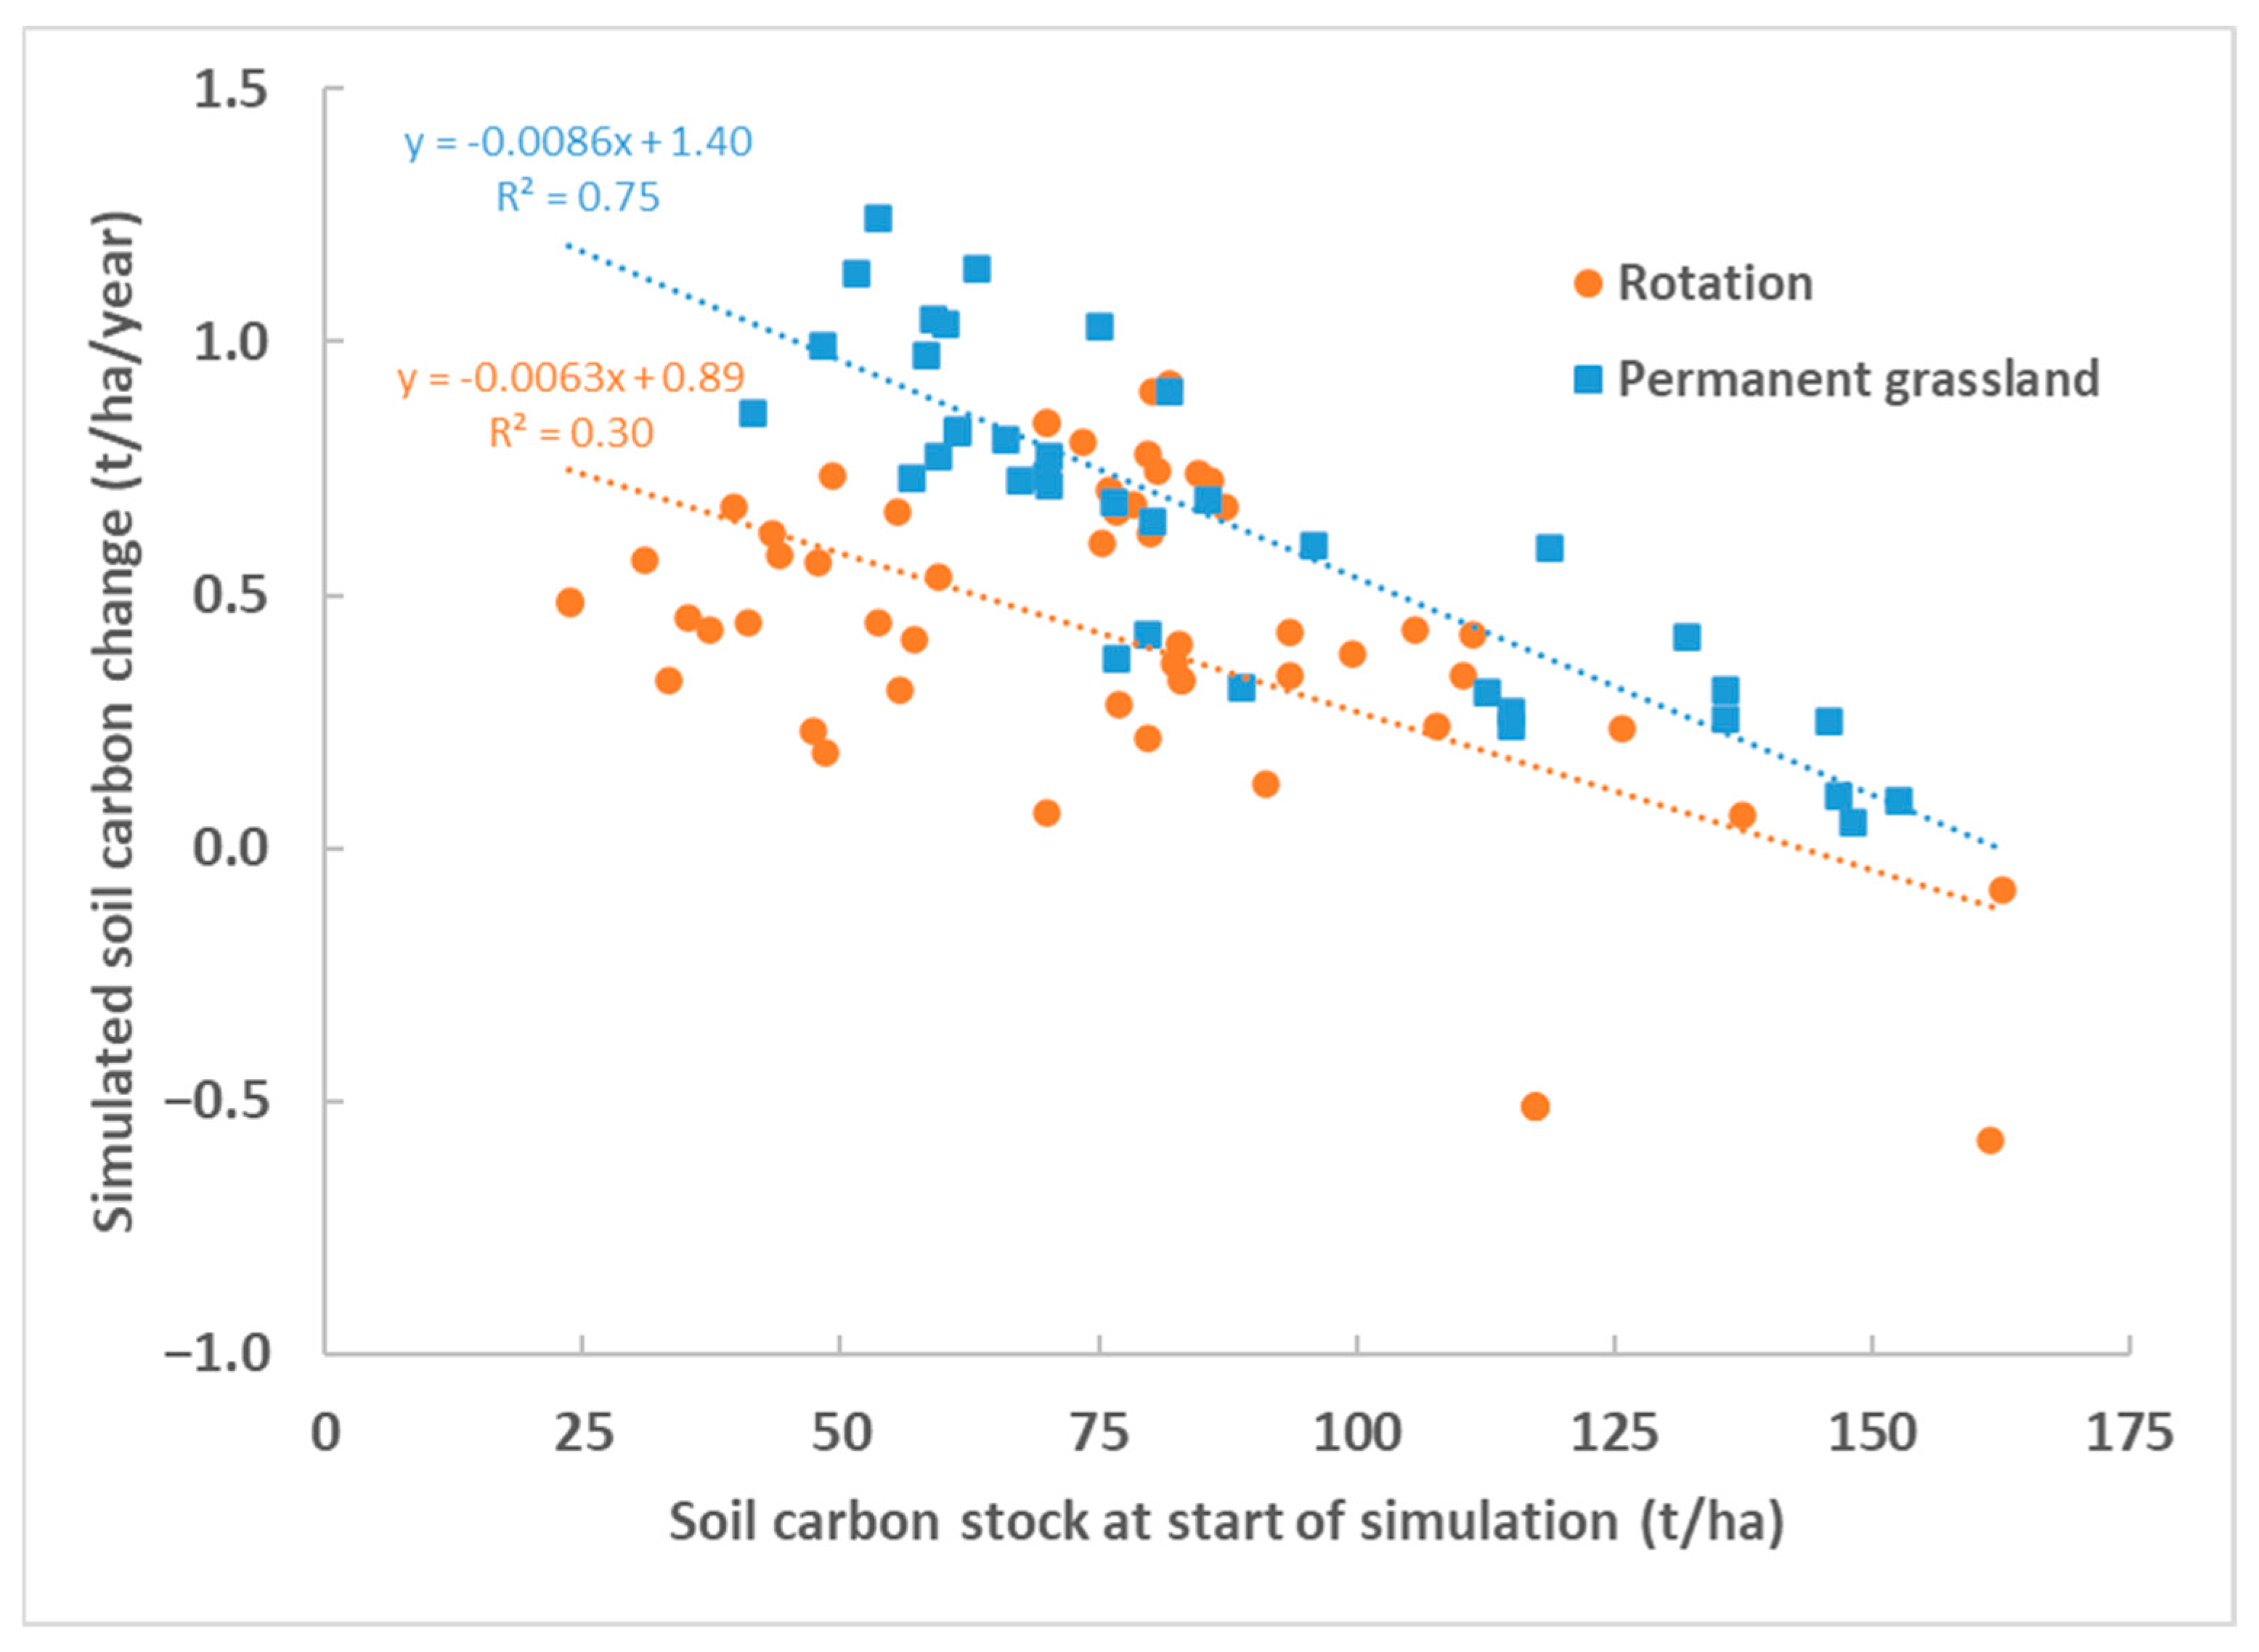
3.2.2. Annual Changes in Soil Carbon

The overall average change in the modeled soil carbon stocks of 96 fields was +0.68 (sd = 0.31) and +0.39 (sd = 0.36) t/ha/year for permanent grasslands and crop rotations, respectively. On eight out of the nine farms, permanent grasslands stored more carbon than grass-arable rotations (Figure 3). The average carbon input from crop residues was 4.8 (sd = 0.5) and 3.3 (sd = 0.7) t/ha/year for permanent grasslands and crop rotations, respectively. The higher variation in crop inputs in rotations was mainly related to the proportion of grassland in a rotation. The average carbon input from manures was 2.2 (sd = 0.5) t/ha/year, irrespective of land use.
Comparable assessments of field-specific simulated soil carbon changes, including field-specific carbon inputs, are unavailable for the Netherlands. Earlier estimates with RothC on 28 farms with 437 fields used field-specific organic matter values, but carbon inputs were the crop-specific farm averages that were not allocated to fields [16]. In that study, the average soil carbon change varied between −2.0 and +1.8 t/ha/year. The average values for grassland, forage maize, and other arable crops were +0.4, −0.5, and −0.6 t/ha/year, respectively. In normal farming practices, field-specific manure inputs, through machine application or animal excreta, are mostly lacking.
Regional estimates of soil carbon changes with RothC were compared with simpler approaches using fixed decomposition rates for existing soil organic matter [42]. The RothC estimates approximately varied from 0.5 to 0.9 t/ha/year for grasslands and from −0.1 to −0.5 t/ha/year for arable crops.
The annual changes in soil carbon were related to the initial carbon stocks (Figure 4). For permanent grasslands, the annual stock change decreased from around 1 t C/ha/year at a low initial stock (~50 t/ha) to around 0.2 t C/ha/year at a high initial stock (~150 t/ha). A similar relationship was found for crop rotations where the annual soil carbon change decreased from around 0.5 to 0 along the same gradient of initial stocks. This has important implications for the potential of additional carbon storage, as farms with high carbon stocks have less room for improvement than farms with low carbon stocks. This can also be expressed by the SOC_PG170 index which varied from 0.23 to 0.93 (Table 3). We consider that this index is helpful in ranking fields and farms in terms of carbon storage potential but also carbon loss risk. Rewarding schemes are generally focused on crediting positive changes in soil carbon stocks. We argue that protecting the high levels of existing carbon stocks should also be rewarded. The SOC_PG170 benchmark and index introduced here are just the first attempts and need further fine tuning. First, using permanent grassland as a benchmark for carbon storage assumes an increasing role for permanent grasslands in future dairy systems and less reliance on home-grown arable crops for animal feed [43]. Second, the manure nitrogen input of 170 kg/ha is lower than the current input on the studied farms and most other farms in the Netherlands. However, given the biodiversity and environmental goals for agriculture [44,45], we believe a lower input to permanent grasslands is realistic for the near future. Third, the benchmark calculated here is valid for the manure types, grassland types, and management on the studied dairy farms. In other regions, carbon input from manures and crop residues could vary, for instance, as a result of other fertilizer inputs and defoliation frequencies [40]. Finally, instead of benchmarking the equilibrium state, it might be more appropriate for farmers to use a shorter time horizon such as one or two generations, i.e., 20 or 40 years from now.

3.2.3. Effect of Soil Carbon Measures

The median value of the simulated effect of carbon measures, during the first 50 years after implementation, varied from 0.024 to 0.50 t C/ha/year (Figure 5). Converting grass-arable crop rotations to permanent grasslands was by far the best measure for increasing soil carbon stocks, up to nearly 1.0 t C/ha/year. All other measures showed a relatively low impact, in a range from 0 to 0.2 t C/ha/year. The outcomes showed a considerable variation between farms and fields that are related to soil type and current carbon stock, land use and management.
The results show that the proportion of grass on a farm is key in increasing carbon storage [46]. A regional RothC modeling study in the Netherlands [11] also showed that an increased area of permanent grasslands could increase the average carbon sequestration by 0.4 t/ha/year on clay soils and 0.7 t/ha/year on sandy soils. Our study showed a median additional storage of 0.5 t/ha/year. The high variations for the measures ‘convert rotation to permanent grassland’ and ‘increased grass in rotation’ were mainly related to the current number of grass years within a rotation. The higher the current proportion of grass in a rotation, the lower the impact of these measures. In this study, the rotations ranged from 1 year of grass every 6 years to 1 year of arable cropping every 19 years. The latter types, with incidental cropping in a more or less permanent grassland system, are atypical rotations. When we only consider typical rotations with a maximum of four consecutive years of grassland, the median value of these measures increases slightly, while the minimum values increase substantially.
The application of catch crops increased soil carbon storage by 0.1 t/ha/year, which is lower than the 0.3 t C/ha found in the above-mentioned study for the Netherlands [11]. In our study, catch crops were only applicable on farm 1, as all other farms already applied catch crops. Importing compost or reducing the export of manure had a moderate effect. Although these measures might be beneficial for farm-based carbon budgets, the positive effects might be offset on a regional scale as compost or manure are limited resources.
Increasing the sward age of permanent grasslands through a lower renovation frequency did not have a large effect on additional carbon storage. In a renovation year, our simulations show a net loss of soil carbon of approximately 0.5% of the existing carbon stock, which is in the same range as the ICBM model estimates for the Netherlands [47]. The results of the measured soil carbon losses after plowing grassland show higher but varying loss rates. In northern Germany, the decline in soil organic carbon (0–30 cm) was in the order of 5% [48], while in Ireland, 25% of soil carbon (0–30 cm) was lost during two and a half years after plowing [49]. Given these high loss fractions, our assessment of less grassland renovation to increase sward age may underestimate the effect on additional soil storage. Our model parametrization is mainly based on a lower carbon input to the soil, while additional carbon loss through soil disturbance is less important. At least in the short-term, this was also concluded in an Irish study where the authors conclude that the main mechanism of carbon loss during plowing was most likely due to a reduction in gross primary production rather than enhanced soil respiration [50].
Although the results present a well-defined ranking of measures, this does not imply that farmers’ preferences are ranked similarly. For instance, the measure ‘convert rotation to permanent grassland’ is a drastic measure that affects the overall structure of a farm and may have trade-offs on other environmental indicators like nitrogen use efficiency [51]. For other less impactful measures, the barrier to adoption may be much lower. In Finland, most farmers chose measures with relatively low carbon storage benefits but high potential benefits for soil structure and productivity [52]. A survey among dryland cropping and mixed crop-livestock farmers in Western Australia also showed that farmers are most likely to adopt practices that support production objectives [53].
The soil carbon measures in this study are implemented within the farm context of the participating farmers. In other regions and farm contexts, the details of the implementation of similar types of measures may be different, and it may lead to different results. We also realize there are other potential measures that we did not address in our study, such as improved grazing management, optimal irrigation strategies, or the introduction of silvopastures [54].

4. Conclusions

We showed that the current standard agronomic soil sampling program is unable to reliably detect soil carbon changes at the farm or field level.
The key to carbon sequestration on dairy farms is the proportion of grassland. All other measures showed relatively modest effects. The simulated effect of carbon measures on sequestration depends on the current farm configuration.
We propose an indicator (SOC_PG170_index) that expresses the current soil carbon stock in relation to the location-specific maximal achievable carbon stock for permanent grassland that receives an equivalent of 170 kg nitrogen per ha per year from animal manures. It can be used to compare farms and indicate whether a farmer’s focus should be on additional carbon storage or the protection of existing stocks.

Supplementary Materials

The following supporting information can be downloaded at: https://www.mdpi.com/article/10.3390/land14040874/s1, Figure S1: Location of participating farms in the Netherlands; Figure S2: Measured soil carbon changes and monitoring plan. (a) Measured soil carbon change in 0–25 cm (t/ha/year) in relation to the length of the monitoring period. (b) Measured soil carbon change in 0–25 cm (t/ha/year) in relation to the number of samples.; Table S1: Characteristics of selected fields and annual carbon inputs, outputs and balance; Table S2: Annual carbon inputs from crops and monthly soil cover.

Author Contributions

Conceptualization, R.S. and K.V.; methodology, R.S., C.D. and K.V.; formal analysis, R.S., C.D. and K.V.; data curation, R.S., C.D., J.O., G.H.; writing—original draft preparation, R.S.; writing—review and editing, R.S., C.D., J.O., G.H. and J.-P.W.; funding acquisition, K.V. and J.-P.W. All authors have read and agreed to the published version of the manuscript.

Funding

This study was funded by the Ministry of Agriculture, Nature and Food Quality (Smart Land Use, Network Livestock Husbandry, BO-43-106-009); the European Union Horizon 2020 research and innovation programme, under grant agreement 774124, project SUPER-G (Developing Sustainable Permanent Grassland Systems and Policies); and the Internal Funding programme at WUR-WPR-Agrosystems Research.

Data Availability Statement

The underlying data of this study are available upon request from the corresponding author.

Acknowledgments

We thank the participating farmers in the Cows and Opportunities network.

Conflicts of Interest

The authors declare no conflict of interest.

References

  1. Bossio, D.A.; Cook-Patton, S.C.; Ellis, P.W.; Fargione, J.; Sanderman, J.; Smith, P.; Wood, S.; Zomer, R.J.; von Unger, M.; Emmer, I.M.; et al. The role of soil carbon in natural climate solutions. Nat. Sustain. 2020, 3, 391–398. [Google Scholar] [CrossRef]
  2. Adun, H.; Ampah, J.D.; Bamisile, O.; Hu, Y. The synergistic role of carbon dioxide removal and emission reductions in achieving the Paris Agreement goal. Sustain. Prod. Consum. 2024, 45, 386–407. [Google Scholar] [CrossRef]
  3. Panagos, P.; Borrelli, P.; Jones, A.; Robinson, D.A. A 1 billion euro mission: A Soil Deal for Europe. Eur. J. Soil Sci. 2024, 75, e13466. [Google Scholar] [CrossRef]
  4. Montanarella, L.; Panagos, P. The relevance of sustainable soil management within the European Green Deal. Land Use Policy 2021, 100, 104950. [Google Scholar] [CrossRef]
  5. Fetting, C. The European green deal. In ESDN Report; ESDN Office: Vienna, Austria, 2020; Volume 2. [Google Scholar]
  6. MEACP. Climate Agreement; Ministery of Economic Affairs and Climate Policy: The Hague, The Netherlands, 2019; p. 247. [Google Scholar]
  7. NZO. Klimaatverantwoorde Zuivelsector in Nederland; LTO Vakgroep Melkveehouderij, Nederlands Agrarisch Jongeren Kontakt, Nederlandse Melkveehouders Vakbond, Nederlandse Zuivel Organisatie: The Hague, The Netherlands, 2018; p. 31. [Google Scholar]
  8. Spijker, E. Navigating the complex policy landscape for carbon farming in The Netherlands and the EU [version 1; peer review: 1 approved with reservations, 1 not approved]. Open Res. Eur. 2024, 4, 228. [Google Scholar] [CrossRef]
  9. Freibauer, A.; Rounsevell, M.D.A.; Smith, P.; Verhagen, J. Carbon sequestration in the agricultural soils of Europe. Geoderma 2004, 122, 1–23. [Google Scholar] [CrossRef]
  10. Rodrigues, L.; Hardy, B.; Huyghebeart, B.; Fohrafellner, J.; Fornara, D.; Barančíková, G.; Bárcena, T.G.; De Boever, M.; Di Bene, C.; Feizienė, D.; et al. Achievable agricultural soil carbon sequestration across Europe from country-specific estimates. Glob. Change Biol. 2021, 27, 6363–6380. [Google Scholar] [CrossRef]
  11. Lesschen, J.P.; Hendriks, C.; Slier, T.; Porre, R.; Velthof, G.; Rietra, R. De Potentie voor Koolstofvastlegging in de Nederlandse Landbouw; Wageningen Environmental Research: Wageningen, The Netherlands, 2021. [Google Scholar]
  12. Coleman, K.; Jenkinson, D.; Crocker, G.; Grace, P.; Klir, J.; Körschens, M.; Poulton, P.; Richter, D. Simulating trends in soil organic carbon in long-term experiments using RothC-26.3. Geoderma 1997, 81, 29–44. [Google Scholar] [CrossRef]
  13. Oenema, J.; Koskamp, G.J.; Galama, P.J. Guiding commercial pilot farms to bridge the gap between experimental and commercial dairy farms; the project ‘Cows & Opportunities’. NJAS—Wagening. J. Life Sci. 2001, 49, 277–296. [Google Scholar] [CrossRef]
  14. Oenema, J.; van Keulen, H.; Schils, R.L.M.; Aarts, H.F.M. Participatory farm management adaptations to reduce environmental impact on commercial pilot dairy farms in the Netherlands. NJAS—Wagening. J. Life Sci. 2011, 58, 39–48. [Google Scholar] [CrossRef]
  15. Eurofins. Soil Sampling Protocol. 2023. Available online: https://www.eurofins-agro.com/uploads/downloads/IBL_Sampling_protocol/Sampling_protocol_SLM_FM_SCC_2023.pdf (accessed on 13 January 2024).
  16. Lesschen, J.P.; Vellinga, T.; Dekker, S.; van der Linden, A.; Schils, R. Mogelijkheden voor Monitoring van CO2-Vastlegging en Afbraak van Organische Stof in de Bodem op Melkveebedrijven; Wageningen Environmental Research: Wageningen, The Netherlands, 2020. [Google Scholar]
  17. Wösten, H.; Veerman, G.J.; de Groot, W.J.M.; Stolte, J. Waterretentie- en Doorlatendheidskarakteristieken van Boven- en Ondergronden in Nederland: De Staringreeks; Vernieuwde Uitgave 2001; Alterra-Rapport 153, 86 blz, 2001; Alterra: Wageningen, The Netherlands, 2001. [Google Scholar]
  18. Hoekstra, C.; Poelman, J.N.B. Dichtheid van Gronden Gemeten aan de Meest Voorkomende Bodemeenheden in Nederland; STIBOKA: Wageningen, The Netherlands, 1982. [Google Scholar]
  19. van Tol-Leender, D.; Knotters, M.; de Groot, W.; Gerritsen, P.; Reijneveld, A.; van Egmond, F.; Wösten, H.; Kuikman, P. Koolstofvoorraad in de Bodem van Nederland (1998–2018): CC-NL; Wageningen Environmental Research: Wageningen, The Netherlands, 2019. [Google Scholar]
  20. de Haan, J.; van Geel, W. Handboek Bodem en Bemesting. 2014. Available online: https://www.handboekbodemenbemesting.nl/nl/handboekbodemenbemesting.htm (accessed on 6 July 2023).
  21. Makkink, G. Examination of Penman’s revised formula [Esperanto]. Neth. J. Agric. Sci. 1957, 5, 290–305. [Google Scholar] [CrossRef]
  22. KNMI. KNMI Open Data Platform; Royal Netherlands Meteorological Institute: De Bilt, The Netherlands, 2025. [Google Scholar]
  23. Feddes, R.; Van Dam, J.; Witte, J. Soil Physics and Agrohydrology; Wageningen Universiteit: Wageningen, The Netherlands, 2003. [Google Scholar]
  24. Falloon, P.; Smith, P. Simulating SOC changes in long-term experiments with RothC and CENTURY: Model evaluation for a regional scale application. Soil Use Manag. 2002, 18, 101–111. [Google Scholar] [CrossRef]
  25. Zimmermann, M.; Leifeld, J.; Schmidt, M.W.I.; Smith, P.; Fuhrer, J. Measured soil organic matter fractions can be related to pools in the RothC model. Eur. J. Soil Sci. 2007, 58, 658–667. [Google Scholar] [CrossRef]
  26. Lesschen, J.P.; Hendriks, C.; van der Linden, A.; Timmermans, B.; Keuskamp, J.; Keuper, D.; Hanegraaf, M.; Conijn, S.; Slier, T. Development of Practical Tool for Soil C; Wageningen Environmental Research: Wageningen, The Netherlands, 2020. [Google Scholar]
  27. Six, J.; Doetterl, S.; Laub, M.; Müller, C.R.; Van de Broek, M. The six rights of how and when to test for soil C saturation. Soil 2024, 10, 275–279. [Google Scholar] [CrossRef]
  28. EC (European Commission). Council Directive 91/676/EEC of 12 December 1991 concerning the protection of waters against pollution caused by nitrates from agricultural sources. Off. J. 1991, L 375, 1–8. [Google Scholar]
  29. Reijneveld, A.; van Wensem, J.; Oenema, O. Soil organic carbon contents of agricultural land in the Netherlands between 1984 and 2004. Geoderma 2009, 152, 231–238. [Google Scholar] [CrossRef]
  30. Don, A.; Schumacher, J.; Scherer-Lorenzen, M.; Scholten, T.; Schulze, E.-D. Spatial and vertical variation of soil carbon at two grassland sites—Implications for measuring soil carbon stocks. Geoderma 2007, 141, 272–282. [Google Scholar] [CrossRef]
  31. Necpálová, M.; Anex, R.P.; Kravchenko, A.N.; Abendroth, L.J.; Del Grosso, S.J.; Dick, W.A.; Helmers, M.J.; Herzmann, D.; Lauer, J.G.; Nafziger, E.D.; et al. What does it take to detect a change in soil carbon stock? A regional comparison of minimum detectable difference and experiment duration in the north central United States. J. Soil Water Conserv. 2014, 69, 517–531. [Google Scholar] [CrossRef]
  32. Hoogsteen, M.J.J.; Breure, A.M.; van Ittersum, M.K. Monitoring soil organic matter on grassland farms: An exploratory analysis. Geoderma 2022, 405, 115456. [Google Scholar] [CrossRef]
  33. Nayak, A.K.; Rahman, M.M.; Naidu, R.; Dhal, B.; Swain, C.K.; Nayak, A.D.; Tripathi, R.; Shahid, M.; Islam, M.R.; Pathak, H. Current and emerging methodologies for estimating carbon sequestration in agricultural soils: A review. Sci. Total Environ. 2019, 665, 890–912. [Google Scholar] [CrossRef]
  34. Staps, S.; Rougoor, C.; Lesschen, J.P.; Cozijnsen, J. Methode Voor Vaststelling Van CO2-Vastlegging in de Bodem; Stichting Nationale Koolstofmarkt: The Hague, The Netherlands, 2021. [Google Scholar]
  35. Knotters, M.; Teuling, K.; Reijneveld, A.; Lesschen, J.P.; Kuikman, P. Changes in organic matter contents and carbon stocks in Dutch soils, 1998–2018. Geoderma 2022, 414, 115751. [Google Scholar] [CrossRef]
  36. Hanegraaf, M.C.; Hoffland, E.; Kuikman, P.J.; Brussaard, L. Trends in soil organic matter contents in Dutch grasslands and maize fields on sandy soils. Eur. J. Soil Sci. 2009, 60, 213–222. [Google Scholar] [CrossRef]
  37. Xu, H.; Ruysschaert, G.; D’Hose, T. Carbon Farming Towards EU Climate Neutrality: Insights from the MARVIC and Credible Projects. In Proceedings of the 9th International Symposium on Soil Organic Matter, Ben Guerir, Morocco, 26–31 May 2024. [Google Scholar]
  38. Shapley, H. Through Rugged Ways to the Stars; Scribner: New York, NY, USA, 1969; p. 180. [Google Scholar]
  39. Bolinder, M.A.; Kätterer, T.; Andrén, O.; Parent, L.E. Estimating carbon inputs to soil in forage-based crop rotations and modeling the effects on soil carbon dynamics in a Swedish long-term field experiment. Can. J. Soil Sci. 2012, 92, 821–833. [Google Scholar] [CrossRef]
  40. Poeplau, C. Estimating root: Shoot ratio and soil carbon inputs in temperate grasslands with the RothC model. Plant Soil 2016, 407, 293–305. [Google Scholar] [CrossRef]
  41. Deluz, C.; Nussbaum, M.; Sauzet, O.; Gondret, K.; Boivin, P. Evaluation of the Potential for Soil Organic Carbon Content Monitoring With Farmers. Front. Environ. Sci. 2020, 8, 113. [Google Scholar] [CrossRef]
  42. Conijn, J.; Lesschen, J. Soil Organic Matter in The Netherlands: Quantification of Stocks and Flows in the Top Soil; Plant Research International, Business Unit Agrosystems Research: Wageningen, The Netherlands, 2015. [Google Scholar]
  43. Poux, X.; Aubert, P.-M. An Agroecological Europe in 2050: Multifunctional Agriculture for Healthy Eating. Findings from the Ten Years for Agroecology (TYFA) Modelling Exercise; IDDRI: Paris, France, 2018. [Google Scholar]
  44. Schils, R.L.M.; Bufe, C.; Rhymer, C.M.; Francksen, R.M.; Klaus, V.H.; Abdalla, M.; Milazzo, F.; Lellei-Kovács, E.; Berge, H.T.; Bertora, C.; et al. Permanent grasslands in Europe: Land use change and intensification decrease their multifunctionality. Agric. Ecosyst. Environ. 2022, 330, 107891. [Google Scholar] [CrossRef]
  45. Erisman, J.W. Setting ambitious goals for agriculture to meet environmental targets. One Earth 2021, 4, 15–18. [Google Scholar] [CrossRef]
  46. Soussana, J.-F.; Loiseau, P.; Vuichard, N.; Ceschia, E.; Balesdent, J.; Chevallier, T.; Arrouays, D. Carbon cycling and sequestration opportunities in temperate grasslands. Soil Use Manag. 2004, 20, 219–230. [Google Scholar] [CrossRef]
  47. Vellinga, T.V.; van den Pol-van Dasselaar, A.; Kuikman, P.J. The impact of grassland ploughing on CO2 and N2O emissions in the Netherlands. Nutr. Cycl. Agroecosyst. 2004, 70, 33–45. [Google Scholar] [CrossRef]
  48. Reinsch, T.; Loges, R.; Kluß, C.; Taube, F. Effect of grassland ploughing and reseeding on CO2 emissions and soil carbon stocks. Agric. Ecosyst. Environ. 2018, 265, 374–383. [Google Scholar] [CrossRef]
  49. Necpálová, M.; Li, D.; Lanigan, G.; Casey, I.A.; Burchill, W.; Humphreys, J. Changes in soil organic carbon in a clay loam soil following ploughing and reseeding of permanent grassland under temperate moist climatic conditions. Grass Forage Sci. 2014, 69, 611–624. [Google Scholar] [CrossRef]
  50. Willems, A.B.; Augustenborg, C.A.; Hepp, S.; Lanigan, G.; Hochstrasser, T.; Kammann, C.; Müller, C. Carbon dioxide emissions from spring ploughing of grassland in Ireland. Agric. Ecosyst. Environ. 2011, 144, 347–351. [Google Scholar] [CrossRef]
  51. Verloop, J.; Hilhorst, G.J.; Pronk, A.A.; Šebek, L.B.; van Keulen, H.; Janssen, B.H.; Van Ittersum, M.K. Organic matter dynamics in an intensive dairy production system on a Dutch Spodosol. Geoderma 2015, 237–238, 159–167. [Google Scholar] [CrossRef]
  52. Mattila, T.J.; Hagelberg, E.; Söderlund, S.; Joona, J. How farmers approach soil carbon sequestration? Lessons learned from 105 carbon-farming plans. Soil Tillage Res. 2022, 215, 105204. [Google Scholar] [CrossRef]
  53. Dumbrell, N.P.; Kragt, M.E.; Gibson, F.L. What carbon farming activities are farmers likely to adopt? A best–worst scaling survey. Land Use Policy 2016, 54, 29–37. [Google Scholar] [CrossRef]
  54. Chabbi, A.; Rumpel, C.; Klumpp, K.; Franzluebbers, A. Managing Grasslands to Optimize Soil Carbon Sequestration; Burleigh Dodds Science Publishing: London, UK, 2023. [Google Scholar] [CrossRef]
Figure 1. Measured soil carbon change in 0–25 cm (t/ha/year), in relation to the length of the monitoring period (LEN) in years and number of samples (N).
Land 14 00874 g001
Figure 2. Simulated versus measured soil carbon change in 0–25 cm (t/ha/year), in relation to the length of the monitoring period (LEN) and number of samples (N). Regression lines for all data (black line) and for filtered data, i.e., at least ten years of monitoring and at least five samples (blue line).
Land 14 00874 g002
Figure 3. Average and standard deviation of annual changes in simulated soil carbon stocks in 0–25 cm for permanent grasslands and crop rotations in participating dairy farms. Figures inside the marker indicate the number of fields.
Land 14 00874 g003
Figure 4. Annual changes in simulated soil carbon stocks in 0–25 cm for permanent grasslands and crop rotations in relation to the initial soil carbon stock.
Land 14 00874 g004
Figure 5. Average annual changes, during the first 50 years, of simulated soil carbon stocks in 0–25 cm for six measures. Boxplots indicate the minimum, P25, P50, P75, and maximum values. The number of fields is given between brackets.
Land 14 00874 g005
Table 1. Main features of the participating dairy farms, including the number of fields (n) with permanent grass or grass-arable rotations.
NrRegionSoil
Texture
Permanent
Grass
(n)
Grass-Arable
Rotations
(n)
Arable Crops
1NorthwestClay115Forage maize, potato
2SouthwestClay/Sand59Forage maize, potato, barley, legumes, corn cob maize
3CentralClay110Forage maize, flower bulbs
4SoutheastSand26Forage maize, potato
5NortheastClay/Sand66Forage maize, potato, corn cob maize
6NortheastSand15Potato
7EastSand8--
8SouthwestClay63Forage maize
9SoutheastLoam75Forage maize
Table 2. Average (standard deviation) values for indicators of model performance (total soil carbon) for all data and filtered data, i.e., at least ten years of monitoring and at least five samples.
IndicatorAll DataFiltered Data
MAE12.3 (8.2)11.0 (6.3)
RMSE13.7 (8.6)12.7 (7.0)
Table 3. Average PG170_index per farm, expressing the fraction of the initial carbon stock per farm in comparison to the maximal carbon stock in permanent grassland, fertilized with 170 kg N/ha/year from animal manure (SOC_PG170).
FarmInitial Carbon Stock (t/ha)SOC_PG170 (t/ha)SOC_PG170 Index
1411800.23
2951890.50
3811950.41
4771490.52
51351480.93
61221540.79
7691620.43
8731610.46
9631860.34
Average811720.49
Disclaimer/Publisher’s Note: The statements, opinions and data contained in all publications are solely those of the individual author(s) and contributor(s) and not of MDPI and/or the editor(s). MDPI and/or the editor(s) disclaim responsibility for any injury to people or property resulting from any ideas, methods, instructions or products referred to in the content.

