Article

Response of Gross Primary Productivity (GPP) of the Desert Steppe Ecosystem in the Northern Foothills of Yinshan Mountain to Extreme Climate

1
Yinshanbeilu Grassland Eco-Hydrology National Observation and Research Station, China Institute of Water Resources and Hydropower Research, Beijing 100038, China
2
Institute of Pastoral Hydraulic Research, Ministry of Water Resources, Hohhot 010020, China
3
College of Geographical Science, Inner Mongolia Normal University, Hohhot 010022, China
4
Inner Mongolia Key Laboratory of Disaster and Ecological Security on the Mongolian Plateau, Hohhot 010022, China
5
Provincial Key Laboratories of Mongolian Plateau’s Climate System, Hohhot 010022, China
6
College of Water Conservancy and Civil Engineering, Inner Mongolia Agricultural University, Hohhot 010018, China
7
Faculty of Civil and Environmental Engineering, Gdańsk University of Technology, Narutowicza 11/12, 80-233 Gdańsk, Poland
*
Authors to whom correspondence should be addressed.
Land 2025, 14(4), 884; https://doi.org/10.3390/land14040884
Submission received: 26 February 2025 / Revised: 1 April 2025 / Accepted: 14 April 2025 / Published: 16 April 2025

Abstract

:
The desert steppe ecosystem at the Northern Foothills of the Yinshan Mountains (NFYS) is characterized by its fragility and heightened sensitivity to global climate change. Understanding the response and lag effects of Gross Primary Productivity (GPP) to climate change is imperative for advancing ecological management and fostering sustainable development. The spatiotemporal dynamics of chlorophyll fluorescence-based GPP data and its responses to precipitation, temperature, and extreme climate from 2001 to 2023 were analyzed. The random forest model and the partial least squares regression model were employed to further elucidate the response mechanisms of GPP to extreme climate, with a specific focus on the lag effect. The findings revealed that the GPP in the NFYS exhibited distinct regional characteristics, demonstrating a predominantly increasing trend over the past 23 years. The region has experienced a warming and drying trend, marked by a decrease in the intensity and frequency of extreme precipitation events, and an increase in extremely high temperatures and consecutive hot days, except a slight, albeit insignificant, increase in precipitation in the northeastern part. GPP exhibits varying degrees of lag, ranging from one to three months, in response to both normal and extreme climatic conditions, with a more immediate response to extreme temperatures than to precipitation. The influence of different climatic conditions on the lag effects of GPP can amplify the negative effects of extreme temperatures and the positive impact of extreme precipitation. The anticipated trend towards a warmer and more humid climate is projected to foster an increase in GPP. This research is of great theoretical and practical significance for deeply understanding the adaptation mechanisms of ecosystems under the context of climate change, optimizing desertification control strategies, and enhancing regional ecological resilience.

1. Introduction

The IPCC AR6 (Sixth Assessment Report) highlights that the regions experiencing extreme weather events have expanded and become more pronounced as global warming intensifies. Notably, the annual maximum daily temperature and the annual wettest daily precipitation in mid-latitude and semi-arid regions worldwide have shown an upward trend compared to the past century [1]. In recent decades, the impact of climate change has become increasingly significant across most of China, marked by a rise in the frequency and intensity of extreme climate events, particularly extreme heat events, alongside a higher occurrence of extreme drought events [2]. Fragile ecosystems such as grassland ecosystems will be increasingly threatened [3]. Gross Primary Productivity (GPP), a fundamental ecological parameter that quantifies the total atmospheric carbon dioxide assimilated through vegetation photosynthesis, demonstrates significantly greater sensitivity to extreme temperature and precipitation variations in desert steppe ecosystems compared to other terrestrial biomes [4]. In the absence of research on the response mechanisms of desert steppe GPP to extreme climate events, a systematic investigation into their coupling and mutual feedback mechanisms holds significant importance for ecosystem conservation and sustainable development.
The spatiotemporal dynamics of GPP are significantly influenced by climatic factors, and the anomalous GPP variations induced by climate change inevitably exert corresponding feedback effects on regional climate systems [5,6]. Notably, these interactions exhibit distinct response patterns in terms of magnitude and direction across different seasons and along various climate gradients [7]. GPP exhibits heightened sensitivity to extreme temperatures in high-latitude and high-altitude regions. Extreme precipitation and temperature events are fundamental indicators for assessing extreme climate phenomena and exert significant influences on terrestrial ecosystem GPP [8,9]. Extreme high temperatures adversely affect carbon sequestration by suppressing photosynthetic activity while simultaneously enhancing respiratory carbon release [10,11,12]. Conversely, extreme low precipitation events have been shown to reduce global GPP by 40–50% [13]. When normalized by global biome distribution, meadow vegetation demonstrates the most pronounced precipitation sensitivity among all vegetation biomes, particularly in the desert steppe [14,15]. Moreover, the inherent uncertainties associated with projected extreme climate change scenarios are anticipated to exert more pronounced impacts on terrestrial ecosystem productivity.
Methodologies for indicating the relationship between extreme weather events and the GPP can be categorized into two primary approaches: (1) prospective assessment, which involves identifying extreme climate events and subsequently analyzing their impacts [16], and (2) posterior assessment, which examines environmental conditions associated with extreme impacts and their co-occurrence patterns [17]. Recent findings by [18] demonstrate that over 60% of global terrestrial vegetation exhibits temporal lag effects in response to extreme climate events. Furthermore, when accounting for these temporal lag effects, climatic factors demonstrate enhanced explanatory power for global vegetation dynamics [19]. The direct impacts of extreme weather events, coupled with their legacy lag effects, can significantly exacerbate soil erosion, leading to reduced soil productivity and accelerated desertification in arid and semi-arid regions [20,21]. However, a comprehensive understanding of the response mechanisms, encompassing both the direct and indirect effects of extreme weather on the carbon cycle and their associated lag effects, remains insufficiently explored [22]. Furthermore, the relationship between terrestrial ecosystem evolution and climate change exhibits variability across different spatial and temporal scales [16,23]. Notably, the desert steppe’s robust adaptability to extreme climate conditions results in a distinct response pattern compared to other land surfaces, rendering its carbon stocks more sensitive to extreme climate variations than to normal climatic conditions [24]. Consequently, investigating the response mechanisms of terrestrial ecosystems in this region is of paramount importance.
The desert steppe at the NFYS, situated between the typical meadow and the desert, is characterized by a singular vegetation type, a fragile ecological environment, and significant soil erosion [25]. This ecosystem exhibits a heightened sensitivity to climate change compared to other terrestrial ecosystems [26]. Among the various influencing factors, precipitation emerged as the predominant driver of vegetation change in this region. Notably, precipitation occurring outside the growing season primarily influenced the underground components of desert steppe vegetation. In contrast, the contributions of temperature, atmospheric circulation factors, solar radiation, and human activities to vegetation change were substantially lower than that of precipitation, with their respective contribution rates being relatively comparable [27,28]. Previous studies have predominantly focused on investigating the correlations between extreme climatic events and various ecological aspects of desert steppe ecosystems, particularly concerning phenological patterns and productivity dynamics [29,30]. However, there remains a notable research gap in quantitatively assessing both the direct and indirect relationships between GPP and extreme climate events, as well as normal climatic conditions, while systematically accounting for temporal lag effects in this specific region [31].
This study is conducted in the desert steppe region at the northern foothills of the Yinshan Mountains, with a primary focus on analyzing the spatiotemporal evolution characteristics of long-term GPP and climate change patterns. By employing the random forest method and the Partial Least Squares Structural Equation Modeling (PLS-SEM) approach, the research quantitatively elucidates the responses and lag effects of GPP to extreme precipitation events and extremely high temperatures. Additionally, the study further investigates the mutual feedback mechanisms between GPP and extreme climate events under projected future climate change scenarios.

2. Materials and Methods

2.1. Study Area

The NFYS is situated between 40.55°~45.10° N and 105.20°~114.50° E (as shown in Figure 1), characterized by a mid-temperate arid and semi-arid continental monsoon climate. The study area encompasses 28.88 km2 of typical desert steppe ecosystem, representing a characteristic sample of this vegetation type within the NFYS region. The mean annual precipitation ranges from 100 to 350 mm, with the majority occurring between June and September. The average evaporation rate is 2227.3 mm, which is 5–10 times the annual precipitation. The mean annual temperature is 5.69 °C. The region is prone to frequent droughts, particularly in spring and summer. The terrain slopes gradually from south to north, with elevations ranging from 804 to 2072 m. The geomorphological structure is predominantly composed of low mountains, hills, and undulating plateaus, forming a step-like spatial distribution [32].

2.2. Data and Processing

The meteorological and GPP data utilized in this study are comprehensively presented in Table 1. The daily maximum temperature, minimum temperature, and precipitation data acquired are the basis for calculating the extreme climate indices.
The reliability of ERA5 meteorological data was systematically evaluated through comprehensive validation against in situ observations from three representative meteorological stations within the desert meadow ecosystem of the NFYS region: Darhan (Station ID: 53352), Erenhot (Station ID: 53068), and Mandula (Station ID: 53149). The validation metrics revealed strong consistency between the ERA5 data and ground-based measurements, with Nash-Sutcliffe Efficiency (NSE) values consistently surpassing 0.98 for temperature parameters (including maximum and minimum temperatures) and maintaining values above 0.63 for precipitation data (Figure S1 of supporting document). For future climate trend analysis, this study utilizes CMIP6 meteorological data under two representative emission scenarios (SSP2-RCP4.5 and SSP5-RCP8.5), which were obtained from the National Tibetan Plateau Data Center [33].
The GOSIF-GPP dataset spanning from 2001 to 2023 was obtained from the global high-resolution Gross Primary Productivity (GPP) product developed through the Orbiting Carbon Observatory-2 (OCO-2) satellite observations [34]. This advanced dataset incorporates eight distinct SIF-GPP conversion algorithms, which have been rigorously validated at both site-specific and pixel levels, demonstrating exceptional performance in global GPP estimation. Furthermore, the accuracy of the GOSIF-GPP dataset was systematically evaluated using eddy covariance flux measurements from the Darhan Maominghan Joint Banner experimental site [35]. The validation results, as illustrated in Figure S2 of the supplementary document, reveal strong consistency between the datasets, with a Pearson correlation coefficient of 0.82, confirming the reliability of the GOSIF-GPP data in representing actual carbon flux dynamics.

2.3. Extreme Climate Indices

This study utilizes the definitions of 27 Extreme Climate Indices (ECIs) established by the Expert Team on Climate Change Detection and Indices (ETCCDI) (http://etccdi.pacificclimate.org/list_27_indices.shtml, accessed on 22 July 2024), to analyze extreme climate events in the NFYS region between 2001 and 2023, based on daily meteorological data processed from ERA5 hourly meteorological data of ERA5 Climate and Forecast (CF) Metadata Convention v1.7 (https://cds.climate.copernicus.eu/, accessed on 22 July 2024). These ECIs are systematically classified into three distinct categories: intensity indices, duration indices, and frequency indices [36]. The specific classification criteria are detailed in Tables S1 and S2 of the supplementary document. To analyze trends in ECI and GPP, this study employs the Mann-Kendall test and Theil-Sen Median trend analysis, both of which are non-parametric statistical methods [37]. The trends are quantified by the β and Z values, where β represents the magnitude of the trend and Z indicates the statistical significance. Specifically, a positive β value (β > 0) signifies an increasing trend, while a negative β value (β < 0) indicates a decreasing trend. Since β values are rarely exactly zero, trends with β values between −0.001 and 0.001 are classified as stable [38]. At the 0.05 significance level, trends are categorized as statistically significant if |Z| ≥ 1.96 and non-significant if |Z| < 1.96 [39]. Based on the combination of Z and β values, trends are further classified into five distinct levels: significant decrease, decrease, stable (less change), increase, and significant increase.
The Pearson correlation coefficient was utilized to quantify the lag effect of GPP in response to climate variability. The calculation is formulated as follows:
R j = c o r ( I n d e x t j , G P P ) , 0 j 3 R m a x = max R j = R t p , 0 t p 3
In which, I n d e x t j represents the value of the index at month t with a lag of j months, R j denotes the correlation coefficient at month t with a lag of j months, and R m a x represents the maximum correlation coefficient when the lag time ranges from 0 to 3 months.

2.4. Response Mechanism Analysis

Random forests and partial least squares regression (PLSR) are two widely used machine learning and statistical methods that have proven effective in understanding the response mechanisms of eco-hydrological processes [40]. The random forest algorithm is particularly advantageous for handling high-dimensional data, reducing overfitting, and capturing complex, non-linear relationships between predictors and response variables. In addition, the accuracy of the model was further verified by the LOOCV method (Figure S3 and Table S3 of the supplementary document). PLSR is a regression technique that combines principles from principal component analysis and multiple linear regression. It is particularly useful when dealing with multicollinearity among predictor variables, as it projects both predictors and response variables into a new latent variable space, maximizing the covariance between them [41]. In this study, the random forest model is utilized to analyze the impact of climate extremes on vegetation productivity.

3. Results

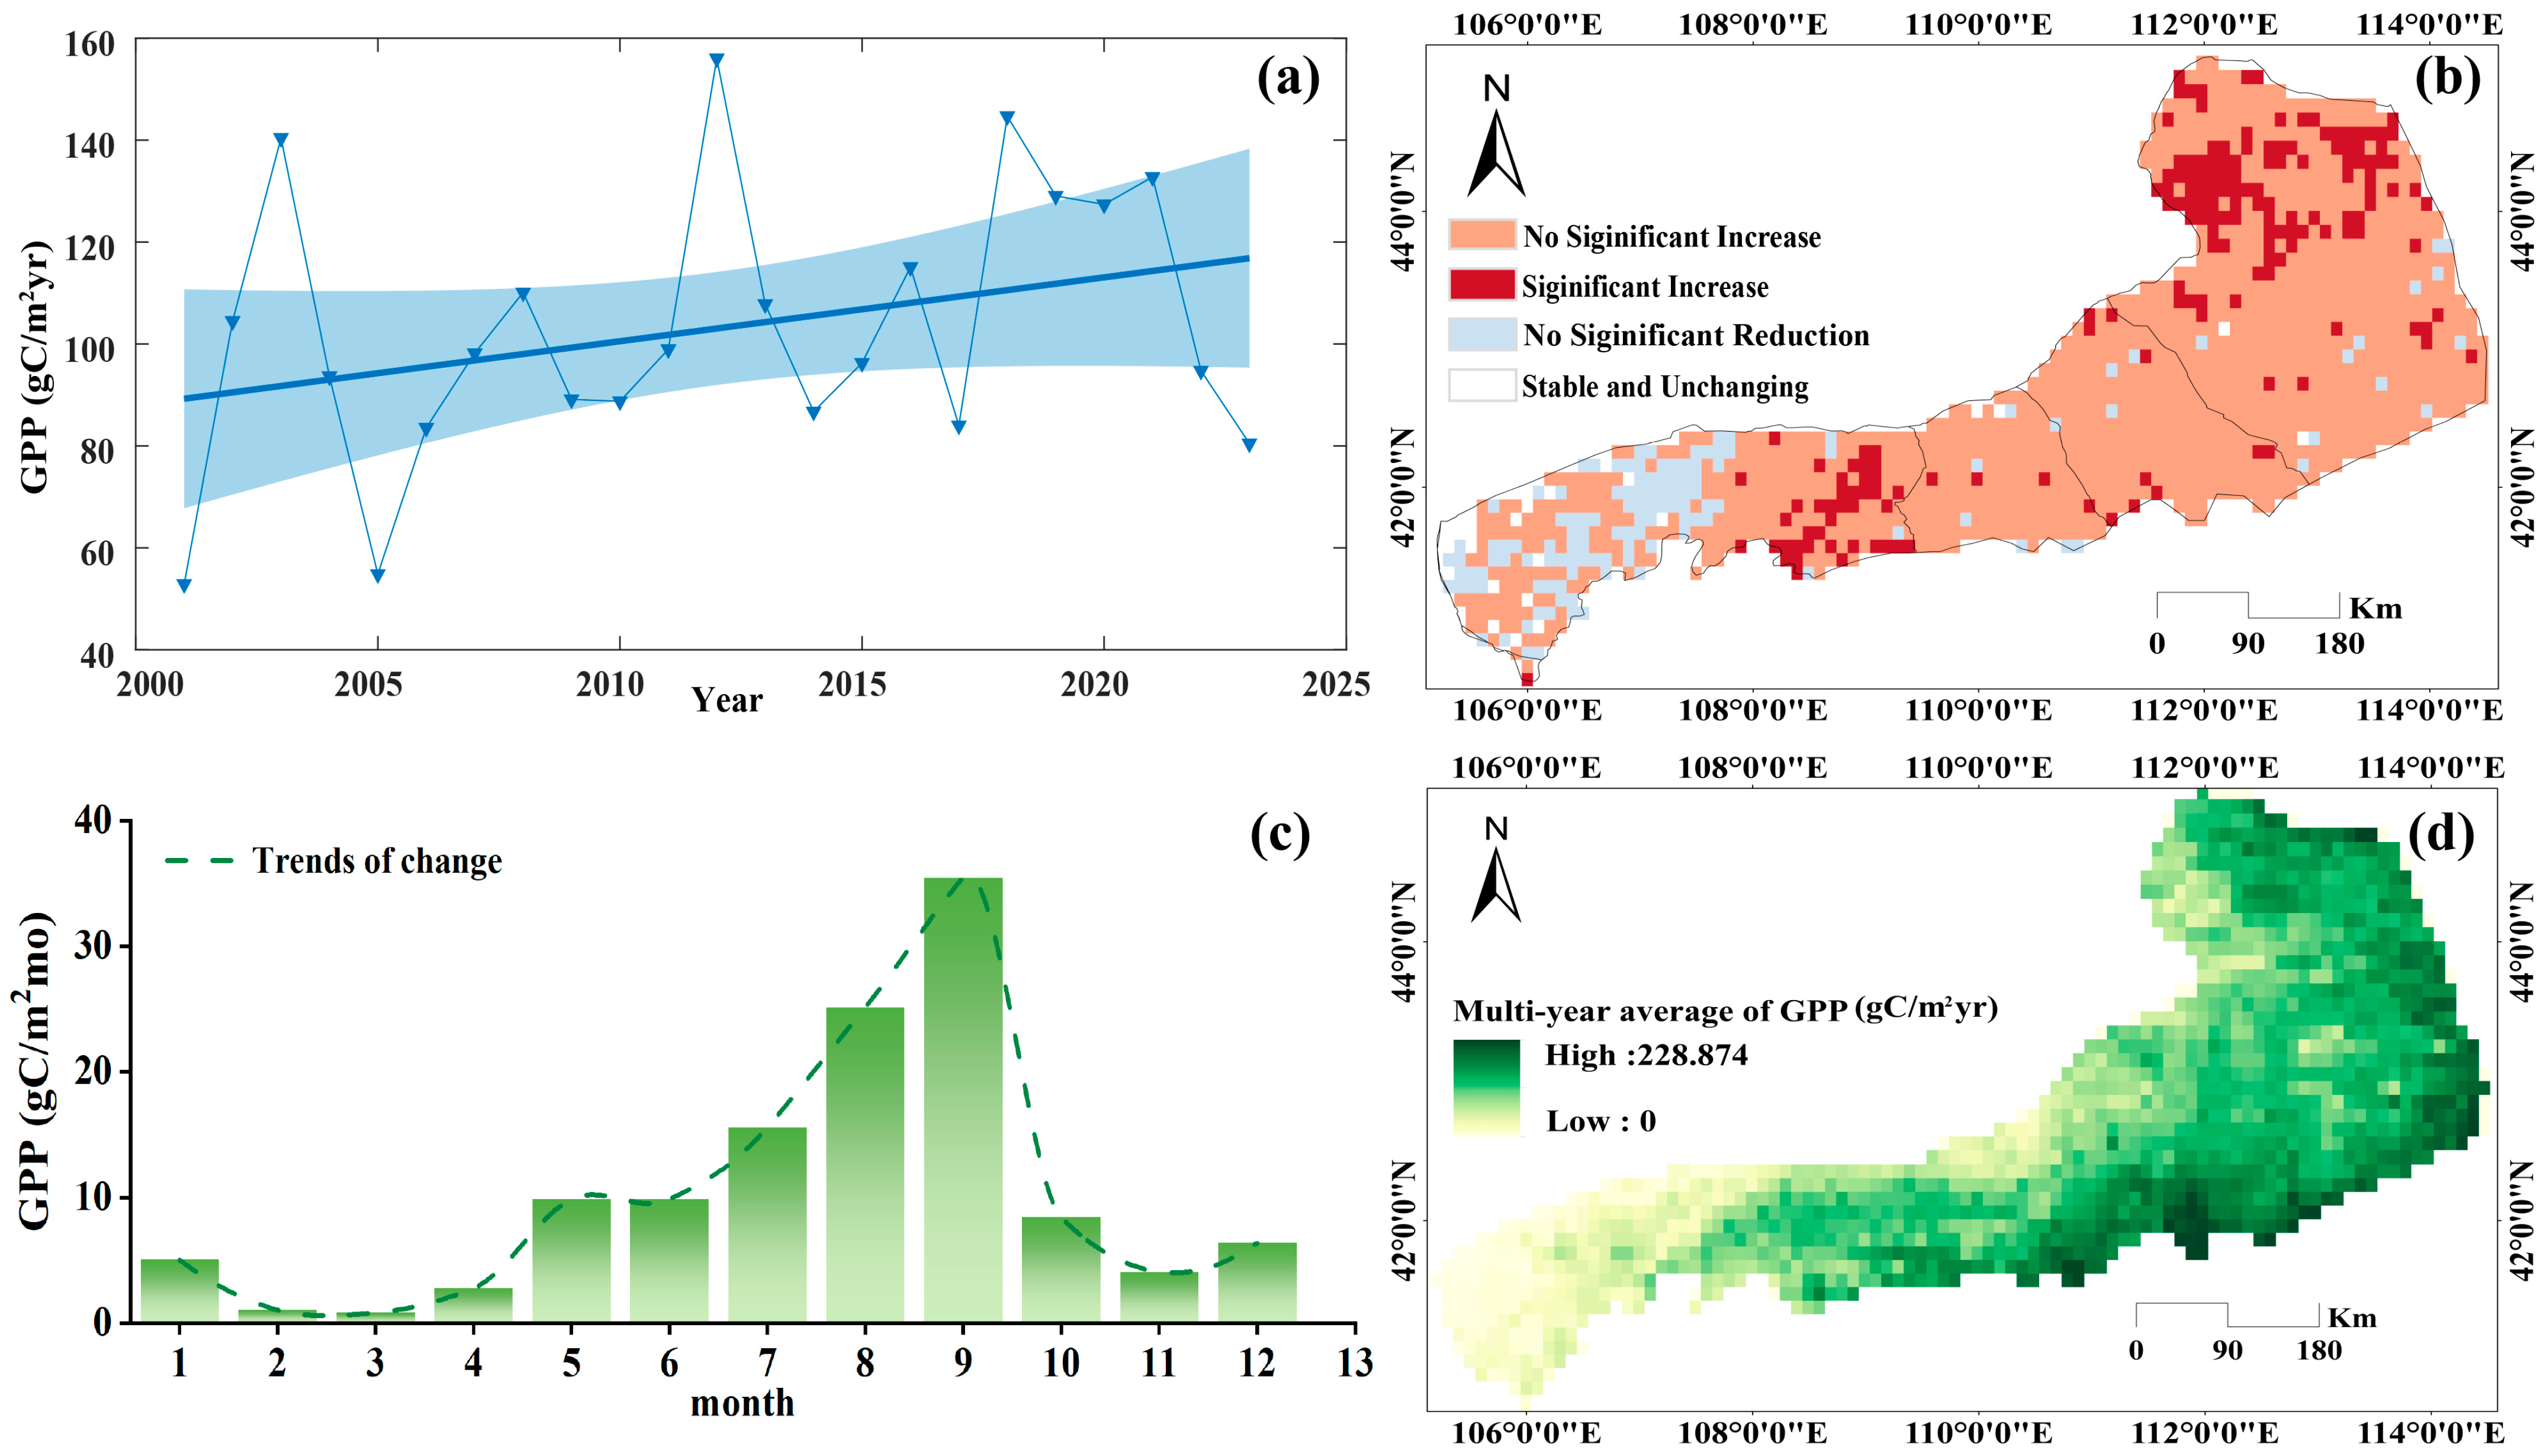
3.1. Spatiotemporal Distribution of GPP

Figure 2 presents the spatiotemporal patterns of annual and monthly GPP in the desert steppe ecosystem of the NFYS region during 2001–2023. The analysis reveals several key spatial and temporal patterns of GPP dynamics: (1) The study area exhibits a mean annual GPP of 100.45 g C/m2/yr, showing a distinct southeast-to-northwest decreasing gradient, with an overall significantly increasing trend at a rate of 1.25 g C/m2/yr (p < 0.05); (2) Temporally, GPP demonstrates strong seasonality, with approximately 85–90% of annual productivity occurring during the growing season from April to October; (3) Spatially, 88.65% of the study area shows increasing GPP trends, comprising 76.5% with non-significant increases and 12.1% with statistically significant increases (p < 0.05), predominantly clustered in the central-western and northeastern sectors of NFYS; (4) Conversely, 9.1% of the total area, mainly located in the western NFYS, exhibits non-significant decreasing trends, potentially attributable to its transitional ecotone characteristics between desert steppe and desert biomes, where vegetation is more sensitive to environmental stressors.

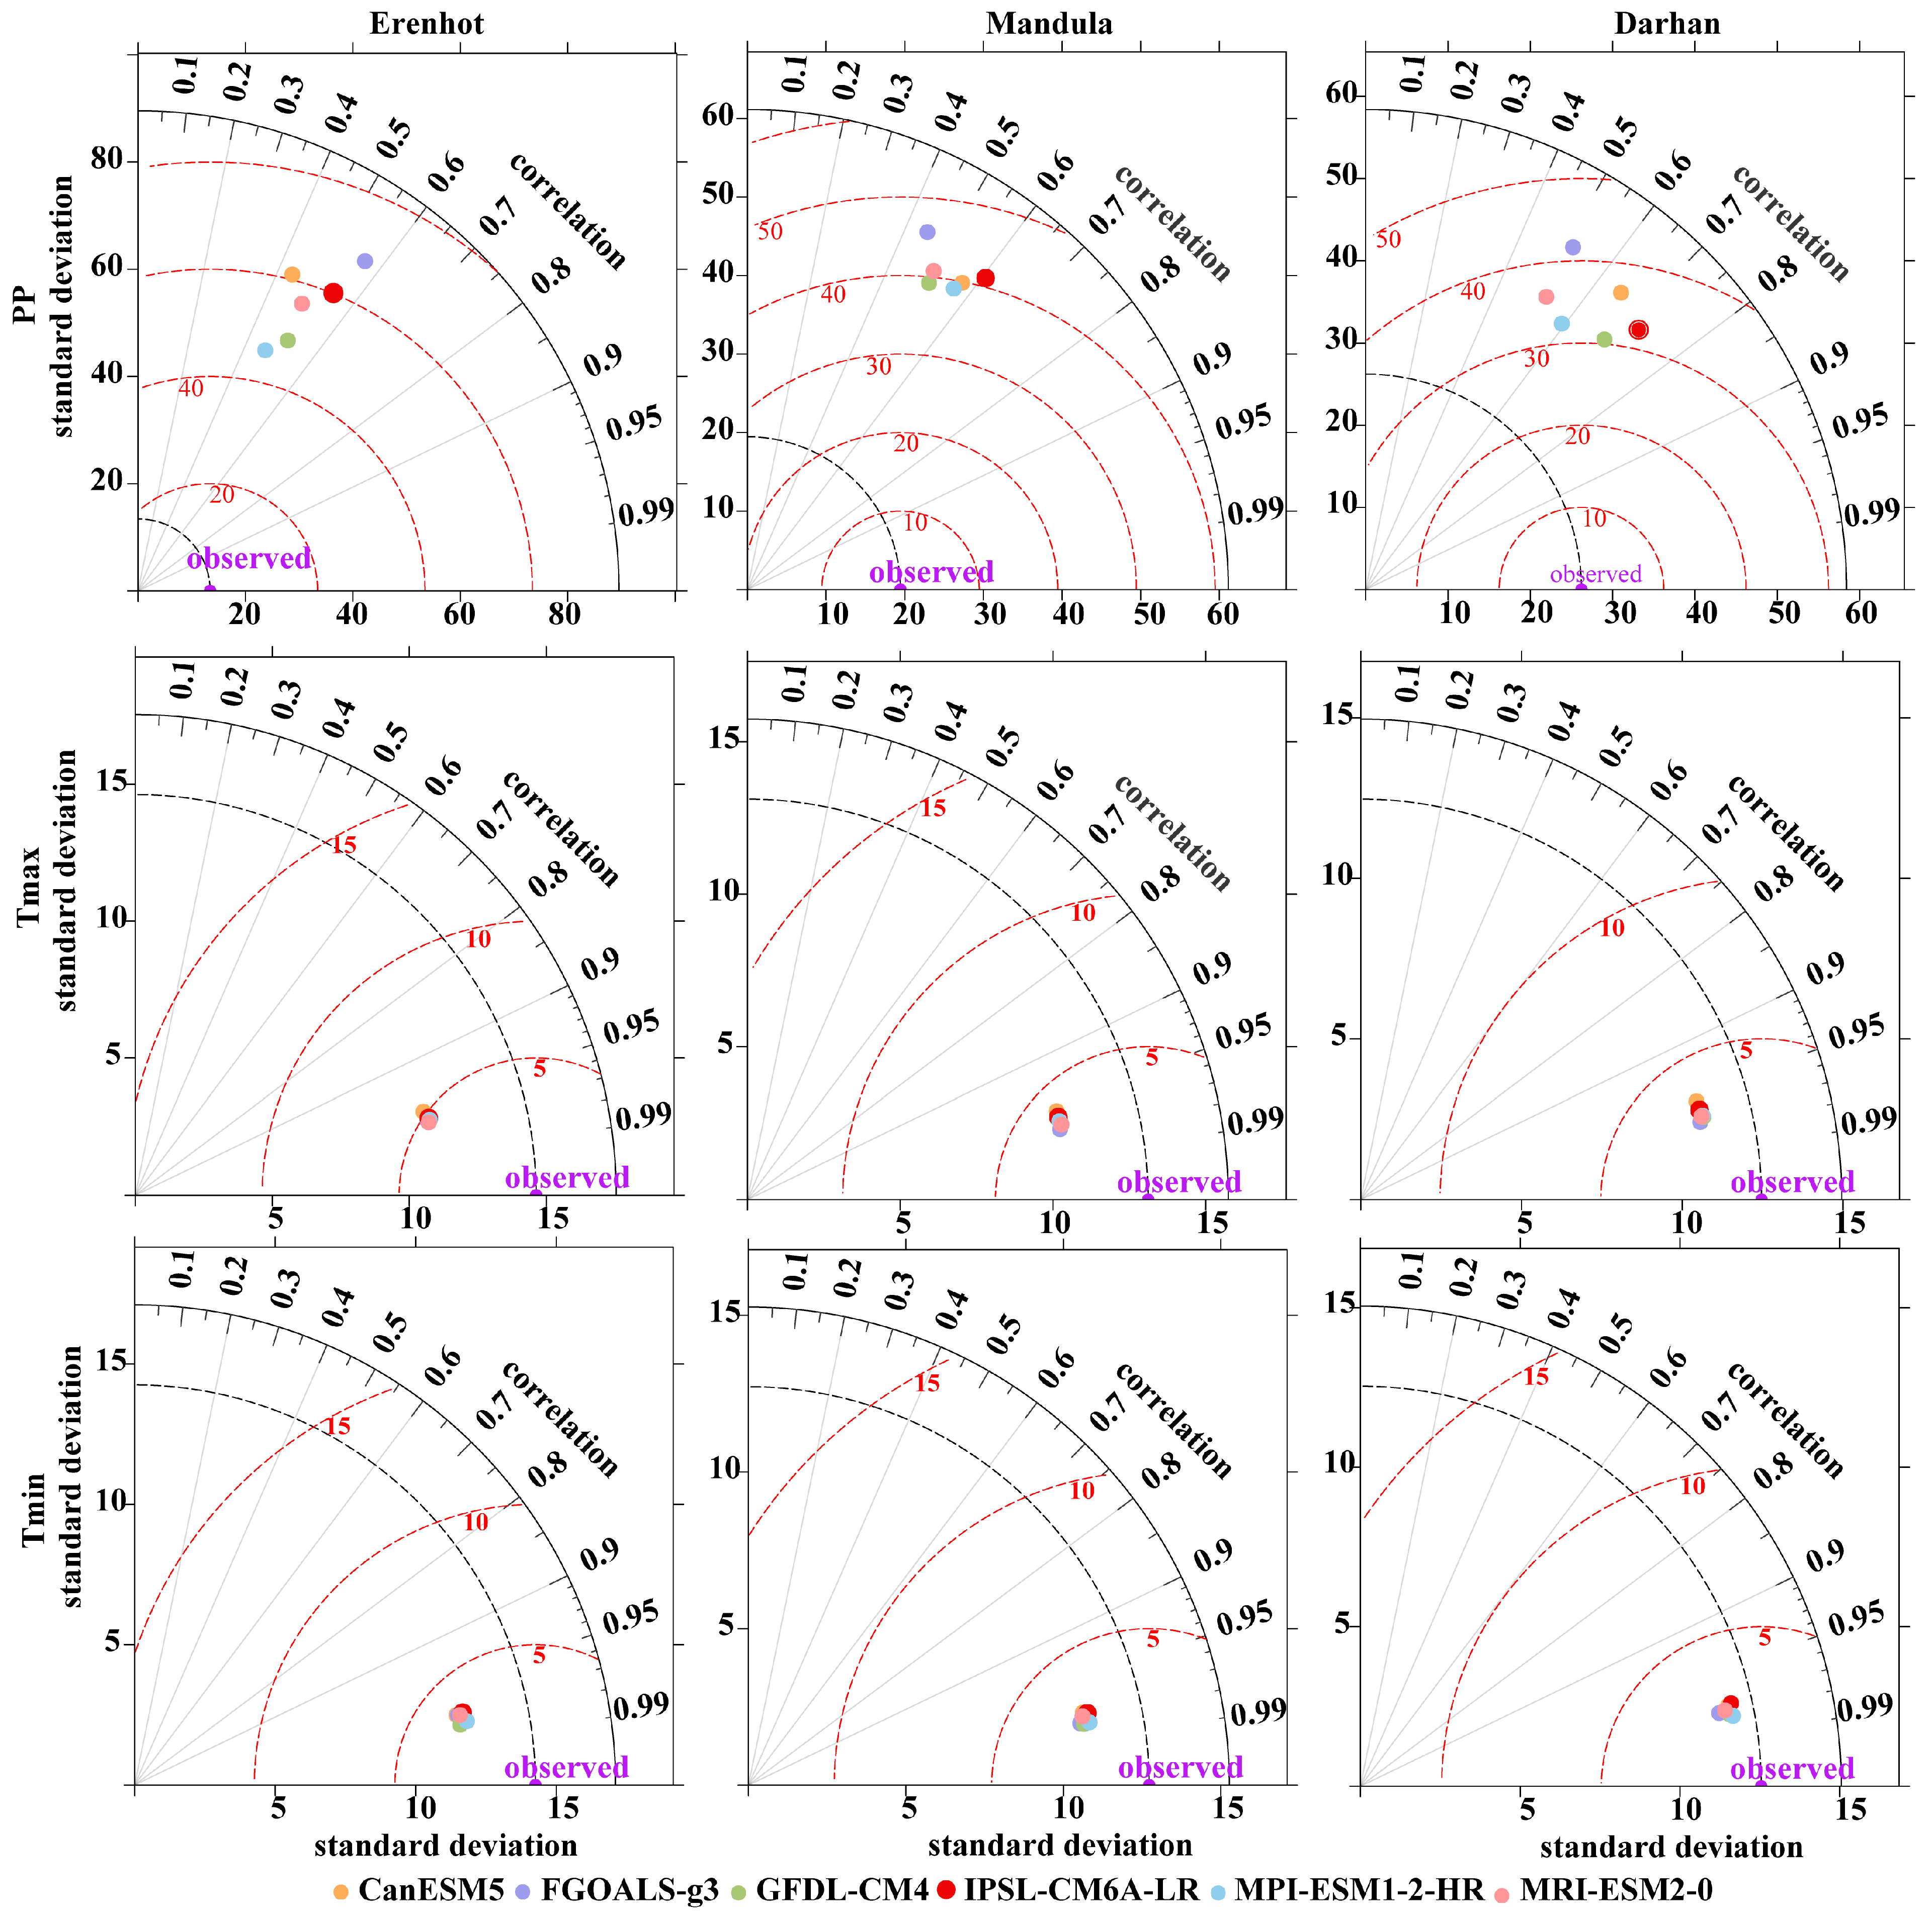
3.2. Spatiotemporal Distribution of Normal and Extreme Climate Indices

3.2.1. Temporal Variation Characteristics

The interannual variation of normal climatic and extreme factors in the desert steppe of the NFYS from 2001 to 2023 was shown in Figures S3–S5 of the supplementary document. During the observed period, the desert steppe of the NFYS demonstrated a pronounced trend toward warmer and drier conditions. Notably, the maximum temperature (Tmax) and minimum temperature (Tmin) exhibited upward trends, increasing at rates of 0.046 °C per year and 0.031 °C per year, respectively. Concurrently, the total annual precipitation (PP) displayed a downward trajectory, declining at a rate of 2.41 mm annually (Figure S3 of the supplementary document).
As Tmax and Tmin increase, the extreme temperature indices exhibit a distinct trend characterized by a gradual rise in maximum temperature extremes and a corresponding decline in minimum temperature extremes, as illustrated in Figure S4 of the supplementary document. With upward trends of TXx (Max Tmax) and TNx (Max Tmin), and decline trends of TXn (Min Tmax) and TNn (Min Tmin), the DTR (Daily temperature range) demonstrates a significantly increasing trend at a rate of 0.01 °C/yr. The study also identified significant changes in temperature-related indices. The GSL (Growing season length) showed the most substantial increase at 0.38 d/yr, followed by CSDI (cold spell duration index) at 0.32 d/yr and WSDI (warm spell duration index) at 0.06 d/yr. These comprehensive observations collectively indicate a pronounced shift towards warmer climatic conditions in the NFYS desert steppe, characterized by increasing high-temperature events and decreasing cold-temperature occurrences, providing strong evidence of ongoing climate warming in the region.
As precipitation gradually decreases, the extreme precipitation indices show a certain downward trend, as illustrated in Figure S5 of the supplementary document. These findings demonstrate a consistent reduction in both total precipitation amounts and precipitation intensity within the desert steppe of the NFYS. The simultaneous increase in CDD coupled with decreases in various precipitation indices strongly suggests an intensification of regional aridification trends during the study period. This pattern of declining precipitation metrics, particularly the reduction in extreme precipitation events, indicates a shift towards drier conditions in the region.

3.2.2. Spatial Variation Characteristics

As illustrated in Figure S6 of the supplementary document, the study area has experienced a pronounced warming and drying trend over the 23-year observation period. Spatial analysis reveals that only 3.7% of the northeastern part of NFYS demonstrates a non-significantly increasing trend in total precipitation (PP). Notably, both maximum temperature (Tmax) and minimum temperature (Tmin) display consistent upward trends throughout the study area, with Tmin showing statistically significant increases in 0.7% of the total area.
The spatial distribution of extreme temperature indices, as depicted in Figure S7 of the supplementary document, reveals distinct regional patterns. The number of icing days (ID0) demonstrates a significant decreasing trend, with particularly pronounced reductions observed in the southern and northeastern sectors, collectively accounting for 35.17% of the total study area. Analysis of thermal indices, including summer days (SU25), tropical nights (TR20), growing season length (GSL), and warm nights (TN90p), indicates that regions experiencing significant temperature increases are predominantly concentrated in the northwestern and central portions of the study area. Spatial distribution patterns of most other indices exhibit either non-significantly increasing or decreasing trends. Notably, the study area demonstrates an overall increasing trend in both high-temperature and extremely high-temperature events, with the western region showing significantly greater warming rates compared to the eastern sector. This spatial disparity in warming trends may be attributed to the relatively lower vegetation coverage characteristic of the western areas.
The spatial trend distribution of the extreme precipitation index (Figure S8 of the supplementary document) shows that the precipitation in the central and southern parts of the study area shows a significant decreasing trend, with the central and southern parts of the study area decreasing most significantly, and the northeast of study area showing a non-significantly increasing trend. As shown by the extreme precipitation indices PRCPTOT, RX1day, RX5day, R95p, R99p; The number of heavy rain days R20 and heavy rain days (R25) in the study area showed a significant downward trend in the central and southern part of the study area, accounting for 7.1% and 4.2% of the study area, respectively.

3.3. Response Mechanism of GPP to Extreme and Normal Climate Conditions

3.3.1. Temporal Lag Effects of GPP on Extreme and Normal Climate Indices

The correlations and lag effects between GPP and normal climatic factors (Tmax, Tmin, PP) as well as 27 Extreme Climate Indices (ECI) from 2001 to 2023 are illustrated in Table 2, Table 3 and Table 4. In these tables, “0” denotes the correlation between the original GPP and each variable, whereas “1–3” indicates the correlations with a lag of 1 to 3 months, respectively. The results reveal that GPP exhibits varying degrees of lag in response to both normal and extreme climatic conditions. For normal climatic conditions, GPP demonstrates a 2-month lag in response to the normal climatic factor precipitation (PP) and a 1-month lag to maximum temperature (Tmax), whereas its response to minimum temperature (Tmin) is more immediate, as shown in Table 2.
Regarding ECI, GPP exhibits immediate responses to most extreme temperature indices (Table 3), except for the Diurnal Temperature Range (DTR), which shows a 3-month lag, and the maximum daily maximum temperature (TXx) and maximum daily minimum temperature (TNx), which display lags of 2 months and 1 month, respectively.
In terms of extreme precipitation indices, GPP demonstrates varying lagged responses (Table 4): Consecutive Wet Days (CWD) and Consecutive Dry Days (CDD) exhibit the strongest response at 0 months, whereas moderate precipitation days (R10), extreme heavy precipitation (R99p), and the maximum 5-day precipitation (RX5day) show a 1-month lag. Additionally, heavy precipitation days (R20), very heavy precipitation days (R25), total precipitation (PRCPTOT), heavy precipitation (R95p), and the maximum 1-day precipitation (RX1day) display a 2-month lag. The longest lag time, 3 months, is observed for daily precipitation intensity (SDII).

3.3.2. Response Mechanism of GPP to Climate Change

To further elucidate the response mechanisms of GPP to climatic change in the desert steppes of the NFYS from 2001 to 2023, this study utilized a random forest model. The model identified normal climatic factors and extreme climate indices that collectively explain 76.82% of the variance in GPP, with the overall results passing the 1% significance level test. Among these, maximum temperature (Tmax), minimum temperature (Tmin), and the index ID0 were found to be significant at the 99% confidence level (p < 0.01), while the TX90p and TN90p were significant at the 95% confidence level (p < 0.05), as depicted in Figure 3a. Building on this foundation, a Partial Least Squares Structural Equation Modeling (PLS-SEM) approach was employed to develop a GPP estimation structural equation model based on normal climatic factors and Extreme Climate Indices (ECI). The model was constructed to account for both the original state and lag effects, yielding goodness-of-fit values of 0.76 and 0.66, respectively, as illustrated in Figure 3b.
The absolute values of the loadings for the observed variables (e.g., Tmax, TN90p, ID0) associated with each latent variable (normal climate conditions (ATM), extreme temperature conditions (ETI), and extreme precipitation conditions (EPI)) were relatively high, indicating robust explanatory power of the observed variables for their corresponding latent variables. In both the structural equation models (without considering lag effects and with lag effects of individual indices on GPP), the ATM, composed of Tmax, Tmin, and PP, exhibited a significant positive impact on GPP. Conversely, the ETI and EPI demonstrated a notable negative impact on GPP. In the model incorporating lag effects, the positive influence of normal climate conditions on GPP was smaller compared to the model without lag effects, while the negative influence of extreme climate conditions on GPP was more pronounced. This suggests that extreme climate conditions exert a cumulative and amplified influence on vegetation over time.

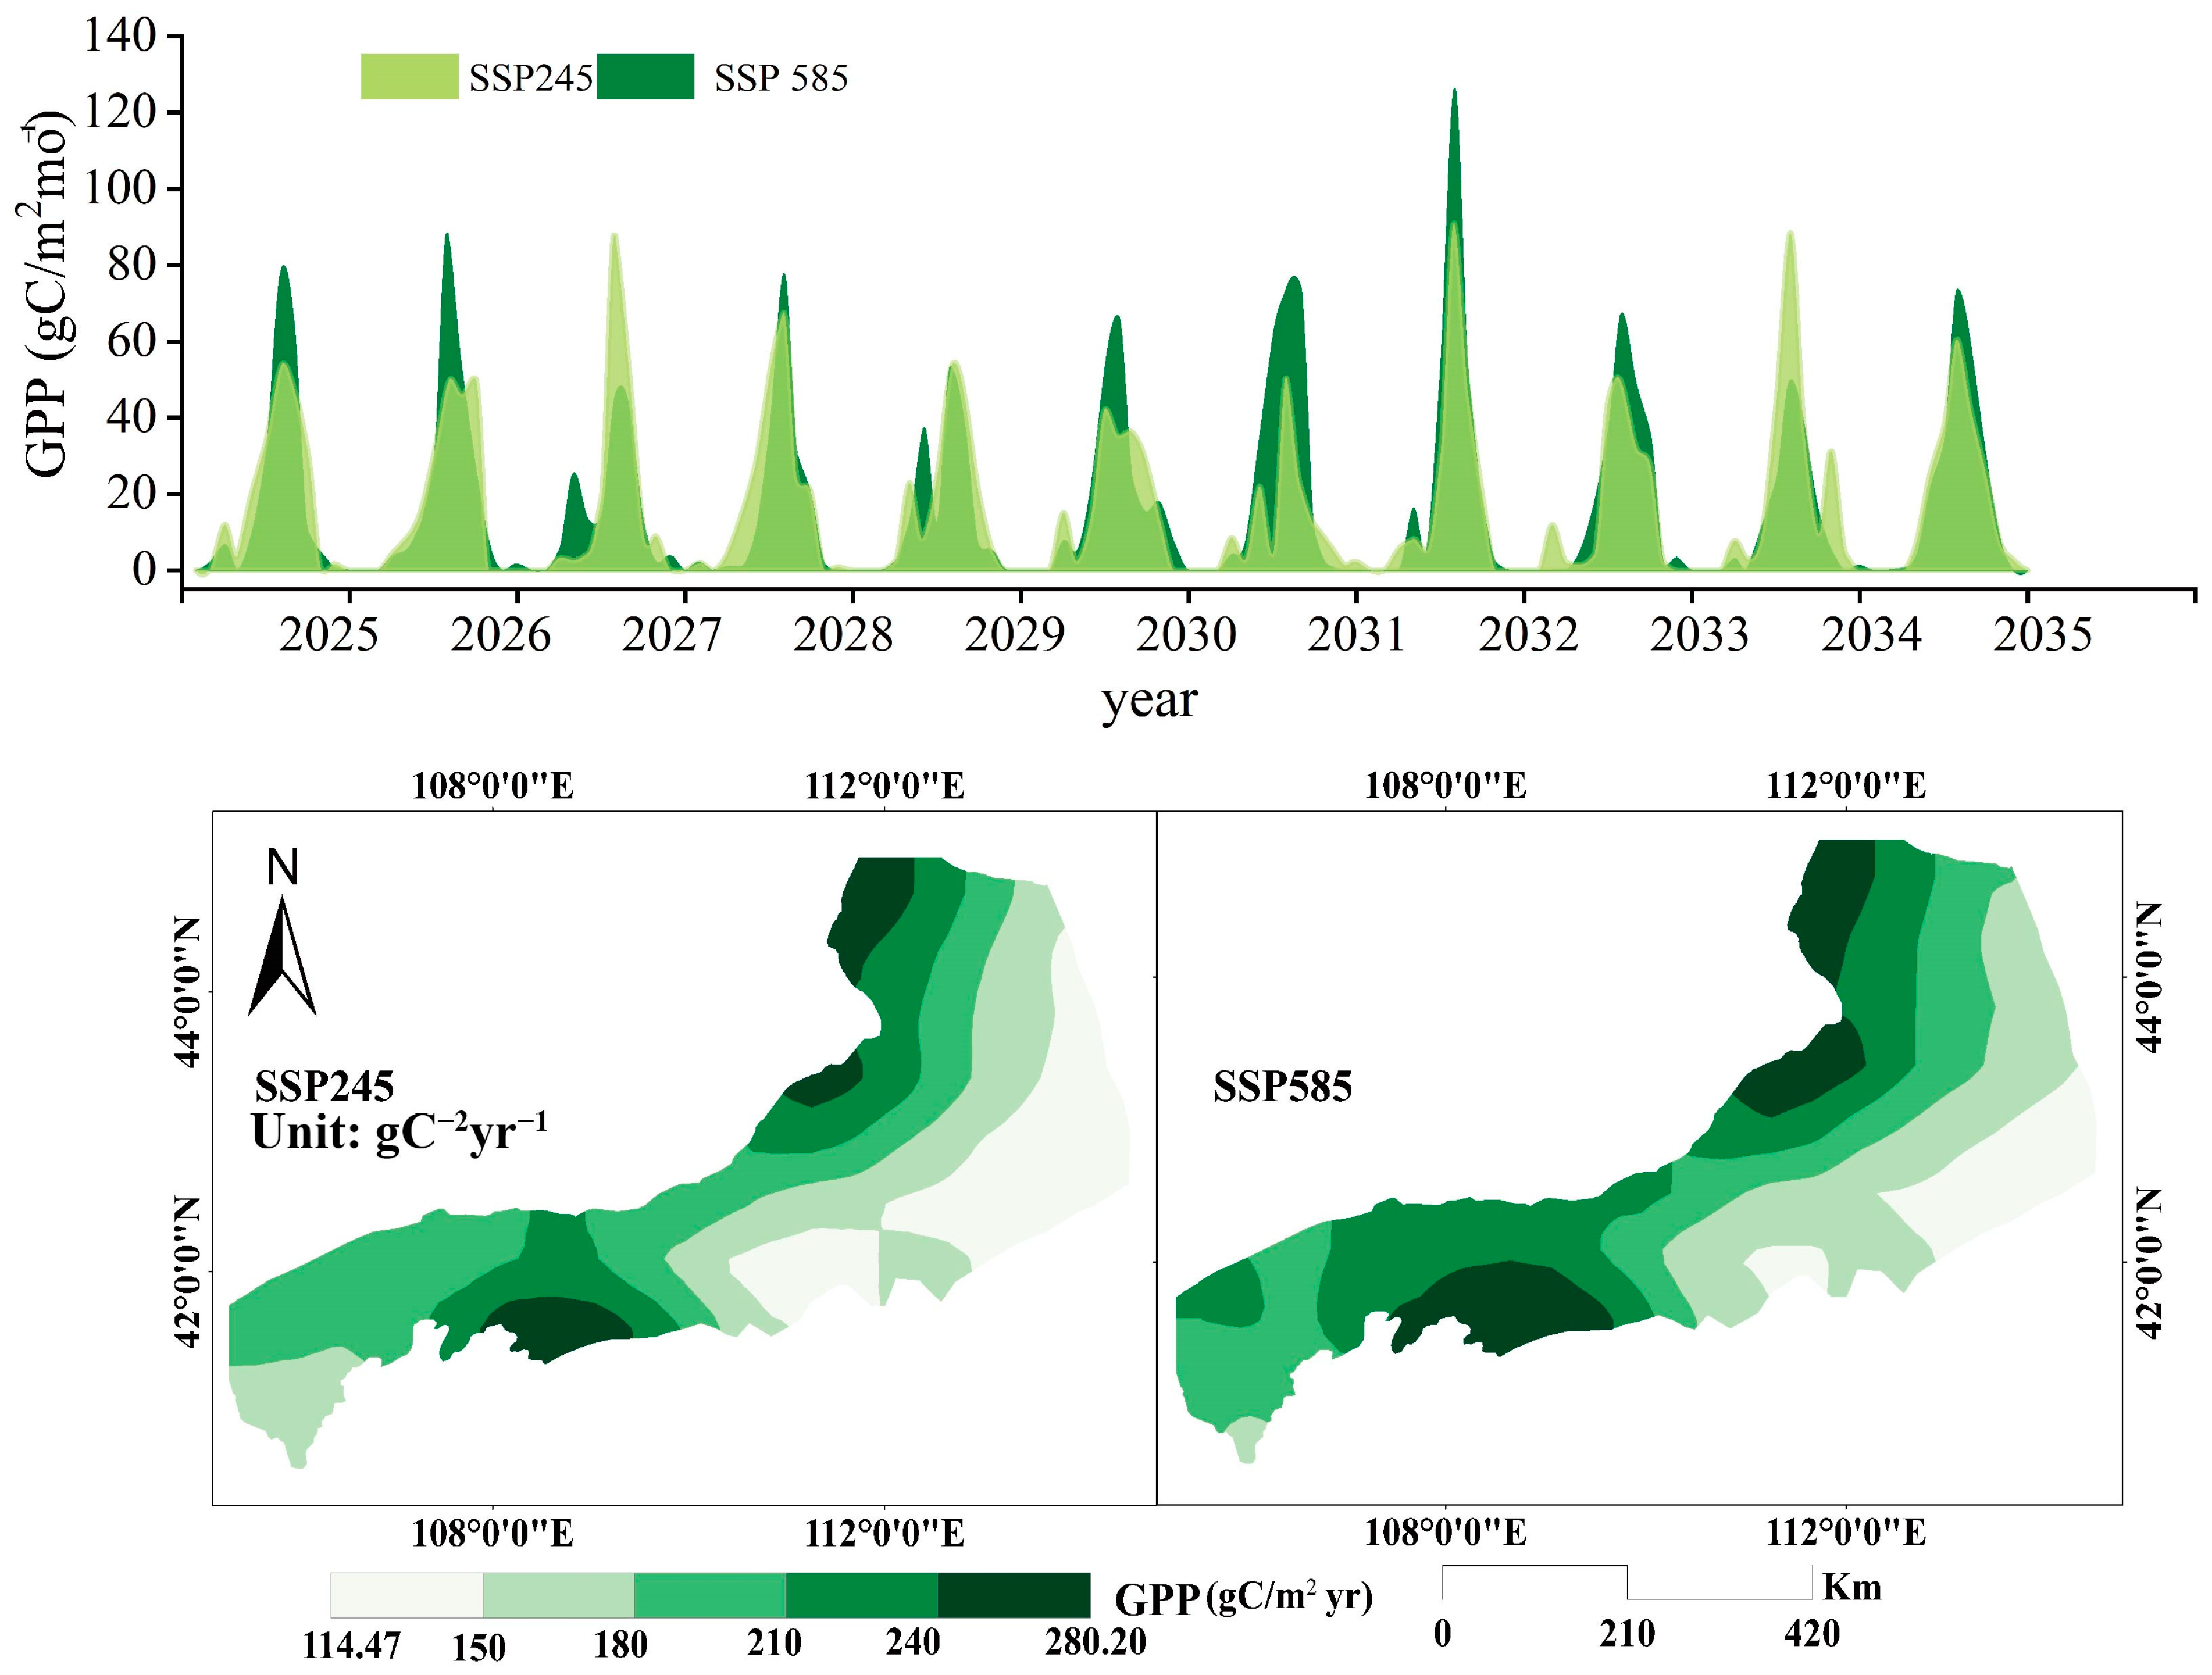
3.4. Spatiotemporal Distribution Trends of GPP Under CMIP6 Climate Change Scenarios

Based on the response mechanisms of GPP to climate change, this study further investigates the spatiotemporal distribution characteristics of GPP under the CMIP6 global climate change scenarios. To identify the most suitable future climate change model for the desert steppe region in NFYS, a fitting analysis was performed between historical monthly Tmax, Tmin, and PP data from 2001 to 2014, obtained from six CMIP6 climate models (CanESM5, FGOALS-g3, GFCL-CM4, IPSL-CM6A-LR, MPI-ESM1-2-HR, MRI-ESM2-0), and observed datasets. The results, as depicted in Figure 4, reveal that the correlation coefficients for both Tmax and Tmin between each climate model and the observed data surpassed 0.95. This indicates a remarkable level of consistency and analogous variability between the model simulations and the actual observed records. Nonetheless, in the realm of precipitation data, the IPSL-CM6A-LR model stood out as the sole model exhibiting a robust linear relationship with the observed data. In light of these validation results across different meteorological variables, this research has opted to utilize the daily maximum temperature, minimum temperature, and precipitation data from the IPSL-CM6A-LR model as the cornerstone dataset for projecting future Extreme Climate Indices (ECI) and GPP.
Utilizing the IPSL-CM6A-LR climate model, this study investigates the trends in normal climate conditions and Extreme Climate Indices (ECI) in the desert steppe of the NFYS under two representative scenarios: SSP2-RCP4.5 (moderate radiative forcing) and SSP5-RCP8.5 (high radiative forcing). As illustrated in Figure 5, the regional normal climate conditions reveal a pronounced trend toward warming and increased humidity in the study area from 2025 to 2035. Specifically, the number of warm nights (TN90p) demonstrates a significantly increasing trend, while warm days (TX90p), frost days (ID0), and heavy precipitation days (R25) all show declining trends. Notably, under the SSP2-RCP4.5 scenario, the number of consecutive dry days (CDD) is projected to increase, whereas under the SSP5-RCP8.5 scenario, this extreme index is expected to decrease.
Based on the path coefficients and weights derived from the partial least squares regression model without considering lag effects (Figure 6), it is evident that the GPP of the desert steppe in the NFYS is significantly higher under the SSP5-RCP8.5 scenario (198.87 gC/m2yr) compared to the SSP2-RCP4.5 scenario (184.69 gC/m2yr). Under the influence of both normal and extreme climate conditions, the rates of change in GPP under the SSP2-RCP4.5 and SSP5-RCP8.5 scenarios are 0.009 gC/m2yr and 0.021 gC/m2yr, respectively.

4. Discussion

4.1. Insights from the Dynamic Tendency of GPP and Climate Change

The findings of this study demonstrate a significant overall increasing trend in GPP, exhibiting a clear southeast-to-northwest decreasing gradient, with non-significant decreasing trends detected in the western part of the study area. Research indicates that the implementation of ecological projects such as the “Three Norths” shelterbelt plan may be the fundamental reason why GPP still maintains an increasing trend in the NFYS region under the trend of dry heating [42,43,44]. Due to more favorable hydrothermal conditions and vegetation topography in the eastern regions compared to the west, GPP exhibits a clear decreasing gradient from east to west [45,46]. Notably, significantly low GPP values were observed in 2005 and 2014, primarily driven by severe drought events [47]. Furthermore, the western part of the study area, located at the transition zone between desert steppes and desert, is characterized by greater ecological fragility and heightened sensitivity to climate change, leading to less pronounced GPP trends compared to the eastern regions [48].
Numerous studies have consistently shown a global decline in frost days (FD0) and ice days (ID0), accompanied by a significant increase in extreme high-temperature frequency and intensity indices [8]. These findings provide robust evidence supporting the prevailing trend of warming and drying in the study area. Specifically, the region has experienced a marked increase in warm days (TX90p) and warm nights (TN90p), while cold days and nights have shown a decreasing trend, consistent with observations across most regions of China [49]. Notably, the decline rate of light rain days (R10) (−0.07 d/yr) substantially surpasses that of moderate rain days (R20) (−0.02 d/yr) and heavy rain days (R25) (−0.01 d/yr), indicating a shift toward more frequent moderate and heavy precipitation events. This observed pattern may be attributed to enhanced atmospheric instability and significant alterations in aerosol concentrations, which warrant further investigation to better understand the underlying mechanisms.

4.2. Response Mechanism of GPP to Climate Change

Vegetation responses to changes in hydrothermal conditions often exhibit temporal asynchrony, demonstrating distinct lag effects and cumulative impacts over time. Notably, monthly-scale analyses have been shown to provide a more precise characterization of vegetation-climate interactions compared to annual or seasonal scales [50,51]. Consequently, this study adopts a monthly temporal resolution to investigate vegetation responses to both normal and extreme climatic conditions. While precipitation primarily influences vegetation dynamics through soil moisture mediation [52,53], extreme climatic events exert relatively limited negative effects on GPP. The observed GPP variations are predominantly driven by normal climatic factors, with desert steppes exhibiting a positive feedback relationship between mean precipitation and GPP, contrasted by a negative feedback relationship with mean temperature [43,54]. Recent research by Pan et al. [10] has revealed that concurrent anomalies in temperature and precipitation can exert more substantial impacts on terrestrial ecosystem carbon fluxes than isolated extreme events, highlighting the critical need for further investigation into multifactorial interactions.
The increasing frequency of extreme high-temperature events enhances surface evaporation and transpiration rates, potentially inducing vegetation stress through the inhibition of root physiological functions [55,56]. This mechanistic understanding explains the more immediate vegetation response to extreme temperature events compared to extreme precipitation events. The NFYS desert steppes are characterized by three dominant soil types: Kastanozem, Calcisol, and Arenosol [57], all exhibiting limited water retention capacity. Analysis of the 2001–2023 period reveals a declining trend in the intensity, frequency, and duration of extreme precipitation events, suggesting that vegetation growth requires the cumulative effect of multiple extreme precipitation occurrences. Furthermore, this study identifies that the lagged response of GPP to climatic conditions diminishes the positive influence of normal climate conditions while amplifying the negative impacts of extreme conditions. This finding underscores the long-term cumulative effects of extreme climatic conditions on vegetation, resulting in increasingly pronounced ecological consequences over time.

4.3. Future Trends of Variation

Projections for the next decade indicate that under both SSP2-RCP4.5 and SSP5-RCP8.5 scenarios, the desert steppe of NFYS will experience a gradual increase in Tmax, Tmin, and PP, transitioning from a warm-drying to a warm-wetting trend. This climatic shift is expected to drive an upward trajectory in GPP, with projected mean values under both emission scenarios surpassing the historical GPP baseline. Desert steppe vegetation has evolved a certain degree of resistance to stress in the long-term harsh growth environment, which can indirectly enhance the adaptability and resilience of desert steppe ecosystems, and effectively cope with the challenges brought by temperature fluctuations during the growing season. This adaptive mechanism further increases the productivity of desert steppe vegetation [58].
While this study demonstrates high confidence levels and employs partial least squares regression to mitigate multicollinearity issues, certain limitations persist. The latent variable construction process may attenuate individual factor lag effects on GPP, resulting in an integrated effect that reduces the explanatory power of lag-incorporated GPP and extreme climate response models compared to their non-lag counterparts. As a comprehensive indicator of regional productivity, GPP is influenced not only by climatic conditions but also by multiple interacting factors including CO2 concentration, soil nutrient dynamics, and anthropogenic activities [45,59]. However, the current understanding remains constrained by data limitations and inherent uncertainties in climate model projections of extreme weather events. These challenges complicate the assessment of future terrestrial carbon cycle-extreme weather relationships and the corresponding climate change feedback mechanisms.

5. Conclusions

This study systematically investigated the spatiotemporal dynamics of gross primary productivity (GPP) and its responses to normal and extreme climatic conditions in the desert steppe of NFYS during 2001–2023. The lagged responses of GPP to historical climate variations and its potential responses to future climate scenarios derived from CMIP6 projections were analyzed based on the random forest and partial least squares regression models. The conclusions were drawn as follows:
The GPP in the desert steppe of NFYS exhibited a significantly increasing trend (p < 0.05) at a rate of 1.25 g C/m2/yr, displaying a distinct spatial gradient with higher values in the southeast gradually decreasing toward the northwest. Notably, 88.65% of the statistically significant growth areas (p < 0.05) were concentrated in the central-western and northeastern regions.
The region exhibited a pronounced warming and drying trend, characterized by decreasing precipitation and increasing temperatures during 2001–2023. The extreme climate characteristics show a significant increase in extremely high-temperature events and a relatively high frequency of heavy precipitation days.
Statistical analysis indicated strong correlations (r > 0.6) between GPP and over 90% of extreme climate indices. GPP exhibited immediate responses to temperature than to precipitation variations. In addition to the conventional Tmax, Tmin, and PP, ID0, TX90p, TN90p, CDD, and R25 are the most significant extreme climate indicators that affect GPP.
Future projections under both SSP2-RCP4.5 and SSP5-RCP8.5 scenarios indicate sustained GPP increases, with significantly higher values under the SSP5-RCP8.5 scenario compared to SSP2-RCP4.5. The hysteresis effect was found to amplify the inhibitory impacts of extreme weather on GPP through long-term cumulative processes while attenuating the promotive effects of average climate conditions.

Supplementary Materials

The following supporting information can be downloaded at: https://www.mdpi.com/article/10.3390/land14040884/s1.

Author Contributions

Methodology, Y.W. (Yongfang Wang); software, S.C.; validation, M.Z., E.G. and Y.W. (Yongfang Wang); formal analysis, M.Z., Y.W. (Yingjie Wu) and T.K.; resources, S.C.; data curation, M.Z., E.G. and S.C.; writing—original draft preparation, M.Z. and Y.W. (Yongfang Wang); writing—review and editing, S.Z., M.Z., Y.W. (Yingjie Wu) and T.K.; visualization, M.Z.; supervision, S.Z. and E.G.; review and editing, Y.W. (Yingjie Wu) and T.K.; funding acquisition, S.Z. All authors have read and agreed to the published version of the manuscript.

Funding

This research was funded by the IWHR Research & Development Support Program, grant number No. MKKH2024JK020 and No. MK0145B022021, First-Class Discipline Research Special Project, grant number YLXKZX-NSD-027, the Inner Mongolia Autonomous Region Science and Technology Support Program, grant number No. 2023JBGS0007, No. 2024MS04002, No. 2023YFSH0002, No. 2023MS05023, the Basic Scientific Research Business Fee of Directly-affiliated Universities in Inner Mongolia Autonomous Region, grant number No. BR231516, Inner Mongolia Autonomous Region’s Start-up Support Program Project for Returned Overseas Students’ Innovation and Entrepreneurship and the IWHR Internationally oriented Talents Program.

Data Availability Statement

The original contributions presented in this study are included in the article/Supplementary Materials. Further inquiries can be directed to the corresponding authors.

Acknowledgments

We would like to thank Shusen Wang from the Remote Sensing Center of Canada for review and editing, and validation.

Conflicts of Interest

The authors declare no conflicts of interest.

Abbreviations

The following abbreviations are used in this manuscript:
GPPGross Primary Productivity
NFYSthe Yinshan Mountains
AR6Sixth Assessment Report
ECIExtreme Climate Indices
Abbabbreviation
SRspatial resolution
TSTime Span
PLS-SEMPartial Least Squares Structural Equation Modeling
ETCCDIthe Expert Team on Climate Change Detection and Indices
CFClimate and Forecast

References

  1. IPCC. Climate Change 2023: Synthesis Report. Contribution of Working Groups I, II, and III to the Sixth Assessment Report of the Intergovernmental Panel on Climate Change; IPCC: Geneva, Switzerland, 2023. [Google Scholar]
  2. Qi, X.; Tang, Y.; Zhou, Y.; Li, D. A Comparison Study of Extreme Climate Changes in Different Areas in Northern China. Nat. Sci. 2017, 5, 79–87. [Google Scholar]
  3. Jiang, S.; Zhang, L.; Jing, Y.; Li, P.; Ren, X.; He, H. Spatial and Temporal Distribution Characteristics of Regional Extreme Climate Events in China from 1981 to 2015. Res. Soil Water Conserv. 2023, 30, 295–306. [Google Scholar]
  4. Li, X.; Ma, H.; Ran, Y.; Wang, X.; Zhu, G.; Liu, F.; He, H.; Zhang, Z.; Huang, C. Terrestrial carbon cycle model-data fusion: Progress and challenges. Sci. China Earth Sci. 2021, 64, 1645–1657. [Google Scholar] [CrossRef]
  5. Reichstein, M.; Bahn, M.; Ciais, P.; Frank, D.; Mahecha, M.D.; Seneviratne, S.I.; Zscheischler, J.; Beer, C.; Buchmann, N.; Frank, D.C.; et al. Climate extremes and the carbon cycle. Nature 2013, 500, 287–295. [Google Scholar] [CrossRef] [PubMed]
  6. Yin, J.; Guo, S.; Wang, J.; Chen, J.; Zhang, Q.; Gu, L.; Yang, Y.; Tian, J.; Xiong, L.; Zhang, Y. Thermodynamic driving mechanisms for the formation of global precipitation extremes and ecohydrological effects. Sci. China Earth Sci. 2023, 66, 92–110. [Google Scholar] [CrossRef]
  7. Liu, X.C. The Response of Vegetation in the Mid-to-High Latitude Regions of Asia to Past and Future Extreme Climate Events. Master’s Thesis, Nanjing University of Information Science and Technology, Nanjing, China, 2022. [Google Scholar]
  8. Yuan, M.; Zhu, Q.; Zhang, J.; Liu, J.; Chen, H.; Peng, C.; Li, P.; Li, M.; Wang, M.; Zhao, P. Global response of terrestrial gross primary productivity to climate extremes. Sci. Total Environ. 2021, 750, 142337. [Google Scholar] [CrossRef]
  9. Du, J.; Bao, G.; Tong, S.; Huang, X.; Wen, D.; Mei, L.; Bao, Y. Variations in vegetation cover and its relationship with climate change and human activities in Mongolia during the period 1982–2015. Acta Prataculturae Sin. 2021, 30, 1–13. [Google Scholar]
  10. Pan, S.; Yang, J.; Tian, H.; Shi, H.; Chang, J.; Ciais, P.; Francois, L.; Frieler, K.; Fu, B.; Hickler, T.; et al. Climate extreme versus carbon extreme: Responses of terrestrial carbon fluxes to temperature and precipitation. J. Geophys. Res. Biogeosci. 2020, 125, e2019JG005252. [Google Scholar] [CrossRef]
  11. Beer, C.; Reichstein, M.; Tomelleri, E.; Ciais, P.; Jung, M.; Carvalhais, N.; Rödenbeck, C.; Arain, A.M.; Baldocchi, D.; Bonan, B.G.; et al. Terrestrial gross carbon dioxide uptake: Global distribution and covariation with climate. Science 2010, 329, 834–838. [Google Scholar] [CrossRef]
  12. Lu, J.; Yan, F. The divergent resistance and resilience of forest and grassland ecosystems to extreme summer drought in carbon sequestration. Land 2023, 12, 1672. [Google Scholar] [CrossRef]
  13. Chen, W.; Zhu, D.; Huang, C.; Ciais, P.; Yao, Y.; Friedlingstein, P.; Sitch, S.; Haverd, V.; Jain, A.K.; Kato, E.; et al. Negative extreme events in gross primary productivity and their drivers in China during the past three decades. Agric. For. Meteorol. 2019, 275, 47–58. [Google Scholar] [CrossRef]
  14. Samaniego, L.; Thober, S.; Kumar, R.; Wanders, N.; Rakovec, O.; Pan, M.; Zink, M.; Sheffield, J.; Wood, E.F.; Marx, A. Anthropogenic warming exacerbates European soil moisture droughts. Nat. Clim. Change 2018, 8, 421–426. [Google Scholar] [CrossRef]
  15. Zhang, Y.; Piao, S.; Sun, Y.; Roger, B.M.; Li, X.Y.; Lian, X.; Liu, Z.; Chen, A.; Peñuelas, J. Future reversal of warming-enhanced vegetation productivity in the Northern Hemisphere. Nat. Clim. Change 2022, 12, 581–586. [Google Scholar] [CrossRef]
  16. Geng, Q.; Chen, X.; He, X.; Tian, Z. Vegetation dynamics and its response to climate change and human activities based on different vegetation types in China. Acta Ecol. Sin. 2022, 42, 3557–3568. [Google Scholar]
  17. Zscheischler, J.; Mahecha, M.D.; Buttlar, J.V.; Harmeling, S.; Jung, M.; Rammig, A.; Randerson, J.T.; Schölkopf, B.; Seneviratne, S.I.; Tomelleri, E.; et al. A few extreme events dominate global interannual variability in gross primary production. Environ. Res. Lett. 2014, 9, 035001. [Google Scholar] [CrossRef]
  18. Liu, M.; Wang, H.; Zhai, H.; Zhang, X.; Shakir, M.; Ma, J.; Sun, W. Identifying thresholds of time-lag and accumulative effects of extreme precipitation on major vegetation types at global scale. Agric. For. Meteorol. 2024, 358, 110239. [Google Scholar] [CrossRef]
  19. Wu, D.; Zhao, X.; Liang, S.; Zhou, T.; Huang, K.; Tang, B.; Zhao, W. Time-lag effects of global vegetation responses to climate change. Glob. Change Biol. 2015, 21, 3520–3531. [Google Scholar] [CrossRef]
  20. Piao, S.; Fang, Y.; Ciais, P.; Peylin, P.; Huang, Y.; Sitch, S.; Wang, T. The carbon balance of terrestrial ecosystems in China. Nature 2009, 458, 1009–1013. [Google Scholar] [CrossRef]
  21. Piao, S.; Zhang, X.; Chen, A.; Liu, Q.; Lian, X.; Wang, X.; Peng, S.; Wu, X. The Impact of Extreme Climate Events on Terrestrial Ecosystem Carbon Cycling. Sci. Sin. Terrae 2019, 49, 1321–1334. [Google Scholar]
  22. Frank, D.; Reichstein, M.; Bahn, M.; Thonicke, K.; Frank, D.; Mahecha, M.D.; Smith, P.; Velde, M.V.D.; Vicca, S.; Babst, F.; et al. Effects of climate extremes on the terrestrial carbon cycle: Concepts, processes and potential future impacts. Glob. Change Biol. 2015, 21, 2861–2880. [Google Scholar] [CrossRef]
  23. Wu, X.; Zhang, R.; Bento, V.A.; Leng, S.; Qi, J.; Zeng, J.; Wang, Q. The effect of drought on vegetation gross primary productivity under different vegetation types across China from 2001 to 2020. Remote Sens. 2022, 14, 4658. [Google Scholar] [CrossRef]
  24. Liu, P. Variation Characteristics of NDVI and GPP and Their Response to Extreme Climate in the Loess Plateau. Master’s Thesis, College of Water Resources and Architectural Engineering, Xianyang, China, 2022. [Google Scholar]
  25. Zhang, Y. Effects of extreme climate events on meadow ecosystem vulnerability in Inner Mongolia, China. Master’s Thesis, Inner Mongolia Normal University, Hohhot, China, 2024. [Google Scholar]
  26. Wang, Y.; Chen, J.; Zhou, G.; Shao, C.; Chen, J.; Yu, W.; Song, J. Predominance of precipitation event controls ecosystem CO2 exchange in an Inner Mongolian desert meadow, China. J. Clean. Prod. 2018, 197, 781–793. [Google Scholar]
  27. Yu, Z.; Liu, Q.; Zhang, Y.; Ju, L.; Miu, L. Changes of NDVI and driving factors in different grasslands in the Inner Mongolia. Acta Ecol. Sin. 2024, 44, 10068–10082. [Google Scholar]
  28. Liu, J.; Zhang, Z.; Feng, K.; Wang, F.; Zhang, W.; Wang, S.; Sun, L.; Guo, H. Spatiotemporal evolution characteristics and driving factors of net primary productivity of vegetation in the Inland River Basin of the Inner Mongolia Plateau. Acta Ecol. Sin. 2024, 44, 10055–10067. [Google Scholar]
  29. Yuan, M.; Zhao, L.; Li, X.; Lin, A. Diverse response of end of growing season to extreme climate events in different grasslands in temperate China during 1982–2015. Acta Ecol. Sin. 2023, 43, 6015–6032. [Google Scholar]
  30. Lokman, M.; Humayain, M.; Salma, U.; Rubaiyat, A. Response of grassland net primary productivity to dry and wet climatic events in four grassland types in Inner Mongolia. Plant Environ. Interact. 2021, 2, 250–262. [Google Scholar]
  31. Guo, Z.; Lou, W.; Sun, C.; He, B. Trend changes of the vegetation activity in northeastern East Asia and the connections with extreme climate indices. Remote Sens. 2022, 14, 3151. [Google Scholar] [CrossRef]
  32. Wang, Z.; Liu, Y.; Wang, Z.; Zhang, H.; Chen, X.; Wen, Z.; Lin, Z.; Han, P.; Xue, T. Quantifying the Spatiotemporal Changes in Evapotranspiration and Its Components Driven by Vegetation Greening and Climate Change in the Northern Foot of Yinshan Mountain. Remote Sens. 2024, 16, 357. [Google Scholar] [CrossRef]
  33. Zhou, J.; Lu, H. China Downscaled CMIP6 Precipitation, Temperature and Wind Speed Dataset (1979–2100); National Tibetan Plateau/Third Pole Environment Data Center: Beijing, China, 2023. [Google Scholar]
  34. Li, X.; Xiao, J. Mapping Photosynthesis Solely from Solar-Induced Chlorophyll Fluorescence: A Global, Fine-Resolution Dataset of Gross Primary Production Derived from OCO-2. Remote Sens. 2019, 11, 2563. [Google Scholar] [CrossRef]
  35. Song, J.X.; Zhou, L.; Zhou, G.; Yan, Y.; Zhang, S. A dataset of carbon and water fluxes of the temperate desert meadow in Damao Banner, Inner Mongolia (2015–2018). China Sci. Data 2023, 8, 1–9. [Google Scholar]
  36. Li, C. Research on the Characteristics and Effects of Climate Extremes on Multi-spatial-temporal Scales in the Mongolian Plateau. Ph.D. Thesis, East China Normal University, Shanghai, China, 2019. [Google Scholar]
  37. Jing, J.; He, C.; Wang, Y.; Ma, B.; Liu, B. Spatiotemporal evolution characteristics of meteorological drought in Southwest China from 1902 to 2018. Res. Soil Water Conserv. 2022, 29, 220–227. [Google Scholar]
  38. Kang, Y.; Guo, E.; Wang, Y.; Bao, Y.; Bao, Y.; Na, R. Application of temperature vegetation dryness index for drought monitoring in Mongolian Plateau. Chin. J. Appl. Ecol. 2021, 32, 2534–2544. [Google Scholar]
  39. Zhao, J.; Guo, E.; Wang, Y.; Kang, Y.; Gu, X. Ecological drought monitoring of Inner Mongolia vegetation growing season based on Kernel temperature vegetation drought index. Chin. J. Appl. Ecol. 2023, 34, 2929–2937. [Google Scholar]
  40. Fareed, N.; Numata, I.; Cochrane, M.; Novoa, S.; Tenneson, K.; Melo, A.; Silva, S.; Oliveria, M.; Nicolau, A.; Zutta, B. Aboveground biomass modeling using simulated Global Ecosystem Dynamics Investigation (GEDI) waveform LiDAR and forest inventories in Amazonian rainforests. For. Ecol. Manag. 2025, 578, 122491. [Google Scholar] [CrossRef]
  41. Rajadurai, J.; Hanafi, W.; Bathmanathan, V.; Daud, S.; Azami, N. Developing nexus eco-purchasing behaviour index (NEPBI) for Malaysia by using partial least square analysis. Qual. Quant. 2021, 55, 2017–2039. [Google Scholar] [CrossRef]
  42. Zheng, X.; Zhu, J.; Wang, G.; Yan, Q.; Sun, T.; Song, L.; Gao, T.; Sun, Y.; Li, X.; Yang, K.; et al. Assessing the ecological effects of the World’s Largest Forestry Eco-engineering: Three-North Protective Forest Program within the initially scheduled range from 1978 to 2022. Sci. China Life Sci. 2024, 68, 314–327. [Google Scholar] [CrossRef]
  43. Kong, R. Analysis on the Evolution and Driving Force of Meadows Aboveground Biomass Carbon in Northwestern China Under Changing Environment. Master’s Thesis, Nanjing Forestry University, Nanjing, China, 2020. [Google Scholar]
  44. Sun, H.; Cheng, Y.; An, Q.; Liu, L. Evolution and Mechanism Analysis of Terrestrial Ecosystems in China with Respect to Gross Primary Productivity. Land 2024, 13, 1346. [Google Scholar] [CrossRef]
  45. Luo, M.; Meng, F.; Wang, Y.; Sa, C.; Bao, Y.; Liu, T. Mutual feedback relationship between vegetation GPP and soil moisture in China under climate change. Acta Geogr. Sin. 2024, 79, 218–239. [Google Scholar]
  46. Sun, Z.; Wang, X.; Yamamoto, H.; Tani, H.; Zhong, G.; Yin, S.; Guo, E. Spatial pattern of GPP variations in terrestrial ecosystems and its drivers: Climatic factors, CO2 concentration, and land-cover change, 1982–2015. Ecol. Inf. 2018, 46, 156–165. [Google Scholar] [CrossRef]
  47. Fan, Y.; Liao, Z.; Long, Y.; Cheng, Y. Characteristics of vegetation net primary productivity change and its climatic driving forces in the Yinshanbeilu Meadow, Inner Mongolia. Water Resour. Hydropower Eng. 2024, 55, 38–50. [Google Scholar]
  48. Zhao, S.; Zhou, Q.; Wang, W.; Wu, Y. Dry-wet climate characteristics of Inner Mongolia based on standardized precipitation index. J. China Inst. Water Resour. Hydropower Res. 2022, 20, 10–19. [Google Scholar]
  49. Su, R.; Guo, E.; Wang, Y.; Yin, S.; Bao, Y.; Sun, Z.; Mandula, N.; Bao, Y. Vegetation Dynamics and Its Response to Extreme Climate on the Inner Mongolian Plateau during 1982–2020. Remote Sens. 2023, 15, 3891. [Google Scholar] [CrossRef]
  50. Wen, Y.; Liu, X.; Pei, F.; Li, X.; Du, G. Non-uniform time-lag effects of terrestrial vegetation responses to asymmetric warming. Agric. For. Meteorol. 2018, 252, 130–143. [Google Scholar] [CrossRef]
  51. Yao, S.; Zhao, C.; Zhou, J.; Li, Q. The Association of Drought with Different Precipitation Grades in the Inner Mongolia Region of Northern China. Water 2024, 16, 3292. [Google Scholar] [CrossRef]
  52. Zhao, A.; Yu, Q.; Feng, L.; Zhang, A.; Pei, T. Evaluating the cumulative and time-lag effects of drought on meadow vegetation: A case study in the Chinese Loess Plateau. J. Environ. Manag. 2020, 261, 110214. [Google Scholar] [CrossRef]
  53. Zhao, J.; Huang, S.; Huang, Q.; Wang, H.; Leng, G.; Fang, W. Time-lagged response of vegetation dynamics to climatic and teleconnection factors. Catena 2020, 189, 104474. [Google Scholar] [CrossRef]
  54. Tao, J.; Bao, Y.; Guo, E.; Jin, E.; Husile; Bao, Y. Characteristics of the spatial and temporal evolution of winter drought in Inner Mongolia over the past 40 years. Arid Zone Res. 2024, 41, 387–398. [Google Scholar]
  55. Benson, D.O.; Dirmeyer, P. Characterizing the relationship between temperature and soil moisture extremes and their role in the exacerbation of heat waves over the contiguous United States. J. Clim. 2021, 34, 2175–2187. [Google Scholar] [CrossRef]
  56. Knapp, A.; Fay, P.A.; Blair, J.M.; Collins, S.L.; Smith, M.D.; Carlisle, J.D.; Harper, C.W.; Danner, B.T.; Lett, M.S.; James, K.; et al. Rainfall variability, carbon cycling, and plant species diversity in a mesic meadow. Science 2002, 298, 2202–2205. [Google Scholar] [CrossRef]
  57. Gao, W.; Jiang, H.; Zhang, S.; Hai, C.; Liu, B. Vegetation characteristics and soil properties in grazing exclusion areas of the inner Mongolia desert meadow. Int. Soil Water Conserv. Res. 2023, 11, 549–560. [Google Scholar] [CrossRef]
  58. Lai, Q. Simulation of GPP Based on Solar-Induced Chlorophyll Fluorescence and Its Response to Drought in Mongolian Plateau. Doctoral Thesis, Northeast Normal University, Changchun, China, 2021. [Google Scholar]
  59. Wrightson, I.; Anaraki, T.M.; Uyl, D.J.; Nadelhoffer, J.K.; Lajtha, K.; Simpson, J.M. Changes in litter and nitrogen deposition differentially alter forest soil organic matter biogeochemistry. Geochim. Cosmochim. Acta 2024, 374, 186–199. [Google Scholar] [CrossRef]
Figure 1. Overview of the study area (a) geographical location (b) elevation and meteorological stations (c) annual average temperature and multi-year monthly temperatures (d) annual average precipitation and multi-year monthly precipitation.
Land 14 00884 g001
Figure 2. Spatiotemporal distribution of GPP in the desert steppe of NFYS. (a) Interannual variability of GPP (2001–2023); (b) Spatial heterogeneity of annual GPP distribution; (c) Seasonal dynamics of monthly GPP patterns; (d) Spatial distribution of multi-year (2001–2023) mean GPP values. The solid blue line in the figure (a) is the trend line, the punctuated solid blue line represents the actual trend of the GPP, and the blue area represents the confidence interval.
Land 14 00884 g002
Figure 3. Model results of GPP response mechanisms to climate change. (a) Random forest contribution ranking, where ns stands for no significant and (b) GPP simulation models with and without lag effects.
Land 14 00884 g003
Figure 4. CMIP6 climate data models validation.
Land 14 00884 g004
Figure 5. Temporal trends of climate index from 2025 to 2035.
Land 14 00884 g005
Figure 6. Spatiotemporal variation characteristics of GPP from 2025 to 2035.
Land 14 00884 g006
Table 1. Detailed information on the data acquired in the study (Abb: abbreviation; SR: spatial resolution; TS: Time Span).
DataVariablesAbbSRTSSource
Meteorological DataMaximum temperatureTmax0.1 × 0.1°2001–2023ERA5 Climate and Forecast (CF) Metadata Convention v1.7 https://cds.climate.copernicus.eu/, accessed on 22 July 2024
Minimum temperatureTmin0.25 × 0.25°2025–2035CMIP6 https://data.tpdc.ac.cn/, accessed on 22 July 2024
PrecipitationPP
GPP DataGOSIF-GPPGPP0.05 × 0.05°2001–2023https://globalecology.unh.edu//data/GOSIF-GPP.html, accessed on 22 July 2024
CO2 fluxGPP2.3 m2015–2018http://www.csdata.org/p/837/, accessed on 22 July 2024
Table 2. The lag coefficient of GPP with normal climate indices.
Lag Time0123
Indices
PP0.88 ***0.916 ***0.79 ***0.921 ***
Tmax0.78 ***0.79 ***0.74 ***0.69 ***
Tmin0.81 ***0.80 ***0.74 ***0.71 ***
The results of the significance test are displayed as follows: ***: p < 0.001.
Table 3. The lag coefficient of GPP with extreme temperature indices.
Lag Time0123
Indices
TXx0.72 ***0.7653 ***0.7654 ***0.75 ***
TNx0.78 ***0.81 ***0.74 ***0.7 ***
TXn0.83 ***0.8 ***0.7 ***0.66 ***
TNn0.86 ***0.81 ***0.73 ***0.68 ***
TX10P0.76 ***0.370.01−0.27
TN10P0.730.340.270.13 ***
TX90P0.91 ***0.86 ***0.65 ***0.56 **
TN90P0.94 ***0.91 ***0.62 **0.54 **
DTR0.360.54 **0.67 ***0.73 ***
WSDI0.93 ***0.92 ***0.7 ***0.47 *
CSDI0.77 ***0.360.270.13
FD00.61 **0.370.270.13
ID00.790.38−0.04−0.26 ***
SU250.94 ***0.92 ***0.64 ***0.61 **
TR200.9 ***0.88 ***0.68 ***0.55 **
The results of the significance test are displayed as follows: ***: p < 0.001; **: 0.001 ≤ p < 0.01; *: 0.01 ≤ p < 0.05.
Table 4. The lag coefficient of GPP with extreme precipitation indices.
Lag Time0123
Indices
R100.87 ***0.94 ***0.88 ***0.82 ***
R200.65 ***0.78 ***0.90 ***0.73 ***
R250.65 ***0.76 ***0.79 ***0.71 ***
R99P0.85 ***0.90 ***0.89 ***0.78 ***
R95P0.88 ***0.93 ***0.94 ***0.79 ***
CDD0.310.250.070.24
CWD0.84 ***0.80 ***0.73 ***0.71 ***
PRCPTOT0.89 ***0.91 ***0.93 ***0.79 ***
RX1day0.78 ***0.83 ***0.90 ***0.83 ***
RX5day0.90 ***0.928 ***0.927 ***0.81 ***
SDII0.69 ***0.77 ***0.87 ***0.90 ***
The results of the significance test are displayed as follows: ***: p < 0.001.
Disclaimer/Publisher’s Note: The statements, opinions and data contained in all publications are solely those of the individual author(s) and contributor(s) and not of MDPI and/or the editor(s). MDPI and/or the editor(s) disclaim responsibility for any injury to people or property resulting from any ideas, methods, instructions or products referred to in the content.

