Article

Quality Analysis for Conservation and Integral Risk Assessment of the Arribes del Duero Natural Park (Spain)

by
Leticia Merchán
1,*,
Antonio Miguel Martínez-Graña
2 and
Carlos E. Nieto
2
1
Department of Soil Sciences, Faculty of Agricultural and Environmental Sciences, University of Salamanca, Filiberto Villalobos Avenue 119, 37007 Salamanca, Spain
2
Department of Geology, Faculty of Sciences, Merced Square, University of Salamanca, 37008 Salamanca, Spain
*
Author to whom correspondence should be addressed.
Land 2025, 14(4), 885; https://doi.org/10.3390/land14040885
Submission received: 6 March 2025 / Revised: 10 April 2025 / Accepted: 15 April 2025 / Published: 17 April 2025

Abstract

:
The environment is being affected by the great development of human activities, which is why, in recent years, the need to protect the environment has increased, through the carrying out of a Strategic Environmental Assessment (SEA). Within this assessment, environmental geology constitutes an instrument for territorial and urban planning based on the analysis of conservation and the integral analysis of risks, obtaining cartography that can be useful in territorial and regional planning strategies. The methodology carried out in this article consists of applying a multi-criteria analysis in territorial planning, combining vector and raster data. This novel, low-cost, and effective methodology assesses conservation areas and risks, using map algebra and network analysis to identify priority areas and facilitate decision-making in a precise and quantitative manner. This analysis has been carried out in the Arribes del Duero Natural Park, which stands out as a place where numerous environmental values coexist, i.e., geological, geomorphological, and edaphological, forming unique landscapes. With regard to the results obtained, the cartography of conservation quality classifies the territory into four categories according to its degree of conservation: very high, high, low, and very low quality. The integral risk cartography identifies the areas with the greatest geological risks, such as erosion and landslides, and establishes limitations for land use. Also, by integrating both cartographies, it is determined which activities are compatible with each zone, considering both conservation and risks. Finally, it can be concluded that the cartographies obtained are useful for efficient land management, protecting the environment, and allowing human development in a controlled manner.

1. Introduction

The widespread loss of biodiversity [1] has become a significant concern at the European level [2], making it necessary to reduce this loss as well as the degradation of ecosystem services. From an economic development perspective, the natural and strategic characteristics of natural areas provide them with high potential for human activities [3,4,5]. These areas represent significant natural value, hosting unique ecosystems with rich and diverse biodiversity [4,6].
Natural disasters are triggers of environmental problems [7] that alter ecosystems and affect urban areas with a high population density, leading to a different evolution of these problems [8]. It is, therefore, essential to understand the geological processes associated with these phenomena and to identify the most vulnerable [9,10] and least responsive areas through a comprehensive hazard analysis [9,10,11]. Geological hazards play a key role and, therefore, need to be addressed through effective land-use strategies [12,13], together with active and passive mitigation and sustainable development measures [13]. In addition, for urban development and civil engineering projects, comprehensive risk studies are vital for planning and detecting potential hazards [14,15]. In addition, the landscape’s features, shaped by the interaction of abiotic (rocks, water, and air) [16] and biotic (flora and fauna) natural elements [17], increase the need for conservation, sustainable use, and the enhancement of ecosystem services. These landscapes are subject to constant changes caused by external geological agents and human activity [18]. The level of conservation and authenticity of the landscape directly affects the natural environment, which is crucial for promoting population well-being [19]. This highlights the importance of implementing conservation measures supported by proper land-use planning, which includes conducting a quality analysis [18,19,20,21,22].
This article aims to produce a map of recommendations and usage limitations, integrating areas of high natural value (suitable for conservation) and high natural risk areas. Additionally, it seeks to provide a useful, high-resolution, low-cost, and easy-to-understand tool for sustainable land management in the initial phases of project development. This tool serves as a preliminary diagnosis to define detailed strategies for land-use planning, conservation, and management in the studied area [12,13]. Based on the characteristics of the region, appropriate measures will be proposed for different activities, emphasizing the necessity of conducting Strategic Environmental Assessments (SEAs) [23,24,25]. The goal of SEAs in land-use planning is to promote sustainable development and management of any natural or urban space, ensuring that environmental considerations tied to well-being guide the drafting of land-use plans. When applied to geological risks, an SEA seeks to assess, mitigate, and identify potential environmental impacts associated with geological phenomena such as landslides or erosion. One aspect of such an assessment that needs to be improved is the study of territorial resilience (territorial absorption capacity), which has not been carried out, and therefore, in this article, it will be taken into account, using thematic cartography, which is new and useful. The territorial absorption or reception capacity will establish the degree of protection of each sector, i.e. to know the degree of integration of a use or activity according to the possible affection to its conservation quality and to the existing natural risks, which defines the potential impact of this activity on the environment [26,27,28].
According to the procedure required by the INSPIRE Directive (Infrastructure for Spatial Information in the European Community) and its transposition in Spain LISIGE (Law on Geographic Information Infrastructures and Services in Spain), the legal framework is established to create and manage the Geographic Infrastructure of Spain (IDEE). In this way, it is possible to take advantage of the digital cartographies of the different member states, free of charge and available online, so that it can be replicated in any area. In this way, the availability of these thematic data can be useful for environmental management and also for carrying out SEAs.
The methodology relies on Geographic Information Systems (GISs), using a multi-risk analysis for multi-criteria decision-making [29,30]. These methodologies offer fast modelling and a high capacity for updating geospatial information, resulting in high-resolution maps that are increasingly applied [31,32,33]. It is a pioneering, low-cost, and effective methodology, given that there is currently no established SEA procedure. In this way, a methodological protocol, easily replicable, based on the INSPIRE and LISIGE Directives, is proposed.
The objectives of this article are twofold: first, to analyse the conservation quality of the Arribes del Duero Natural Park by creating a map that evaluates the natural environment and identifies the areas requiring protection; second, to conduct a comprehensive analysis of geological risks to produce a map that can inform future strategies for regional planning and land management.

Study Area

Arribes del Duero is a protected natural area located in the provinces of Salamanca and Zamora (Spain). For 120 km, the Duero river flows through the rigid materials of the Palaeozoic basement of the Iberian Plateau, giving rise to a deep valley, called ‘arribes’, hence its name, which also serves as a natural border between Spain and Portugal (Figure 1). This deep valley forms a canyon up to 500 m deep, which causes a milder thermal regime that has facilitated the settlement of thermophilic flora and the development of olive groves and vineyards through the construction of terraces and terraces on the steep slopes, giving rise to a unique landscape. The confluence of these peculiarities, both natural, landscape and geomorphological, justified, in 1991, its inclusion in the Plan of Protected Natural Spaces of Castilla y León, being declared a Natural Park in 2002. Subsequently, in 2015, it was recognised by UNESCO as being included in the Transboundary Biosphere Reserve of the Iberian Plateau, constituting one of the largest protected areas in Europe [31]. In addition, there are different initiatives created to promote places of special geological interest [32,33], which, in turn, can serve as a starting point for a possible declaration as a Geopark.

2. Materials and Methods

The data collection was carried out using information gathered during various field campaigns, complemented by an in-depth analysis of bibliographic and digital sources. All this information was then used for digital modelling with ArcGIS 10.8 © software.
The methodology used in this work has been that of multi-criteria analysis applied to decision-making for territorial planning using GIS (Figure 2). Multi-criteria analysis is an analytical process that allows the identification of various solutions to a problem, mainly using cartographic variables as starting data. In this work, this methodology has been used, as it is considered an instrument that allows the evaluation of various possible solutions to a given problem of the different uses of the territory, using scripts that have multiple criteria to facilitate decision-making and arrive at an optimal or more appropriate solution.
The multi-criteria analysis carried out has been applied in the vector area (with discrete variables) and in the raster area (continuous variables). This methodology allows for obtaining a more precise quantitative result in the territory, adapting it to an appropriate spatial resolution. The vector and raster format will allow the combination of overlapping areas with the presence or absence of different degrees of conservation or risks. Combining raster variables through map algebra with distance criteria, network analysis will allow territorial preferences to be identified but also provide a quantitative value to prioritise decision-making in territorial planning. In this way, by applying multi-criteria analysis based on vector and raster data, you increase the rigour of the territorial variables, being able to have multiple alternatives and prioritise areas of the land based on initial criteria. This analysis can identify appropriate areas according to your criteria, generating a ranking of priorities based on the different digital values shown by their pixels. Map algebra is a tool to be used to arrive at a result by combining all the thematic cartographic layers, which have previously been evaluated with criteria of importance using different algorithms such as reclassification, editing, conversion, surface analysis, interpolation, and neighbourhood, as well as the use of complementary data.
In our multi-criteria analysis, we have established which criteria are relevant (that is, which ones we are going to consider) and the relative importance or ‘weight’ that each one of them has, to finally evaluate/assess the possible alternatives in the final cartography of recommendations and limitations of use. The alternatives (options that the decision-maker has for decision-making), the different territorial criteria that describe the possible alternatives in an objective (quantitative) and subjective (qualitative) way, and the sustainable objectives based on the sectors to be protected and the limitations due to natural risks have been considered, all of which facilitates decision-making based on the sustainable requirements of the manager or public administration. The advantages of applying this methodology are that complex situations have been simplified by using specific methodologies based on expert criteria based on weights or weights of the different factors distributed geospatially by the maps, making a realistic and objective assessment of the elements involved in the cartographic procedure. The methodology used in this work (Figure 2) uses different scripts that include aggregation methods with mathematical procedures to synthesise the values obtained by each criterion considered and the geospatial analysis through mechanisms such as linear or multiplicative weighting, in addition to Boolean analysis, proximity tools, euclinal distances, and buffers to finally use weighted overlay techniques with a conditional analyst to obtain restricted and optimal areas for the different uses of the territory according to the sectors to be conserved (areas to be conserved) and the sectors with natural risks (areas with limitations).

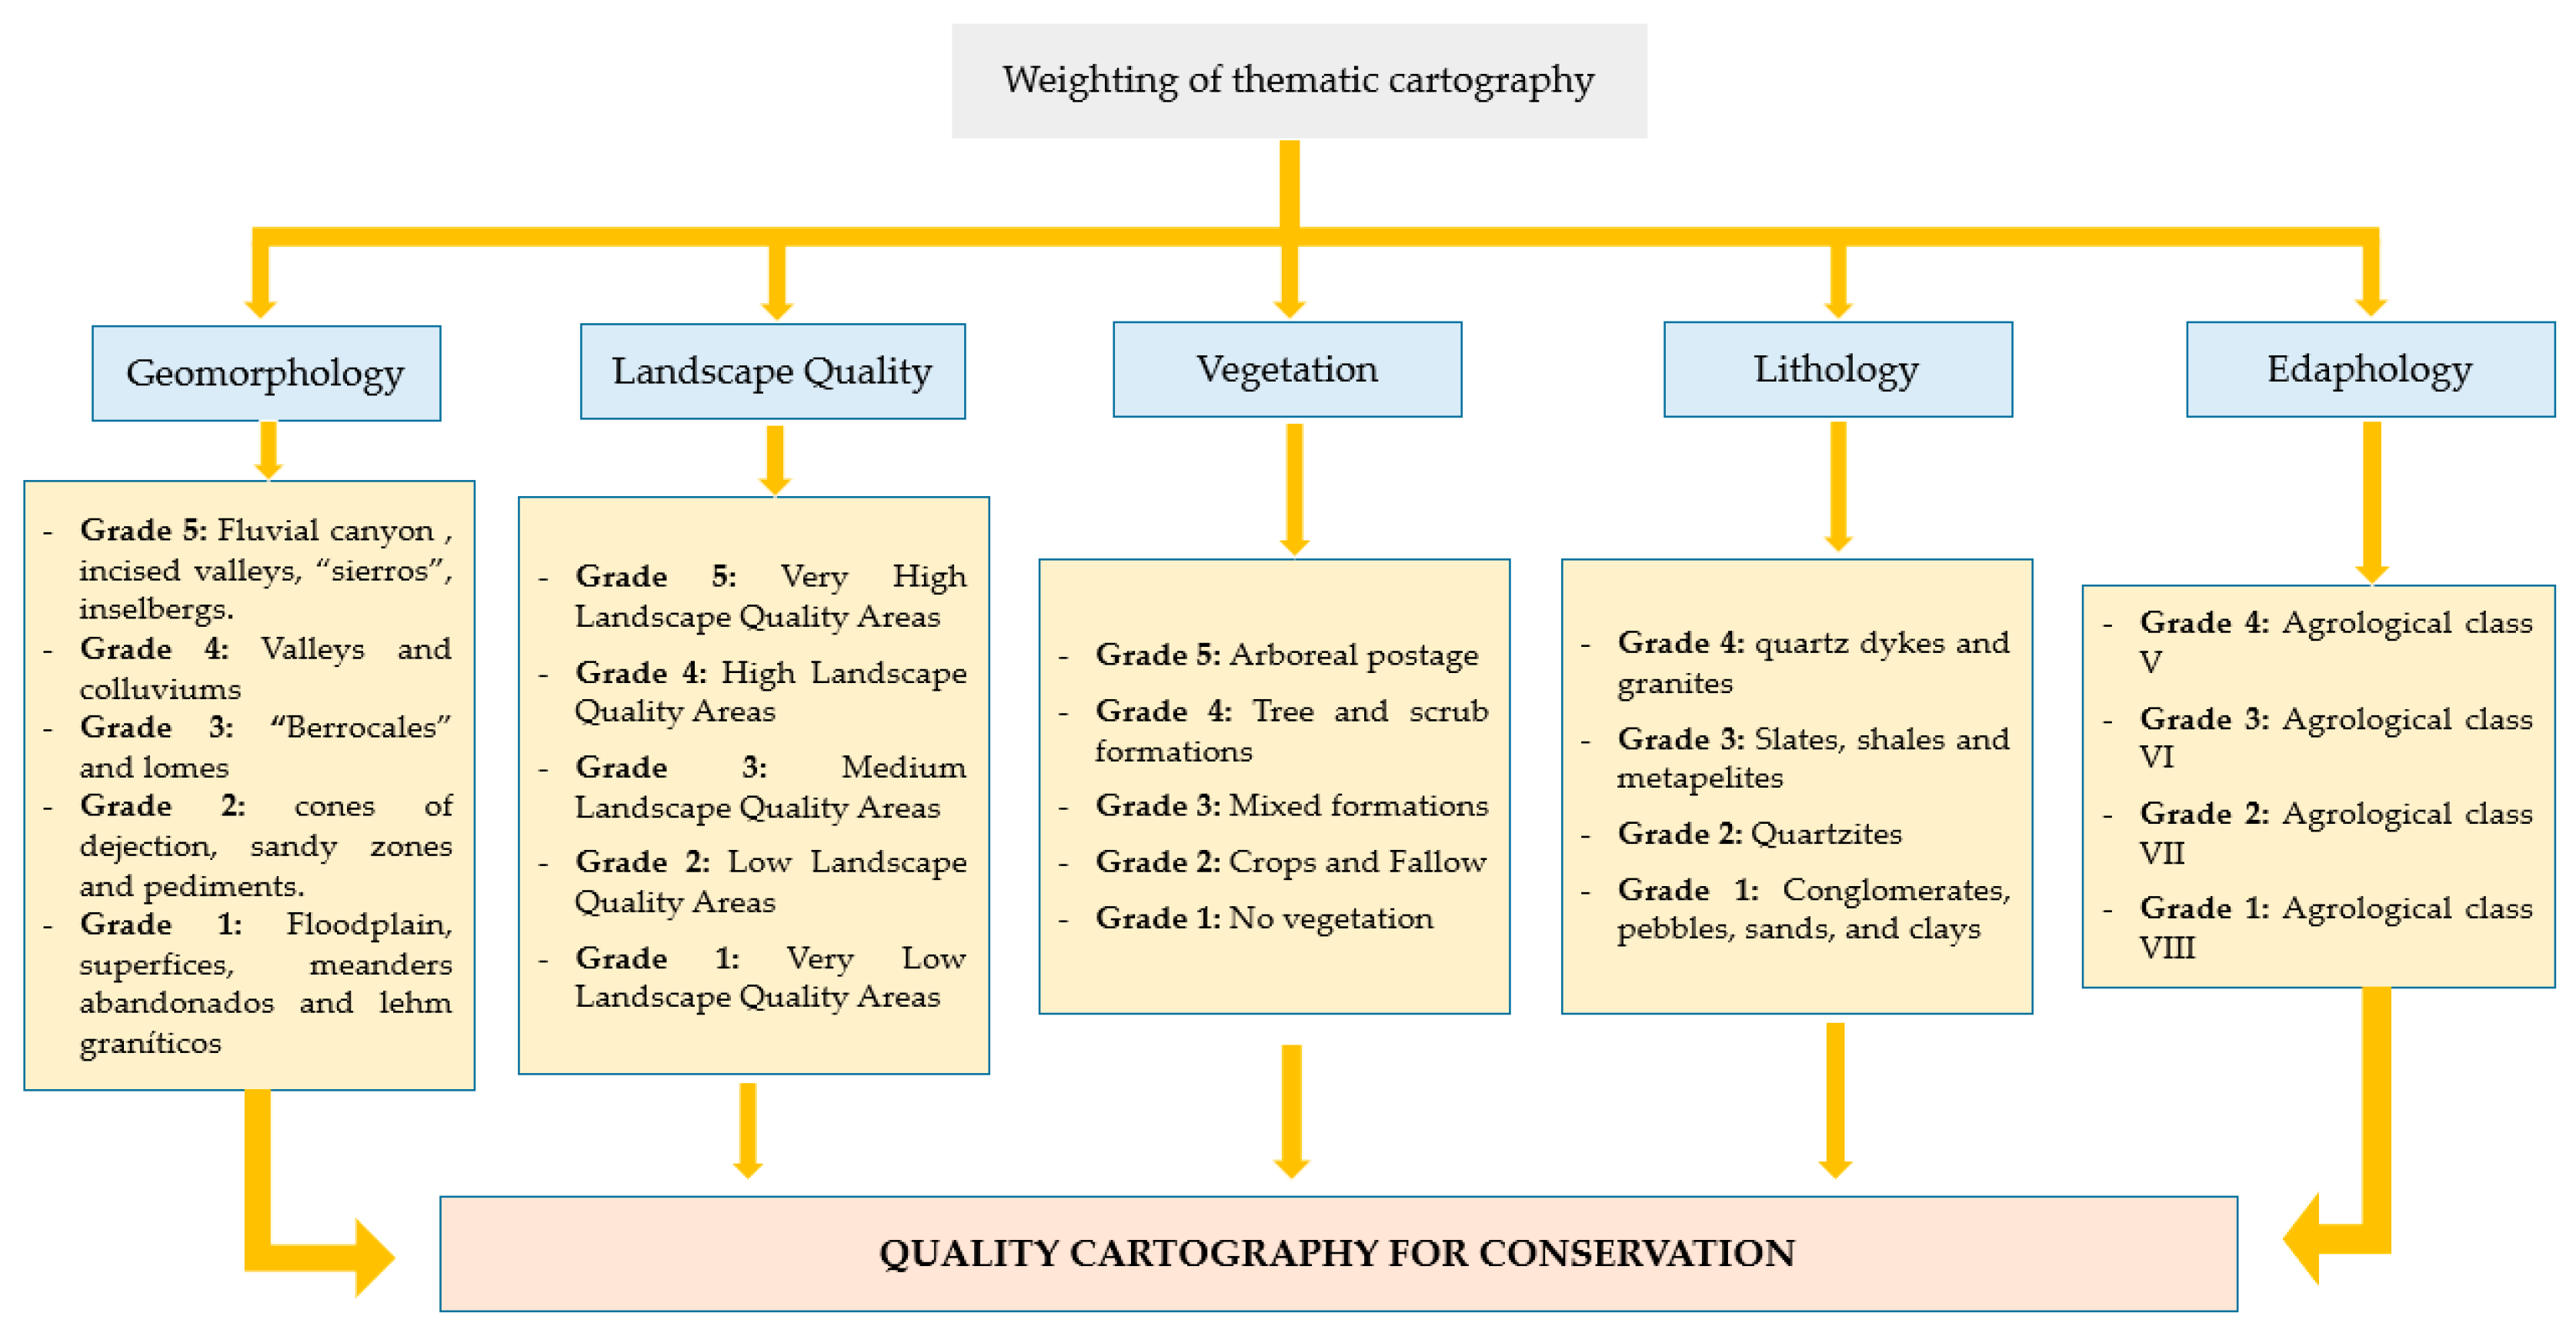
2.1. Quality Analysis for Conservation

Conservation quality cartography makes it possible to determine which sectors of the territory should be the object of protection (Figure 2). The methodology consists of the global valuation of each unit, taking into account singular elements and relevant aspects that determine the value of its quality for conservation based on the state of conservation and naturalness [15,34,35,36]. This cartography of quality will make it possible to identify those territorial sectors that should be protected and, as a non-structural measure in urban planning, should not be affected by anthropic activities, and for this reason, it is also called a Map of Recommendations.
The previously generated thematic layers, using established quantitative methods, are integrated into a Geographic Information System (GIS) using overlay techniques. Since it is a simple and quick technique, it can be replicated in other projects, producing maps that clearly highlight key areas for sustainable land planning. This approach also ensures that the identified areas are easily understood by professionals from various fields, facilitating their interpretation and application in future management policies.

2.1.1. Geological Heritage Analysis

The analysis of this heritage involves the evaluation and weighting (Figure 3) of geomorphological, lithological, and edaphological characteristics [37].
  • Geomorphology. This parameter is assessed considering the criteria of singularity and degree of conservation. This assessment establishes the distribution of units of geomorphological interest, considering the degree of preservation of the units in relation to the degree of anthropic alteration. The spectacular nature of the geoforms and the percentage of vegetation cover have also been considered, which, if high, diminishes the real geomorphological value due to its lesser perception.
  • Lithology. The evaluation of this parameter considers those lithological formations that have a certain prominence in the natural environment, from their perceptual level to their intrinsic characteristics.
  • Edaphology. The interest in soil conservation considers productivity according to agricultural constraints and other factors such as slope and erosion.

2.1.2. Landscape Quality Analysis

This analysis allows for the identification of areas where the combination of their elements holds greater relevance, uniqueness, and importance, thus requiring enhanced protection. In this regard, to conduct a more thorough analysis, both intrinsic and extrinsic landscape qualities are considered.
Intrinsic Landscape Quality assesses the perception of an observer from any point within the territory where each landscape unit is visible. This analysis is based on a detailed study of the elements that make up each sector of the territory, using a spatial resolution of 1 m per pixel. Different parameters are then weighted, considering landscape preferences identified in previous studies and the opinions of local experts [38].
For this analysis, five main factors are considered [20,39], with the following being particularly significant:
1.
Geomorphological Factor: This is the most influential component, as the landform largely determines the configuration of the terrain. Certain landforms, such as ridges, river valleys, canyons, cliffs, or deeply incised valleys, tend to have a higher landscape value. In contrast, other forms, like erosion surfaces, pediments, or terraces, receive less favourable assessments. The analysis of this factor requires weighting the following specific parameters (Table 1) that describe the geomorphological characteristics of the area:
(A)
Geomorphological Domains: These define the spatial distribution of relief units in relation to nearby terrains, considering the different modelling processes that have shaped the earth’s surface.
(B)
Slopes: Obtained from the 1 m Digital Terrain Model (DTM), generating a raster layer.
(C)
Sinusoidality: This parameter evaluates the curvature of the terrain lines. Its calculation employs an index that compares the area and perimeter of polygons defined by contour lines, using Geographic Information System (GIS) techniques.
2.
Lithological Factor: Lithology significantly influences the colour composition of the landscape, which is crucial for assessing the intrinsic quality of a natural environment. The landscape’s colour is determined by various rock outcrops, with lighter tones generally being more appreciated than darker ones. Based on the present lithological units and their mineral composition, they are reclassified into leucocratic or melanocratic mineral-rich materials.
3.
Hydrological Factor: The presence of bodies of water adds significant value to the surrounding natural environment. This factor includes rivers, lakes, and reservoirs, which create wetland areas capable of supporting a wide variety of organisms, enhancing the naturalness of the landscape. In this context, higher values are assigned to areas near watercourses (value 4), compared to those near water bodies (value 2), as the former have greater perceptual significance both visually and acoustically, due to the movement of the water.
4.
Morphostructural Relief Factor: This factor refers to elements of the relief that have particular perceptual relevance, such as lithostructural landforms. These include notable geological formations like folds, deeply incised valleys, or river canyons, which are assigned a score of 10 due to their distinctive character.
5.
Vegetation Factor: This factor is vital in the analysis due to the high variability in vegetation and its different structures. Two main aspects are analysed and weighted (Table 2):
(A)
Specific Composition: This parameter refers to the various plant associations present in the area, characterised by two factors: plant grouping and diversity. Plant grouping is evaluated based on the ecological value of the community, which depends on the dominant species in each association and its influence. Diversity, on the other hand, reflects how the variety of species helps reduce the monotony of the landscape, promoting the presence of mosaic distributions and highlighting the environment’s uniqueness.
(B)
Vegetation Structure: This parameter analyses the distribution and presence of different components within each plant community, evaluating these based on density and stratification. Density refers to the horizontal structure of the vegetation, focusing on the number of plants per unit area. The Fraction of Canopy Cover (FCC) is used for its evaluation, classified into three categories (Table 2). Stratification, on the other hand, examines the vertical structure of the vegetation, differentiating three possible height strata (herbaceous, shrub, and tree).
To obtain the vegetation valuation mapping, each of the above four parameters is evaluated, reclassified, and overlaid using GIS techniques (map algebra), applying Equation (1):
∑ Vegetation factors = (Plant grouping) + (Plant diversity) + (Covered Cover Fraction)
Finally, to carry out the total assessment of the Intrinsic Landscape Quality (CPI), all the above factors are taken into account, and by superimposing them using GIS techniques and applying Equation (2), the corresponding cartography is obtained.
CPI = ∑ Geomorphological factors + Lithology factor + Hydrology factor
+ Structural relief factor + ∑ Vegetation factors
Extrinsic Quality: This concept encompasses elements that constitute the natural and cultural heritage, as well as the presence of urban settlements, which may increase the value of a landscape. To assess this heritage, factors such as its state of conservation, durability, value (both natural and cultural), and social relevance are considered. Within the natural heritage, the following aspects are included [20,40,41,42,43]:
(A)
Geological Heritage: The presence of Geological Points of Interest (GPI) is considered, which are grouped and assigned a weight of 10.
(B)
Biological Heritage: This includes both plant and animal heritage. Regarding plant heritage, areas containing significant plant species are valued, with an influence radius of 100 m, and assigned a value of 4. For animal heritage, critical areas and points of presence of species of interest are also considered within a 100 m radius. Unlike plant areas, these zones are given a lower score (value 2) due to their more restricted visual impact.
(C)
Ecological Heritage: This encompasses sectors of ecological interest, classified according to various criteria:
-
Reserve Areas, distinguished by their high natural quality, are assigned a value of 6.
-
Special Protection Areas for Birds (SPA) are valued with a score of 4.
-
Sites of Community Interest (SCI) are valued with a score of 2.
Regarding historical and cultural heritage, archaeological sites and ancient pathways are initially evaluated, grouped, and assigned a value of 2, as well as sectors under agricultural protection. On the other hand, historical–cultural heritage (such as churches, chapels, etc.) is given a higher weight due to its uniqueness, with a value of 6.
Additionally, the presence of urban settlements that do not alter the environment is considered, considering elements that stand out in the landscape, such as Cultural Heritage Sites (CHSs). To assess their visual impact, a map is generated with the different urban areas, considering a 100 m influence radius. Areas within this radius are assigned a value of 2, while those outside it are not valued (value 0).
Finally, to determine the landscape quality, the various thematic layers are overlaid, following Equation (3), to generate the final landscape quality map. Greater weight is given to intrinsic quality than extrinsic quality, as the former has a more direct and perceptible impact on the landscape [12,18].
Landscape Quality = 0.6 × Intrinsic Quality + 0.4 × Extrinsic Quality
Once the landscape quality map is obtained, the next step is to assess its conservation value. This evaluation considers both the landscape quality and the vegetation:
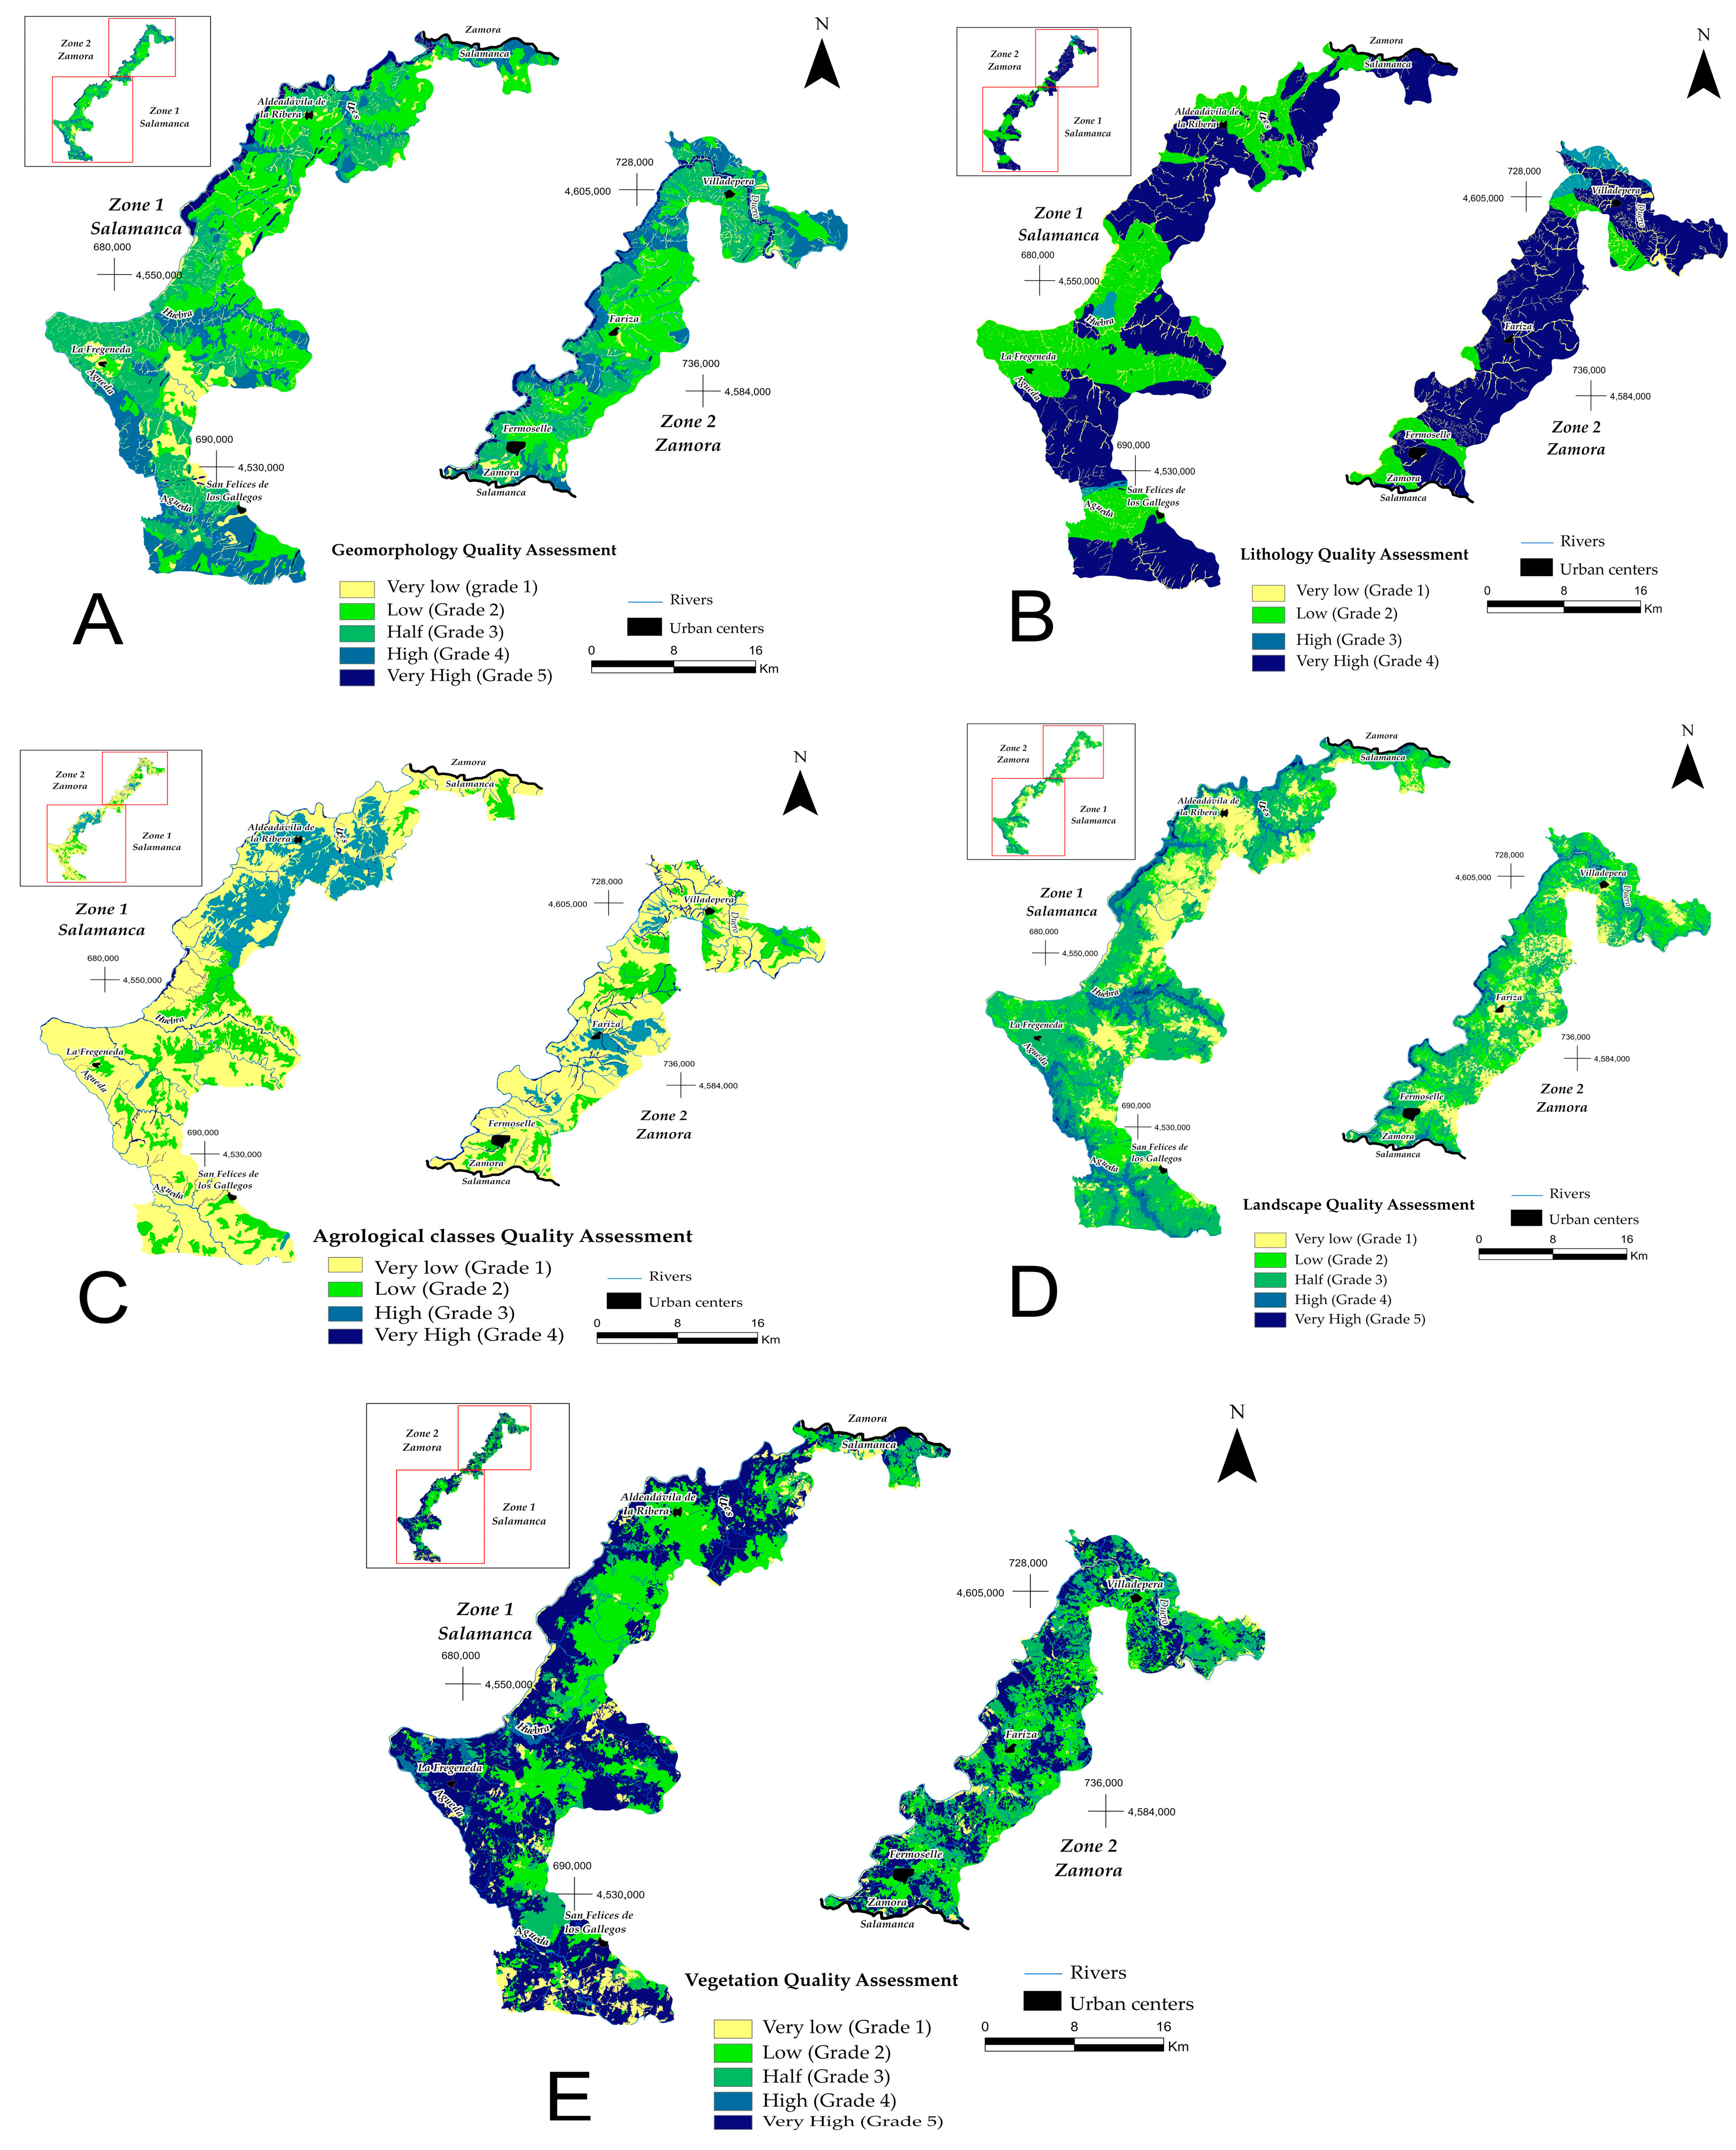
  • Landscape. This parameter is assessed on the basis of the cartography of landscape quality. This cartography is obtained from the weighting of the visual quality of a series of factors (orientations, slopes, vegetation, urban centres, and PIG, among others). The criteria for determining the visual quality of the different parameters are the perceptual singularity of the elements, their diversity, and to a lesser extent, their chromatism. The grades of the landscape unit are shown in Figure 3.
  • Vegetation. This parameter has been assessed on the basis of the scientific value and uniqueness of the plant species in terms of their notoriety in the environment and their environmental and socio-economic importance, i.e., the ecological value of each plant grouping. The assessment is shown in Figure 3.
Finally, once all the parameters have been evaluated, they are weighted using the following formula (Equation (4)):
Quality for Conservation = 5 (Geomorphological Cartography) + 5
(Landscape Quality Cartography) + 5 (Vegetation Cartography) + 4
(Lithological Cartography) + 4 (Agrological Cartography)/23

2.2. Integrated Risk Analysis

A comprehensive assessment of risks allows us to establish a series of existing limitations in the territory, by carrying out a cartography that integrates the different risks already studied, such as erosion, landslides, and natural hazards (Figure 2) [44,45,46,47]. This cartography allows us to establish the different existing problems, highlighting the areas that present the greatest risks, and it will be also useful for determining, in the future, territorial planning and regional management strategies.
-
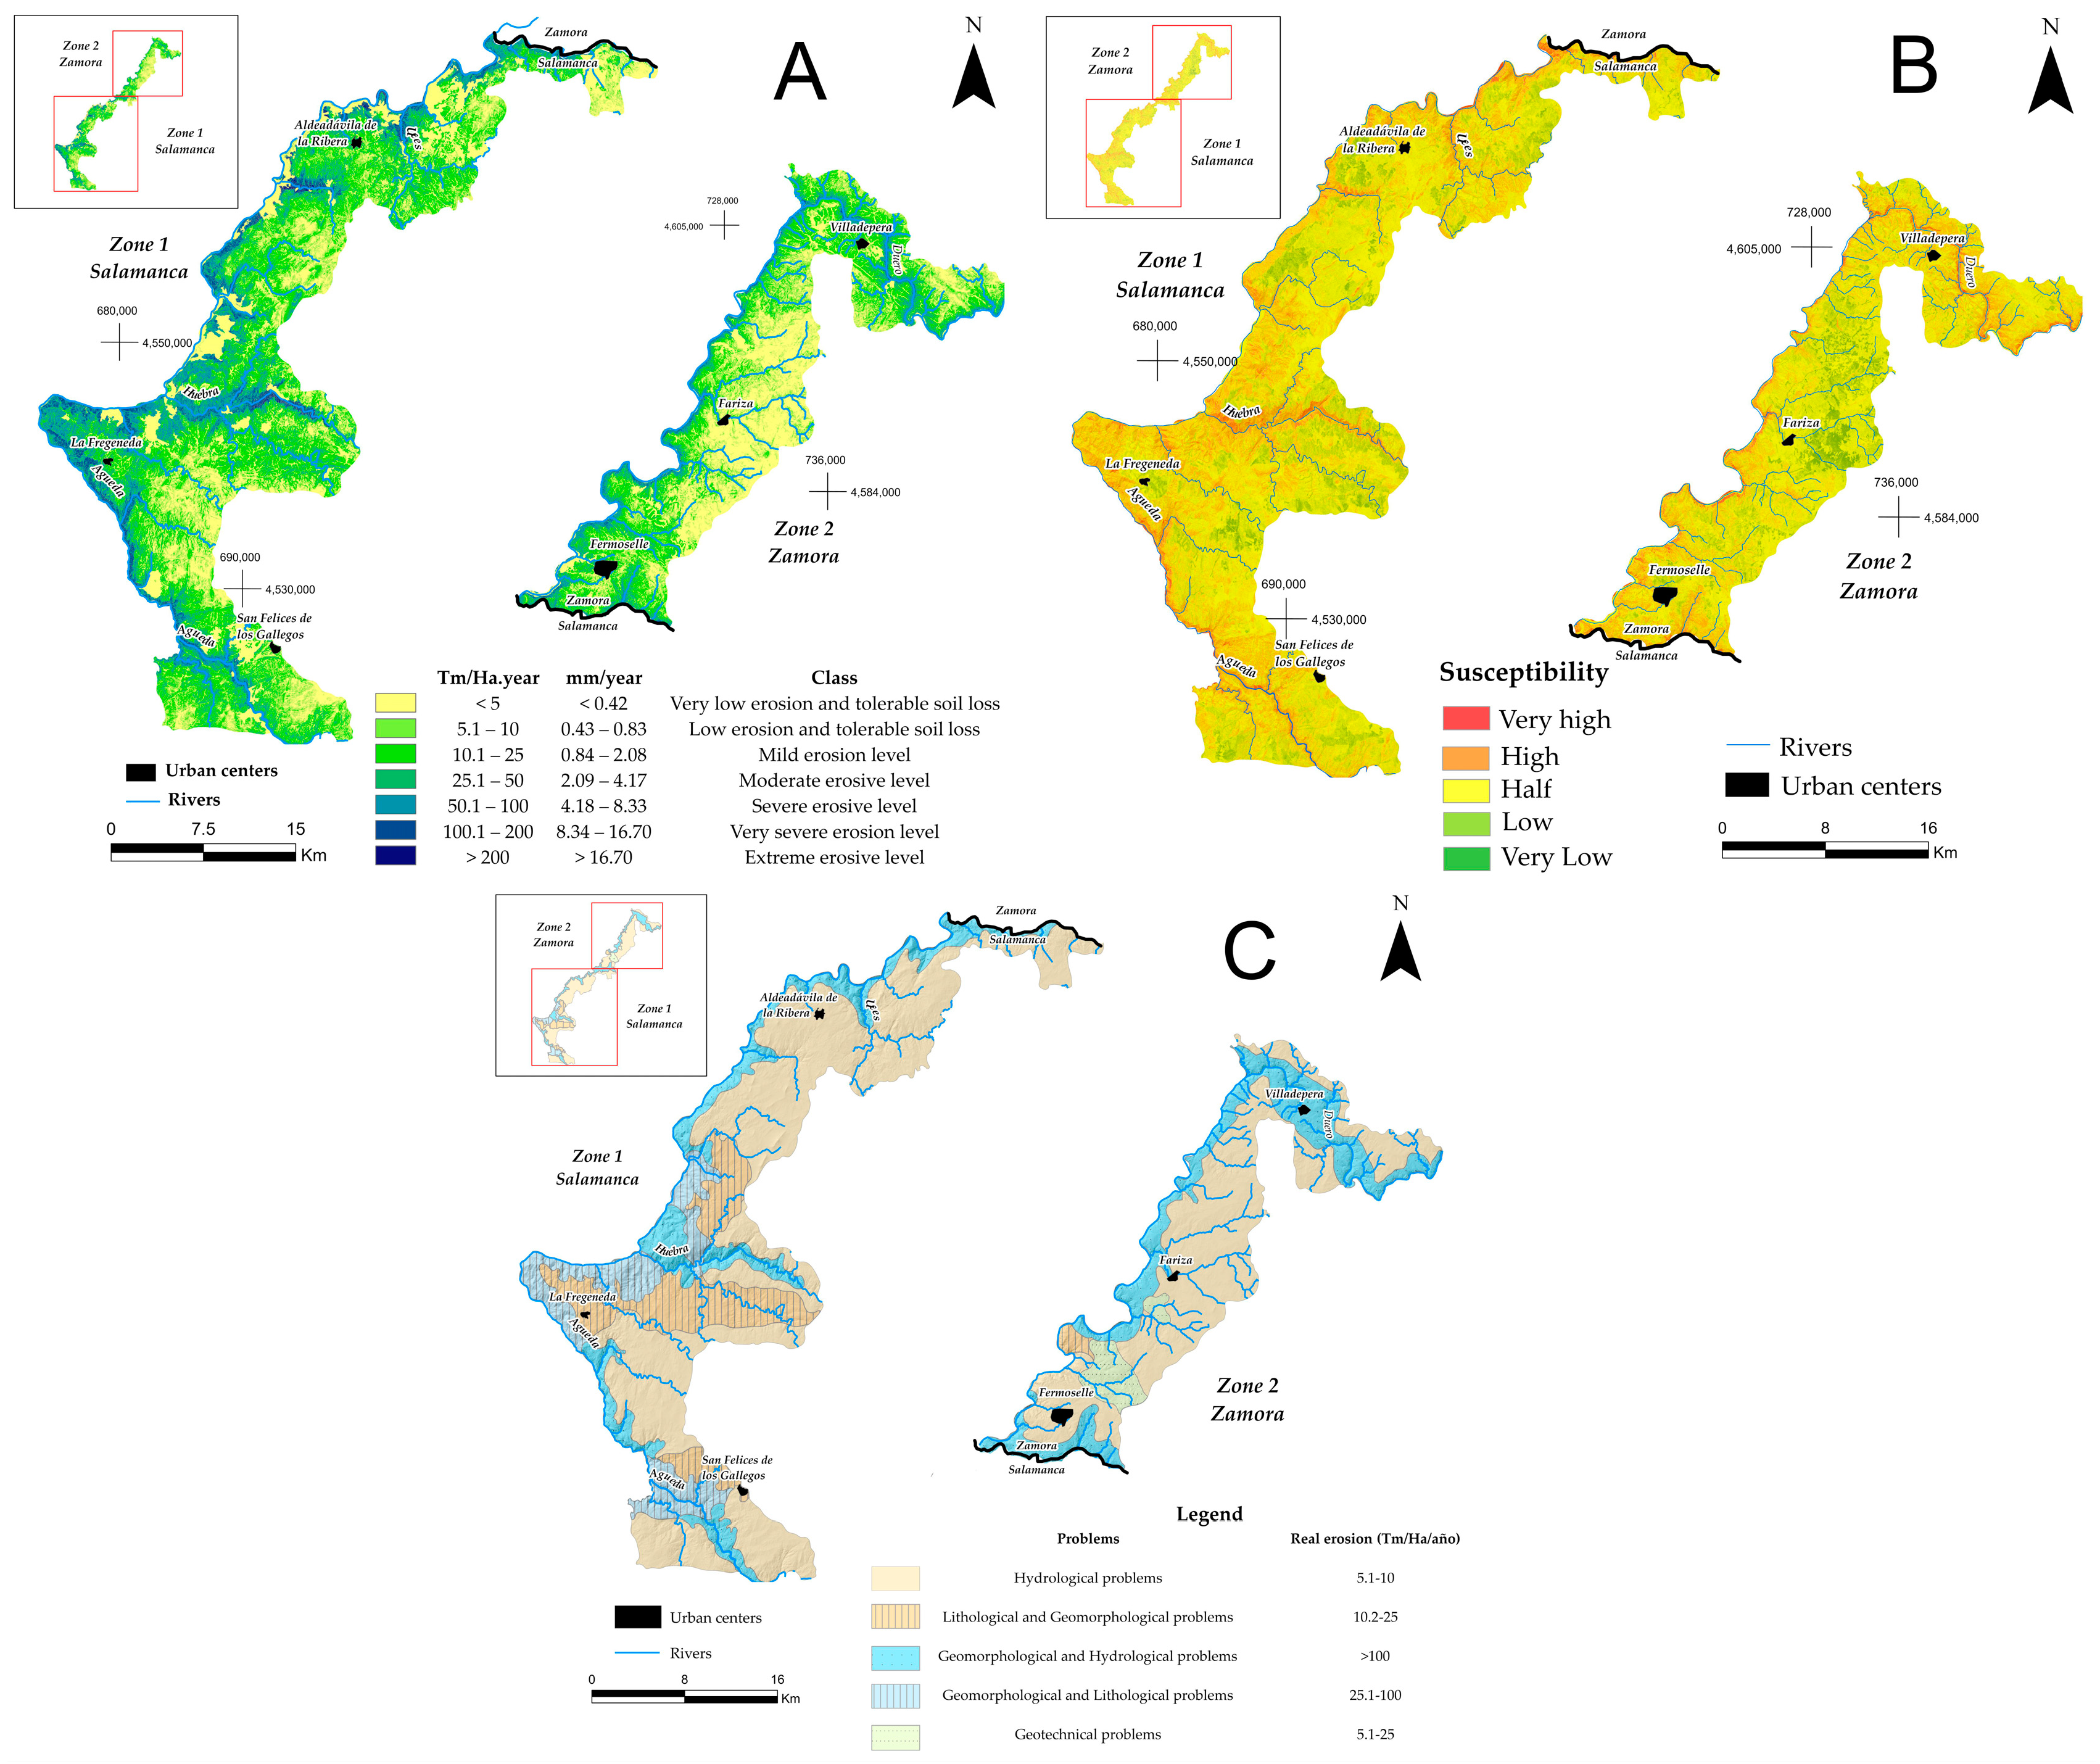
Cartography of Erosive Risks: This map indicates the current risk of water erosion, considering the erosivity, erodibility, topographic, and vegetation cover factors. For this cartography, the modified version of RUSLE [45] has been used to estimate the average annual soil loss under different conditions of use, climatic variation, relief, and use of conservation practices. This model is expressed by Equation (5):
A = R × K × LS × C × P
where A is the soil loss per unit area in a given time in Tm/ha/year, R is the rainfall erosivity factor, K is the soil erodibility factor, LS is the topographic factor covering slope length (L) and slope steepness (S), C is the land use and management factor, and P is the soil conservation practices factor.
-
Gravitational Risk Cartography: In this map, the following are observed with a greater probability of slope movement. The study of gravitational hazards is carried out by means of susceptibility cartography, which serves to establish the possible incidence of natural processes in a given area. It is also a risk prevention measure through the adoption of protective measures for exposed elements when there is no other option [47].
-
Natural Risk Cartography: This is based on the sectoral analysis of external geodynamic processes that can potentially lead to active processes. This cartography spatially predicts the existence of a given hazard risk, based on geotechnical zoning and erosion rates. The natural risks that can be observed are the following: hydrological problems; lithological and geomorphological problems; geomorphological and hydrological problems; geomorphological and lithological problems; and geotechnical problems. These problems have been classified and distinguished according to their lithological, hydrological, and geotechnical characteristics, and the actual erosion rates have also been considered.
Finally, the analysis of the recommendations and limitations of use (Figure 2) is an effective tool for the manager of Natural Parks, in the planning and future management of the different human activities. This analysis involves the creation of a cartography, which considers the geological risks and the different thematic cartographies. To do this, using map overlay techniques, using ArcGIS 10.8, the cartography of comprehensive risks is superimposed with the quality cartography for conservation. In addition, this map will be used to create, in the future, the cartography of protection degrees.

3. Results

3.1. Geological Heritage Cartography

The cartography of the geomorphological features (Figure 4A) shows that the areas of very high conservation, from the geomorphological point of view, are located in the fluvial canyon of the Duero river, the best example being in the vicinity of Aldeadávila de la Ribera and also in the Cerezal de Peñahorcada mountain range. On the other hand, the areas of high conservation are found in the valleys of the most abundant tributaries, such as the one formed by the river Huebra. Low quality is found in depressed areas, such as the Endorheic areas located in Aldeadávila de la Ribera. Finally, the areas of very low quality are those that occupy the least surface area in the park, being located mainly in the southern area.
The cartography of lithological features (Figure 4B) shows that the areas of very high conservation, from the lithological point of view, are those that occupy the greatest extension, characterised by granites, as, for example, to the south of the ENP, in San Felices de los Gallegos and, also, the quartz dykes, which are elevations of the terrain, providing a prominence, such as the Sierro de Cererezal de Peñahorcada. On the other hand, the areas of high conservation are the second most extensive, observed, for example, in La Fregeneda, and are made up of slates, schists, and metapelites, which are covered by tree-like vegetation, and therefore, have a secondary behaviour. The areas of low lithological conservation are very specific, located mainly to the south of the ENP, and are made up of quartzite. Finally, the areas of very low lithological quality are made up of conglomerates, pebbles, sands, and clays and are not very important.
Finally, the cartography of the edaphological characteristics obtained considers (Figure 4C) the study of the soils of the ENP and shows that the areas of greatest soil conservation are made up of soils with high productivity from the agricultural point of view, presenting the greatest extension. The areas of high conservation are best represented in Aldeadávila (province of Salamanca) and in Fariza (province of Zamora) and are characterised by areas whose recommended use is forestry. Low conservation is due to the fact that the soils here present permanent limitations, as a result of the steep slopes. Finally, the areas of very low conservation are very localised, corresponding to the steepest slopes, giving rise to soils that are not suitable for grazing.

3.2. Landscape Quality Cartography

The cartography of landscape quality obtained (Figure 4D) shows that the areas of very high conservation, from the landscape point of view, are the least extensive and are made up of areas considered to be of special interest, located in the fluvial canyon of the river Duero, such as, for example, in the vicinity of Fermoselle. The areas of high conservation are located in the valleys of the most abundant tributaries, such as the one formed by the river Águeda. Medium quality, on the other hand, occupies the largest area of this ENP, with the greatest representation in the areas of the crags, with flora protection figures, such as in the town of Fermoselle, for example. Finally, the areas of low and very low quality, the latter being the larger of the two, are areas of low biological diversity, with their maximum representation in the surroundings of Aldeadávila de la Ribera.
The cartography of the characterisation of the vegetation obtained (Figure 4E) shows that the areas of very high conservation, from the point of view of vegetation, are those that occupy a greater extension, characterised by vegetation with a high degree of cover, providing greater protection to the soil, observed, among other areas, in the locality of La Fregeneda. The high conservation areas, on the other hand, are specific and are characterised by the presence of scrubland, as for example, in Villadepera. As regards medium conservation, these are also very specific areas, made up of tree stands, and are more common in the Zamorano area, i.e., to the south of the ENP. The areas of low vegetative conservation are most extensive between Adeadávila de la Ribera and the valley formed by the river Huebra. Finally, the areas of very low quality are very localised, concentrated in the southern part of the ENP and are areas of anthropic origin.

3.3. Erosive, Gravitational, and Natural Hazard Cartography

The cartography of erosion risks (Figure 5A) shows the greatest erosion in areas with steep slopes and little vegetation, located where the rivers meet, especially in the case of the Duero and its most abundant tributaries, the Tormes, Águeda, Uces, and Huebra, with erosive losses of between 50.1 and >200 Tm/Ha/year. These high erosive losses are a consequence of the steep slopes that cause an increase in the speed of surface runoff, causing the most susceptible materials to erosion to be carried away, coinciding, in addition, with vegetation with little protective power, with low percentages of cover, such as conifers and broadleaved trees. As for the lowest erosion values, they are observed in the plain areas; that is, the slope is null or scarce, with losses less than 0.42 mm/year. Unlike the previous one, the vegetation has a greater density and herbaceous cover, thus providing greater protection [45].
The cartography of gravitational hazards (Figure 5B) shows the Duero river canyon and the areas of embedded valleys of the tributaries with the highest flow, which, in turn, are areas with high slopes and non-existent vegetation. As for the areas with low and very low gravitational risk, they are the pediments and alluvial fans, erosion surfaces, terraces, and valley bottoms, with shrub-type vegetation and a slight or no inclination [47].
The natural hazard cartography (Figure 5C) shows that the hydrological problems are the most extensive, coinciding with the flat areas. The lithological and geomorphological problems are concentrated between the municipality of La Fregeneda and the Huebra River, with greater slopes. The geomorphological and hydrological problems are located in the steepest areas, that is, in the Duero river canyon or in the valleys of the tributaries [47].

3.4. Quality Cartography for Conservation

Quality cartography for conservation (Figure 6), made from the weighting of the cartographies of the different natural resources, provides information regarding the evaluation of the natural environment to determine the sectors of the territory that should be protected. It assesses each unit globally, considering its uniqueness and relevance and determining the value of its quality for conservation.
In the obtained cartography, it is possible to observe four zones depending on the degree of conservation. The zones that present a very high quality for conservation are located in areas of the Duero river canyon, in the narrow valleys of the most powerful rivers such as the Huebra, and in the mountain ranges, such as Cerezal de Peñahorcada. In addition, they are areas with well-preserved and perceptible forms, and, in addition, they are considered as protected for flora and fauna species. The high conservation zones are those that present a greater extension in the ENP; they are similar to the previous ones, and they correspond to valley areas, with vegetation in a good state of conservation; an example can be seen in the area of La Fregeneda. The low conservation zones are observed in areas of pediments and alluvial fans, and in erosion surfaces, such as, for example, in the surroundings of Aldeadávila de la Ribera, presenting vegetation of very low scientific interest, dedicated to agriculture and livestock. Finally, the areas of very low quality are those with a smaller extension and are located in the valley bottoms and also on the erosion surfaces that show greater degradation and that, in addition, are sectors that present very low or zero percentages of vegetation cover, such as in the Cerezal de Peñahorcada and Mieza area.

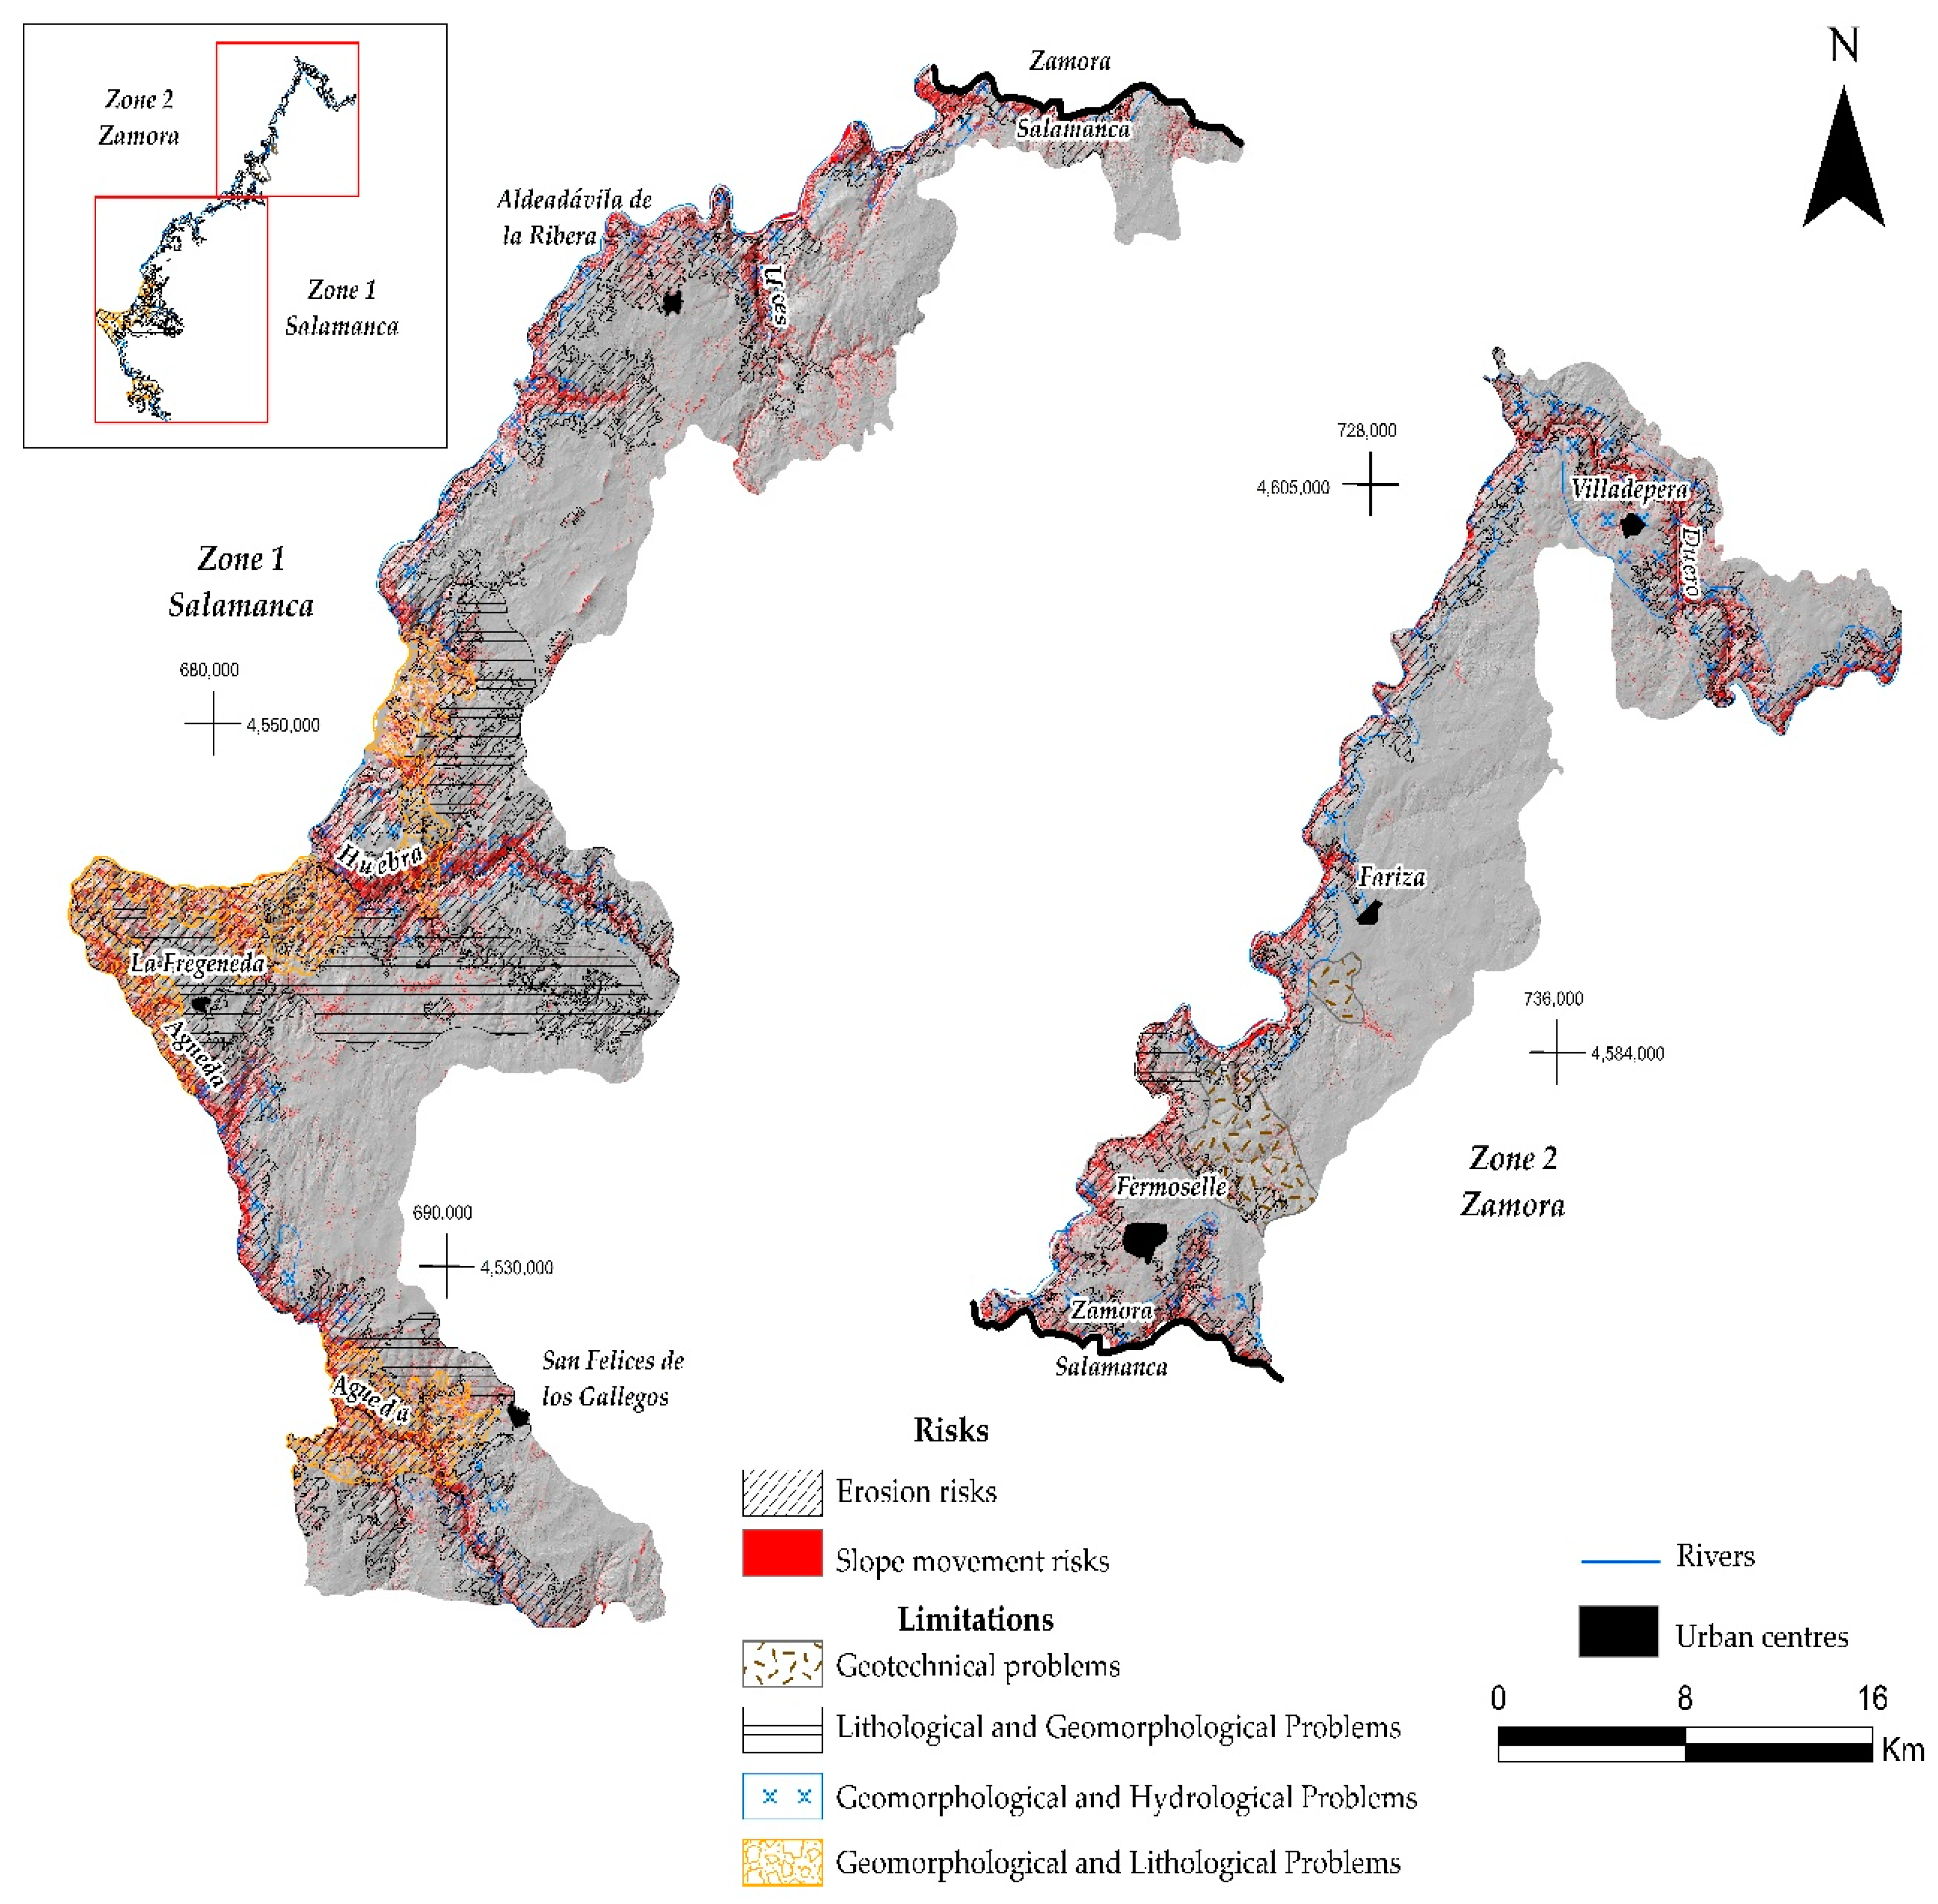
3.5. Integrated Risk Cartography

The integrated risk cartography obtained (Figure 7) allows us to define the limitations of the ENP, in order to determine the uses of the land, that is, what limitations anthropic activities have based on the different risks.
The areas with the highest risks (erosion and landslides) can be seen on the map, mostly coinciding, although the erosion is more extensive, concentrated in the areas of the Duero river canyon and the narrow valleys of the largest rivers (Águeda, Tormes, Huebra, and Uces). As for the limitations, there are four: Lithological and geomorphological problems, which occur in areas with a slight slope and medium erosion rates, with a lower percentage of herbaceous cover and with impermeable materials with planes of weakness, such as joints or fractures, causing instability. These problems are observed, for example, in the Sierra de Peñahorcada. Geomorphological and hydrogeological problems, with a predominance of the former, are located in areas with a high slope, with high erosion rates, with arkosic and clayey materials, and with vegetation with low herbaceous cover. An example of this is the landslides observed in the narrow valleys of the largest rivers. These are associated with impermeable materials, with the presence of active surface runoff, presenting tolerable soil losses, due to the fact that the existing vegetation is of great density and herbaceous cover. An example of this type of problem is observed in the town of Trabanca. Geomorphological and lithological problems, associated with areas of not steep slopes, materials that present planes of weakness, moderate and medium erosion rates, and vegetation of greater coverage. They are found in the very localised areas of Fregeneda and San Felices de los Gallegos. Finally, geotechnical problems, observed in a very localised area located in Fermoselle with loose and permeable sandy materials, with a low–medium degree of erosion and dense vegetation and acceptable coverage.

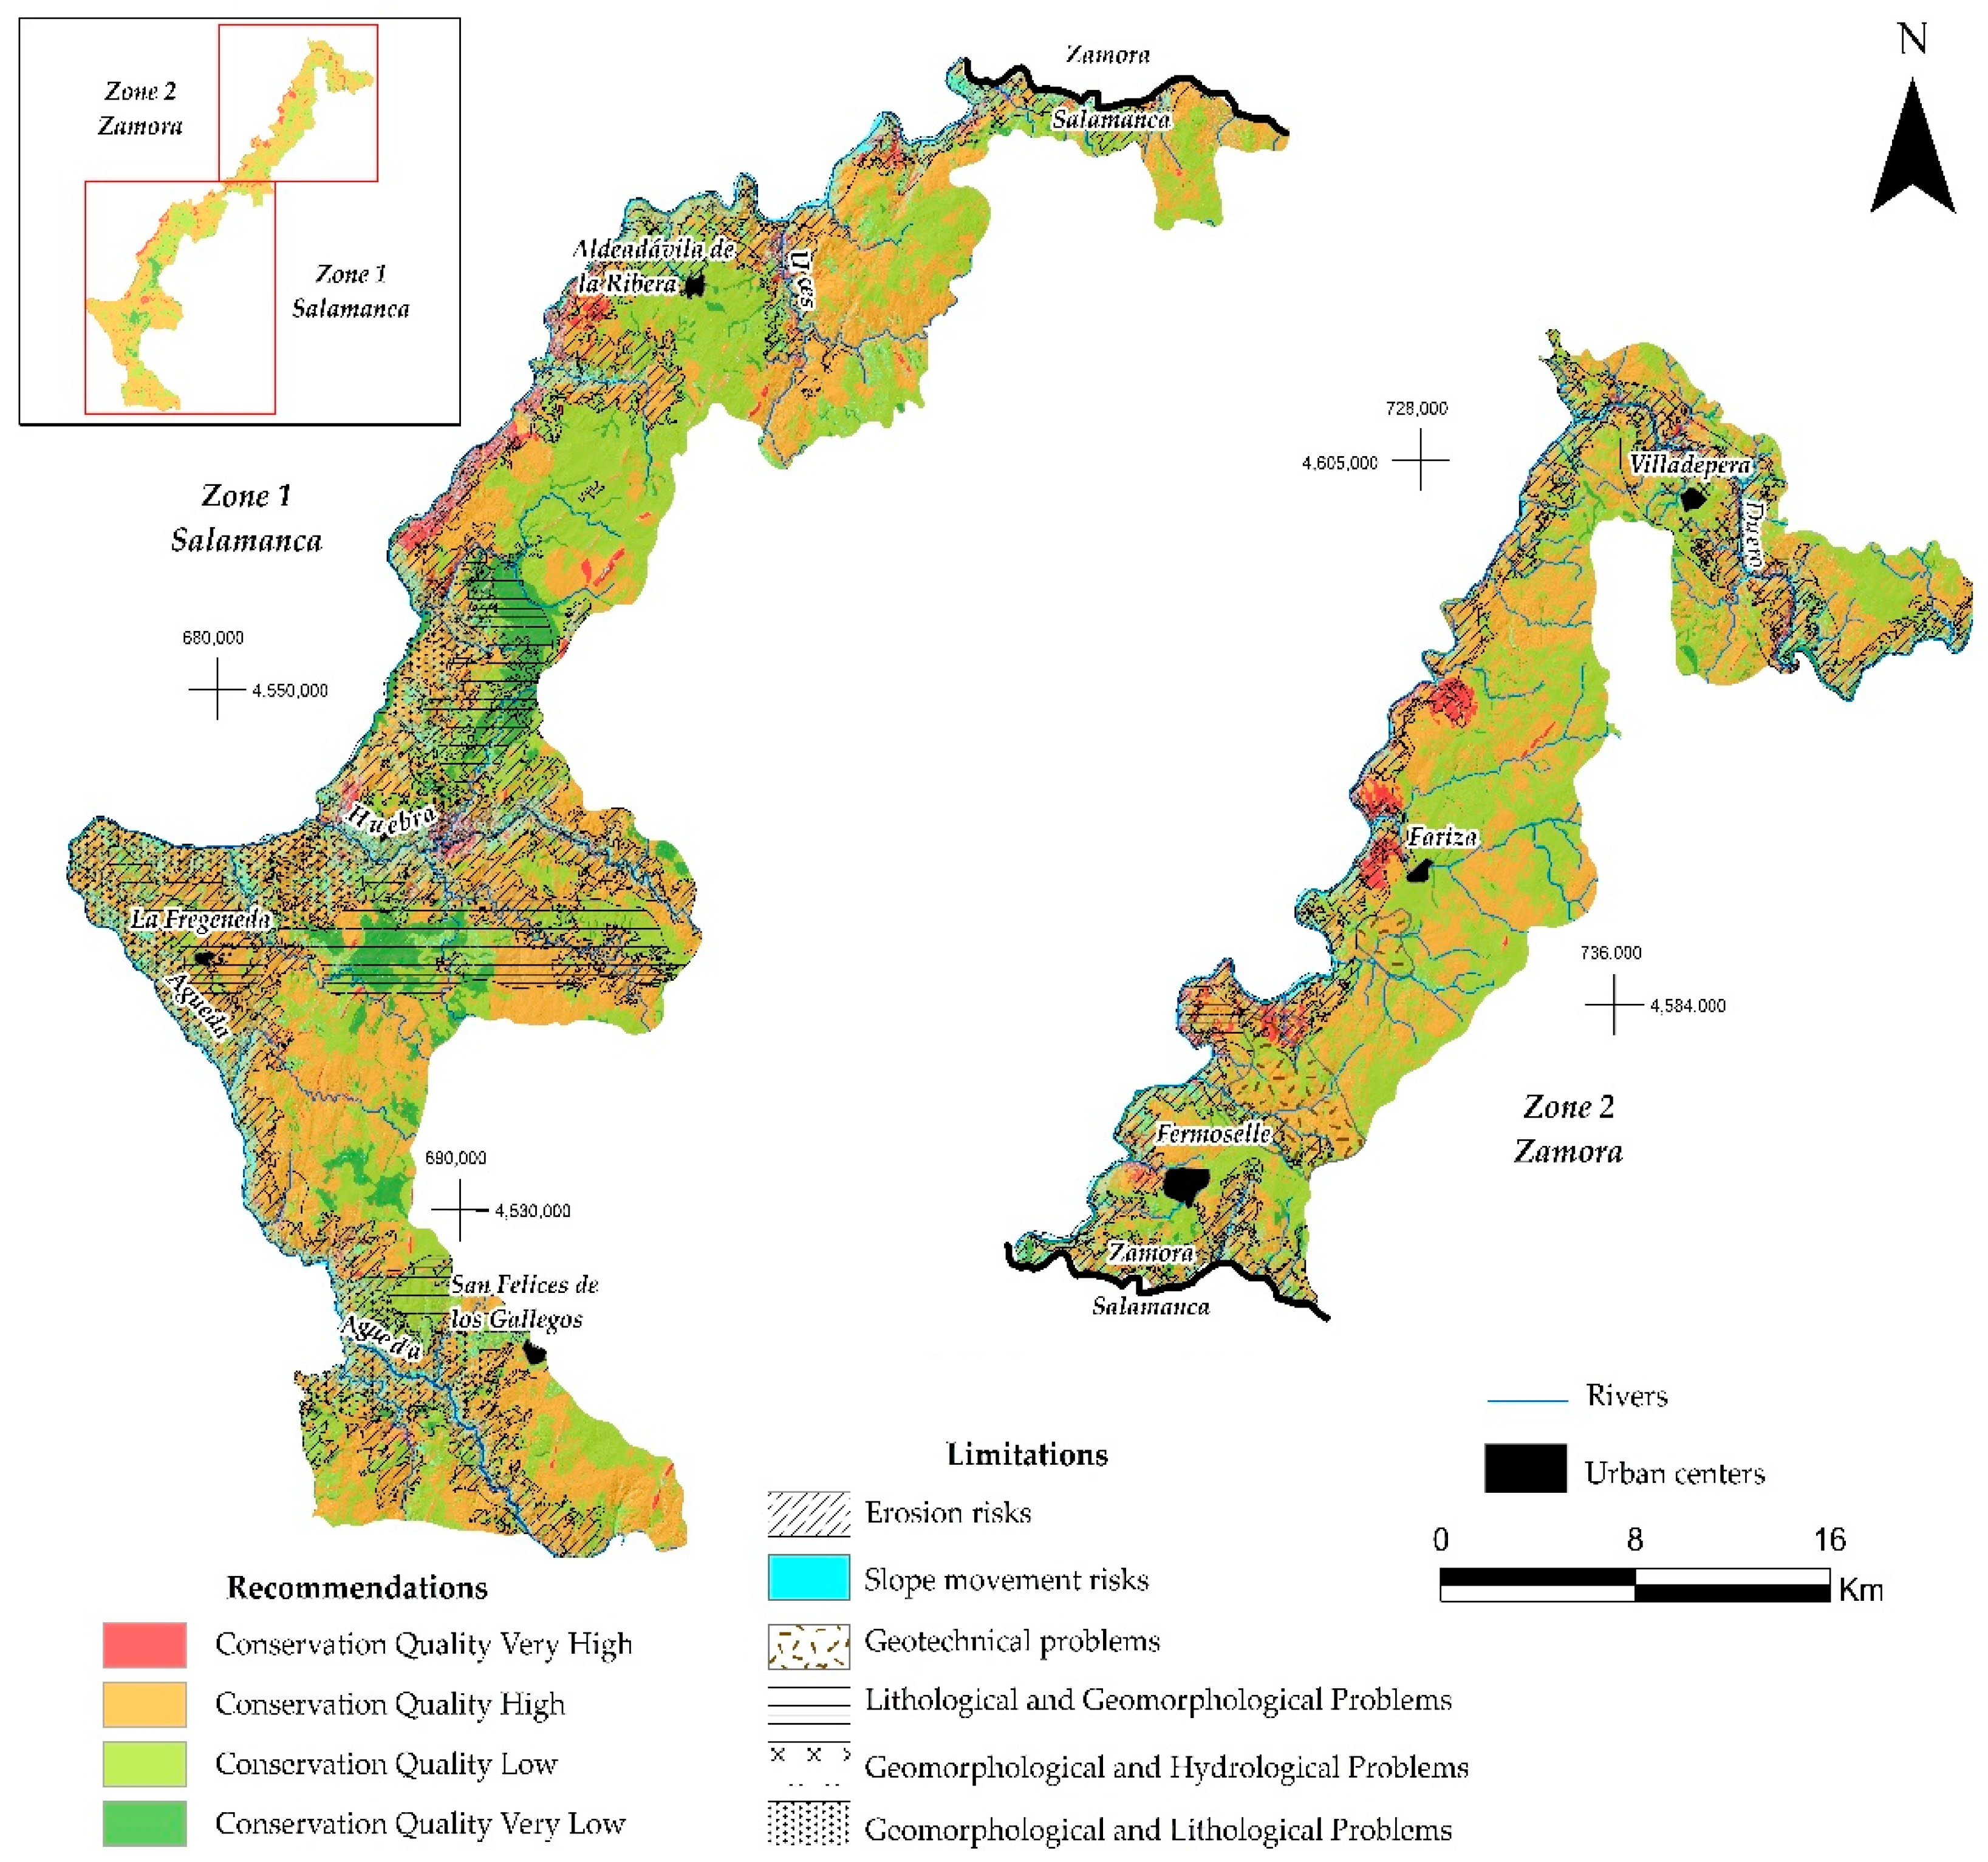
3.6. Cartography of Recommendations and Limitations

The superposition of the quality for conservation and comprehensive risk maps allows for obtaining a cartography of recommendations and limitations of uses (Figure 8). In this way, the information provided allows the ENP management body to determine where it is advisable to place the different anthropic activities, considering the conservation category and the limitations that exist based on the risks. It also allows establishing the capacity of assimilation of the impact by the environment, so that this capacity will be lower in high-quality and high-fragility sectors and vice versa. On the other hand, the limitations that a territory presents from the point of view of planning and management are those imposed by the presence of the different associated natural risks.
In sectors with a very high conservation quality, such as Aldeadávila and the Cerezal de Peñahorcada mountain range (Figure 9A), we find lithological and geomorphological limitations, as well as risks of erosion and slope movements (Figure 9B). These are environmental landscape units of quartz and granite dikes (Figure 9C), without vegetation, which present a high–very high probability of natural risks; therefore, the main compatible use is conservation, although there may be sectors with restricted use, through special permission, with the rest of the uses being prohibited, such as, for example, the construction of infrastructure, previously having to go through an Environmental Impact Assessment (EIA). As for the high-quality conservation areas, whose predominant lithology is schist, slate, and metapelite (Figure 9D), tree formations, and bushes, they present a medium–low limitation due to erosive risks (Figure 9E); therefore, they are conditioned to certain activities and infrastructures, in addition to the realisation of leisure activities and natural improvement.
As for the low quality for conservation, it is located among other sites in Fermoselle, and it corresponds to quartzite units, with mixed formations, presenting a low-risk limitation, so their degree of protection is low. In this way, most anthropic activities are acceptable, although the circulation of vehicles is restricted in certain areas, the exploitation of resources and the installation of infrastructures being permitted, provided that a prior study is carried out.
Finally, the areas of very low conservation quality are observed on the lithological unit of conglomerates, sands, and gravels (Figure 9F), presenting limitations due to very low risk. These are sectors without limitations of use (livestock and agriculture), restricting certain projects where the environmental impact must have been previously analysed in specific studies.

4. Discussions

SEA applied to natural hazards is a crucial approach to ensure that the development of land-use plans and projects considers human needs, the protection of the environment, and the prevention of negative impacts from natural phenomena such as landslides or erosion. It allows the integration of geological, geomorphological, and pedological knowledge, as well as the different risks in land-use planning. In this way, both ecological and social aspects are considered, as well as natural hazards that may affect the development of human activities. The analysis of natural risks makes it possible to identify vulnerable zones, such as areas where landslides or soil loss are more likely to occur, and also to establish preventive or restrictive measures (such as soil stabilisation) to avoid the occupation of these lands [48,49].
The application of predictive modelling in risk assessment within EAS is important because it anticipates possible future risk scenarios. These models are based on the use of land-use, climatic, lithological, and geomorphological data, predicting natural phenomena and how they affect a given area. Furthermore, applying these models in the planning phase facilitates decision-making on possible activities and determines which are feasible and which should be avoided to minimise negative impacts [48,49].
In addition, SEA implemented in Geological Risk Management can reduce human and material losses, improve resilience to natural disasters, promote sustainable development compatible with geological conditions, and also optimise public investment in safe infrastructure [48,49].
The use of the INSPIRE Directive and LISIGE in SEA facilitates access to accurate and up-to-date geospatial information, promotes data integration, and improves collaboration between different administrations and sectors. All this facilitates better land management, more efficient planning, and more informed decision-making, especially in the identification and mitigation of geological hazards.
Quality cartography for conservation is a fundamental tool to identify and protect sectors of the territory with high environmental value. This process allows land managers and planners to make informed decisions about the areas that should be subject to strict conservation, thus minimising the impact of human activities that may damage their ecological value. To do so, an assessment of different natural parameters is carried out, such as geomorphology, landscape, vegetation, lithology, and agrological classes of soils. These factors are weighted to obtain a comprehensive view of the territory that allows its value for conservation to be assessed. In terms of urban planning, this map, known as the ‘Map of Recommendations and Limitations’, is a non-structural tool that indicates sensitive areas that should not be affected by human activities.
Geomorphological analysis is an essential component for quality mapping. This parameter considers the uniqueness and degree of conservation of geomorphological units, as well as their visual perception, which can be affected by vegetation cover. In this sense, areas with a higher degree of geomorphological conservation, such as the Duero river canyon or the Cerezal de Peñahorcada mountain range, are considered to be of high conservation value due to their uniqueness and good state of preservation. On the other hand, degraded areas or those with a less perceptible morphology, such as alluvial fans or eroded surfaces, are classified with a lower value.
The landscape is another key parameter in quality mapping for conservation. In this case, the assessment of the landscape is based on its visual quality, considering aspects such as diversity, perceptual uniqueness, and, to a lesser extent, chromaticity. The areas of higher landscape quality usually coincide with rugged areas, such as the Duero river canyon, which are not only valuable from an ecological point of view but also for their uniqueness. These areas should not only be protected for their visual value but also because they contribute to the identity of the natural landscape and can be important for preserving both ecosystems and the cultural and recreational values associated with them. On the other hand, areas of low landscape quality, such as sectors with low biological diversity or with homogeneous structures, usually coincide with areas that have already been impacted by human activity, such as agricultural areas or eroded areas. These areas require restoration plans to improve their visual quality and ecological value [50,51,52].
The state of conservation of vegetation is another determining factor in quality mapping. Vegetation is not only a key indicator of ecosystem health but also plays a fundamental role in soil protection and erosion mitigation [53]. Areas with dense and well-preserved vegetation, such as tree formations of high ecological value, are valued with a high conservation grade, since these formations regulate critical ecological processes such as water filtration and protection against erosion and also provide refuge for various species. On the other hand, degraded areas or areas dedicated to agricultural or livestock uses, which have less vegetation cover, receive a lower rating. These areas are more susceptible to erosion and biodiversity loss, and therefore, require conservation or ecological restoration interventions to recover their environmental function.
Lithology is also a key aspect of quality cartography, which is responsible for analysing the intrinsic characteristics of rock formations and their relevance in the natural environment. The most significant rock formations, such as granite outcrops or quartz dikes, which have a prominent role in the landscape, as well as being resistant to erosion, are valued with high degrees of conservation. These formations are not only important from a geological point of view but can also be refuges for plant or animal species. On the contrary, less relevant lithological formations, such as conglomerates and sands, do not offer a significant landscape or ecological value; they are considered to be of low quality for conservation. This lithological analysis is useful to identify areas that may need special protection due to their unique geological characteristics.
Agrology, or soil quality, is analysed from the perspective of its productivity and capacity to support certain uses, such as agriculture or forestry. This parameter is essential for land-use planning, as it allows identifying areas that can be sustainably exploited for agricultural or forestry activities without compromising the conservation of natural resources [54,55,56]. More fertile soils with fewer limitations for cultivation are valued with higher conservation grades. However, soils with unfavourable characteristics, such as those located on steep slopes or with a high risk of erosion, receive a low rating.
Quality cartography for conservation not only allows identifying areas of high ecological importance but is also a fundamental tool for land management [15,34,35,36]. In particular, in the context of Natural Parks, this mapping is vital for planning human activities, as it can point out areas where urban or agricultural development should be avoided and where restoration measures need to be implemented.
Risk cartography is another essential tool for land planning, as it allows identifying the areas most vulnerable to phenomena such as erosion or landslides [15]. These areas, which often coincide with areas of high slope and scarce vegetation cover, require special protection to prevent soil degradation and biodiversity loss.
Comprehensive risk analysis, combined with quality conservation cartography, provides a complete view of the limitations and recommendations presented by the territory. This allows planners and managers to make more informed decisions about land use and the conservation strategies to be implemented.

5. Conclusions

  • Strategic Environmental Assessment (SEA), as a tool for sustainable development, promotes sustainable urban and territorial development, in which geological risks—reflected in maps—are integrated with quality analysis for conservation. All this is completed through the cartographic analysis of available resources, allowing an integrated vision of the territory.
  • Planning in natural areas with a risk-based approach: Territorial planning within natural areas makes it possible to delimit areas of greater protection and to define those with restrictions on use. This is based on the cartography elaborated, incorporating in a novel way natural risk as an essential part of the SEA.
  • Quality cartography for conservation: Quality cartography makes it possible to identify the areas of the territory that should be protected according to their degree of conservation. Four zones are distinguished:
    -
    Very high conservation: corresponds to areas such as the Duero canyon, the narrow valleys of the most plentiful rivers, and mountain ranges such as Cerezal de Peñahorcada.
    -
    High conservation: found in valley areas, such as near La Fregeneda.
    -
    Low conservation: located in foothill areas, such as in the municipality of Aldeadávila de la Ribera.
    -
    Very low conservation: covers valley bottoms and degraded eroded areas, such as those of Cerezal de Peñahorcada and Mieza.
  • Integrated risk cartography: This cartography identifies land-use limitations and provides useful information from the project phase, supporting territorial planning and management strategies. High-risk areas—both erosion and slope movement—are concentrated in the Duero canyon and in the narrow valleys of the most important tributaries. Various types of problems are also found:
    -
    Lithological and geomorphological: in areas with gentle slopes and highly fractured impermeable materials (e.g., Sierra de Peñahorcada).
    -
    Geomorphological and hydrogeological: in areas with steep slopes and clayey or arcose materials, with landslides and rock falls.
    -
    Combined lithological and geomorphological: in areas with materials that present planes of weakness, such as stratification or diaclasation.
    -
    Geotechnical: located in areas close to Fermoselle, with loose and permeable materials.
  • Cartography of recommendations and limitations for use: this type of cartography allows the managers of the Protected Natural Space (ENP) to define the most suitable locations for human activities, taking into account both the conservation category and the limitations derived from natural risks.
    -
    In areas of very high conservation and high risk, uses are compatible with conservation, although there may be sectors with restrictions (e.g., Cerezal de Peñahorcada).
    -
    Areas of high conservation quality present medium or low erosive risks (such as gully formation), so the implementation of activities is conditioned.
    -
    In low-quality areas, the degree of protection is lower, and most anthropogenic activities are acceptable.
    -
    Finally, in very low-quality zones, there are very few limitations on use, allowing activities such as livestock or agriculture without significant restrictions.

Author Contributions

Conceptualisation, L.M., A.M.M.-G. and C.E.N.; methodology, L.M.; software, L.M. and A.M.M.-G.; validation, L.M. and A.M.M.-G.; formal analysis, L.M., A.M.M.-G. and C.E.N.; investigation, L.M. and A.M.M.-G.; resources, L.M., A.M.M.-G. and C.E.N.; data curation, L.M. and A.M.M.-G.; writing—original draft preparation, L.M. and A.M.M.-G.; writing—review and editing, L.M. and A.M.M.-G.; visualisation, L.M. and A.M.M.-G.; supervision, A.M.M.-G.; project administration, A.M.M.-G.; funding acquisition, A.M.M.-G. All authors have read and agreed to the published version of the manuscript.

Funding

Grant 131874B-I00 funded by MCIN/AEI/10.13039/501100011033.

Data Availability Statement

The original contributions presented in the study are included in the article, further inquiries can be directed to the corresponding author.

Acknowledgments

This research was assisted by the GEAPAGE research group (Environmental Geomorphology and Geological Heritage) of the University of Salamanca.

Conflicts of Interest

The authors declare no conflicts of interest.

References

  1. Cardinale, B.J.; Duffy, J.E.; Gonzalez, A.; Hooper, D.U.; Perrings, C.; Venail, P.; Naeem, S. Biodiversity loss and its impact on humanity. Nature 2012, 486, 59–67. [Google Scholar] [CrossRef] [PubMed]
  2. Annex, V.I.I.I. Report of the Plenary of the Intergovernmental Science-Policy Platform on Biodiversity and Ecosystem Services on the Work of its Third Session; IPBES: Bonn, Germany, 2019. [Google Scholar]
  3. Martínez, M.L.; Intralawan, A.; Vázquez, G.; Pérez–Maqueo, O.; Sutton, P.; Landgrave, R. The Coasts of Our World: Ecological, Economic and Social Importance. Ecol. Econ. 2007, 63, 254–272. [Google Scholar] [CrossRef]
  4. Adger, W.N.; Hughes, T.P.; Folke, C.; Carpenter, S.R.; Rockstrom, J. Social-ecological resilience to coastal disasters. Science 2005, 30, 1036–1039. [Google Scholar] [CrossRef]
  5. Jin, X.; Luan, W.; Yang, J.; Yue, W.; Wan, S.; Yang, D.; Xiao, X.; Xue, B.; Dou, Y.; Lyu, F.; et al. From the Coast to the Interior: Global Economic Evolution Patterns and Mechanisms. Humanit. Soc. Sci. Commun. 2023, 10, 723. [Google Scholar] [CrossRef]
  6. Burke, L.; Kura, Y. Pilot Analysis of Global Ecosystems: Coastal Ecosystems; World Resources Institute: Washington, DC, USA, 2000. [Google Scholar]
  7. Bender, S. Primer on Natural Hazard Management in Integrated Regional Development Planning; Organization of American States, Department of Regional Development and Environment; Executive Secretariat for Economic and Social Affairs: Washington, DC, USA, 1991. [Google Scholar]
  8. Alexander, D. Natural Disasters; Routledge: London, UK, 2018. [Google Scholar]
  9. Mileti, D. Disasters by Design: A Reassessment of Natural Hazards in the United States; Joseph Henry Press: Washington, DC, USA, 1999. [Google Scholar]
  10. Adger, W.N. Vulnerability. Glob. Environ. Change 2006, 16, 268–281. [Google Scholar] [CrossRef]
  11. Cutter, S.L.; Barnes, L.; Berry, M.; Burton, C.; Evans, E.; Tate, E.; Webb, J. A Place–Based Model for Understanding Community Resilience to Natural Disasters. Glob. Environ. Change 2008, 18, 598–606. [Google Scholar] [CrossRef]
  12. Burby, R.J.; May, P.J. Making Governments Plan: State Experiments in Managing Land Use; JHU Press: Baltimore, MD, USA, 1997. [Google Scholar]
  13. Godschalk, D.R. Urban Hazard Mitigation: Creating Resilient Cities. Nat. Hazards Rev. 2003, 4, 136–143. [Google Scholar] [CrossRef]
  14. Safani, J.; Matsuoka, T. Soft–Geotechnical Zone Determination Using Surface–Wave for Geotechnical Hazard Mitigation. Procedia Environ. Sci. 2013, 17, 354–360. [Google Scholar] [CrossRef]
  15. Haeri, S.M. The Role of Geotechnical Engineering in Sustainable and Resilient Cities. Sci. Iran. 2016, 23, 1658–1674. [Google Scholar] [CrossRef]
  16. Mendoza-González, G.; Martínez, M.; Lithgow, D.; Pérez-Maqueo, O.; Simonin, P. Land use change and its effects on the value of ecosystem services along the coast of the gulf of mexico. Ecol. Econ. 2012, 82, 23–32. [Google Scholar] [CrossRef]
  17. Mehvar, S.; Filatova, T.; Dastgheib, A.; De Ruyter Van Steveninck, E.; Ranasinghe, R. Quantifying Economic Value of Coastal Ecosystem Services: A Review. J. Mar. Sci. Eng. 2018, 6, 5. [Google Scholar] [CrossRef]
  18. Baby, S.; Nagyvaradi, L.; Balassa, B. Choropleth mapping and interpolation technique to analyze the demographic influence on kuwait’s coastal morphological landscape. Environ. Eng. Manag. J. EEMJ 2016, 15, 1. [Google Scholar] [CrossRef]
  19. Antrop, M. Why landscapes of the past are important for the future. Landsc. Urban Plan. 2005, 70, 21–34. [Google Scholar] [CrossRef]
  20. Martínez-Graña, A.M.; Goy, J.L.; Zazo, C. Cartographic-environmental analysis of the landscape in natural protected parks for his management using GIS. Application to the natural parks of the “Las Batuecas-Sierra de Francia” and “Quilamas” (Central System, Spain). J. Geogr. Inf. Syst. 2013, 5, 54–68. [Google Scholar] [CrossRef]
  21. Nohl, W. Sustainable landscape use and aesthetic perception–preliminary reflections on future landscape aesthetics. Landsc. Urban Plan. 2001, 54, 223–237. [Google Scholar] [CrossRef]
  22. Martín Serrano, A. El relieve del Macizo Hespérico: Génesis y cronología de los principales elementos morfológicos. Cuad. Lab. Xeolóxico Laxe 1994, 19, 37–56. [Google Scholar]
  23. Ledda, A.; Di Cesare, E.A.; Satta, G.; Cocco, G.; De Montis, A. Integrating adaptation to climate change in regional plans and programmes: The role of strategic environmental assessment. Environ. Impact Assess. Rev. 2021, 91, 106655. [Google Scholar] [CrossRef]
  24. Wende, W.; Bond, A.; Bobylev, N.; Stratmann, L. Climate change mitigation and adaptation in strategic environmental assessment. Environ. Impact Assess. Rev. 2012, 32, 88–93. [Google Scholar] [CrossRef]
  25. Geneletti, D. A conceptual approach to promote the integration of ecosystem services in strategic environmental assessment. J. Environ. Assess. Policy Manag. 2015, 17, 1550035. [Google Scholar] [CrossRef]
  26. Rodrigues, T.; Geißler, G.; Montaño, M. Addressing climate change in Berlin’s local land-use plans through strategic environmental assessment and knowledge brokering. Environ. Impact Assess. Rev. 2024, 110, 107651. [Google Scholar] [CrossRef]
  27. Goonesekera, S.M.; Olazabal, M. Climate adaptation indicators and metrics: State of local policy practice. Ecol. Indic. 2022, 145, 109657. [Google Scholar] [CrossRef]
  28. Bradaschia, M.G.; Longato, D.; Maragno, D.; Musco, F. Climate change adaptation mainstreaming through strategic environmental assessments. An in-depth analysis of environmental indicators from spatial plans in Friuli Venezia Giulia Region (Italy). Environ. Impact Assess. Rev. 2024, 109, 107650. [Google Scholar] [CrossRef]
  29. Arabameri, A.; Saha, S.; Mukherjee, K.; Blaschke, T.; Chen, W.; Ngo, P.T.T.; Band, S.S. Modeling Spatial Flood Using Novel Ensemble Artificial Intelligence Approaches in Northern Iran. Remote Sens. 2020, 12, 3423. [Google Scholar] [CrossRef]
  30. Esmaili, R.; Karipour, S.A. Comparison of weighting methods of multicriteria decision analysis (MCDA) in evaluation of flood hazard index. Nat. Hazards 2024, 120, 8619–8638. [Google Scholar] [CrossRef]
  31. Rocha, C.; Antunes, C.; Catita, C. Coastal vulnerability assessment due to sea level rise: The case study of the Atlantic coast of mainland Portugal. Water 2020, 12, 360. [Google Scholar] [CrossRef]
  32. Kunte, P.D.; Jauhari, N.; Mehrotra, U.; Kotha, M.; Hursthouse, A.S.; Gagnon, A.S. Multi–Hazards Coastal Vulnerability Assessment of Goa, India, Using Geospatial Techniques. Ocean Coast. Manag. 2014, 95, 264–281. [Google Scholar] [CrossRef]
  33. Stalhandske, Z.; Steinmann, C.B.; Meiler, S.; Sauer, I.J.; Vogt, T.; Bresch, D.N.; Kropf, C.M. Global Multi–Hazard Risk Assess-501 ment in a Changing Climate. Sci. Rep. 2024, 14, 5875. [Google Scholar] [CrossRef]
  34. Marino Alfonso, J.L.; Poblete Piedrabuena, M.Á.; Beato Bergua, S.; Herrera Arenas, D. Geotourism itineraries and augmented reality in the geomorphosites of the Arribes del Duero Natural Park (Zamora Sector, Spain). Geoheritage 2021, 13, 16. [Google Scholar] [CrossRef]
  35. Martinez-Grañab, A.M.; Goy, J.L.; Cimarra, C. 2D to 3D geologic mapping transformation using virtual globes and flight simulators and their applications in the analysis of geodiversity in natural areas. Environ. Earth Sci. 2015, 73, 8023–8034. [Google Scholar] [CrossRef]
  36. Martínez-Graña, A.M.; Goy, J.L.; González-Delgado, J.Á.; Cruz, R.; Sanz, J.; Cimarra, C.; De Bustamante, I. 3D virtual itinerary in the geological heritage from natural areas in Salamanca-Ávila-Cáceres, Spain. Sustainability 2018, 11, 144. [Google Scholar] [CrossRef]
  37. Moreira, F.; Queiroz, I.; Aronson, J. Restoration principles applied to cultural landscapes. J. Nat. Conserv. 2006, 14, 217–224. [Google Scholar] [CrossRef]
  38. Meini, M.; Di Felice, G.; Petrella, M. Geotourism Perspectives for Transhumance Routes. Analysis, Requalification and Virtual Tools for the Geoconservation Management of the Drove Roads in Southern Italy. Geosciences 2018, 8, 368. [Google Scholar] [CrossRef]
  39. Peura, M.; Eyvindson, K.; Burgas, D.; Mönkkönen, M.; Raatikainen, K.J.; Kotiaho, J.S. Cost-effective biodiversity protection through multiuse-conservation landscapes. Landsc. Ecol. 2024, 39, 48. [Google Scholar] [CrossRef]
  40. Stoffelen, A.; Vanneste, D. An integrative geotourism approach: Bridging conflicts in tourism landscape research. Tour. Geogr. 2015, 17, 544–560. [Google Scholar] [CrossRef]
  41. Martínez Graña, A.M. Estudio Geológico Ambiental para la Ordenación de los Espacios Naturales de “Las Batuecas-Sierra de Francia” y “Quilamas”. Aplicaciones Geomorfológicas al Paisaje, Riesgos e Impactos. Análisis Cartográfico Mediante SIG. Ph.D. Thesis, Universidad de Salamanca, Salamanca, Spain, 2010. [Google Scholar]
  42. Martínez, J.; Martín, M.P.; Romero, R. Valoración del paisaje en la zona de especial protección de aves carrizales y sotos de Aranjuez (Comunidad de Madrid). GeoFocus Int. Rev. Geogr. Inf. Sci. Technol. 2003, 3, 1–21. [Google Scholar]
  43. Martínez-Graña, A.M.; Silva, P.G.; Goy, J.L.; Elez, J.; Valdés, V.; Zazo, C. Geomorphology applied to landscape analysis for planning and management of natural spaces. Case study: Las Batuecas-S. de Francia and Quilamas natural parks, (Salamanca, Spain). Sci. Total Environ. 2017, 584, 175–188. [Google Scholar] [CrossRef] [PubMed]
  44. Merchán, L.; Martínez-Graña, A.M.; Nieto, C.E.; Criado, M. Landscape Analysis of the Arribes del Duero Natural Park (Spain): Cartography of Quality and Fragility. Appl. Sci. 2023, 13, 11556. [Google Scholar] [CrossRef]
  45. Merchán, L.; Martínez-Graña, A.M.; Alonso Rojo, P.; Criado, M. Water Erosion Risk Analysis in the Arribes del Duero Natural Park (Spain) Using RUSLE and GIS Techniques. Sustainability 2023, 15, 1627. [Google Scholar] [CrossRef]
  46. Merchán, L.; Martínez-Graña, A.; Nieto, C.E.; Criado, M.; Cabero, T. Characterisation of the susceptibility to slope movements in the arribes del duero natural park (Spain). Land 2023, 12, 1513. [Google Scholar] [CrossRef]
  47. Merchán, L.; Martínez-Graña, A.M.; Nieto, C.E.; Criado, M. Natural Hazard Characterisation in the Arribes del Duero Natural Park (Spain). Land 2023, 12, 995. [Google Scholar] [CrossRef]
  48. Martínez-Graña, A.M.; Goy y Goy, J.L.; De Bustamante Gutiérrez, I.; Cardeña, C.Z. Characterization of environmental impact on resources, using strategic assessment of environmental impact and management of natural spaces of “Las Batuecas-Sierra de Francia” and “Quilamas”(Salamanca, Spain). Environ. Earth Sci. 2014, 71, 39–51. [Google Scholar] [CrossRef]
  49. Martínez-Graña, A.M.; Díez, T.; González-Delgado, J.Á.; Gonzalo-Corral, J.C.; Merchán, L. Geological Heritage in the “arribes del duero” natural park (Western, Spain): A case study of introducing educational information via augmented reality and 3D virtual itineraries. Land 2022, 11, 1916. [Google Scholar] [CrossRef]
  50. Renard, K.G. Predicting Soil Erosion by Water: A Guide to Conservation Planning with the Revised Universal Soil Loss Equation (RUSLE); USDA Agricultural Research Service: Washington, DC, USA, 1997. [Google Scholar]
  51. Benavidez, R.; Jackson, B.; Maxwell, D.; Norton, K. A Review of the (Revised) Universal Soil Loss Equation ((R)USLE): With a View to Increasing Its Global Applicability and Improving Soil Loss Estimates. Hydrol. Earth Syst. Sci. 2018, 22, 6059–6086. [Google Scholar] [CrossRef]
  52. UNDRR. Natural Disasters and Vulnerability Analysis: Report of Expert Group Meeting, 9–12 July 1979. Office of the United Nations Disaster Relief Coordinator. Available online: https://digitallibrary.un.org/record/95986?ln=en&v=pdf (accessed on 28 October 2024).
  53. Sato, H.P.; Harp, E.L. Interpretation of earthquake-induced landslides triggered by the 12 May 2008, M7.9 Wenchuan earthquake in the Beichuan area, Sichuan Province, China using satellite imagery and Google Earth. Landslides 2009, 6, 153–159. [Google Scholar] [CrossRef]
  54. Guzzetti, F.; Mondini, A.C.; Cardinali, M.; Fiorucci, F.; Santangelo, M.; Chang, K.-T. Landslide inventory maps: New tools for an old problem. Earth-Sci. Rev. 2012, 112, 42–66. [Google Scholar] [CrossRef]
  55. Lamagna, M.; Groppi, D.; Nezhad, M.M.; Piras, G. A comprehensive review on Digital twins for Smart energy management system. Int. J. Energy Prod. Manag. 2021, 6, 323–334. [Google Scholar] [CrossRef]
  56. Jaskula, K.; Kifokeris, D.; Papadonikolaki, E.; Rovas, D. Common data environments in construction: State-of-the-art and challenges for practical implementation. Constr. Innov. 2024. ahead of print. [Google Scholar] [CrossRef]
Figure 1. Study area.
Land 14 00885 g001
Figure 2. Procedural scheme for the elaboration of the cartography of recommendations and limitations of uses of the territory.
Land 14 00885 g002
Figure 3. Weighting of thematic cartography.
Land 14 00885 g003
Figure 4. (A) Geomorphology quality assessment cartography; (B) lithology quality assessment cartography; (C) edaphology quality assessment cartography; (D) landscape quality assessment cartography; (E) vegetation quality assessment cartography.
Land 14 00885 g004
Figure 5. (A) Cartography of erosive risks; (B) gravitational risk cartography; (C) natural risk cartography.
Land 14 00885 g005
Figure 6. Quality for conservation cartography.
Land 14 00885 g006
Figure 7. Integrated risk cartography.
Land 14 00885 g007
Figure 8. Cartography of recommendations and limitations.
Land 14 00885 g008
Figure 9. (A) Cerezal de Peñahorcada mountain range; (B) landslide; (C) Berrocal; (D) valley embedded in metamorphic rock; (E) gully; (F) valley bottom.
Land 14 00885 g009
Table 1. Assessment of geomorphological factor.
WeightingGeomorphological DomainsWeighting% SlopeWeightingSinuosity
10Fluvial canyon and ‘sierros’00–58High
8Inselbergs and incised valleys25–154Medium
6Lomes, valleys, colluviums and cones of dejection415–300Low
4Surface and pediments630–60
2Floodplain, sandy zones and meanders8>60
Table 2. Assessment of vegetation factor.
Vegetation Factor
WeightingPlant GroupingWeightingSpecific DiversityWeighting% FCC
8Arboreal postage6More than 3 main species4>40
6Shrub43 main plant species2<40
4Sub-shrub22 main plant species00
2Herbaceous01 or no plant species
0No vegetation
Disclaimer/Publisher’s Note: The statements, opinions and data contained in all publications are solely those of the individual author(s) and contributor(s) and not of MDPI and/or the editor(s). MDPI and/or the editor(s) disclaim responsibility for any injury to people or property resulting from any ideas, methods, instructions or products referred to in the content.

