Article

Spatiotemporal Differentiation and Driving Factors of Urban–Rural Integration in Counties of Yangtze River Economic Belt

by
Youming Dong
1,
Long Li
1 and
Xianjin Huang
1,2,*
1
School of Geography and Ocean Science, Nanjing University, Nanjing 210023, China
2
Key Laboratory of Carbon Neutrality and Territorial Space Optimization, Ministry of Natural Resources, Nanjing 210023, China
*
Author to whom correspondence should be addressed.
Land 2025, 14(4), 889; https://doi.org/10.3390/land14040889
Submission received: 17 March 2025 / Revised: 12 April 2025 / Accepted: 15 April 2025 / Published: 17 April 2025

Abstract

:
Assessing URI and its driving mechanisms can promote urban–rural integration (URI). However, existing research has often underexplored county-scale analyses within national strategic zones in China and has given limited attention to the spatiotemporal impacts of drivers. Focusing on the Yangtze River Economic Belt (YREB) of China, this study examined the spatiotemporal dynamics of county-level URI from 2000 to 2020 and analyzed the spatiotemporal heterogeneity effects of drivers using a geo-detector and the geographically and temporally weighted regression (GTWR) model. The findings reveal the following: (1) The level of URI in the counties of the YREB generally increased over the study period, though social and spatial integration lagged behind economic and environmental integration. (2) URI decreased spatially from east to west, forming high and low levels of spatial agglomeration in the YREB’s urban agglomerations and the provincial fringes in the west, respectively. (3) Economic development, social fixed asset investment, transportation accessibility, and geographical conditions drove the spatiotemporal differentiation of URI in YREB counties. The elevation significantly hindered URI in the eastern region, while URI in the central region was significantly promoted by social fixed asset investment and transportation accessibility, despite the inhibitory effect of the slope. In the western region, economic development played a critical facilitating role, but the slope remained a limiting factor. Tailored strategies are needed for different regions to promote URI.

1. Introduction

Urban–rural integration (URI) is essential for understanding modern urban–rural relations and represents a global trend in urban–rural development [1,2]. Global industrialization and urbanization have created a stark contrast between urban prosperity and rural decline, widening the urban–rural development gap [3,4,5]. In this context, balancing urban–rural relations and promoting URI development has gained global attention. Western scholars have previously proposed theories like “Desakota” [6], “regional networks” [7], and “urban-rural equalized development” [8] in response to the widening urban–rural gap in developing countries. In China, the long-standing urban development bias and dualistic system have caused imbalanced urban–rural development and limited rural progress [3], leading to issues such as village hollowing, resource shortages, environmental degradation, and urban pressures on housing and traffic [2]. To address these, China has introduced policies like “coordinated urban-rural development”, “urban-rural unity”, and “urban-rural integration” since the beginning of the 21st century [2]. However, coordinated urban–rural development overemphasizes urban-led growth, while urban–rural unity neglects the unique advantages of both urban and rural areas [9]. “Urban-rural integration” advances these policies by promoting the free flow and equal exchange of resources between urban and rural areas, leveraging their respective advantages to reduce the development gap [2,9,10]. This policy aims to dismantle dualistic barriers and address urban and rural challenges and has become a key direction in transforming urban–rural relations in China.
Understanding the evolutionary state of URI over a defined period is crucial for identifying the direction and progress of URI. This issue entails a systematic assessment of URI. Moreover, existing studies highlight that URI development is influenced by local practices, resource endowment, economic foundations, and institutions [8,11,12]. Identifying the driving forces behind URI can inform more effective, evidence-based policies. However, these factors generally vary spatially and temporally, with their influence on URI changing across geography and time. Therefore, investigating the spatiotemporal effects of these drivers will help to craft development strategies tailored to local conditions.
In China, counties serve as the core level for the implementation of URI policies. Analyzing the evolution and driving mechanisms of URI at the county level can enhance the understanding of urban–rural interactions and policy effectiveness, playing a crucial role in advancing URI practices nationwide [13].
The Yangtze River Economic Belt (YREB) is a core and strategic region for high-quality development in China, requiring coordinated growth across its upstream, midstream, and downstream areas. URI fosters urban–rural coordination and regional synergy through factor mobility [14], playing a vital role in the region’s high-quality development. However, the YREB spans across China’s eastern, central, and western regions, each marked by significant disparities in socio-economic development, natural environments, etc. As a result, the development of URI may differ spatially and temporally across the region. To align URI development with local conditions and optimize regional synergy, it is essential to examine the spatiotemporal dynamics and driving forces of URI.
In summary, this study aimed to examine the YREB to address the following key questions: (1) What have been the spatiotemporal patterns of URI in the counties of the YREB since the beginning of the 21st century? (2) What factors have influenced these spatiotemporal variations? (3) How have the effects of these factors changed over space and time? To answer these questions, we first clarified the theoretical framework and developed a comprehensive assessment index system. We then examined the spatiotemporal differentiation of URI in the YREB counties for the years 2000, 2010, and 2020. Finally, we applied geo-detectors and the geographically and temporally weighted regression (GTWR) model to identify key drivers and analyze the spatiotemporal heterogeneity of their effects.

2. Literature Review and Theoretical Framework

2.1. Literature Review

The development of URI has been extensively studied worldwide. International research on URI has predominantly focused on urban–rural interactions and linkages. These studies have typically approached URI from a singular perspective, addressing aspects such as agricultural interactions [15], human capital disparities [16], welfare gaps [17,18], etc. In China, URI assessment is systematic and comprehensive. Existing studies have primarily evaluated URI across demographic, economic, social, spatial, and ecological dimensions [8,19,20,21] or explored the synergy between urban and rural systems [14,22]. Relevant assessment methods have primarily included the entropy method [10,19], coupling coordination degree [22], polygonal area method [10,22], unsupervised machine learning [23], etc. Based on this assessment, these studies have explored the spatiotemporal dynamics of URI at the provincial [8,14,23], municipal [8,10,21], and county levels [14,19,20,24]. In recent years, as URI policies have been deeply implemented, the assessment of URI at the county level—a meso–micro scale—has gained increasing attention. Existing evaluations of county-level URI have focused on regions such as provinces [14,24], urban agglomerations [19,25], natural geomorphic areas [26], and ecological watersheds [20]. A nationwide assessment at the county level has been conducted recently [12]. However, this evaluation primarily focused on the economic aspect of URI.
Additionally, the drivers of URI have been extensively explored worldwide. International research on the driving mechanisms of URI have primarily emphasized practical aspects. Relevant studies have mainly focused on the positive effects of land reforms, agricultural policies, and the new village movement on URI development [27,28,29,30]. Chinese scholars have conducted relatively systematic and comprehensive research on the driving mechanisms of URI. Existing studies have largely been based on theoretical policy analysis and logical deduction, exploring the impacts of the economy, industry, urbanization, policies, technology, transportation, and natural conditions on URI [8,12,31,32]. Regarding the analytical perspectives and methods, some studies have revealed the overall impacts and interactions of drivers from a global perspective utilizing geo-detectors [33], while others have revealed the spatial spillover effects from a spatial correlation standpoint [34], primarily employing spatial econometric models. Given the dynamic nature of URI drivers, some scholars have used the geographically weighted regression (GWR) model to explore spatial heterogeneity effects [35], although this approach tends to overlook temporal variations.
In summary, while the evolutionary process and driving mechanisms of URI have been widely explored globally, several aspects of research in China still require further development: (1) Despite growing scholarly attention to URI at the county level, relevant studies remain limited, especially those with a sufficient focus on national strategic zones spanning different regions of China. (2) Existing studies have quantitatively analyzed the driving forces of URI from various perspectives but rarely consider both spatial and temporal variations simultaneously. The GTWR model better captures the spatiotemporal differentiation of these driving forces [36], yet its application in URI research remains limited.

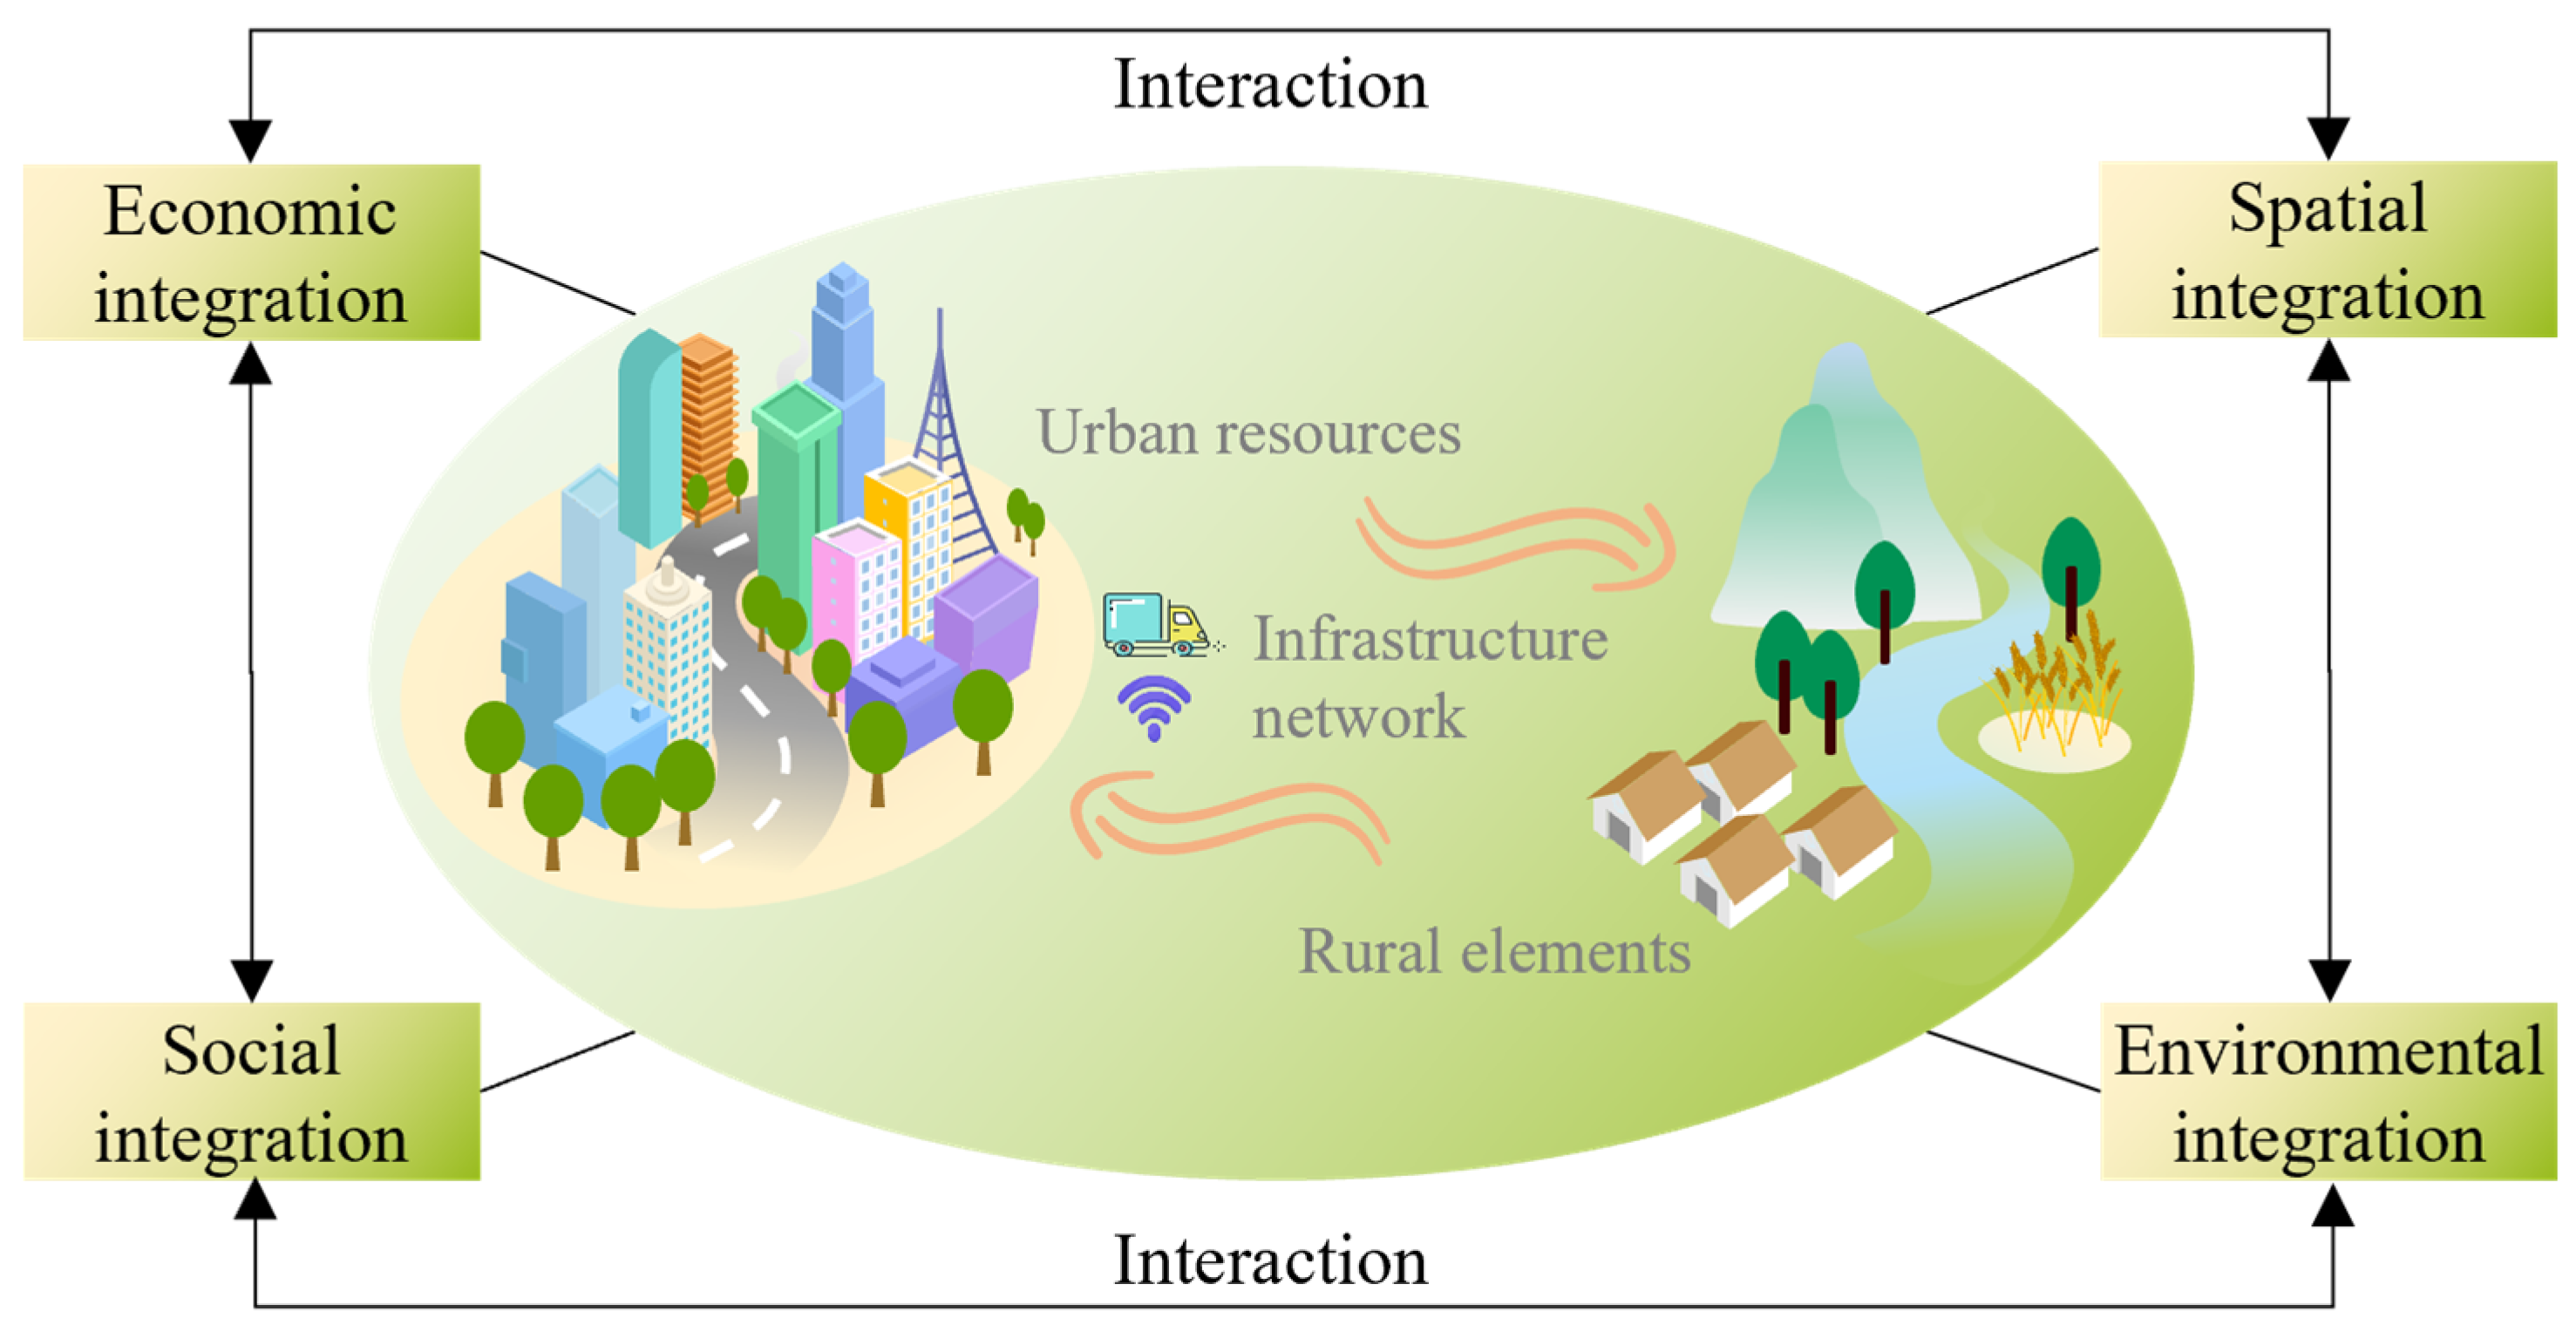
2.2. Theoretical Framework and Evaluation Indicators

URI represents an advanced stage in urban–rural relations, aiming to achieve a dynamic balance and overall optimization across economic, social, spatial, and environmental dimensions through the free flow, equitable exchange, and optimal allocation of resources [13,14]. From a systems perspective, URI can be seen as a complex dynamic system that encompasses the integration of economic, social, spatial, and environmental dimensions (Figure 1). Specifically, economic integration (ECI) forms the foundation of URI. It emphasizes the process of the optimal adjustment of production factors in agricultural and non-agricultural sectors, thereby fostering urban economic growth and its diffusion to rural areas. This process ultimately leads to a shared improvement in production efficiency in urban and rural regions and contributes to the common prosperity of their residents [13]. Social integration (SOI) is the goal of URI, focusing on improving the quality of life for urban and rural residents, with an emphasis on equalizing public services between urban and rural areas [8,14]. Spatial integration (SPI) constitutes the external manifestation of URI, emphasizing the development of smooth circulation channels for urban and rural factors and ensuring their free and efficient flow across regions [21]. Environmental integration (ENI) constitutes the background condition for URI, emphasizing joint ecological governance between urban and rural areas [20]. The subsystems are interdependent and mutually limiting. Only when each is optimized can they effectively contribute to the high-quality development of URI.
In summary, this study constructed a URI evaluation framework based on four dimensions: ECI, SOI, SPI, and ENI. To capture URI characteristics, indicators needed to reflect the overall urban–rural development level, the reduction in the development gap, and the interaction between urban and rural factors. The rationale was that improving the overall urban–rural development lays the foundation for URI, while narrowing the urban–rural gap determines the quality of integration [8]. The transfer, agglomeration, and distribution of production factors between urban and rural areas drive the overall optimization and balanced development of both [13]. In addition, indicator selection needed to consider the geographical context and follow principles of comprehensiveness, scientific rigor, representativeness, and data accessibility. Zhou et al.’s review of URI evaluation indicators in China provided valuable guidance for indicator selection [37]. Moreover, existing studies of county-level URI assessment offered a solid foundation for the indicators used in this paper [14,19,37]. Based on these considerations, this study integrated various county-level URI characteristics, considering the indicator attributes across overall, comparative, and interactive categories, as well as the data availability (Table 1).
County-level ECI mainly reflects the optimal allocation of urban and rural production factors, alongside the co-enhancement of urban and rural economies [13]. Based on this, we employed the ratio of agricultural to non-agricultural employment (X1) and the ratio of the output values of secondary and tertiary industries (X2) to represent labor and industry adjustments. The binary comparison coefficient (X3) and per capita income ratio between urban and rural residents (X4) were used to illustrate mutual enhancements in production efficiency and labor remuneration convergence in urban and rural areas.
County-level SOI mainly reflects the integrated development of urban and rural public services [14]. Due to imperfections in county-level urban and rural statistics, data on the public service performance are limited and often reflect regional aggregates. Given that the overall level of urban–rural public service development can partially reflect the performance of URI, we selected the beds per 10,000 population in urban and rural areas (X5), healthcare technicians per 1000 population in urban and rural areas (X6), and teacher–student ratio in urban and rural primary and secondary schools (X7) to measure SOI.
County-level SPI mainly focuses on the flow of development factors and infrastructure construction between urban and rural areas [21]. The urbanization of the population and land often serves as the initial driver for the agglomeration and diffusion of factors, while transportation networks facilitate the flow of factors. Accordingly, this study captured the spatial interaction of urban and rural factors through the population urbanization (X8) and land urbanization (X9) and used the urban and rural road network density (X10) to reflect infrastructure construction.
County-level ENI mainly focuses on the collaborative governance of the ecological environment by urban and rural actors [20]. Urban governance typically targets air pollution, while rural governance addresses soil pollution in agriculture [20,38]. Accordingly, this study used the PM2.5 in urban and rural areas (X11) to reflect the impact of urban governance on air pollution. The fertilizer usage (X12) and pesticide usage (X13) per unit of cultivated land were used to measure rural efforts in controlling soil pollution.

3. Materials and Methods
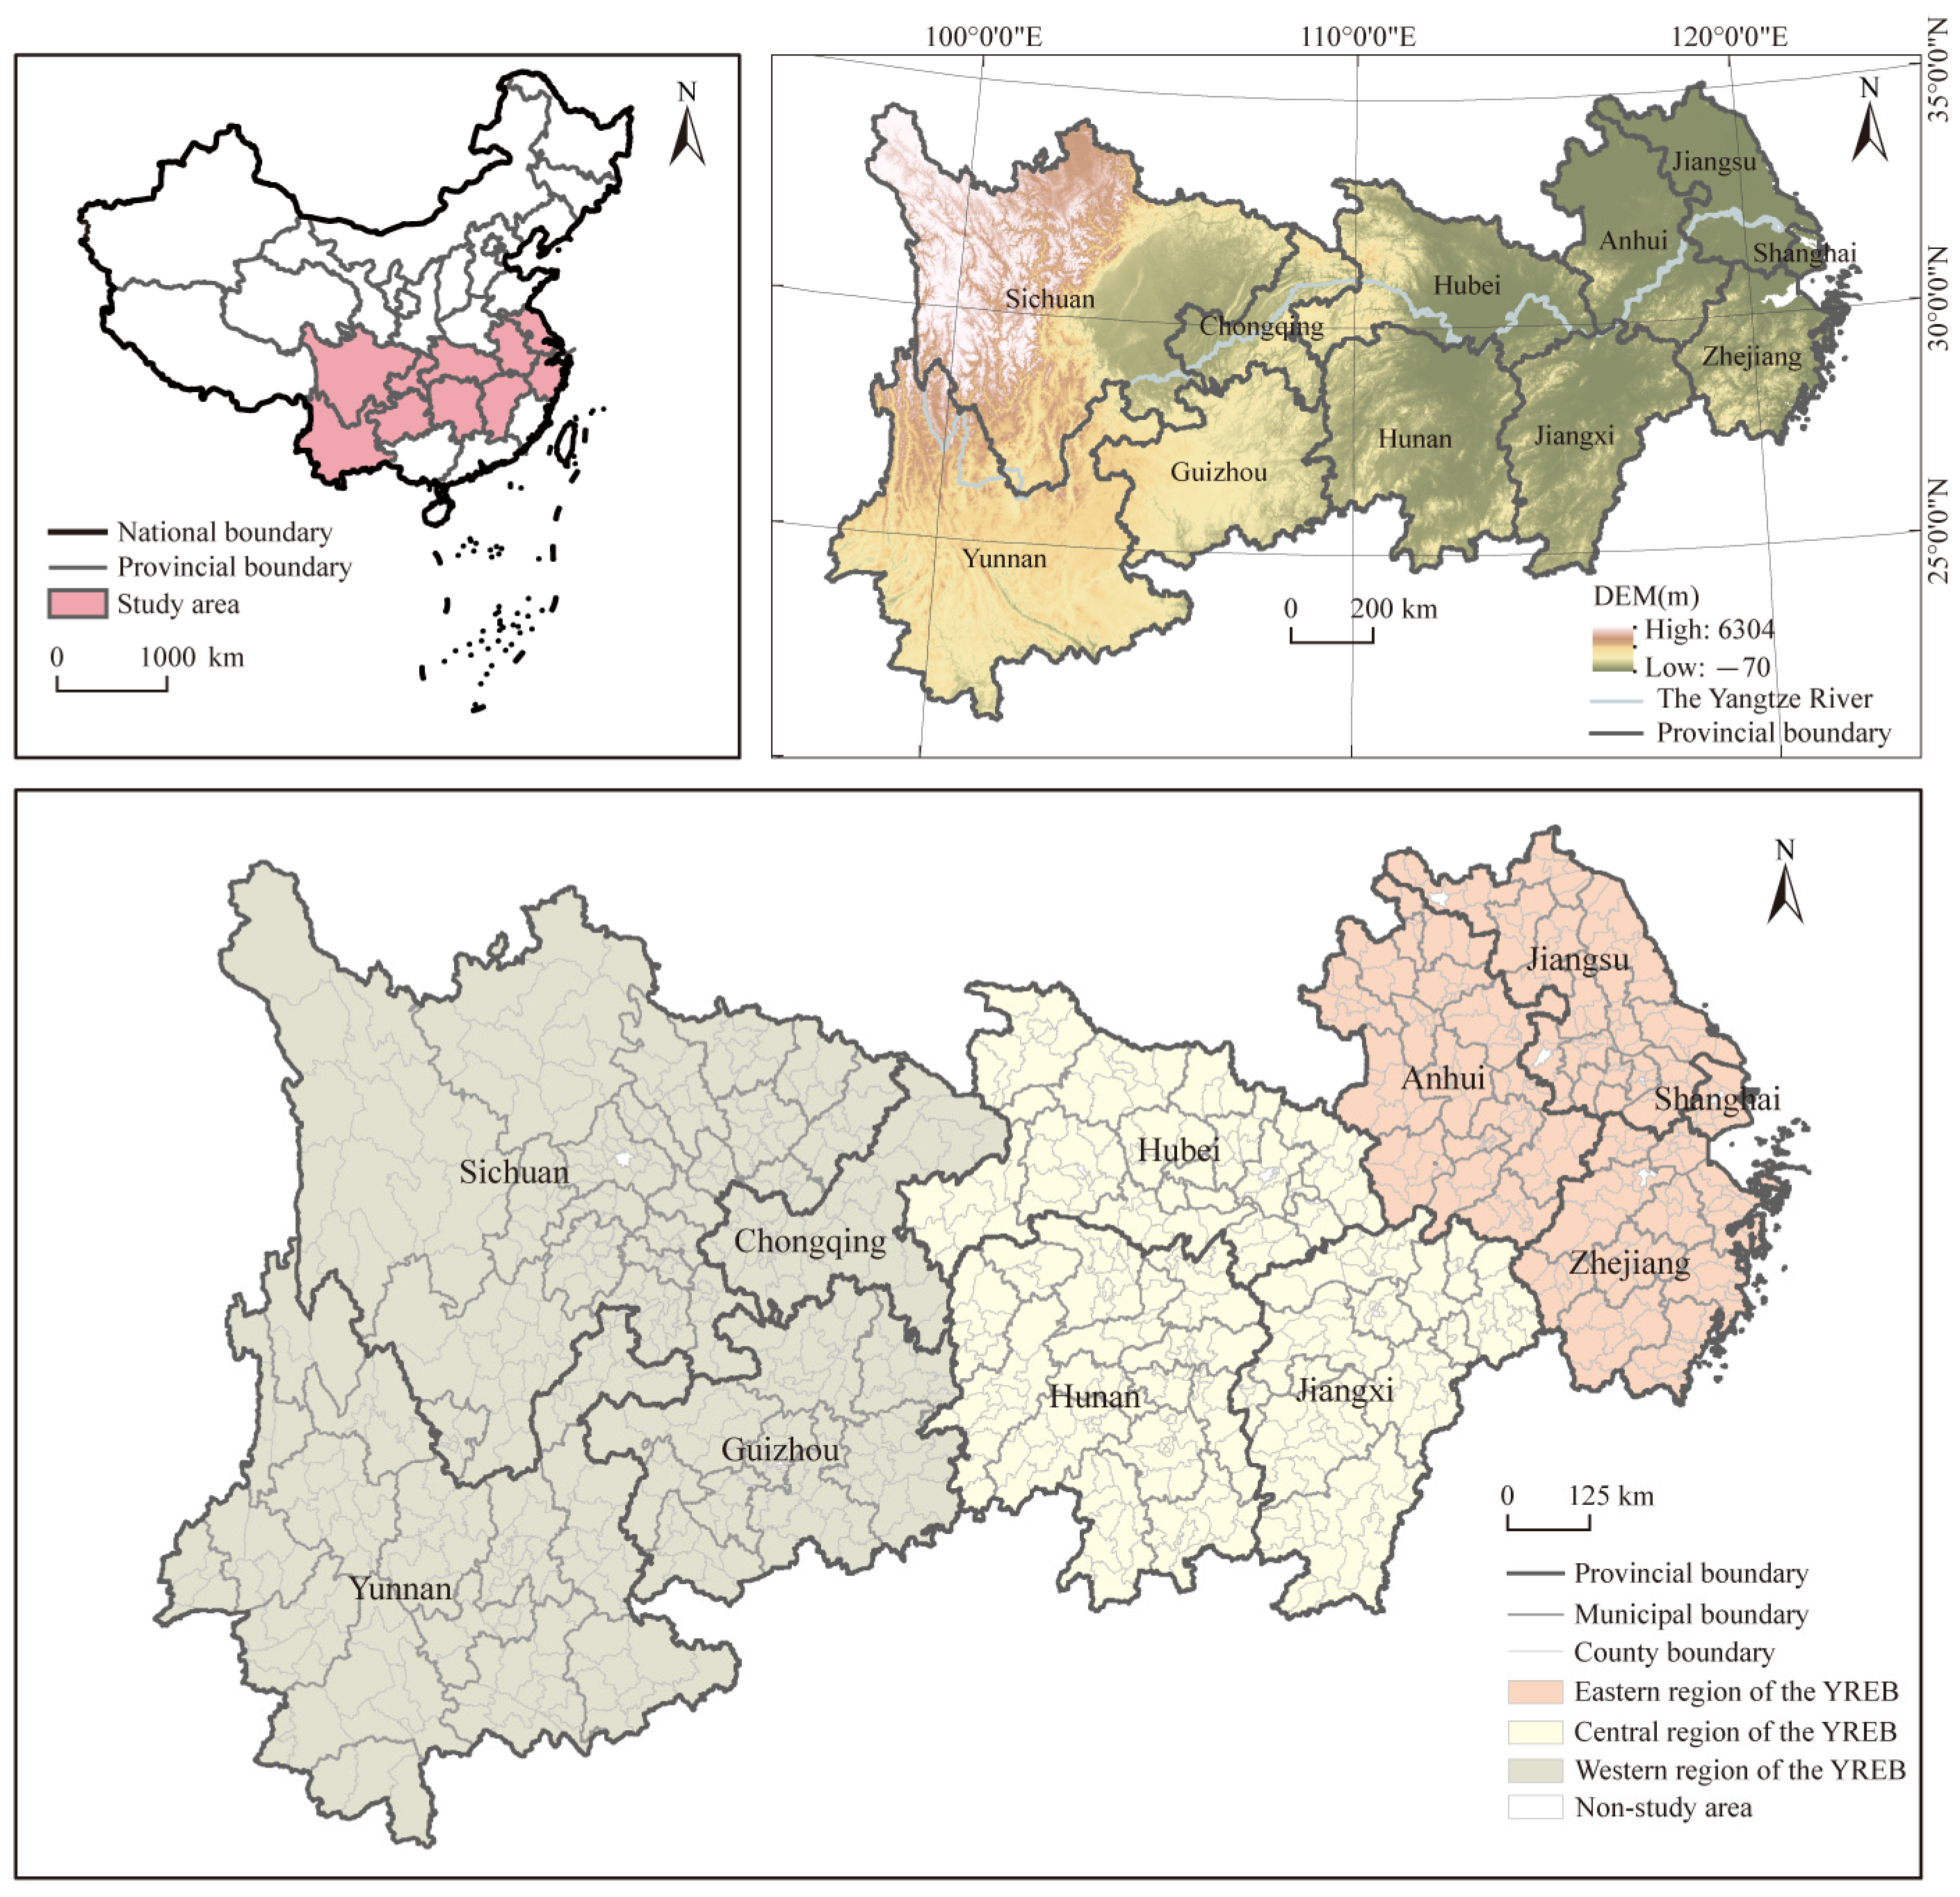
3.1. Study Area

The YREB spans 11 provinces and municipalities, including Shanghai, Jiangsu, Zhejiang, Anhui, Jiangxi, Hubei, Hunan, Chongqing, Sichuan, Guizhou, and Yunnan, covering about 21.4% of China’s national territory (Figure 2). It contains three national urban agglomerations: the Yangtze River Delta, the middle reaches of the Yangtze River urban agglomerations, and the Chengdu–Chongqing urban agglomeration. In 2020, the YREB’s urbanization rate reached 63.30%. Given that URI development typically corresponds to urbanization rates between 50% and 70% [10], the region is in a critical phase of URI development. However, significant differences in development conditions, such as the natural environment and socio-economic factors, within the YREB may lead to geographic imbalances and the uneven long-term evolution of URI. This presents a typical case for examining the spatiotemporal differentiation of URI and the heterogeneous effects of its driving factors.
This study focused on the county level within the YREB, which includes municipal districts, county-level cities, general counties, autonomous counties, forest areas, and special zones. URI policies are typically implemented in areas that have not fully achieved urbanization. Therefore, municipal districts in certain prefecture-level cities within the YREB that had already achieved full urbanization were excluded. Using the 2020 administrative boundaries as a baseline (with adjustments made during the study period), 44 municipal districts with a 100% urbanization rate by the end of 2020 were excluded. Ultimately, 1024 county-level units were included: 325 municipal districts, 150 county-level cities, 489 general counties, 58 autonomous counties, 1 forest district, and 1 special zone. Additionally, the YREB was divided into three regions for comparative analysis: the eastern region (Shanghai, Jiangsu, Zhejiang, and Anhui), the central region (Jiangxi, Hubei, and Hunan), and the western region (Chongqing, Guizhou, Sichuan, and Yunnan).

3.2. Methods

3.2.1. Calculation of URI

The calculation of URI encompassed each dimension and the total URI. To minimize subjective bias and objectively capture the intrinsic relationships among indicators, principal component analysis was used to determine the weights of the indicators within each sub-dimension [39] (Table 1). The ECI, SOI, SPI, and ENI were then derived through weighted summation, and the total URI was calculated based on the sub-dimensional results. To account for the effect of data dispersion on URI, the entropy method was applied [10].

3.2.2. Local Indicators of Spatial Association (LISA)

From the LISA, we identified the spatial clustering and dispersion of URI by detecting local correlations and differences between the observed county and its neighbors. We categorized five spatial patterns: high–high clusters, low–low clusters, high–low outliers, low–high outliers, and not significant [40]. The calculation formula was as follows:
I i = x i x ¯ j = 1 n w i j x j x ¯ 1 n i = 1 n x i x ¯ 2 i j
where n is the number of counties in the YREB. xi and xj are the URI levels of counties i and j, respectively. x ¯ is the average value of URI of counties in the YREB. wij is the spatial weight.

3.2.3. Selection of Influencing Factors and Model Analysis

(1) Selection of influencing factors
The spatial and temporal evolution of URI in counties may be influenced by various factors. Based on existing theoretical foundations, this paper asserts that the development of URI is primarily driven by economic, policy, technological, and geographical environment factors. First, regional economic development and industrial restructuring enhance urban and rural production, employment, and living standards, providing the material foundation for URI [8,11]. Second, governmental and societal policies play a guiding role in URI by promoting urban and rural development through financial investment [8,33]. Third, technological advancements drive URI, with transportation development facilitating the bidirectional flow of urban and rural resources [33] and agricultural technology improving the rural production efficiency, fostering endogenous village development, and narrowing the urban–rural gap [41]. Additionally, the geographical environment determines a region’s resource endowment and ecological background, potentially influencing URI [12].
Based on the theories and studies referenced [8,12,33] and considering the data availability, this study employed the per capita GDP (PGDP) and industrial structure advancement degree (ISAD) to represent economic factors. Policy factors were reflected by the per capita public financial input (PPFI) and per capita social fixed asset investment (PSFAI). Technological factors were indicated by transport accessibility (TA) and the power of agricultural machinery per unit of cultivated land (PPAM). Natural environmental factors were represented by the average elevation (AE) and average slope (AS) (Table 2). Using these factors, we first analyzed their explanatory power with a geo-detector to identify and filter effective factors. We then examined the spatiotemporal heterogeneity of these effective factors using the GTWR model.
(2) Geo-detector
A geo-detector is a statistical method for detecting spatial dissimilarity and its drivers, revealing the explanatory power of these factors [42]. The factor detection method identifies global driving factors by analyzing the spatial distribution similarity between independent and dependent variables. It has been widely applied to uncover the driving mechanisms behind spatial divergence. To examine the global forces influencing the spatial differentiation of URI in counties within the YREB, this study applied the factor detection method. Its basic formula is
q = 1 1 n σ 2 h = 1 L n h σ h 2
where q represents the explanatory power of driving factors. n and σ2 represent the total number of county units and variance, respectively, and nₕ and σₕ2 denote the number of county units and variance in the hth stratum (h = 1, 2, …, L). The q-value ranges from 0 to 1, with values closer to 1 indicating stronger explanatory power and values nearer to 0 signifying weaker influence.
(3) GTWR model
The GTWR model analyzes complex spatiotemporal data by assigning local weights based on the geographic location and time, enabling it to detect the varying effects of driving factors across space and time [36]. Unlike a geo-detector, the GTWR model offers deeper insights into the trends of driving forces in local spatial and temporal contexts, supporting the development of region-specific policies. Based on the identification of driving factors, this study used the GTWR model to explore their spatiotemporal heterogeneity. The basic formula is
y i = β 0 μ i , v i , t i + j = 1 k β j μ i , v i , t i x i j + ε i
where yi represents the URI of county i. β0 i, νi, ti) is the regression intercept term for county i, with i, νi, ti) indicating its spatiotemporal location. βji, νi, ti) is the regression coefficient for independent variable j in county i. xij is the observed value of independent variable j in county i. εi denotes the residual for county i.

3.3. Data Sources

The base map of the study area was derived from the 2021 administrative boundaries of China, sourced from the Resource and Environmental Science Data Platform of the Chinese Academy of Sciences (http://www.resdc.cn, accessed on 1 June 2023). This study spanned the years of 2000, 2010, and 2020. Socio-economic data for the URI indicators and their drivers were obtained from sub-county data from the China Population Census, as well as from the China County Statistical Yearbook, China Statistical Yearbook for Regional Economy, and statistical yearbooks of provinces (municipalities) and prefectural cities within the YREB. National economic and social development statistical bulletins at the county (district) level were also used. Missing data were interpolated using neighboring year data. Land use data were sourced from 30 m resolution remote sensing data from the same platform (http://www.resdc.cn, accessed on 20 June 2023). Elevation and slope data were derived from the 30 m resolution Digital Elevation Model (DEM) provided by the same institution (http://www.resdc.cn, accessed on 25 June 2023), with image correction and slope analysis applied. PM2.5 data, with a 0.01° × 0.01° resolution, were provided by Washington University in St. Louis (https://sites.wustl.edu/acag/datasets/surface-pm2-5/, accessed on 25 June 2023), with this dataset being widely used across China [43].

4. Results

4.1. Spatiotemporal Dynamics of URI

4.1.1. Temporal Variation in URI

From 2000 to 2020, the average URI in the counties of the YREB increased from 0.200 to 0.376, with a rise of 0.077 from 2000 to 2010 and 0.099 from 2010 to 2020 (Figure 3). Overall, the regional URI remained at a low to medium level. At the subsystem level, the mean values of the county-level SOI, ECI, and SPI steadily increased throughout the study period, while the ENI fluctuated, initially declining and then rising. The ECI and ENI were notably higher than the SOI and SPI, reflecting the lag in urban–rural social and spatial integration at the county level.
At the regional level, the average county-level URI in the eastern, central, and western YREB steadily increased from 2000 to 2020, though URI levels decreased progressively from east to west (Figure 4). The trends in the mean levels of the ECI, SOI, SPI, and ENI across regions aligned with those observed in the YREB. Regionally, the average county-level ECI, SOI, and SPI decreased from east to west, whereas the ENI was higher in the western region than in the eastern and central regions, partly reflecting the western region’s better ecological environment [44]. Additionally, the county-level ECI and ENI were generally higher than the SOI and SPI across regions, consistent with the characteristics of the whole YREB.

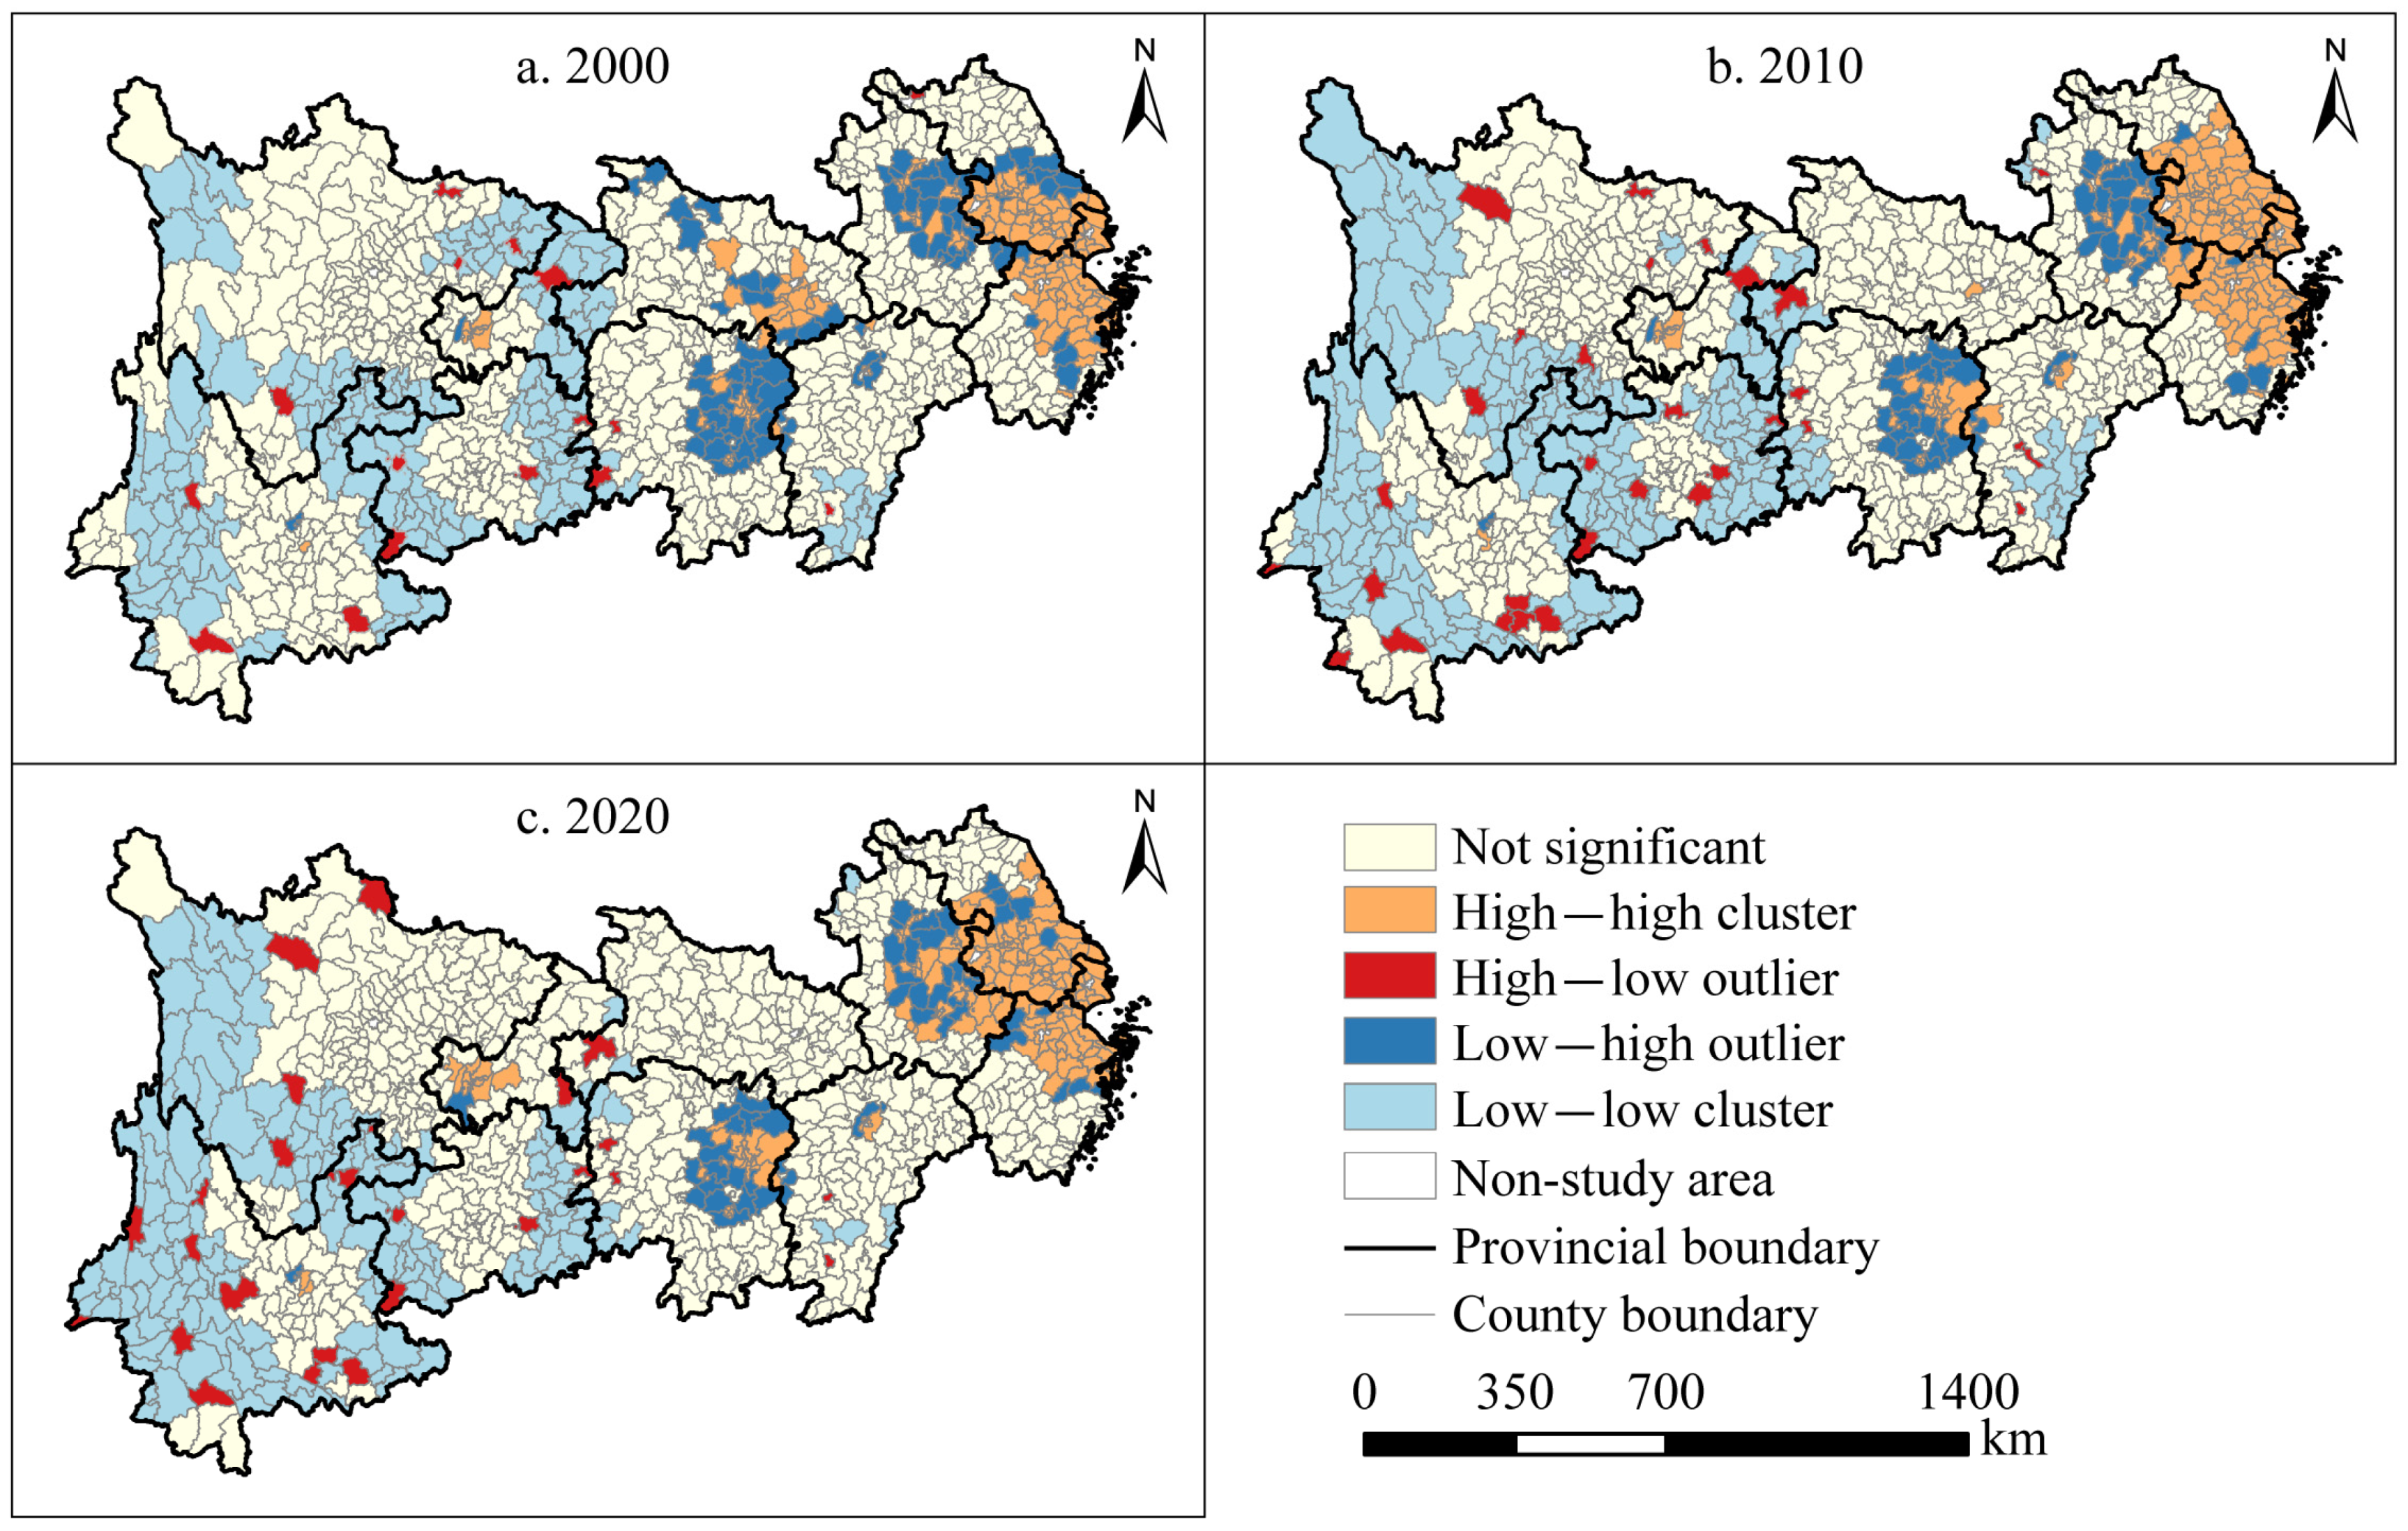
4.1.2. Spatial Patterns of URI

Using the natural breakpoint method, the county-level URI in the YREB from 2000 to 2020 was classified into five categories: a low level (URI ≤ 0.218), lower-middle level (0.218 < URI ≤ 0.272), middle level (0.272 < URI ≤ 0.344), upper-middle level (0.344 < URI ≤ 0.452), and high level (URI > 0.452) (Figure 5). Overall, the spatiotemporal differentiation of URI in the counties of the YREB was evident. Specifically, in 2000, 69.92% of counties were at a low level. Only 9.28% of counties in levels of upper-middle and high near Shanghai or major provincial capitals. By 2010, the proportion of counties at a low level had significantly decreased, while the counties with lower-middle, middle, upper-middle, and high levels increased, reflecting growing spatial differentiation. During this period, 18.75% of counties with high and upper-middle levels were around Shanghai and near inland provincial capitals. Meanwhile, 29.39% of counties at a low level were in the central and western regions, particularly along provincial borders, forming a “core-edge” spatial structure with the counties at high and upper-middle levels. By 2020, the percentage of counties at low and lower-middle levels had shrunk to 6.64%, with these occurring mostly in remote western areas. Conversely, the percentage of counties with high and upper-middle levels grew to 55.08%, with these concentrated in the urban agglomerations of the Yangtze River Delta, the middle reaches of the Yangtze River, and the Chengdu–Chongqing, Qianzhong, and Dianzhong regions.
Throughout the study period, the ECI, SOI, and SPI generally showed higher values in the east and lower values in the west, mirroring the spatial and temporal trends of URI (Figure A1). In contrast, the ENI displayed the opposite pattern, with higher values in the west and lower values in the east. Specifically, the counties with low ENI values were primarily concentrated in the urban agglomerations of the Yangtze River Delta, the middle reaches of the Yangtze River, and Chengdu–Chongqing, while counties with high ENI values were mostly in the western YREB. Over time, the number of counties with high ENI values initially decreased, then increased within the YREB.
The LISA results (Figure 6) revealed a “high in the east, low in the west” pattern of URI spatial correlations in the YREB during the study period. High–high clusters were mainly located in urban agglomerations, while low–low clusters were concentrated in the western YREB, near provincial borders. In terms of evolution, in 2020, the high–high clusters were primarily concentrated in the Yangtze River Delta, Wuhan metropolitan area, Chang–Zhu–Tan urban agglomeration, Chengdu–Chongqing urban agglomeration, and around Nanchang, Jiangxi. Over time, the number of counties in these clusters increased from 158 to 173, though the extent of the clusters in the Wuhan metropolitan area gradually contracted, and they eventually vanished. Conversely, low–low agglomerations were mainly found along the provincial borders of Sichuan, Yunnan, Chongqing, Guizhou, Hubei, Hunan, and Jiangxi in 2000. Over time, their extent in Chongqing and Jiangxi significantly decreased.

4.2. Identification of Drivers

The mean explanatory power (q-value) of the influencing factors during the study period was ranked as F1 > F4 > F8 > F7 > F5 > F3 > F6 > F2 (Table 3). Notably, the mean q-values for the PGDP, PSFAI, TA, AE, and AS all exceeded 0.1, significantly higher than those of the other factors, and passed the 0.05 significance test each year [42]. This result indicates that the spatiotemporal divergence of URI was influenced by economic, policy, technological, and geographical environment factors. Specifically, the PGDP had the strongest explanatory power from 2000 to 2020, emphasizing the role of economic development as the main driver of URI. The PSFAI also played a key role, though its explanatory power diminished over time. Conversely, the explanatory power of the TA steadily increased, indicating a growing influence of transport accessibility on URI. Similarly, the explanatory power of the AE and AS strengthened over time, suggesting a closer link between URI development and geographical factors. Additionally, the mean q-values of the ISAD, PPFI, and PPAM were all below 0.1 and did not fully pass the 0.05 significance test in each year, indicating weak explanatory power for URI divergence in the YREB.
To ensure the validity and accuracy of the spatiotemporal heterogeneity analyses, factors with significance levels greater than 0.05 during the study period were considered valid and included in the subsequently developed model. Specifically, five factors—the PGDP, PSFAI, TA, AE, and AS—were selected.

4.3. Spatiotemporal Heterogeneity Effects of Drivers

4.3.1. Model Testing

The GTWR model was applied to analyze the spatiotemporal heterogeneity effects of five factors: the PGDP, PSFAI, TA, AE, and AS. Before application, all variables were standardized, and multicollinearity tests were performed to ensure result robustness. The test showed that the VIF values for all five variables were well below 7.5, indicating independence. Therefore, all five variables were included in the GTWR model for analysis.
The GTWR model results were compared with those of the ordinary least squares (OLS) and GWR models. As shown in Table 4, the GTWR model had an adjusted R2 of 0.6939, significantly higher than that of the other two models, along with the lowest AIC and residual sum of squares (RSS). This indicates that the GTWR model provided the best fit for the influencing factors and captured spatiotemporal non-stationarity. Thus, the GTWR model was used to examine the spatiotemporal heterogeneity of the factors.

4.3.2. Spatiotemporal Heterogeneity Effects

During the study period, the PGDP consistently facilitated URI in all counties, though the spatial pattern of this effect changed over time (Figure 7a–c). In 2000, the PGDP had a significant facilitating effect in Chongqing and northern Sichuan, with values ranging from 12.786 to 19.152. Over time, this significant effect shifted southward and westward in space, with its overall effect degrees gradually weakening.
During the study period, the PSFAI’s impact on URI in YREB counties was primarily positive, with notable changes in its spatial distribution (Figure 7d–f). In 2000, the PSFAI significantly boosted URI across all counties, especially in the southwestern YREB. By 2010 and 2020, the area in which it had positive effects shrank, covering 95.61% and 39.36% of counties, respectively. Over time, the counties where the PSFAI played a key facilitating role shifted from the western to the central YREB.
During the study period, the TA had a predominantly positive effect on county-level URI, with a stronger impact in the central YREB (Figure 7g–i). In 2000, the TA facilitated URI in 85.16% of counties, and this proportion increased over time. By 2020, the TA influenced all counties, with an overall enhancement of its effect. Spatially, the most significant impact of the TA occurred in the central YREB from 2000 to 2020.
During the study period, both the AE and AS had inhibitory and facilitating effects on county-level URI, with distinct spatiotemporal patterns (Figure 7j–o). From 2000 to 2020, the AE exerted significant inhibitory effects in the northeastern YREB and some facilitating effects in the south. In contrast, the AS showed a significant inhibitory effect in the southern YREB, while facilitating effects were seen in the eastern YREB and northern Sichuan.

5. Discussion

5.1. Spatiotemporal Dynamics and Drivers of URI

The results show a steady increase in URI across the YREB counties from 2000 to 2020. This trend aligns with the URI development in the Beijing–Tianjin–Hebei region and the Yellow River basin [20,45], underscoring the effectiveness of China’s policies in promoting URI.
County-level URI showed significant divergence within the system, with social and spatial integration lagging behind economic and environmental integration. This mirrors findings at the city scale in China [10]. The disparity may be attributed to the loss of county development factors due to rapid urbanization. Issues such as population decline, idle land, and weak social infrastructure are more prominent in certain counties [46]. Notably, the high level of environmental integration likely reflects the performance of the long-standing ecological and environmental protection policies in the YREB [44,47].
County-level URI in the YREB exhibited significant spatial differentiation, with high and low levels for the spatial clusters in urban agglomerations and western provincial fringe areas, respectively. High-level clusters highlighted that regional integration, especially in urban agglomerations, positively impacted county-level URI development [25,48]. This effect was most evident in the urban agglomerations of the Yangtze River Delta, the middle reaches of the Yangtze River, and Chengdu–Chongqing. Our results align with the spatial patterns of county-level URI in individual urban city agglomerations [19] and broaden the understanding of URI’s geographical distribution from a macro-regional perspective. In contrast, low-level clusters were mainly found in western fringe areas, where socio-economic development was hindered by remoteness, challenging terrain, and poor transport. This result highlights the underdevelopment of URI in less developed regions and guides the formulation of targeted countermeasures for URI in these areas.
The eastern, central, and western regions of the YREB were influenced by distinct drivers. Specifically, in the eastern region, URI development was more constrained by the altitude, as low, flat terrain supported urban–rural development, while higher altitudes may have diminished this advantage. The central region was more influenced by social investment and transport accessibility. This was likely due to the region’s reliance on agricultural modernization and industrialization for URI development [34], both of which required significant capital. Additionally, as a hub for interaction between the eastern and western regions, the central region has benefited from accelerated transport network construction in recent years, significantly enhancing URI development [49]. The western region was primarily driven by economic development, with advancements being crucial due to its long-standing socio-economic lag. Additionally, both the central and western regions faced constraints due to undulating topography, likely linked to their mountainous and hilly landscapes.

5.2. Policy Implications for URI

This study revealed significant heterogeneity in county-level URI, both within the system and across space. URI in different regions was shaped by distinct factors. To optimize and harmonize URI development, local governments should address this heterogeneity and tailor strategies to the key influencing factors in each region.
(1)
To address the lag in social and spatial integration within the URI system, the government should enhance the integration of urban and rural public services at the county level. Efforts should also focus on improving the market-based allocation of urban and rural factors, removing institutional barriers to their flow, and strengthening urban–rural transport networks. Additionally, to improve ENI in urban agglomerations, a new urbanization strategy should be implemented to strengthen intensive land use in counties, support low-energy, environmentally friendly enterprises, and reduce traffic pollution [44,47]. Moreover, in line with the rural revitalization policy, efforts should focus on the green transformation of arable land use and reducing the reliance on chemical fertilizers and pesticides.
(2)
Spatially, for the low-level URI clusters on the fringes of the western YREB, locally available resources should be fully utilized, and a regional linkage development mechanism should be established. These low-level URI clusters, often characterized by mountainous, hilly, or plateau topographies, are rich in human and natural resources. URI development in these areas should be tailored to local conditions, leveraging human and ecological resources to promote rural tourism, leisure agro-tourism, and other industries, thereby fostering URI through endogenous rural development [50]. Additionally, a regional linkage development mechanism should be established between low-level and high-level URI clusters, enhancing the division of labor, cooperation, and transport connections between regions. This approach will promote URI in low-level agglomerations through a “compensating for weaknesses with strengths” strategy [21].
(3)
Given the varying effects of driving factors across regions and over time, development should be adapted to local conditions for an effective approach. In the eastern YREB, URI should focus on low-elevation areas while preserving the natural environment. In the central region, the focus should be on leveraging social investment, enhancing transport networks, and addressing topographical challenges. In the western region, the priority should be placed on economic development, increasing government support, and fostering synergy with the more developed eastern region. The development in the western region should also be adapted to the topographical conditions.

5.3. Strengths and Limitations

This paper examined the spatial and temporal dynamics and drivers of URI in the YREB counties from 2000 to 2020. It contributed to the existing research in two ways. First, it broadened the study area scope of county-level URI assessments in China by incorporating the YREB, enriching the literature on cross-regional national strategic development zones. Second, it examined the evolving trends of influencing factors from a spatiotemporal heterogeneity perspective, deepening the existing research on the driving mechanisms of URI.
This study has several limitations. First, assessing URI performance in counties is a complex, systematic task. The indicator system should comprehensively reflect URI characteristics, including the overall urban–rural development, the narrowing of the urban–rural gap, and the interaction of urban and rural factors. Economic, policy, technological, natural, and other driving factors influencing county-level URI should also be considered. However, due to limitations in county-level urban and rural statistical data in China, the indicators for “urban-rural differences” and “urban-rural interactions” were limited, particularly for social and ecological integration. Additionally, the selection of driving factors such as the economy, policies, technology, and the natural environment was constrained, impacting the accuracy of the findings. Future research should address this by incorporating updated statistical data or field survey data to enhance county-level URI indicators. Second, while this paper primarily focused on the development level of the URI system and its subsystems, it did not examine the coupling and synergy between these subsystems in depth. This requires further investigation in future studies. Finally, this paper examined the evolution of URI levels and driving factors in the eastern, central, and western regions of the YREB. However, due to differences in economic foundations, resource endowment, and local policy preferences, the URI process in each region should be differentiated in terms of path selection and development models. This distinction has not been fully explored here, but should be the focus of future research. Future studies should involve case studies and in-depth investigations to identify typical URI development models, offering more scientifically grounded guidance for URI across diverse regions.

6. Conclusions

This paper developed a county-level URI indicator system based on four dimensions: economic, social, spatial, and environmental. It investigated the spatiotemporal differentiation of URI in counties across the YREB from 2000 to 2020. Employing a geo-detector and the GTWR model, this study identified the driving factors of this differentiation and examined their spatiotemporal heterogeneity. The results show the following:
(1)
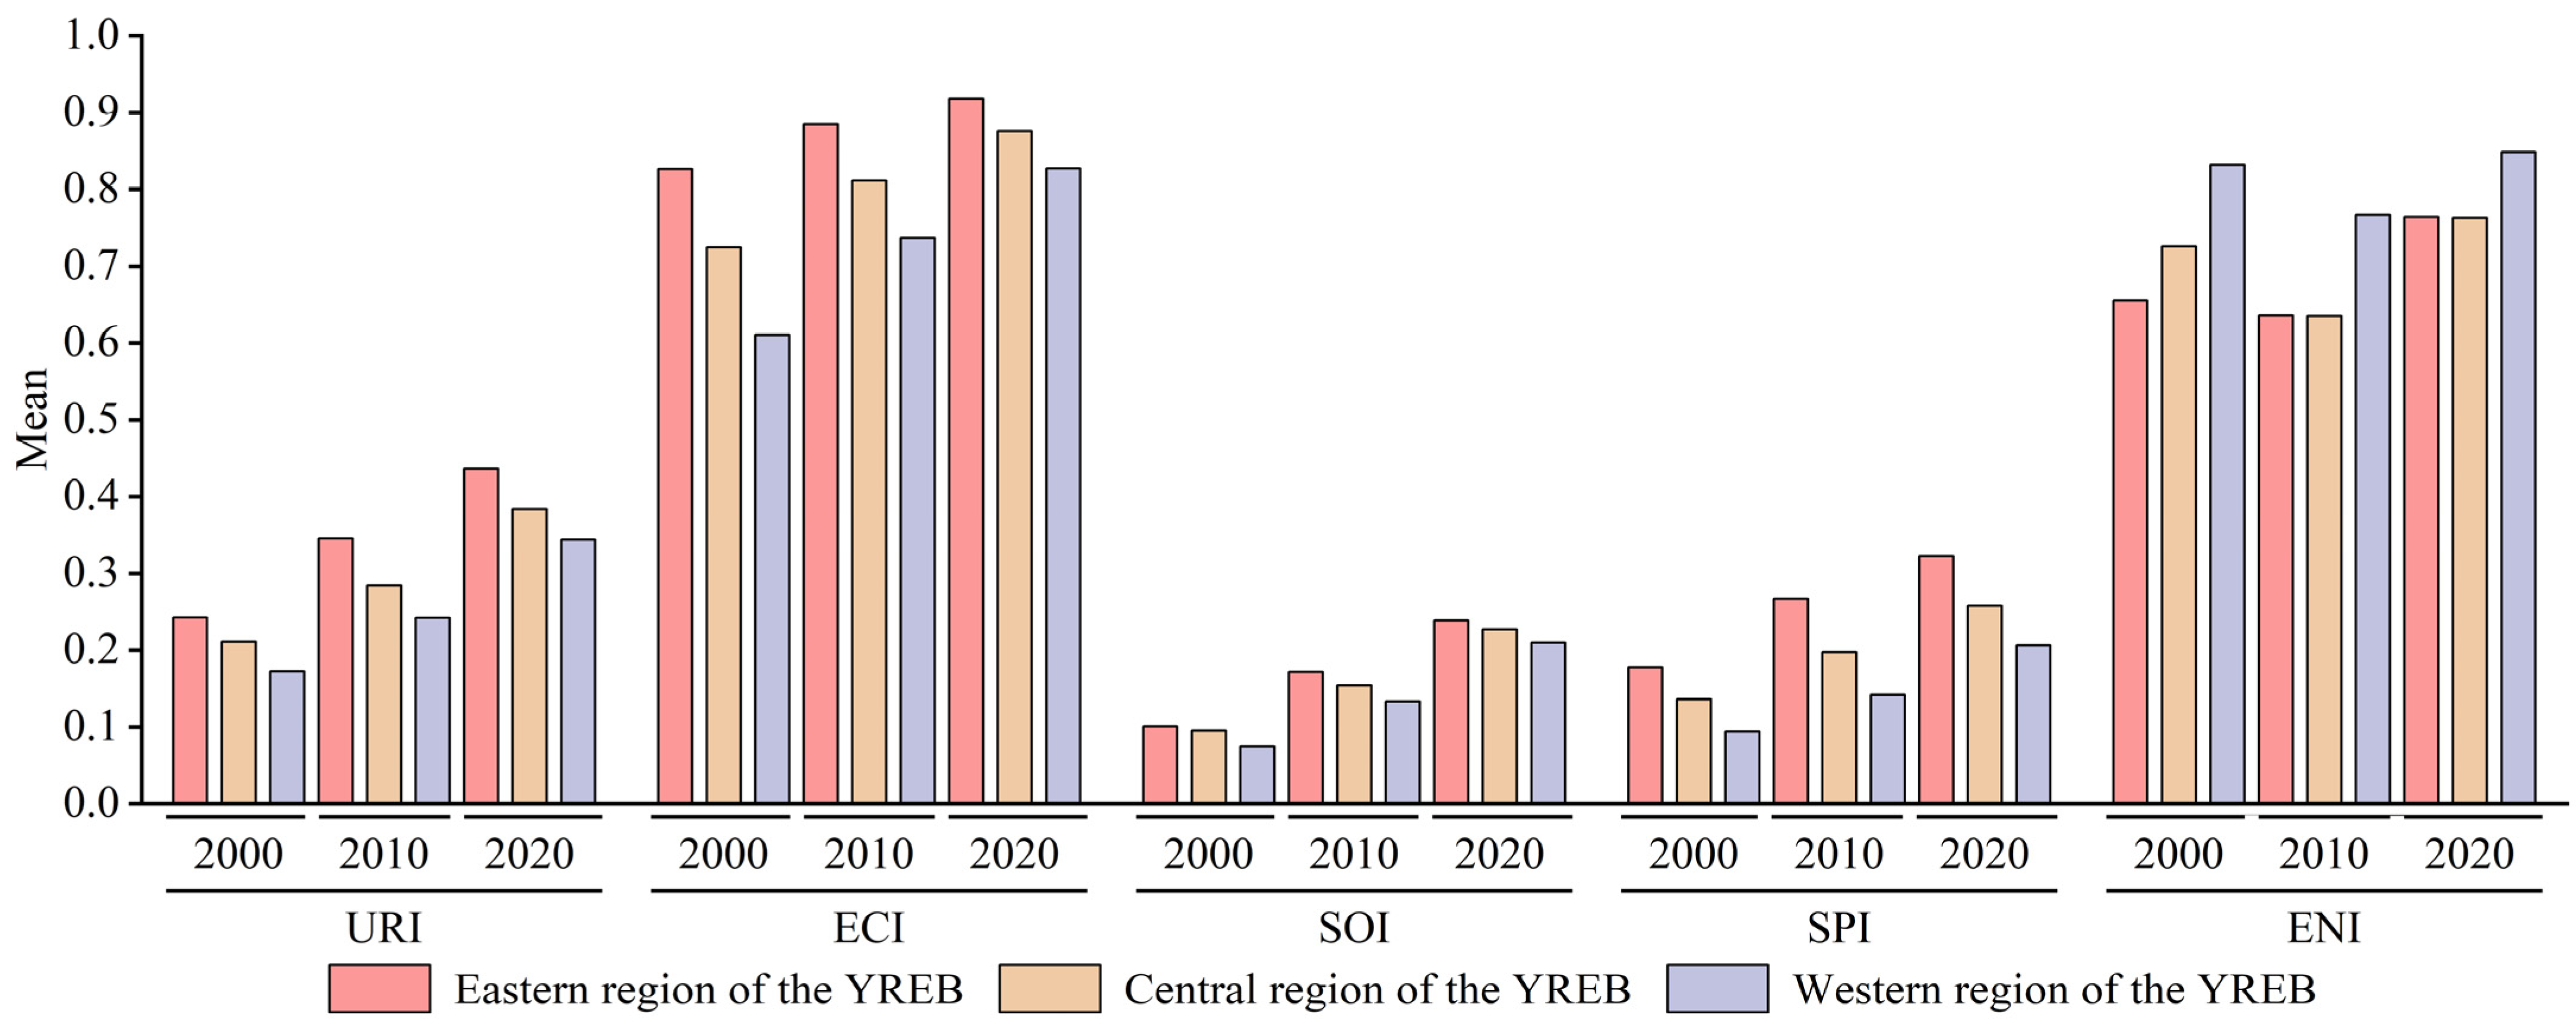
From 2000 to 2020, URI in the counties of the YREB improved gradually, remaining at a low to medium level. Economic, social, and spatial integration steadily advanced, while environmental integration fluctuated, first declining and then rising. Overall, social and spatial integration lagged behind economic and environmental integration.
(2)
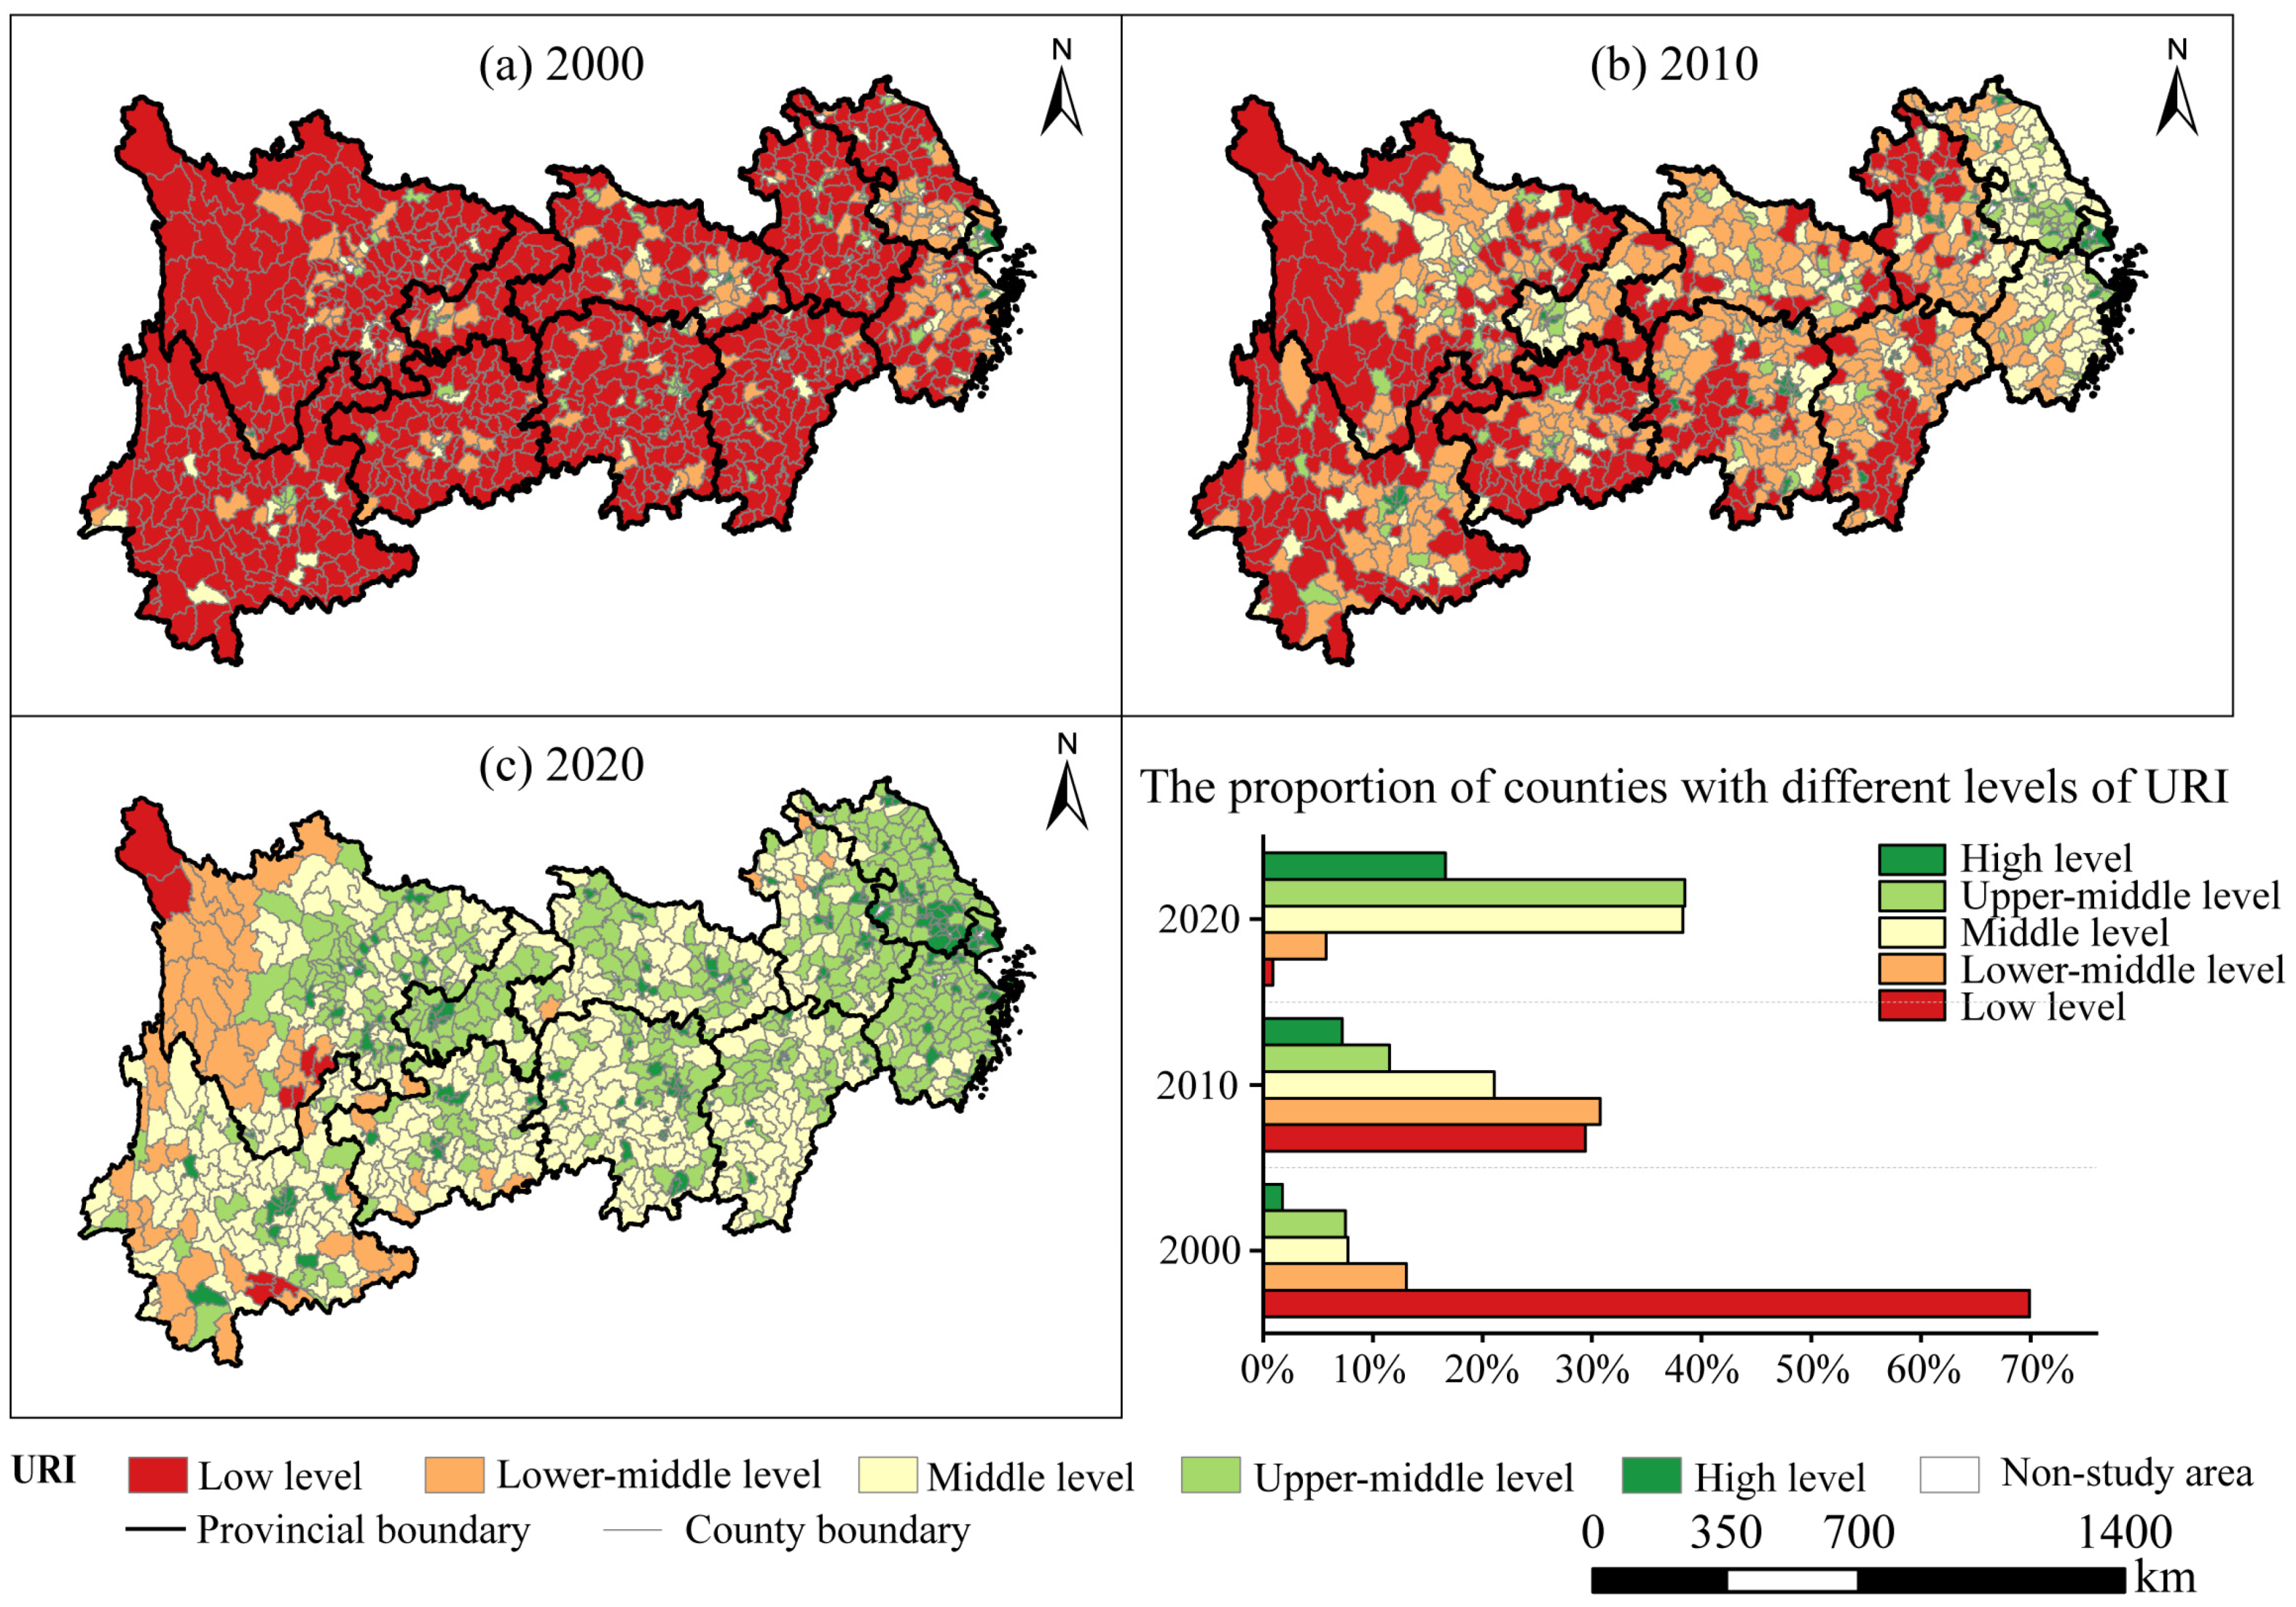
Spatially, URI in the YREB counties was characterized by higher levels in the east and lower levels in the west. High–high clusters of URI emerged primarily in the Yangtze River Delta, the middle reaches of the Yangtze River urban agglomeration, and the Chengdu–Chongqing urban agglomeration, highlighting the positive role of urban agglomerations in advancing URI. Additionally, low–low clusters of URI were concentrated at the western provincial borders and in southern Jiangxi, reflecting the lag in URI development in less developed regions.
(3)
Economic development, social fixed asset investment, transport accessibility, and the geographical environment drove the spatiotemporal divergence of URI in the YREB counties from 2000 to 2020. Regionally, URI in the eastern YREB was mainly constrained by the altitude. URI in the central YREB was significantly promoted by social fixed asset investment and transport accessibility and constrained by the slope. URI in the western YREB was significantly promoted by economic development and constrained by the slope. Therefore, each region should consider the local effects of drivers and promote URI according to regional conditions.
This paper explored the spatiotemporal dynamics of URI in the counties of the YREB and the influence of spatiotemporal heterogeneity in its driving factors. It revealed the evolutionary patterns and realities of URI in the region, providing a scientific basis for formulating region-specific URI policies in the YREB. Furthermore, the assessment of URI and its driving mechanisms offers valuable theoretical and practical insights for URI research and practice in other regions.

Author Contributions

Conceptualization, Y.D.; Methodology, Y.D. and L.L.; Software, Y.D. and L.L.; Validation, Y.D.; Formal analysis, Y.D. and L.L.; Investigation, Y.D.; Resources, Y.D.; Data curation, Y.D.; Writing—original draft, Y.D.; Writing—review & editing, Y.D. and X.H.; Visualization, Y.D.; Supervision, X.H.; Project administration, X.H.; Funding acquisition, X.H. All authors have read and agreed to the published version of the manuscript.

Funding

This research was sponsored by the Major Projects of the National Social Science Foundation of China (23&ZD099).

Data Availability Statement

The raw data supporting the conclusions of this article will be made available by the authors on request.

Conflicts of Interest

The authors declare no conflicts of interest.

Appendix A

Figure A1. Spatial distribution of the sub-dimensions of URI in the counties of the YREB, 2000–2020.
Land 14 00889 g0a1

References

  1. Lysgård, H.K. The assemblage of culture-led policies in small towns and rural communities. Geoforum 2019, 101, 10–17. [Google Scholar] [CrossRef]
  2. Fang, C. On integrated urban and rural development. J. Geogr. Sci. 2022, 32, 1411–1426. [Google Scholar] [CrossRef]
  3. Li, Y.; Westlund, H.; Liu, Y. Why some rural areas decline while some others not: An overview of rural evolution in the world. J. Rural Stud. 2019, 68, 135–143. [Google Scholar] [CrossRef]
  4. Li, Y.; Jia, L.; Wu, W.; Yan, J.; Liu, Y. Urbanization for rural sustainability–Rethinking China’s urbanization strategy. J. Clean Prod. 2018, 178, 580–586. [Google Scholar] [CrossRef]
  5. Liu, Y.; Li, Y. Revitalize the world’s countryside. Nature 2017, 548, 275–277. [Google Scholar] [CrossRef]
  6. McGee, T.G. Managing the rural–urban transformation in east Asia in the 21st century. Sustain. Sci. 2008, 3, 155–167. [Google Scholar] [CrossRef]
  7. Douglass, M. A regional network strategy for reciprocal rural-urban linkages: An agenda for policy research with reference to Indonesia. Third World Plan. Rev. 1998, 20, 1–33. [Google Scholar] [CrossRef]
  8. Liu, Y.; Lu, S.; Chen, Y. Spatio-temporal change of urban-rural equalized development patterns in China and its driving factors. J. Rural Stud. 2013, 32, 320–330. [Google Scholar] [CrossRef]
  9. Yang, Y.; Bao, W.; Wang, Y.; Liu, Y. Measurement of urban-rural integration level and its spatial differentiation in China in the new century. Habitat Int. 2021, 117, 102420. [Google Scholar] [CrossRef]
  10. Zheng, Y.; Long, H. Measurement and spatio-temporal pattern of urban-rural integrated development in China. Acta Geogr. Sin. 2023, 78, 1869–1887. (In Chinese) [Google Scholar] [CrossRef]
  11. Chen, C.; LeGates, R.; Zhao, M.; Fang, C. The changing rural-urban divide in China’s megacities. Cities 2018, 81, 81–90. [Google Scholar] [CrossRef]
  12. Pan, W.; Wang, J.; Li, Y.; Chen, S.; Lu, Z. Spatial pattern of urban-rural integration in China and the impact of geography. Geogr. Sustain. 2023, 4, 404–413. [Google Scholar] [CrossRef]
  13. Zhao, W.; Pan, W.; Li, Y. Urban-rural integration within the county territory: Theoretical connotation and research progress. Geogr. Res. 2023, 42, 1445–1464. (In Chinese) [Google Scholar] [CrossRef]
  14. Ma, L.; Liu, S.; Fang, F.; Che, X.; Chen, M. Evaluation of urban-rural difference and integration based on quality of life. Sust. Cities Soc. 2020, 54, 101877. [Google Scholar] [CrossRef]
  15. Boudet, F.; MacDonald, G.K.; Robinson, B.E.; Samberg, L.H. Rural-urban connectivity and agricultural land management across the global south. Glob. Environ. Change 2020, 60, 101982. [Google Scholar] [CrossRef]
  16. Zarifa, D.; Seward, B.; Milian, R.P. Location, location, location: Examining the rural-urban skills gap in Canada. J. Rural Stud. 2019, 72, 252–263. [Google Scholar] [CrossRef]
  17. Baier, N.; Pieper, J.; Schweikart, J.; Busse, R.; Vogt, V. Capturing modelled and perceived spatial access to ambulatory health care services in rural and urban areas in Germany. Soc. Sci. Med. 2020, 265, 113328. [Google Scholar] [CrossRef]
  18. Seale, E. Coping strategies of urban and rural welfare organisations and the regulation of the poor. New Polit. Econ. 2013, 18, 141–170. [Google Scholar] [CrossRef]
  19. Liu, H.; Lu, G.; Luo, K.; Zong, H. Measurement and spatio-temporal pattern evolution of urban-rural integration development in the Chengdu-Chongqing economic circle. Land 2024, 13, 942. [Google Scholar] [CrossRef]
  20. Zhang, S.; Chen, W.; Li, Q.; Li, M. Evaluation and development strategy of urban-rural integration under ecological protection in the Yellow River Basin, China. Environ. Sci. Pollut. Res. 2023, 30, 92674–92691. [Google Scholar] [CrossRef]
  21. Zhao, W.; Jiang, C. Analysis of the spatial and temporal characteristics and dynamic effects of urban-rural integration development in the Yangtze River Delta region. Land 2022, 11, 1054. [Google Scholar] [CrossRef]
  22. Liu, M.; Li, Q.; Bai, Y.; Fang, C. A novel framework to evaluate urban-rural coordinated development: A case study in Shanxi province, China. Habitat Int. 2024, 144, 103013. [Google Scholar] [CrossRef]
  23. Zeng, Q.; Chen, X. Identification of urban-rural integration types in China—An unsupervised machine learning approach. China Agric. Econ. Rev. 2022, 15, 400–415. [Google Scholar] [CrossRef]
  24. Zhan, L.; Wang, S.; Xie, S.; Zhang, Q.; Qu, Y. Spatial path to achieve urban-rural integration development−Analytical framework for coupling the linkage and coordination of urban-rural system functions. Habitat Int. 2023, 142, 102953. [Google Scholar] [CrossRef]
  25. He, Y.; Zhou, G.; Tang, C.; Fan, S.; Guo, X. The spatial organization pattern of urban-rural integration in urban agglomerations in China: An agglomeration-diffusion analysis of the population and firms. Habitat Int. 2019, 87, 54–65. [Google Scholar] [CrossRef]
  26. Su, K.; He, D.; Wang, R.; Han, Z.; Deng, X. Assessment of natural resource endowment and urban-rural integration for sustainable development in Xinjiang, China. J. Clean. Prod. 2024, 450, 142046. [Google Scholar] [CrossRef]
  27. Adam, A.G.; Dadi, T.T. Perspectives for smooth bridging of dichotomized urban–rural land development in the Peri-urban areas of Ethiopia: Toward a continuum approach. Reg. Sci. Policy Pract. 2024, 16, 12733. [Google Scholar] [CrossRef]
  28. Garrone, M.; Emmers, D.; Olper, A.; Swinnen, J. Jobs and agricultural policy: Impact of the common agricultural policy on EU agricultural employment. Food Policy 2019, 87, 101744. [Google Scholar] [CrossRef]
  29. Looney, K.E. Mobilization campaigns and rural development: The east Asian model reconsidered. World Polit. 2021, 73, 205–242. [Google Scholar] [CrossRef]
  30. Natsuda, K.; Igusa, K.; Wiboonpongse, A.; Thoburn, J. One village one product—Rural development strategy in Asia: The case of OTOP in Thailand. Can. J. Dev. Stud. 2012, 33, 369–385. [Google Scholar] [CrossRef]
  31. Zhang, X.; Fang, C.; Ma, H.; Hu, X. How does digital economy affect urban-rural integration? An empirical study from China. Habitat Int. 2024, 154, 103229. [Google Scholar] [CrossRef]
  32. Zhong, S.; Wang, M.; Zhu, Y.; Chen, Z.; Huang, X. Urban expansion and the urban-rural income gap: Empirical evidence from China. Cities 2022, 129, 103831. [Google Scholar] [CrossRef]
  33. Luo, W.; Wang, W.; Lin, Z.; Zhou, W. Spatiotemporal evolution and driving factors of urban-rural integration in China. Prog. Geogr. 2023, 42, 629–643. (In Chinese) [Google Scholar] [CrossRef]
  34. Liu, X.; Luo, Y.; Zhu, Y.; Guo, L. Research on the measurement and effects of urban–rural integration and modernization in national central cities. Soc. Indic. Res. 2024, 173, 827–866. [Google Scholar] [CrossRef]
  35. Sun, Y.; Yang, Q.; Liu, J. Spatio-temporal evolution and influencing factors of integrated urban–rural development in northeast China under the background of population shrinkage. Buildings 2023, 13, 2173. [Google Scholar] [CrossRef]
  36. Huang, B.; Wu, B.; Barry, M. Geographically and temporally weighted regression for modeling spatio-temporal variation in house prices. Int. J. Geogr. Inf. Sci. 2010, 24, 383–401. [Google Scholar] [CrossRef]
  37. Zhou, D.; Qi, J.; Zhong, W. Review of urban-rural integration evaluation: Connotation identification, theoretical analysis, and system reconstruction. J. Nat. Resour. 2021, 36, 2634–2651. (In Chinese) [Google Scholar] [CrossRef]
  38. Zhang, X.; Han, L.; Wei, H.; Tan, X.; Zhou, W.; Li, W.; Qian, Y. Linking urbanization and air quality together: A review and a perspective on the future sustainable urban development. J. Clean. Prod. 2022, 346, 130988. [Google Scholar] [CrossRef]
  39. Dai, H.; Huang, G.; Zeng, H.; Yu, R. Haze risk assessment based on improved PCA-MEE and ISPO-LightGBM model. Systems 2022, 10, 263. [Google Scholar] [CrossRef]
  40. Anselin, L. Local indicators of spatial association-LISA. Geogr. Anal. 1995, 27, 93–115. [Google Scholar] [CrossRef]
  41. Ullah, I.; Dagar, V.; Tanin, T.I.; Rehman, A.; Zeeshan, M. Agricultural productivity and rural poverty in China: The impact of land reforms. J. Clean. Prod. 2024, 475, 143723. [Google Scholar] [CrossRef]
  42. Wang, J.; Xu, C. Geodetector: Principle and prospective. Acta Geogr. Sin. 2017, 72, 116–134. (In Chinese) [Google Scholar] [CrossRef]
  43. Liu, H.; Cui, W.; Zhang, M. Exploring the causal relationship between urbanization and air pollution: Evidence from China. Sust. Cities Soc. 2022, 80, 103783. [Google Scholar] [CrossRef]
  44. Chen, S.; Tan, Z.; Mu, S.; Wang, J.; Chen, Y.; He, X. Synergy level of pollution and carbon reduction in the Yangtze River Economic Belt: Spatial-temporal evolution characteristics and driving factors. Sust. Cities Soc. 2023, 98, 104859. [Google Scholar] [CrossRef]
  45. Wu, Q.; Chang, W.; Song, M.; Zhu, H. Measurement of urban-rural integration development level and diagnosis of obstacle factors: Evidence from the Beijing-Tianjin-Hebei urban agglomeration, China. Land 2025, 14, 261. [Google Scholar] [CrossRef]
  46. Tong, Y.; Liu, W.; Li, C.; Rong, Y.; Zhang, J.; Yang, Y.; Yan, Q.; Gao, S.; Liu, Y. County town shrinkage in China: Identification, spatiotemporal variations and the heterogeneity of influencing factors. J. Rural Stud. 2022, 95, 350–361. [Google Scholar] [CrossRef]
  47. Wang, N.; Li, S.; Kang, Q.; Wang, Y. Exploring the land ecological security and its spatio-temporal changes in the Yangtze River Economic Belt of China, 2000–2020. Ecol. Indic. 2023, 154, 110645. [Google Scholar] [CrossRef]
  48. Zhang, D.; Kong, Q.; Shen, M. Does polycentric spatial structure narrow the urban-rural income gap? – Evidence from six urban clusters in China. China Econ. Rev. 2023, 80, 101999. [Google Scholar] [CrossRef]
  49. Li, Y.; Wu, S.; Yan, B. Spatial characteristics and influential mechanism of the coupling coordination degree of urban accessibility and human development index in China. Environ. Sci. Pollut. Res. 2022, 29, 29793–29807. [Google Scholar] [CrossRef]
  50. Gao, J.; Wu, B. Revitalizing traditional villages through rural tourism: A case study of Yuanjia village, Shaanxi province, China. Tour. Manag. 2017, 63, 223–233. [Google Scholar] [CrossRef]
Figure 1. Conceptual framework of URI.
Land 14 00889 g001
Figure 2. The study area.
Land 14 00889 g002
Figure 3. Statistics for average URI in counties of YREB, 2000–2020.
Land 14 00889 g003
Figure 4. Statistics for average URI in counties of different regions in YREB, 2000–2020.
Land 14 00889 g004
Figure 5. Spatial distribution of URI in counties of YREB, 2000–2020.
Land 14 00889 g005
Figure 6. LISA maps for URI in counties of YREB, 2000–2020.
Land 14 00889 g006
Figure 7. Spatial distribution of regression coefficients for drivers of URI in YREB counties based on GTWR model, 2000–2020.
Land 14 00889 g007
Table 1. Indicator system for URI.
LayerCodeIndicatorCalculation or DescriptionCategoryAttributeWeight
ECIX1The ratio of agricultural to non-agricultural employment (%) (Primary industry employees/employees in secondary and tertiary industries) × 100% InteractiveNegative0.348
X2The ratio of the output values of secondary and tertiary industries (%)(Output value of secondary and tertiary industries/GDP) × 100%InteractivePositive0.333
X3Binary comparison coefficient (%)(Primary industry output/primary industry employees)/(secondary and tertiary industry output/secondary and tertiary industry employees)ComparativePositive0.021
X4Per capita income ratio between urban and rural residents (%)(Per capita disposable income of urban residents/per capita disposable income of rural residents) × 100%ComparativeNegative0.298
SOIX5Beds per 10,000 population in urban and rural areas (beds per 10,000 population)(Medical beds in urban and rural areas/total population) × 10,000OverallPositive0.338
X6Healthcare technicians per 1000 population in urban and rural areas (persons per 1000 population)(Healthcare technicians in urban and rural areas/total population) × 1000OverallPositive0.360
X7Teacher–student ratio in urban and rural primary and secondary schools(Teachers at primary and secondary schools in urban and rural areas/students at primary and secondary schools in urban and rural areas) × 100%OverallPositive0.302
SPIX8Population urbanization (%)(Urban resident population/total population) × 100%InteractivePositive0.365
X9Land urbanization (%)(Urban construction land area/total land area) × 100%InteractivePositive0.337
X10Urban and rural road network density (km/km2)Mileage of urban and rural highways/total land areaOverallPositive0.298
ENIX11PM2.5 in urban and rural areasOverallNegative0.371
X12Fertilizer usage per unit area of cultivated land in urban and rural areas (t/hm2)Fertilizer usage/cultivated land areaOverallNegative0.278
X13Pesticide usage per unit area of cultivated land in urban and rural areas (t/hm2)Pesticide usage/cultivated land areaOverallNegative0.351
Note: Due to the large number of counties and limitations of county-level urban and rural statistics, it is difficult to differentiate urban–rural disparities in the SOI and ENI indicators. Since the overall level of urban and rural development partially reflects URI performance, we used aggregated indicators to assess SOI and ENI.
Table 2. Drivers of URI.
DriverCodeFactorCalculation or DescriptionUnit
Economic factor (D1)F1Per capita GDP (PGDP)GDP/total populationCNY 10,000/person
F2Industrial structure advancement degree (ISAD)Value added from tertiary industry/value added from secondary industry
Policy factor (D2)F3Per capita public financial input (PPFI)Public financial input/total population CNY 10,000/person
F4Per capita social fixed asset investment (PSFAI)Social fixed asset investment/total population CNY 10,000/person
Technological factor (D3)F5Transportation network density (TA)Mileage of urban and rural highways/total land area km/km2
F6Power of agricultural machinery per unit of cultivated land (PPAM)Total power of agricultural machinery/cultivated land areakW/hm2
Geographical environment factor (D4)F7Average elevation (AE)The average elevation of each county m
F8Average slope (AS)The average slope of each county
Table 3. Factor detection results for driving factors of URI in counties of YREB, 2000–2020.
Factor200020102020Mean q-Value
q-Valuep-Valueq-Valuep-Valueq-Valuep-Value
PGDP (F1)0.2330.0000.4530.0000.3540.0000.347
ISAD (F2)0.0620.0000.0180.9790.0100.9550.030
PPFI (F3)0.0430.0080.0320.0570.0890.0000.054
PSFAI (F4)0.2940.0000.2770.0000.0710.0000.214
TA (F5)0.0640.0000.1580.0000.2270.0000.150
PPAM (F6)0.0730.0000.0430.0540.0060.9960.041
AE (F7)0.1400.0000.1870.0000.1830.0000.170
AS (F8)0.1470.0000.1970.0000.2190.0000.188
Table 4. Comparison of parameters among OLS, GWR, and GTWR models.
ParameterOLSGWRGTWR
Bandwidth0.11500.1118
AIC−4645.0984 −5137.5100−5655.6900
R20.54940.62590.6944
R2—adjusted0.54870.62530.6939
RSS39.497032.801626.7998
Disclaimer/Publisher’s Note: The statements, opinions and data contained in all publications are solely those of the individual author(s) and contributor(s) and not of MDPI and/or the editor(s). MDPI and/or the editor(s) disclaim responsibility for any injury to people or property resulting from any ideas, methods, instructions or products referred to in the content.

