

Investigating the Effect of Blue–Green Infrastructure on Thermal Condition—Case Study: Elazığ, Turkey


Abstract
1. Introduction
2. Literature Review
2.1. Vegeatation
2.2. Cool Materials
2.3. Water
3. Materials and Methods
3.1. Study Area
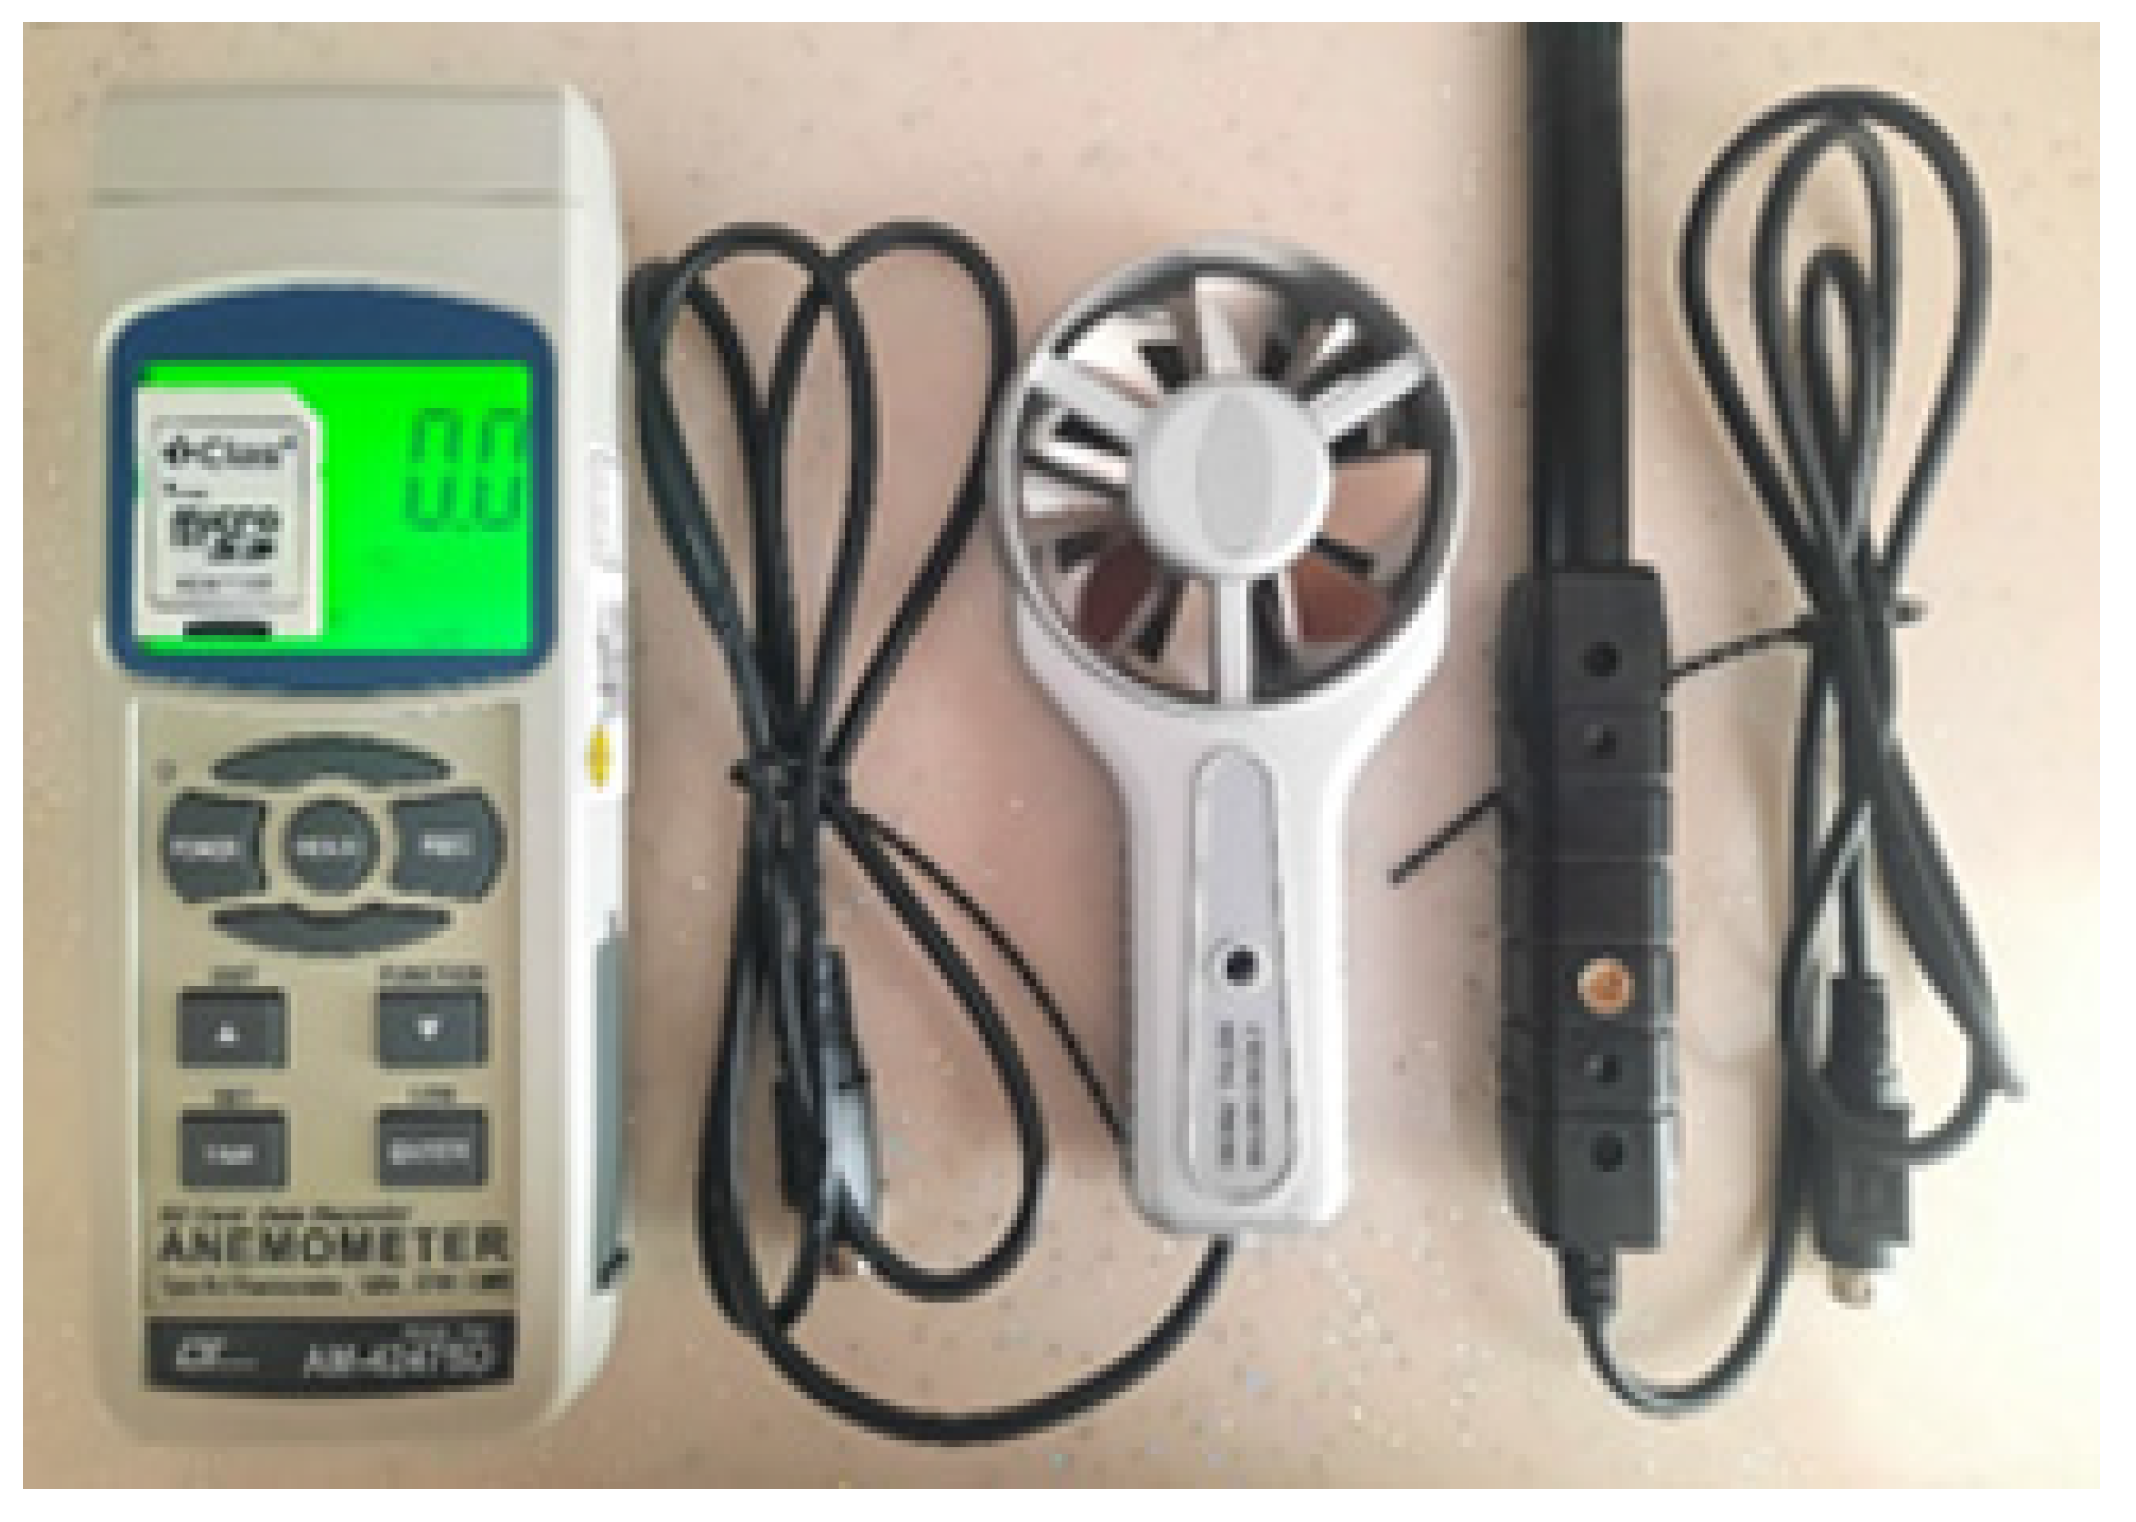
3.2. Field Measurements
3.3. Climatic Features of the Study Area
3.4. Preparation of the Landscape Scenarios
- ○
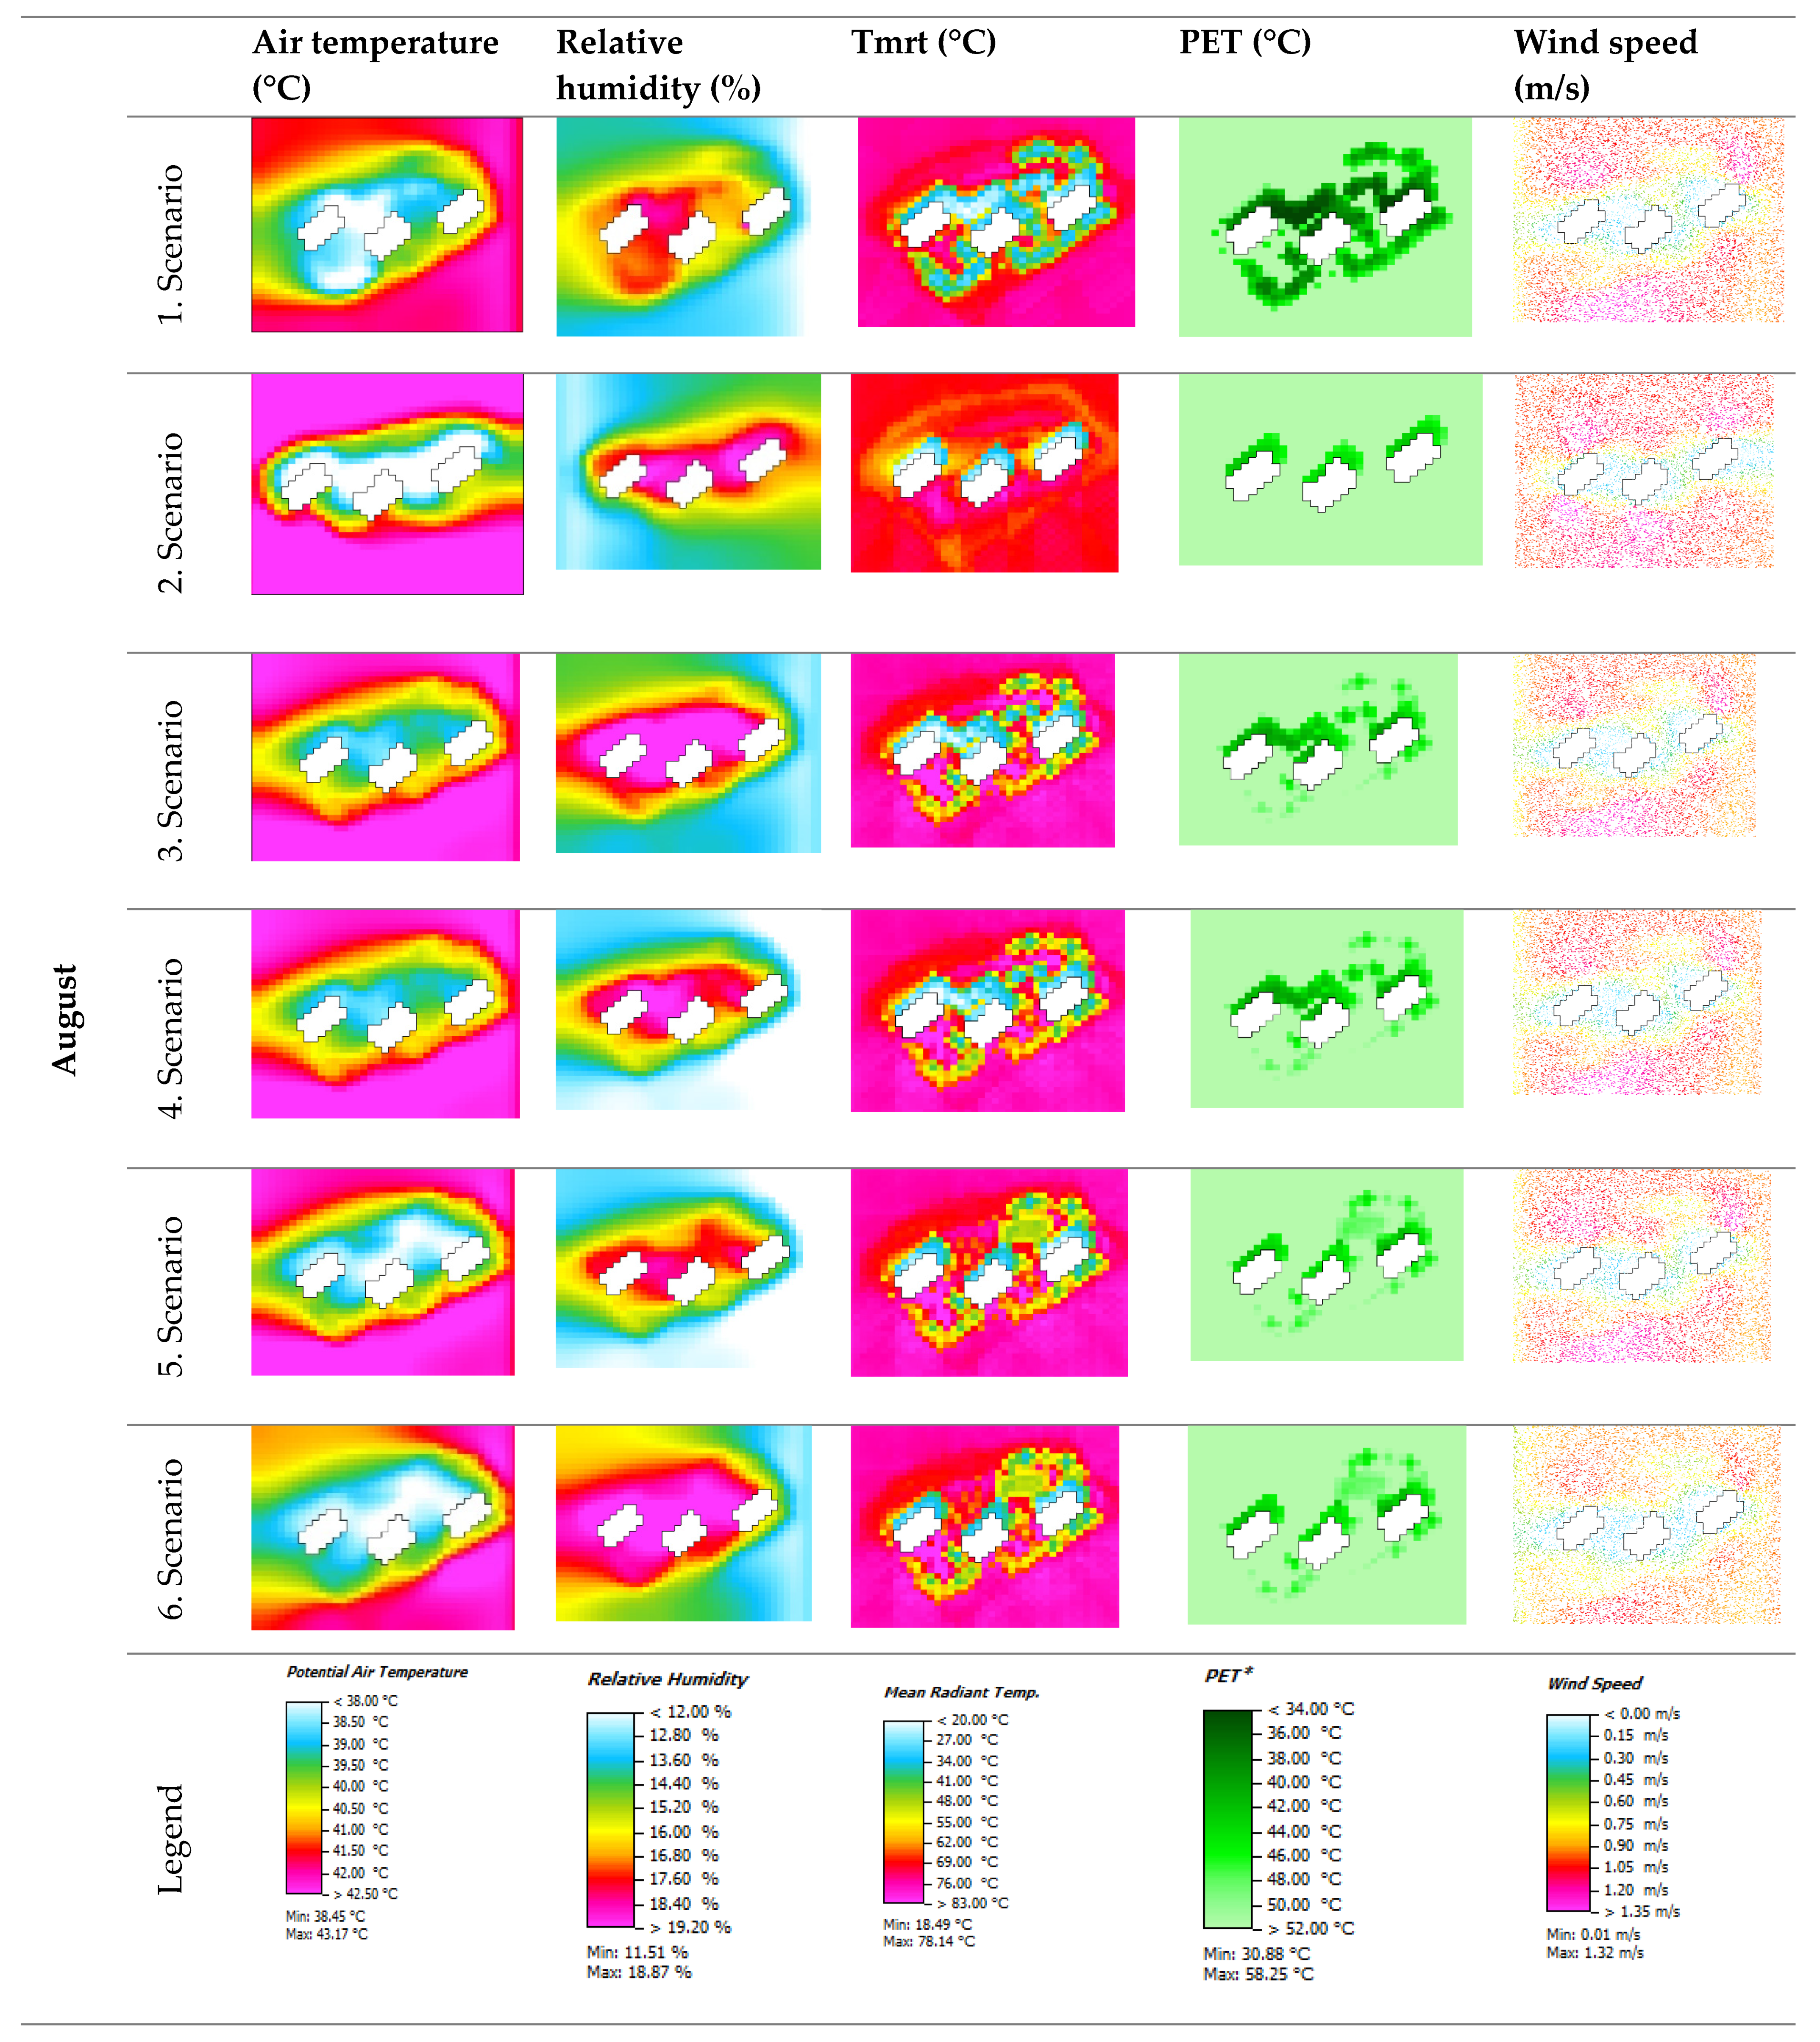
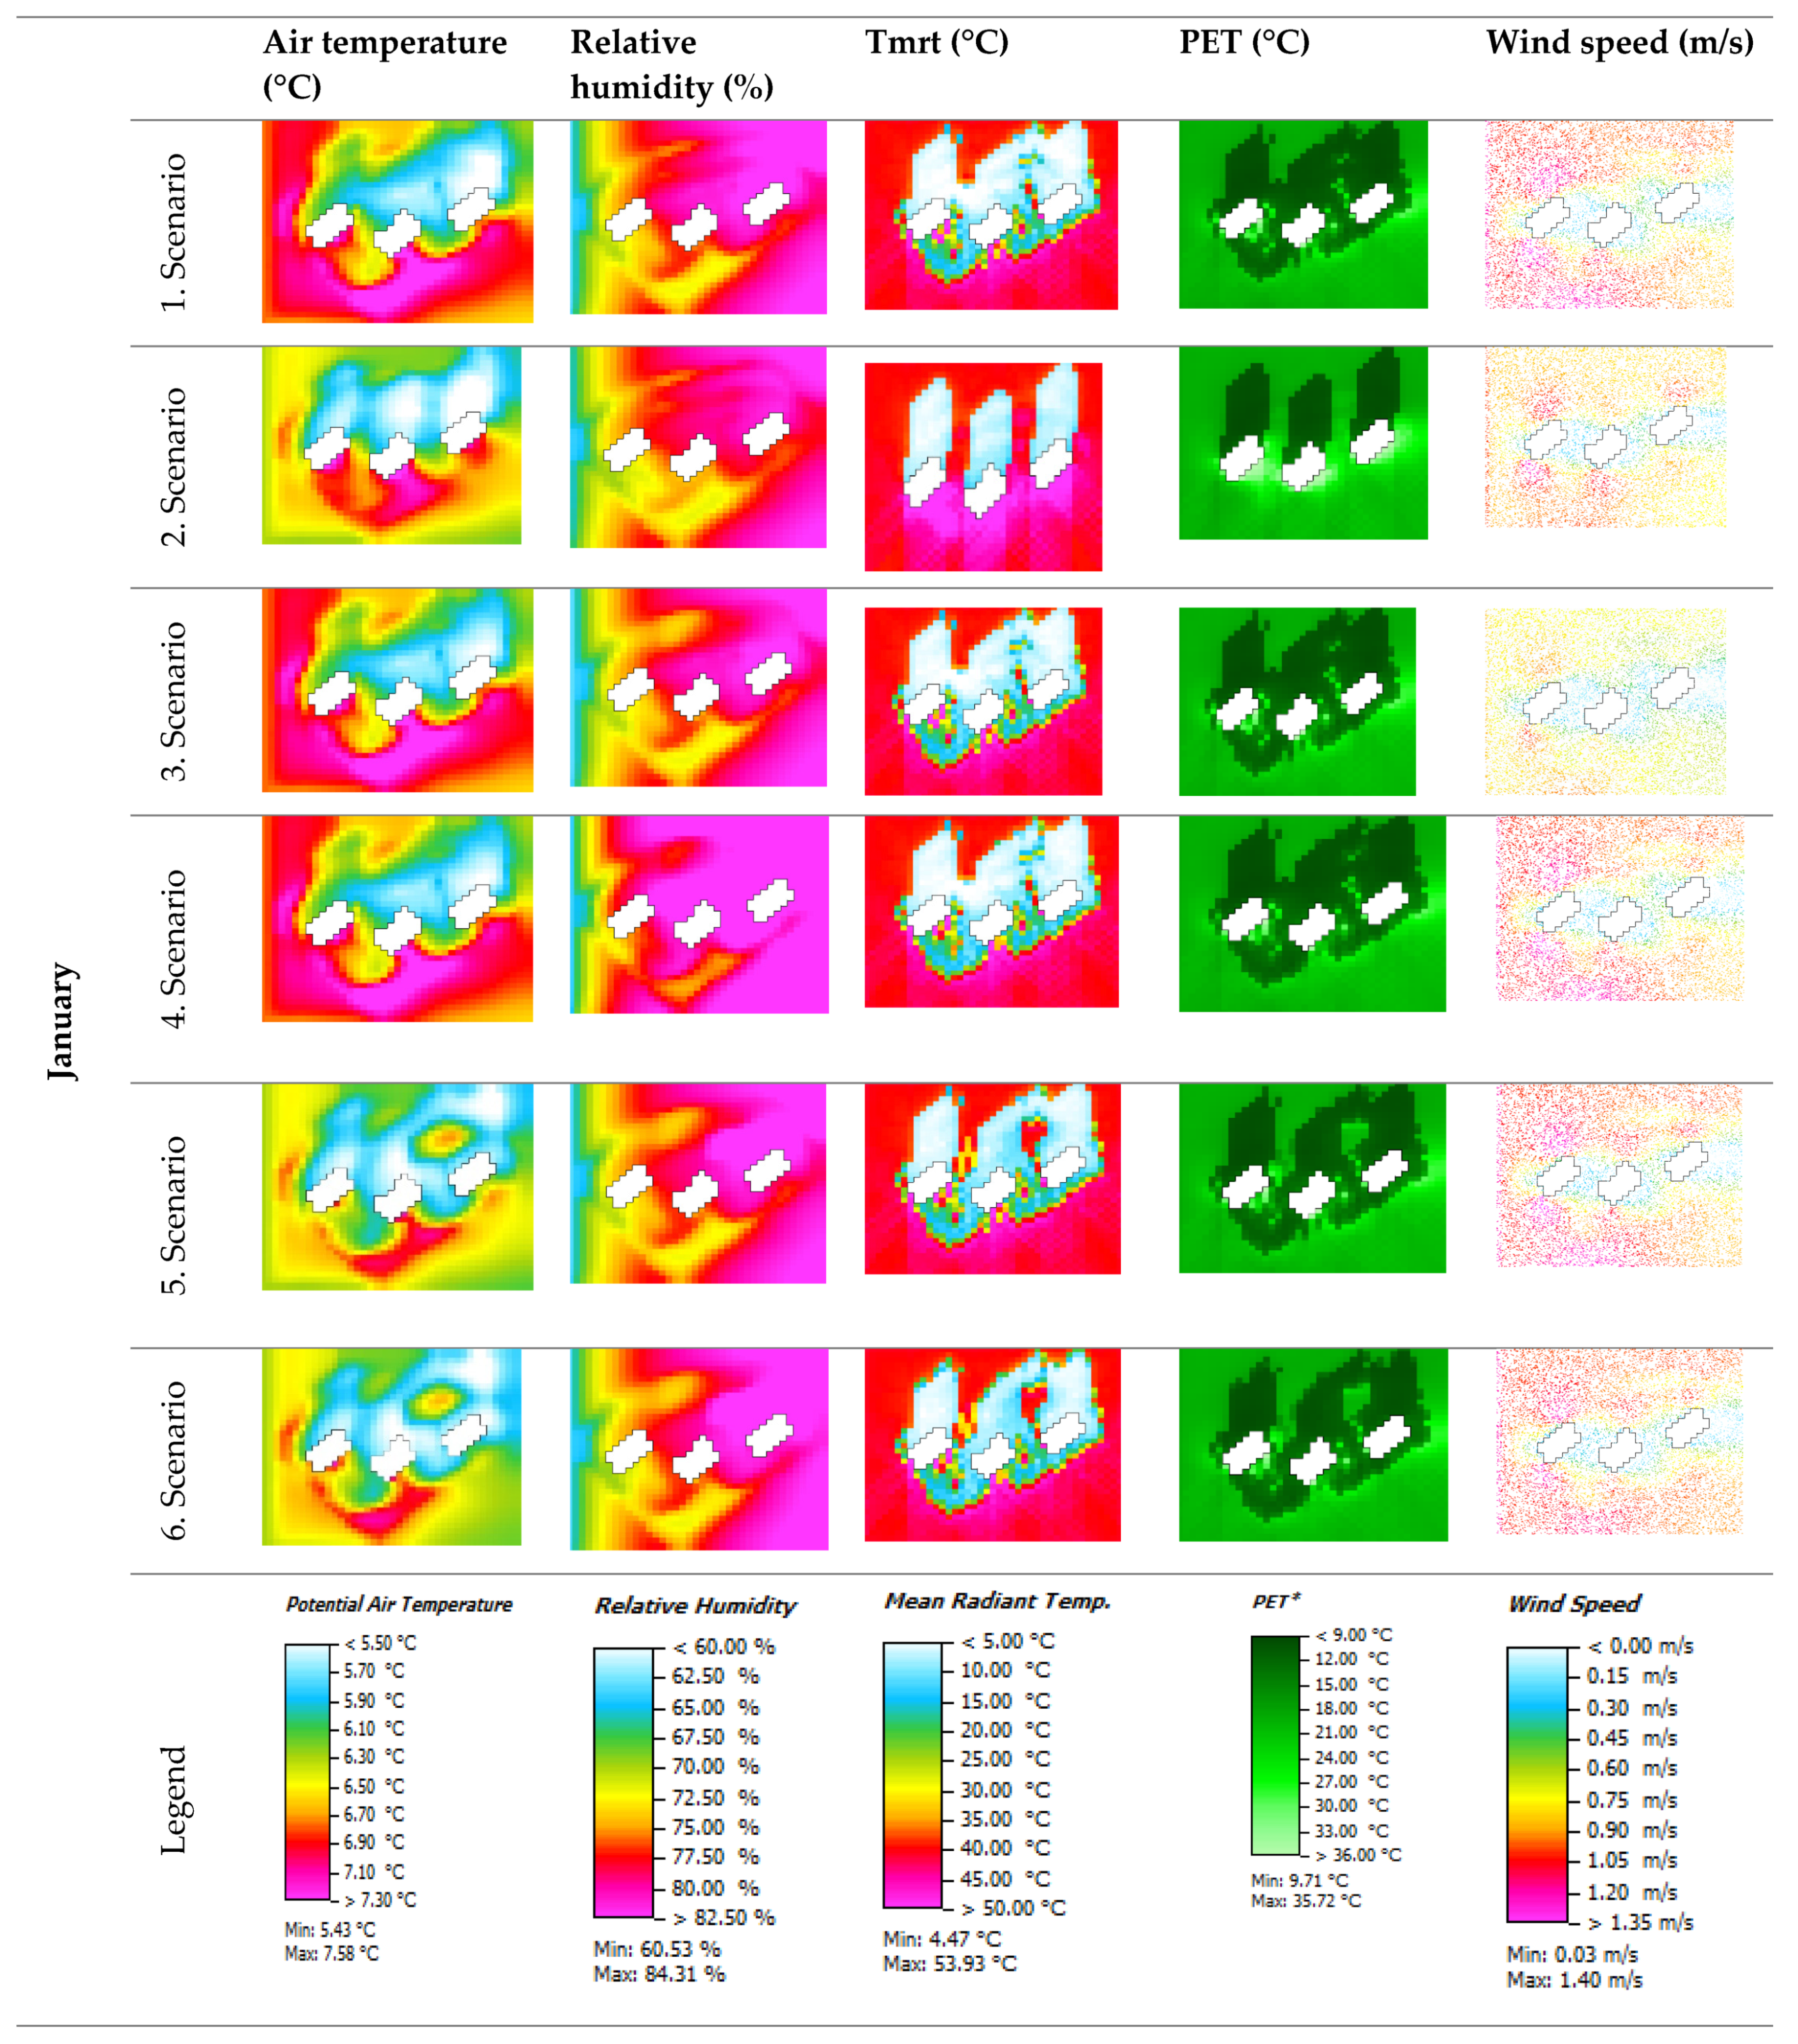
- Scenario 1: This scenario represents the existing conditions of the study area, incorporating the current structures, vegetation, and material types present in the site.
- ○
- Scenario 2: Scenario depicting the study area without vegetation.
- ○
- Scenario 3: Scenario depicting a 10% grass coverage applied to a 1000 m2 land area in the northern section of the study site to consider the impact of partial vegetation coverage on thermal regulations.
- ○
- Scenario 4: Scenario incorporating a 10% grass coverage alongside a 20% increase in tree density within the study area to assess the combined effects of grass and additional tree cover on thermal regulation.
- ○
- Scenario 5: Scenario incorporating a 10% increase in grass coverage, a 20% increase in tree density, and the addition of 10% water bodies to evaluate the combined effects of vegetation and water on thermal regulation.
- ○
- Scenario 6: Scenario incorporating a 10% increase in grass coverage, a 20% increase in tree density, a 10% water surface, and the addition of three roof tops to the buildings in the study area. An extensive green roof was used in this study. The buildings are 10 stories, each featuring an extensive green roof. Green roofs are situated at 30 m height from the ground. Each building has a roof area of approximately 600 m2, resulting in a total of 1.8 hectares (3 × 600 = 1800 m2) of green space. Table 2 lists the 3D view of the study area in each scenario and shows the percentage of building, pavement, vegetation, open space, and water body ratio in each scenario.
3.5. Microclimate Simulations with ENVI-met 5.6.1
3.6. ENVI-met Verification
4. Results and Discussion
4.1. Existing Scenarios
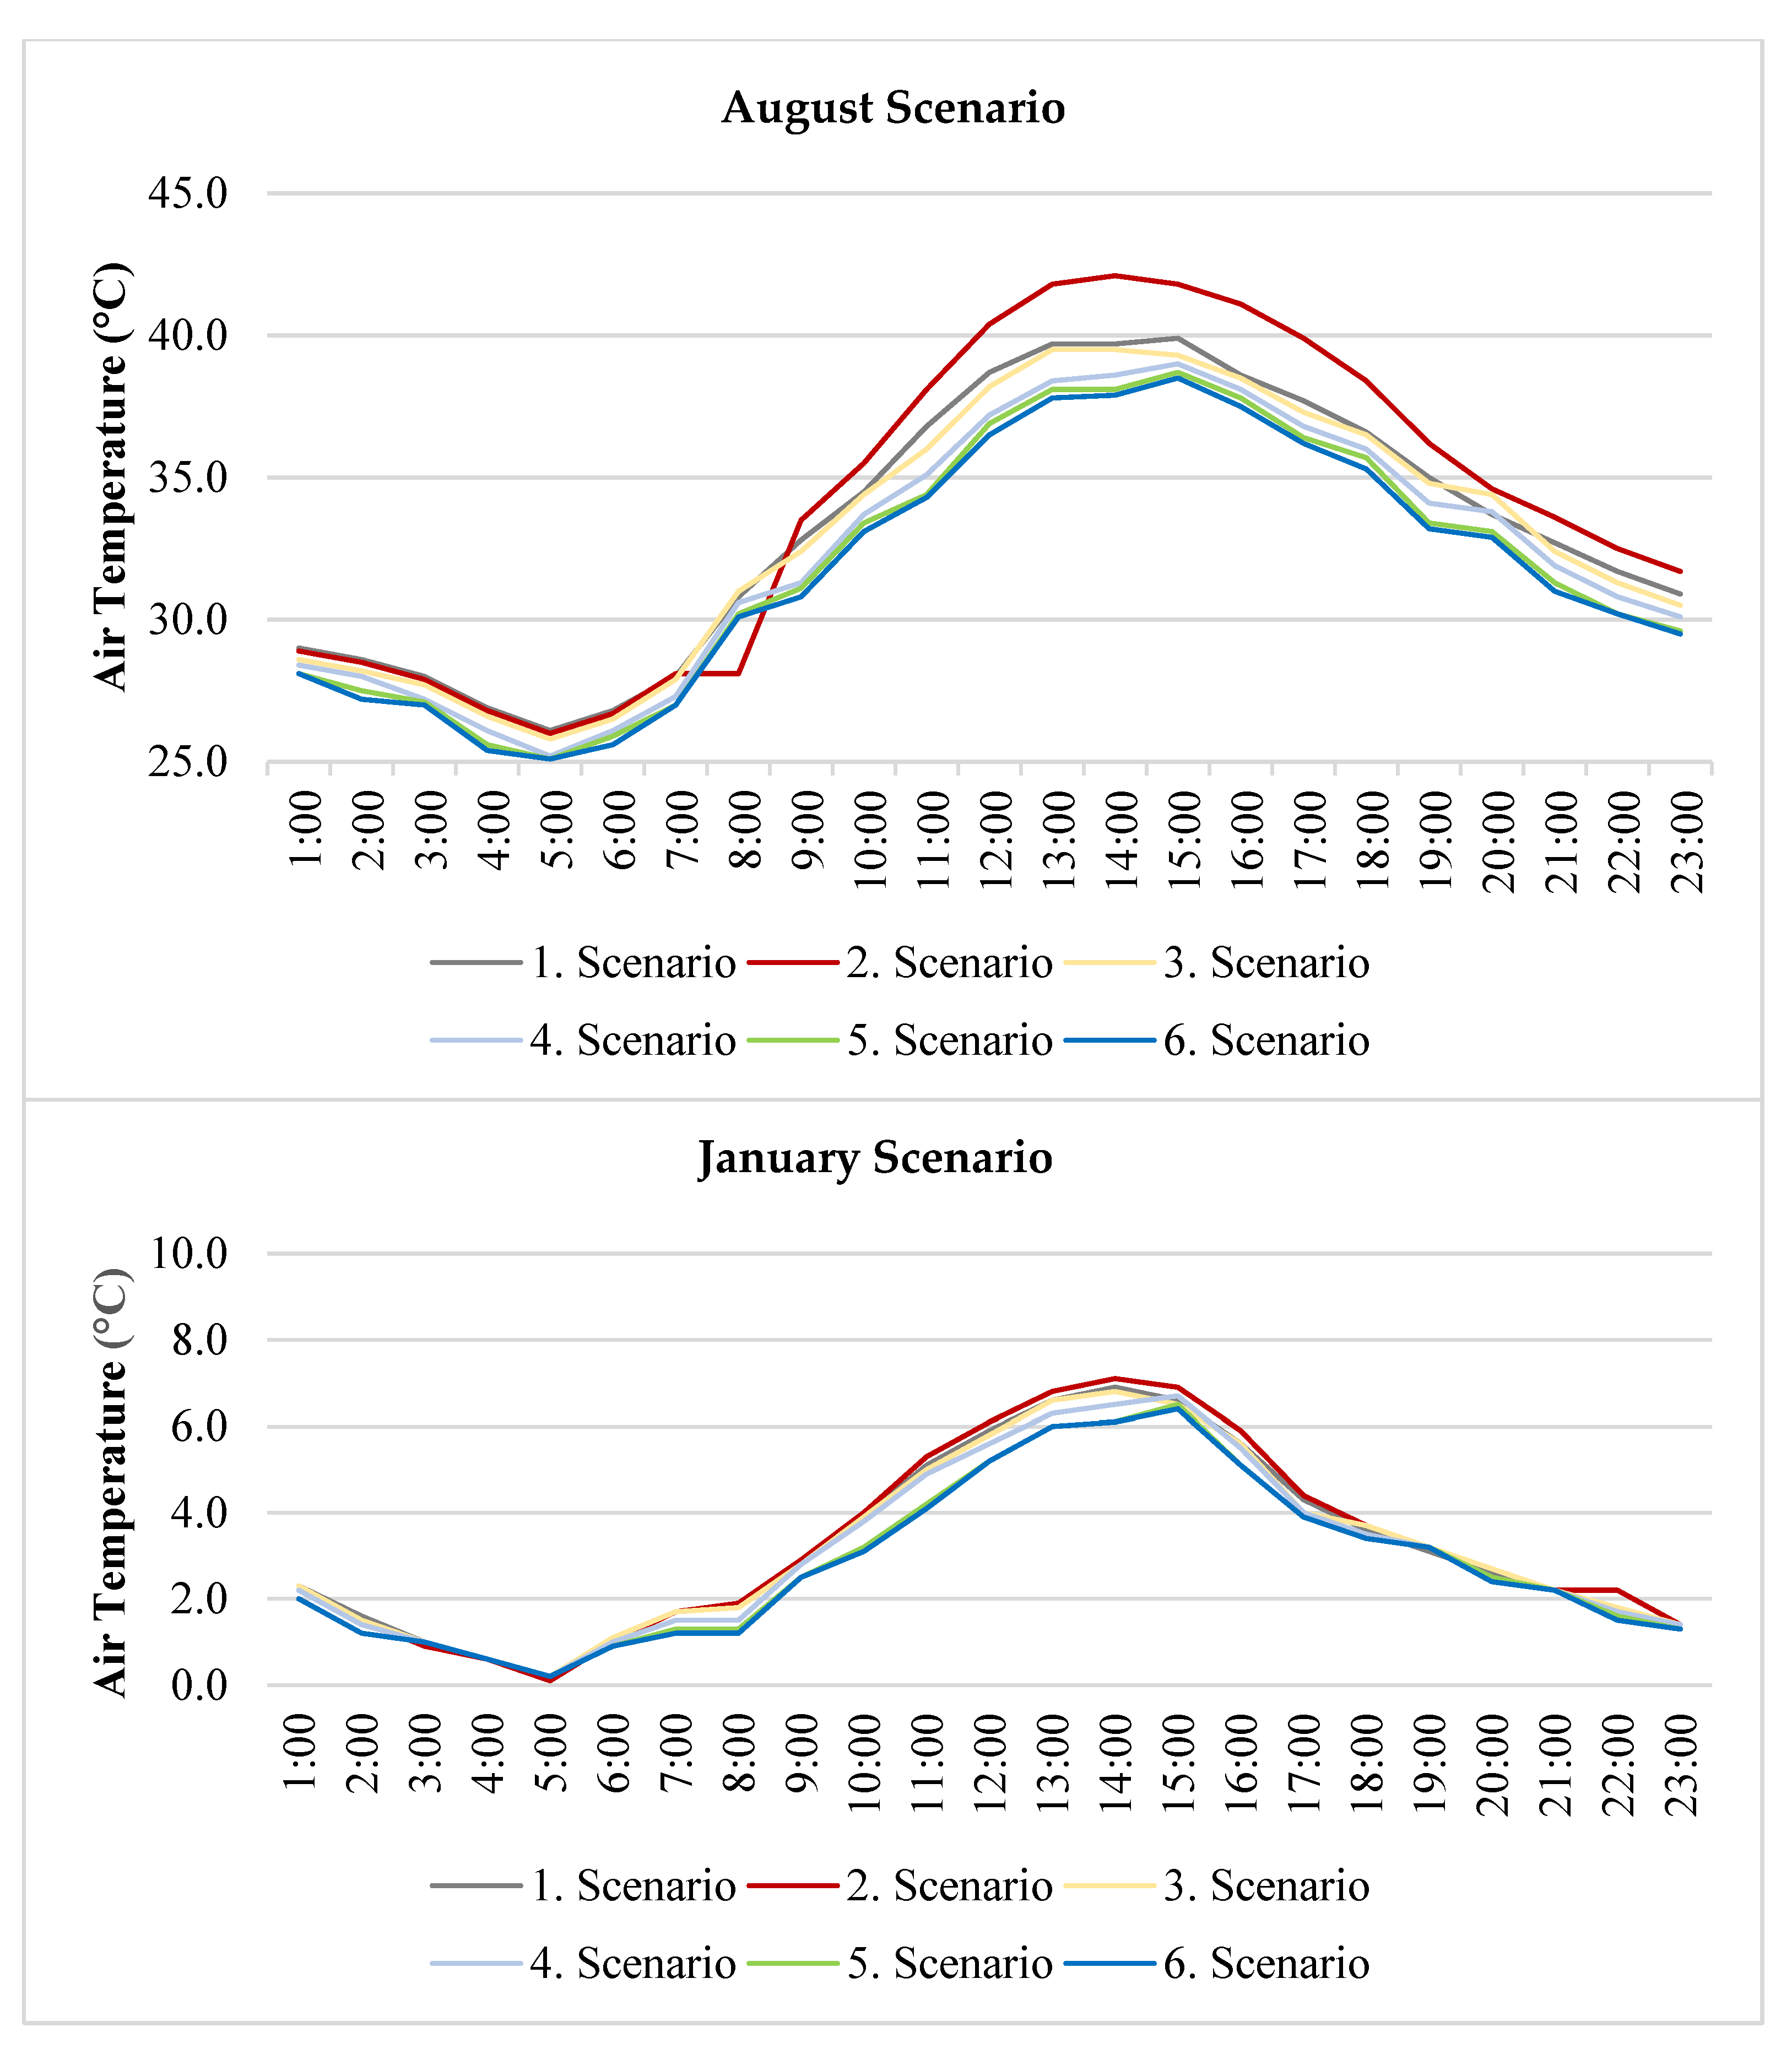
4.2. Air Temperature
4.3. Relative Humidity
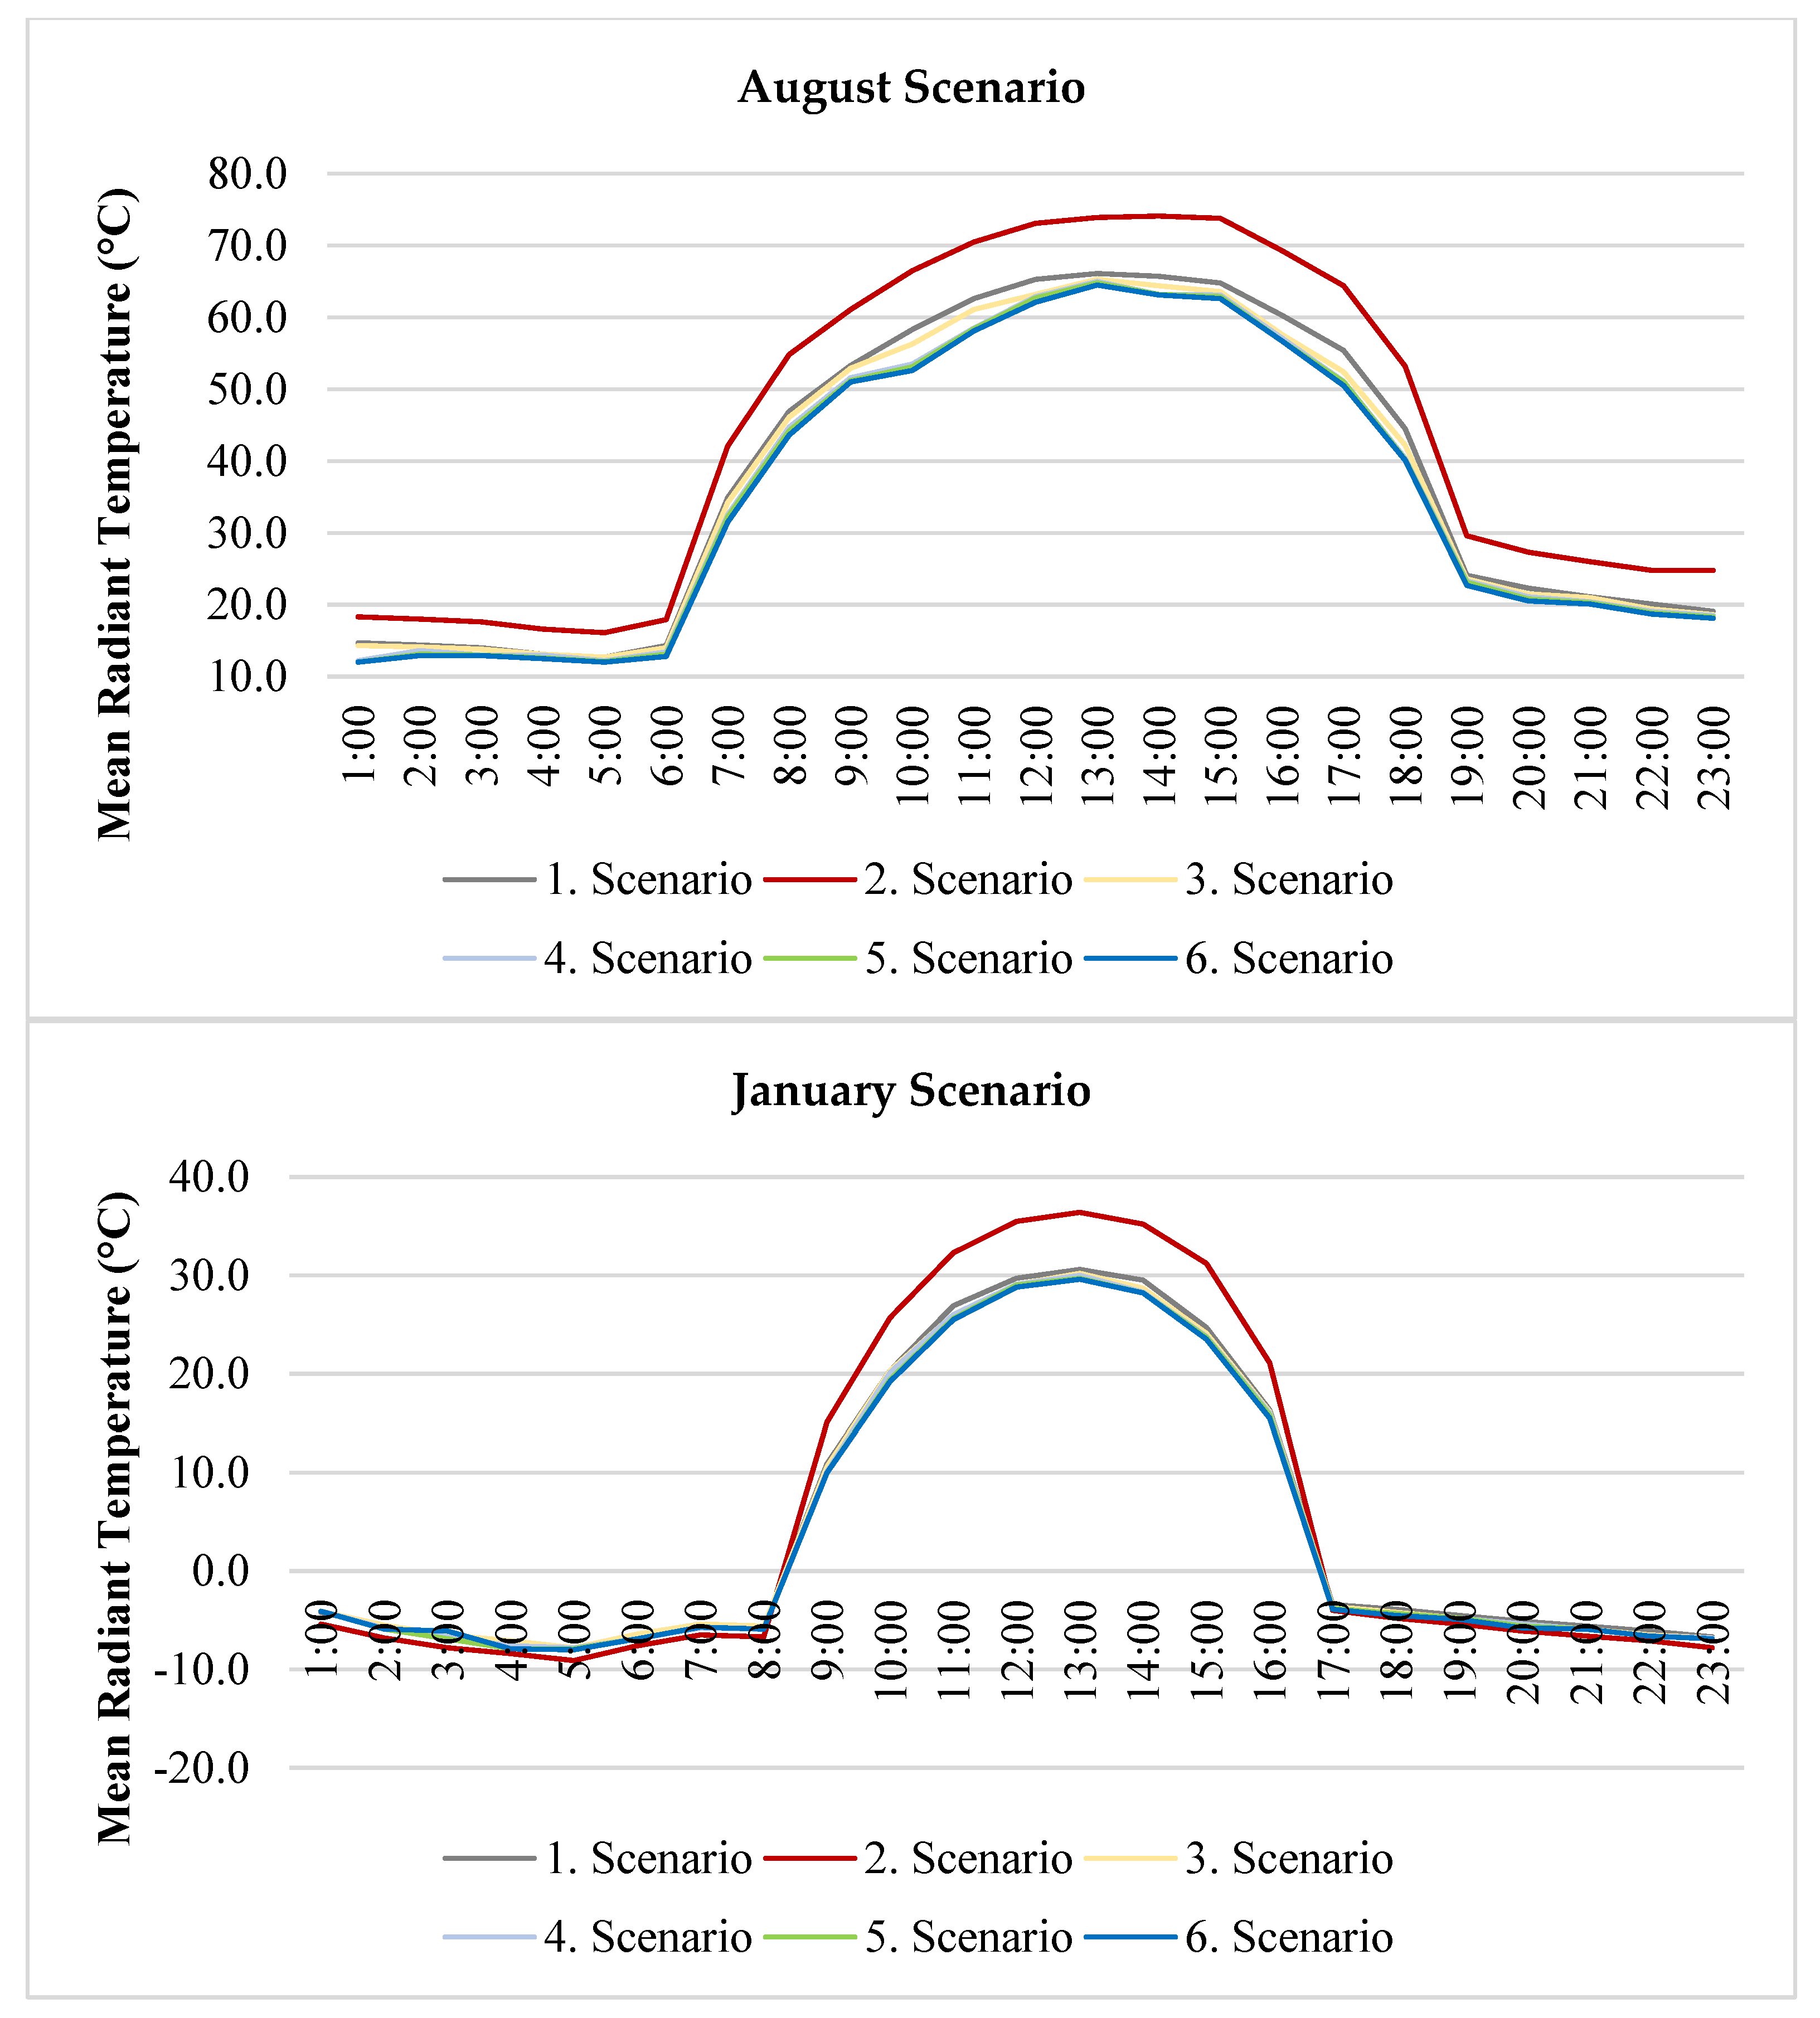
4.4. Mean Radiant Temperature (Tmrt)
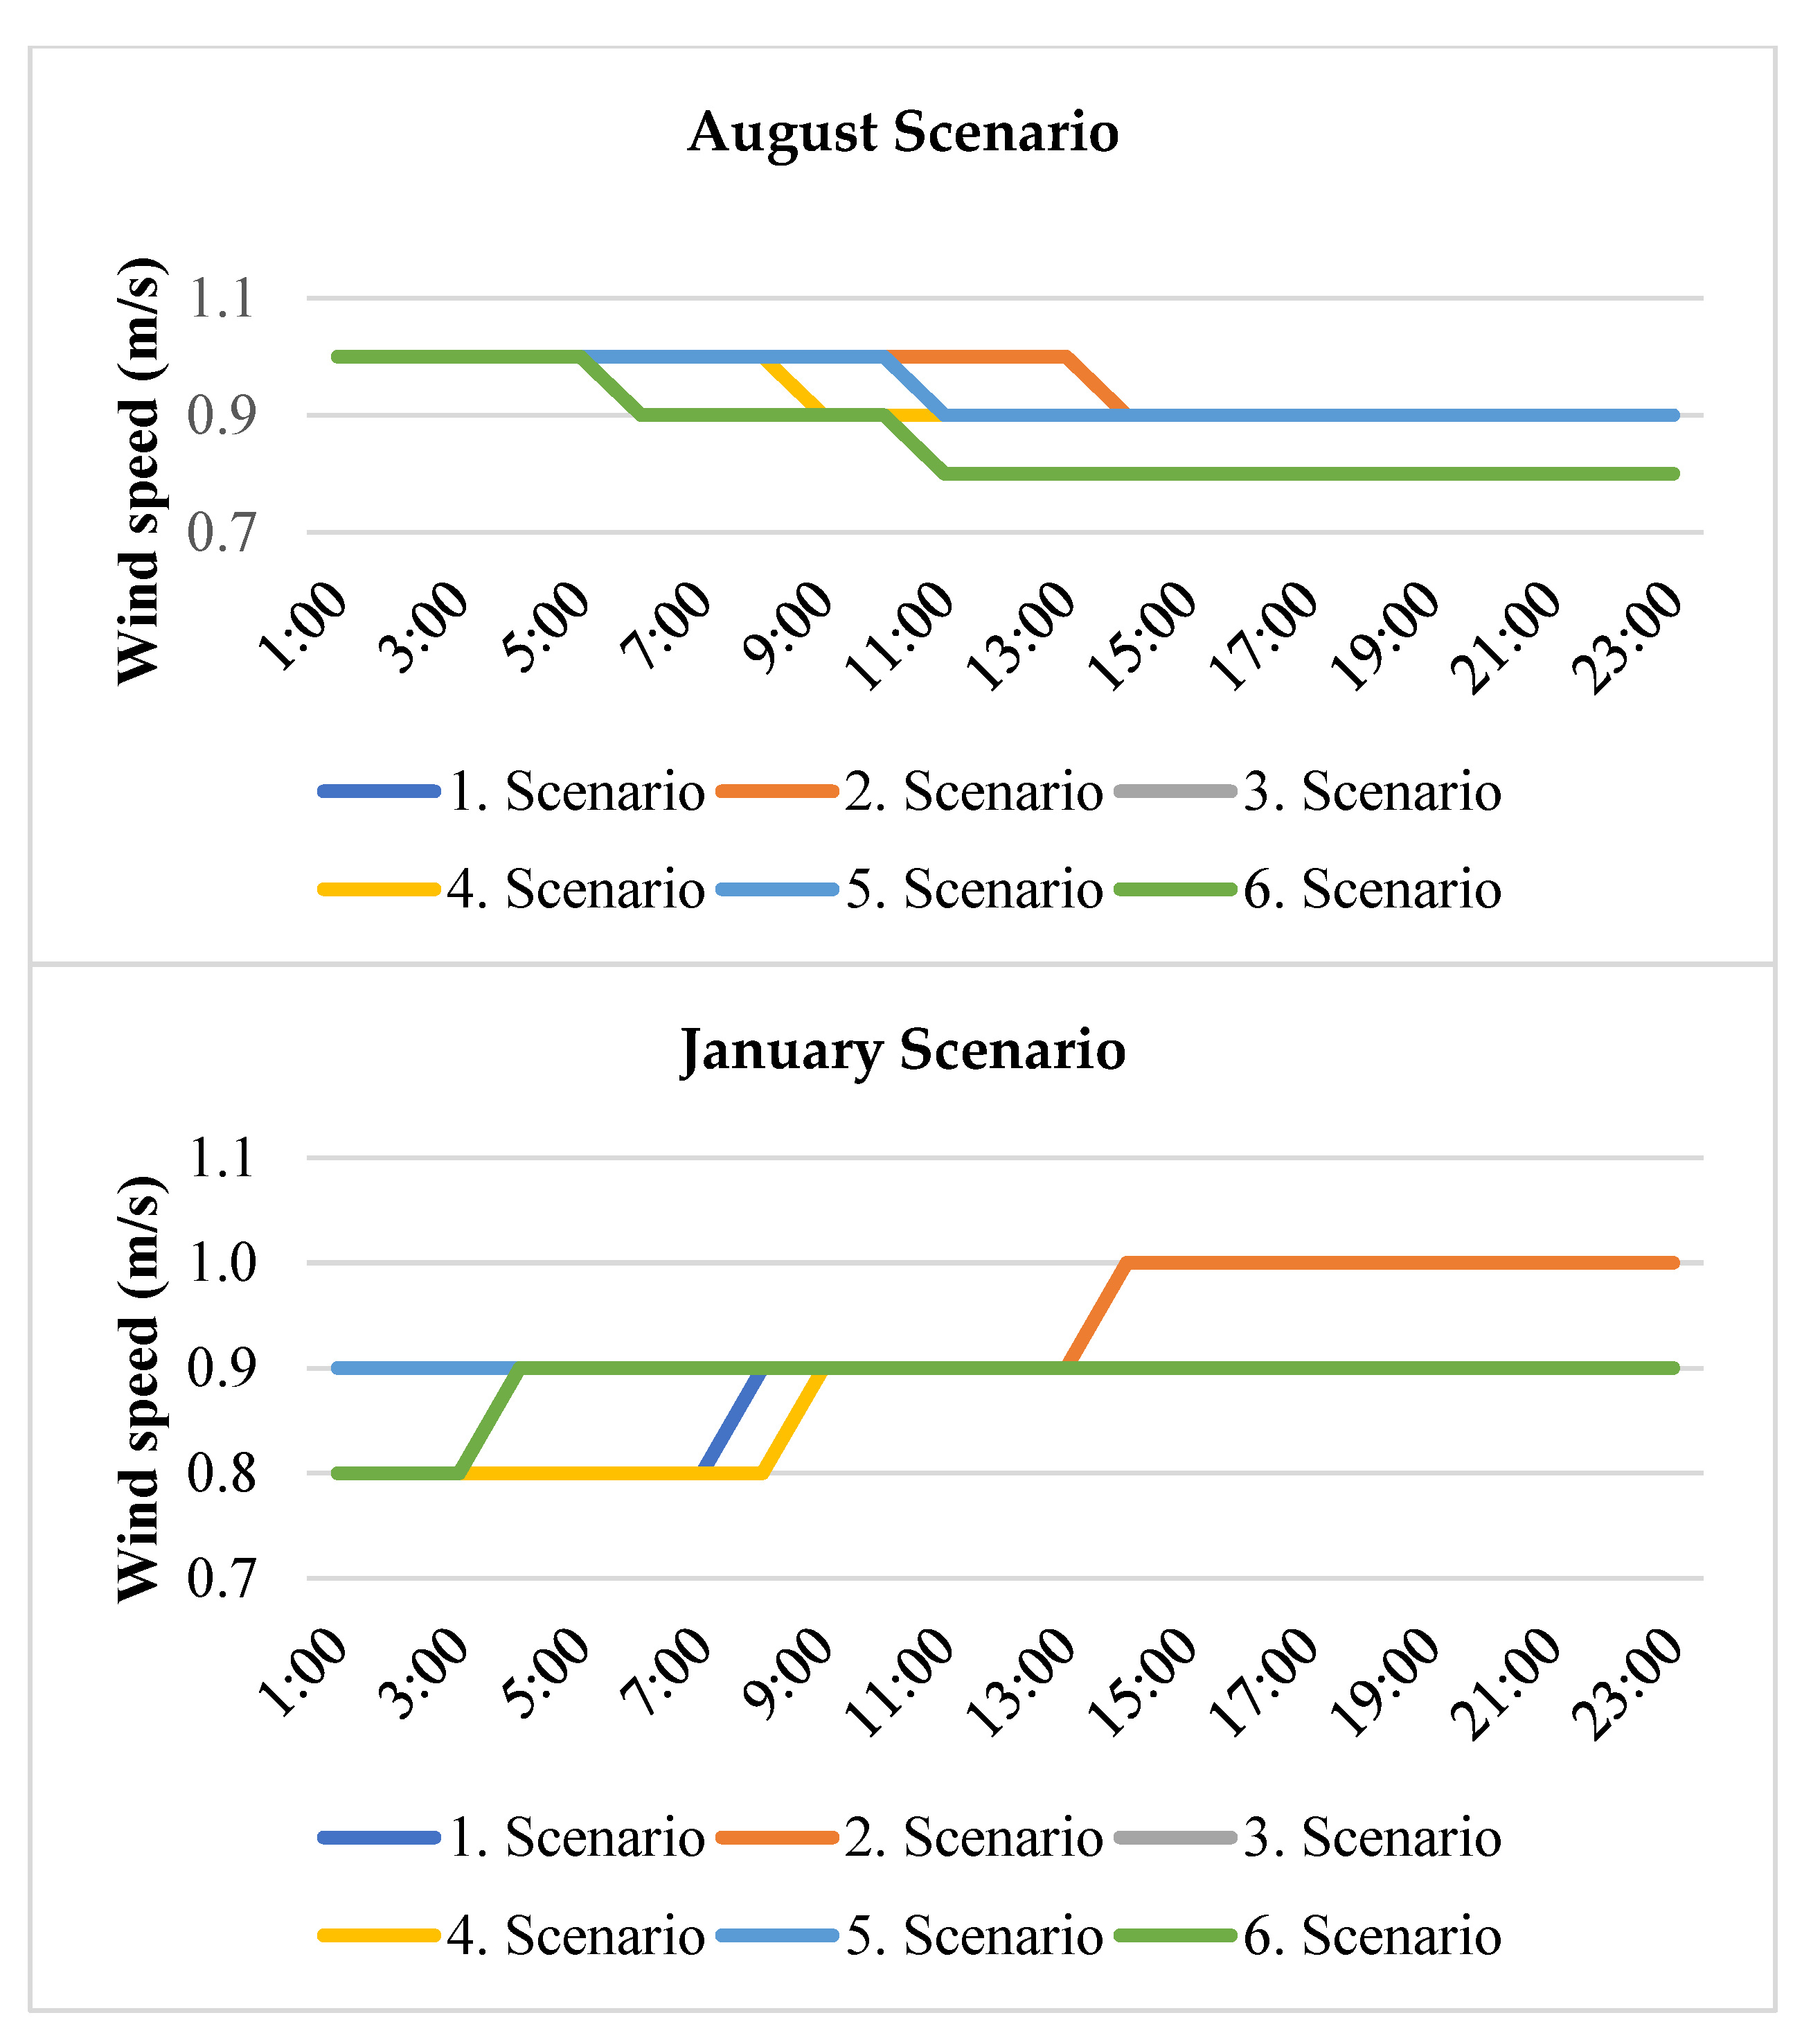
4.5. Wind Speed
4.6. Physiologically Equivalent Temperature (PET)
5. Conclusions
Author Contributions
Funding
Data Availability Statement
Conflicts of Interest
Correction Statement
References
- Wilson, W.G. Constructed Climates: A Primer on Urban Environments; The University of Chicago Press: Chicago, IL, USA; London, UK, 2011. [Google Scholar]
- United Nations. World Urbanization Prospects 2018—Highlights Department of Economic and Social Affairs; Population Division: New York, NY, USA, 2019. [Google Scholar]
- Oke, T.R.; Mills, G.; Christen, A.; Voogt, J.A. Urban Climates; Cambridge University Press: Cambridge, UK, 2017. [Google Scholar]
- Emmanuel, R. An Urban Approach to Climate Sensitive Design: Strategies for the Tropics; Taylor & Francis: Abingdon-on-Thames, UK, 2012. [Google Scholar]
- IPCC. 2022. Available online: https://www.ipcc.ch/reports/ (accessed on 10 January 2025).
- Enteria, N.; Cuartero-Enteria, O.; Santamouris, M.; Eicker, U. Morphology of buildings and cities in hot and humid regions. In Urban Heat Island (UHI) Mitigation: Hot and Humid Regions; Springer: Singapore, 2021; pp. 1–13. [Google Scholar]
- Saaroni, H.; Amorim, J.H.; Hiemstra, J.A.; Pearlmutter, D. Urban Green Infrastructure as a tool for urban heat mitigation: Survey of research methodologies and findings across different climatic regions. Urban Clim. 2018, 24, 94–110. [Google Scholar] [CrossRef]
- Toy, S.; Yilmaz, S. Evaluation of urban-rural bioclimatic comfort differences over a ten-year period in the sample of Erzincan city reconstructed after a heavy earthquake. Atmósfera 2010, 23, 387–402. [Google Scholar]
- Rajagopalan, P. Urban heat island and mitigation in tropical India. In Urban Heat Island (UHI) Mitigation: Hot and Humid Regions; Springer: Singapore, 2021; pp. 183–203. [Google Scholar]
- Norouzi, M.; Chau, H.W.; Jamei, E. Design and Site-Related Factors Impacting the Cooling Performance of Urban Parks in Different Climate Zones: A Systematic Review. Land 2024, 13, 2175. [Google Scholar] [CrossRef]
- Gartland, L. Heat Islands: Understanding and Mitigating Heat in Urban Areas; Routledge: London, UK, 2008. [Google Scholar]
- Jamei, E.; Seyedmahmoudian, M.; Horan, B.; Stojcevski, A. Verification of a bioclimatic modeling system in a growing suburb in Melbourne. Sci. Total Environ. 2019, 689, 883–898. [Google Scholar] [CrossRef]
- Okumuş, D.E.; Terzi, F. Evaluating the role of urban fabric on surface urban heat island: The case of Istanbul. Sustain. Cities Soc. 2021, 73, 103128. [Google Scholar] [CrossRef]
- Korobeinikova, A.; Danilina, N.; Teplova, I. Planning Public Space Climate Comfortability: A GIS-Based Algorithm for the Compact Cities of the Far North. Land 2024, 13, 1763. [Google Scholar] [CrossRef]
- Santamouris, M.; Ding, L.; Fiorito, F.; Oldfield, P.; Osmond, P.; Paolini, R.; Prasad, D.; Synnefa, A. Passive and active cooling for the outdoor built environment–Analysis and assessment of the cooling potential of mitigation technologies using performance data from 220 large scale projects. Sol. Energy 2017, 154, 14–33. [Google Scholar] [CrossRef]
- Fallmann, J.; Emeis, S.; Wagner, S.; Ketterer, C.; Matzarakis, A.; Krüzselyi, I.; Zsebeházi, G.; Kovács, M.; Halenka, T.; Huszár, P.; et al. Forecasting models for urban warming in climate change. In Counteracting Urban Heat Island Effects in a Global Climate Change Scenario; Musco, F., Ed.; Springer International Publishing: Cham, Switzerland, 2016; pp. 3–39. [Google Scholar]
- Sasaki, K.; Mochida, A.; Yoshino, H.; Watanabe, H.; Yoshida, T. A new method to select appropriate countermeasures against heat-island effects according to the regional characteristics of heat balance mechanism. J. Wind. Eng. Ind. Aerodyn. 2008, 96, 1629–1639. [Google Scholar] [CrossRef]
- Santamouris, M. Urban warming and mitigation: Actual status, impacts and challenges. In Urban Climate Mitigation Techniques; Routledge: London, UK, 2016; pp. 1–25. [Google Scholar]
- Akbari, H.; Cartalis, C.; Kolokotsa, D.; Muscio, A.; Pisello, A.L.; Rossi, F.; Santamouris, M.; Synnefa, A.; Wong, N.H.; Zinzi, M. Local climate change and urban heat island mitigation techniques–the state of the art. J. Civ. Eng. Manag. 2016, 22, 1111934. [Google Scholar] [CrossRef]
- Dursun, D.; Yavaş, M.; Yilmaz, S. Microclimate Assessment of Design Proposals for Public Space in Cold Climate Zone: Case of Yakutiye Square. Megaron 2020, 15, 321–331. [Google Scholar]
- Mohammad, P.; Aghlmand, S.; Fadaei, A.; Gachkar, S.; Gachkar, D.; Karimi, A. Evaluating the role of the albedo of material and vegetation scenarios along the urban street canyon for improving pedestrian thermal comfort outdoors. Urban Clim. 2021, 40, 100993. [Google Scholar] [CrossRef]
- Menteş, Y.; Yilmaz, S.; Qaid, A.; Yilmaz, H. Assessment of the impact of the different settlement patterns on the summer land surface temperature: Elazığ. Environ. Sci. Pollut. Res. 2023, 30, 30793–30818. [Google Scholar] [CrossRef]
- Mohammad, P.; Goswami, A.; Chauhan, S.; Nayak, S. Machine learning algorithm based prediction of land use land cover and land surface temperature changes to characterize the surface urban heat island phenomena over Ahmedabad city, India. Urban Clim. 2022, 42, 101116. [Google Scholar] [CrossRef]
- Liu, H.; Huang, B.; Cheng, X.; Yin, M.; Shang, C.; Luo, Y.; He, B.J. Sensing-based park cooling performance observation and assessment: A review. Build. Environ. 2023, 245, 110915. [Google Scholar] [CrossRef]
- Georgatou, C.; Kolokotsa, D. Urban climate models. In Urban Climate Mitigation Techniques; Santamouris, M., Kolokotsa, D., Eds.; Taylor & Francis Group: London, UK, 2016; pp. 175–194. [Google Scholar]
- Irmak, M.A.; Yilmaz, S.; Yilmaz, H.; Ozer, S.; Toy, S. Evaluation of different thermal conditions based on thi under different kind of tree types-as a specific case in ata botanic garden in eastern Turkey. Glob. Nest J. 2013, 15, 131–139. [Google Scholar]
- Yilmaz, S.; Sezen, I.; Sari, E.N. The relationships between ecological urbanization, green areas, and air pollution in Erzurum/Turkey. Environ. Ecol. Stat. 2021, 28, 733–759. [Google Scholar] [CrossRef]
- Yang, J.; Zhao, Y.; Zou, Y.; Xia, D.; Lou, S.; Liu, W.; Ji, K. Effects of tree species and layout on the outdoor thermal environment of squares in hot-humid areas of China. Buildings 2022, 12, 1867. [Google Scholar] [CrossRef]
- Spangenberg, J.; Shinzato, P.; Johansson, E.; Duarte, D. Simulation of the influence of vegetation on microclimate and thermal comfort in the city of São Paulo. Rev. Soc. Bras. Arborização Urbana 2008, 3, 1–19. [Google Scholar] [CrossRef]
- Cortes, A.; Rejuso, A.J.; Santos, J.A.; Blanco, A. Evaluating mitigation strategies for urban heat island in Mandaue City using ENVI-met. J. Urban Manag. 2022, 11, 97–106. [Google Scholar] [CrossRef]
- Koç, A.; Yılmaz, S. Landscape character analysis and assessment at the lower basin-scale. Appl. Geogr. 2020, 125, 102359. [Google Scholar] [CrossRef]
- Ramdiana, D.N.; Yola, L. The Effect of Vegetation and Water Body on Thermal Comfort in Banteng City Park, Jakarta. Plan. Malays. 2023, 21, 262–273. [Google Scholar] [CrossRef]
- Taleghani, M.; Kleerekoper, L.; Tenpierik, M.; Van Den Dobbelsteen, A. Outdoor thermal comfort within five different urban forms in the Netherlands. Build. Environ. 2015, 83, 65–78. [Google Scholar] [CrossRef]
- Morakinyo, T.E.; Lai, A.; Lau, K.K.L.; Ng, E. Thermal benefits of vertical greening in a high-density city: Case study of Hong Kong. Urban For. Urban Green. 2019, 37, 42–55. [Google Scholar] [CrossRef]
- Bozdogan Sert, E.; Kaya, E.; Adiguzel, F.; Cetin, M.; Gungor, S.; Zeren Cetin, I.; Dinc, Y. Effect of the surface temperature of surface materials on thermal comfort: A case study of Iskenderun (Hatay, Turkey). Theor. Appl. Climatol. 2021, 144, 103–113. [Google Scholar] [CrossRef]
- Jamei, E.; Thirunavukkarasu, G.; Chau, H.W.; Seyedmahmoudian, M.; Stojcevski, A.; Mekhilef, S. Investigating the cooling effect of a green roof in Melbourne. Build. Environ. 2023, 246, 110965. [Google Scholar] [CrossRef]
- Sodoudi, S.; Zhang, H.; Chi, X.; Müller, F.; Li, H. The influence of spatial configuration of green areas on microclimate and thermal comfort. Urban For. Urban Green. 2018, 34, 85–96. [Google Scholar] [CrossRef]
- Kim, J.; Lee, S.Y.; Kang, J. Temperature Reduction Effects of Rooftop Garden Arrangements: A Case Study of Seoul National University. Sustainability 2020, 12, 6032. [Google Scholar] [CrossRef]
- Kyriakodis, G.E.; Santamouris, M. Using reflective pavements to mitigate urban heat island in warm climates-results from a large scale urban mitigation project. Urban Clim. 2018, 24, 326–339. [Google Scholar] [CrossRef]
- Tan, X.; Sun, X.; Huang, C.; Yuan, Y.; Hou, D. Comparison of cooling effect between green space and water body. Sustain. Cities Soc. 2021, 67, 102711. [Google Scholar] [CrossRef]
- Bousse, Y.S. Mitigating the Urban Heat Island Effect with an Intensive Green Roof During Summer in Reading. Ph.D. Dissertation, Reading University, Reading, UK, 2009. [Google Scholar]
- Cipolla, S.S.; Maglionico, M.; Semprini, G.; Villani, V.; Bonoli, A. Green roofs as a strategy for urban heat island mitigation in Bologna (Italy). Acta Hortic. 2018, 1215, 295–300. [Google Scholar] [CrossRef]
- Alves, F.M.; Gonçalves, A.; del Caz-Enjuto, M.R. The Use of Envi-Met for the Assessment of Nature-Based Solutions’ Potential Benefits in Industrial Parks—A Case Study of Argales Industrial Park (Valladolid, Spain). Infrastructures 2022, 7, 85. [Google Scholar] [CrossRef]
- Menteş, Y.; Yilmaz, S.; Qaid, A. The cooling effect of different scales of urban parks on land surface temperatures in cold regions. Energy Build. 2024, 308, 113954. [Google Scholar] [CrossRef]
- Wu, C.; Li, J.; Wang, C.; Song, C.; Chen, Y.; Finka, M.; La Rosa, D. Understanding the relationship between urban blue infrastructure and land surface temperature. Sci. Total Environ. 2019, 694, 133742. [Google Scholar] [CrossRef] [PubMed]
- Gupta, A.; De, B.; Shukla, A.K.; Pignatta, G. Vulnerability Assessment of a Highly Populated Megacity to Ambient Thermal Stress. Sustainability 2024, 16, 3395. [Google Scholar] [CrossRef]
- Fahed, J.; Kinab, E.; Ginestet, S.; Adolphe, L. Impact of urban heat island mitigation measures on microclimate and pedestrian comfort in a dense urban district of Lebanon. Sustain. Cities Soc. 2020, 61, 102375. [Google Scholar] [CrossRef]
- Köppen, W.; Geiger, R. Klima der Erde (Climate of the Earth); Wall Map 1:16 Mill; Klett-Perthes: Gotha, Germany, 1954. [Google Scholar]
- Bruse, M. ENVI-met 5.6.1: A Microscale Urban Climate Model. 2024. Available online: http://www.envi-met.info. https://www.envi-met.com/wp-content/uploads/2021/08/ENVI-met-brochure.pdf (accessed on 13 April 2025).
- Koutsanitis, S.; Sinou, M.; Kanetaki, Z.; Tousi, E.; Varelidis, G. Thermal Performance Investigation in Historical Urban Neighborhoods Using ENVI-Met Simulation Software. Land 2025, 14, 284. [Google Scholar] [CrossRef]
- Lin, C.; Yang, J.; Huang, J.; Zhong, R. Examining the Effects of Tree Canopy Coverage on Human Thermal Comfort and Heat Dynamics in Courtyards: A Case Study in Hot-Humid Regions. Atmosphere 2023, 14, 1389. [Google Scholar] [CrossRef]
- Yilmaz, S.; Mutlu, B.E.; Aksu, A.; Mutlu, E.; Qaid, A. Street design scenarios using vegetation for sustainable thermal comfort in Erzurum, Turkey. Environ. Sci. Pollut. Res. 2021, 28, 3672–3693. [Google Scholar] [CrossRef]
- Luo, X.; Zhao, Y.; Li, Y.; Yang, J.; Guo, T. Effects of tree species and planting forms on the thermal comfort of campsites in hot and humid areas of China. Int. J. Biometeorol. 2024, 68, 1437–1449. [Google Scholar] [CrossRef]
- Eingrüber, N.; Korres, W.; Löhnert, U.; Schneider, K. Investigation of the ENVI-met model sensitivity to different wind direction forcing data in a heterogeneous urban environment. Adv. Sci. Res. 2023, 20, 65–71. [Google Scholar] [CrossRef]
- Bruse, M.; Fleer, H. Simulating surface–plant–air interactions inside urban environments with a three dimensional numerical model. Environ. Model. Softw. 1998, 13, 373–384. [Google Scholar] [CrossRef]
- Tsoka, S.; Tsikaloudaki, A.; Theodosiou, T. Analyzing the ENVI-met microclimate model’s performance and assessing cool materials and urban vegetation applications—A review. Sustain. Cities Soc. 2018, 43, 55–76. [Google Scholar] [CrossRef]
- Yilmaz, S.; Mutlu, E.; Yilmaz, H. Alternative scenarios for ecological urbanizations using ENVI-met model. Environ. Sci. Pollut. Res. 2018, 25, 26307–26321. [Google Scholar] [CrossRef] [PubMed]
- Guo, T.; Zhao, Y.; Yang, J.; Zhong, Z.; Ji, K.; Zhong, Z.; Luo, X. Effects of Tree Arrangement and Leaf Area Index on the Thermal Comfort of Outdoor Children’s Activity Space in Hot-Humid Areas. Buildings 2023, 13, 214. [Google Scholar] [CrossRef]
- Chen, H.; Liu, R.; Zhang, Y. The Impact of Vegetation Canopy on the Outdoor Thermal Environment in Cold Winter and Spring. Sustainability 2023, 15, 12818. [Google Scholar] [CrossRef]
- Zhang, Y.; Lin, Z.; Fang, Z.; Zheng, Z. An improved algorithm of thermal index models based on ENVI-met. Urban Clim. 2022, 44, 101190. [Google Scholar] [CrossRef]
- Liu, Z.; Cheng, W.; Jim, C.Y.; Morakinyo, T.E.; Shi, Y.; Ng, E. Heat mitigation benefits of urban green and blue infrastructures: A systematic review of modeling techniques, validation and scenario simulation in ENVI-met V4. Build. Environ. 2021, 200, 107939. [Google Scholar] [CrossRef]
- Matzarakis, A.; Mayer, H.; Iziomon, M.G. Applications of a universal thermal index: Physiological equivalent temperature. Int. J. Biometeorol. 1999, 43, 76–84. [Google Scholar] [CrossRef] [PubMed]
- Feng, L.; Shuai, L.; Zhou, Y.; Zhang, X.; Sun, J. Improving the green space arrangement in residential areas from the perspective of tree leaf temperature utilizing scenario simulation in ENVI-met. Sci. Total Environ. 2024, 918, 170650. [Google Scholar] [CrossRef]
- Chatzidimitriou, A.; Yannas, S. Street canyon design and improvement potential for urban open spaces; the influence of canyon aspect ratio and orientation on microclimate and outdoor comfort. Sustain. Cities Soc. 2017, 33, 85–101. [Google Scholar] [CrossRef]
- Yilmaz, S.; Kurt, A.; Gölcü, M. ENVI-met Simulations of the Effect of Different Landscape Design Scenarios on Pedestrian Thermal Comfort: Haydar Aliyev Street. Yuz. Yıl Univ. J. Agric. Sci. 2023, 33, 338–353. [Google Scholar] [CrossRef]
- Berardi, U.; Jandaghian, Z.; Graham, J. Effects of greenery enhancements for the resilience to heat waves: A comparison of analysis performed through mesoscale (WRF) and microscale (Envi-met) modeling. Sci. Total Environ. 2020, 747, 141300. [Google Scholar] [CrossRef]
- Lai, D.; Liu, Y.; Liao, M.; Yu, B. Effects of different tree layouts on outdoor thermal comfort of green space in summer Shanghai. Urban Clim. 2023, 47, 101398. [Google Scholar] [CrossRef]
- Zölch, T.; Rahman, M.A.; Pfleiderer, E.; Wagner, G.; Pauleit, S. Designing public squares with green infrastructure to optimize human thermal comfort. Build. Environ. 2019, 149, 640–654. [Google Scholar] [CrossRef]
- Xu, X.; Liu, S.; Sun, S.; Zhang, W.; Liu, Y.; Lao, Z.; Guo, G.; Smith, K.; Cui, Y.; Liu, W.; et al. Evaluation of energy saving potential of an urban green space and its water bodies. Energy Build. 2019, 188, 58–70. [Google Scholar] [CrossRef]
- Li, M.; Wang, C.; Wu, Y.; Santamouris, M.; Lu, S. Assessing spatial inequities of thermal environment and blue-green intervention for vulnerable populations in dense urban areas. Urban Clim. 2025, 59, 102328. [Google Scholar] [CrossRef]
- Xue, X.; He, T.; Xu, L.; Tong, C.; Ye, Y.; Liu, H.; Xu, D.; Zheng, X. Quantifying the spatial pattern of urban heat islands and the associated cooling effect of blue–green landscapes using multisource remote sensing data. Sci. Total Environ. 2022, 843, 156829. [Google Scholar] [CrossRef]
- Yang, G.; Yu, Z.; Jørgensen, G.; Vejre, H. How can urban blue-green space be planned for climate adaption in high-latitude cities? A seasonal perspective. Sustain. Cities Soc. 2020, 53, 101932. [Google Scholar] [CrossRef]
- Yücekaya, M.; Aklibaşinda, M.; Günaydin, A.S. Suyun İklimsel Etkisinin ENVI-Met Simülasyonu ile Analizi. Online J. Art Des. 2022, 10, 301–313. [Google Scholar]
- Gatto, E.; Buccolieri, R.; Aarrevaara, E.; Ippolito, F.; Emmanuel, R.; Perronace, L.; Santiago, J.L. Impact of urban vegetation on outdoor thermal comfort: Comparison between a mediterranean city (Lecce, Italy) and a northern European city (Lahti, Finland). Forests 2020, 11, 228. [Google Scholar] [CrossRef]
- Tamaskani Esfehankalateh, A.; Ngarambe, J.; Yun, G.Y. Influence of tree canopy coverage and leaf area density on urban heat island mitigation. Sustainability 2021, 13, 7496. [Google Scholar] [CrossRef]
- Ibraheem, B.A.; Abaas, Z.R. Evaluating Urban Thermal Comfort through a Holistic Micro-Climate Model: Baghdad as a Case Study. J. Al-Farabi Eng. Sci. 2023, 2, 12. [Google Scholar]
- Crank, P.J.; Middel, A.; Wagner, M.; Hoots, D.; Smith, M.; Brazel, A. Validation of seasonal mean radiant temperature simulations in hot arid urban climates. Sci. Total Environ. 2020, 749, 141392. [Google Scholar] [CrossRef]
- Yilmaz, S.; Menteş, Y.; Angin, S.N.; Qaid, A. Impact of the COVID-19 outbreak on urban air, Land surface temperature and air pollution in cold climate zones. Environ. Res. 2023, 237, 116887. [Google Scholar] [CrossRef]
- Rahimi, A.; Nobar, Z. Investigating the role of cover plants (grass) in improving the physiological equivalent temperature and relative humidity (study area: Tabriz University Stadium). J. Agric. Sci. Sustain. Prod. 2024, 34, 187–204. [Google Scholar]
- Song, B.G.; Park, K.H.; Jung, S.G. Validation of ENVI-met model with in situ measurements considering spatial characteristics of land use types. J. Korean Assoc. Geogr. Inf. Stud. 2014, 17, 156–172. [Google Scholar]
- Acero, J.A.; Arrizabalaga, J. Evaluating the performance of ENVI-met model in diurnal cycles for different meteorological conditions. Theor. Appl. Climatol. 2018, 131, 455–469. [Google Scholar] [CrossRef]
- Yu, Z.; Yang, G.; Zuo, S.; Jørgensen, G.; Koga, M.; Vejre, H. Critical review on the cooling effect of urban blue-green space: A threshold-size perspective. Urban For. Urban Green. 2020, 49, 126630. [Google Scholar] [CrossRef]
- Song, D.; Niu, S.; Chen, L.; Wang, A.; Shi, X.; Zhou, X.; Jin, X. Influence of historical city walls on the water cooling effects in summer. Urban Clim. 2025, 59, 102310. [Google Scholar] [CrossRef]


 : 29.1–41.0 °C < warm–very hot;
  :13.0–29.0 °C slightly cool–slightly warm;
  : 8.1–4.0 °C ≤ cool–very cold.
: 29.1–41.0 °C < warm–very hot; :13.0–29.0 °C slightly cool–slightly warm; : 8.1–4.0 °C ≤ cool–very cold.
: 8.1–4.0 °C ≤ cool–very cold.
: 29.1–41.0 °C < warm–very hot; :13.0–29.0 °C slightly cool–slightly warm; : 8.1–4.0 °C ≤ cool–very cold.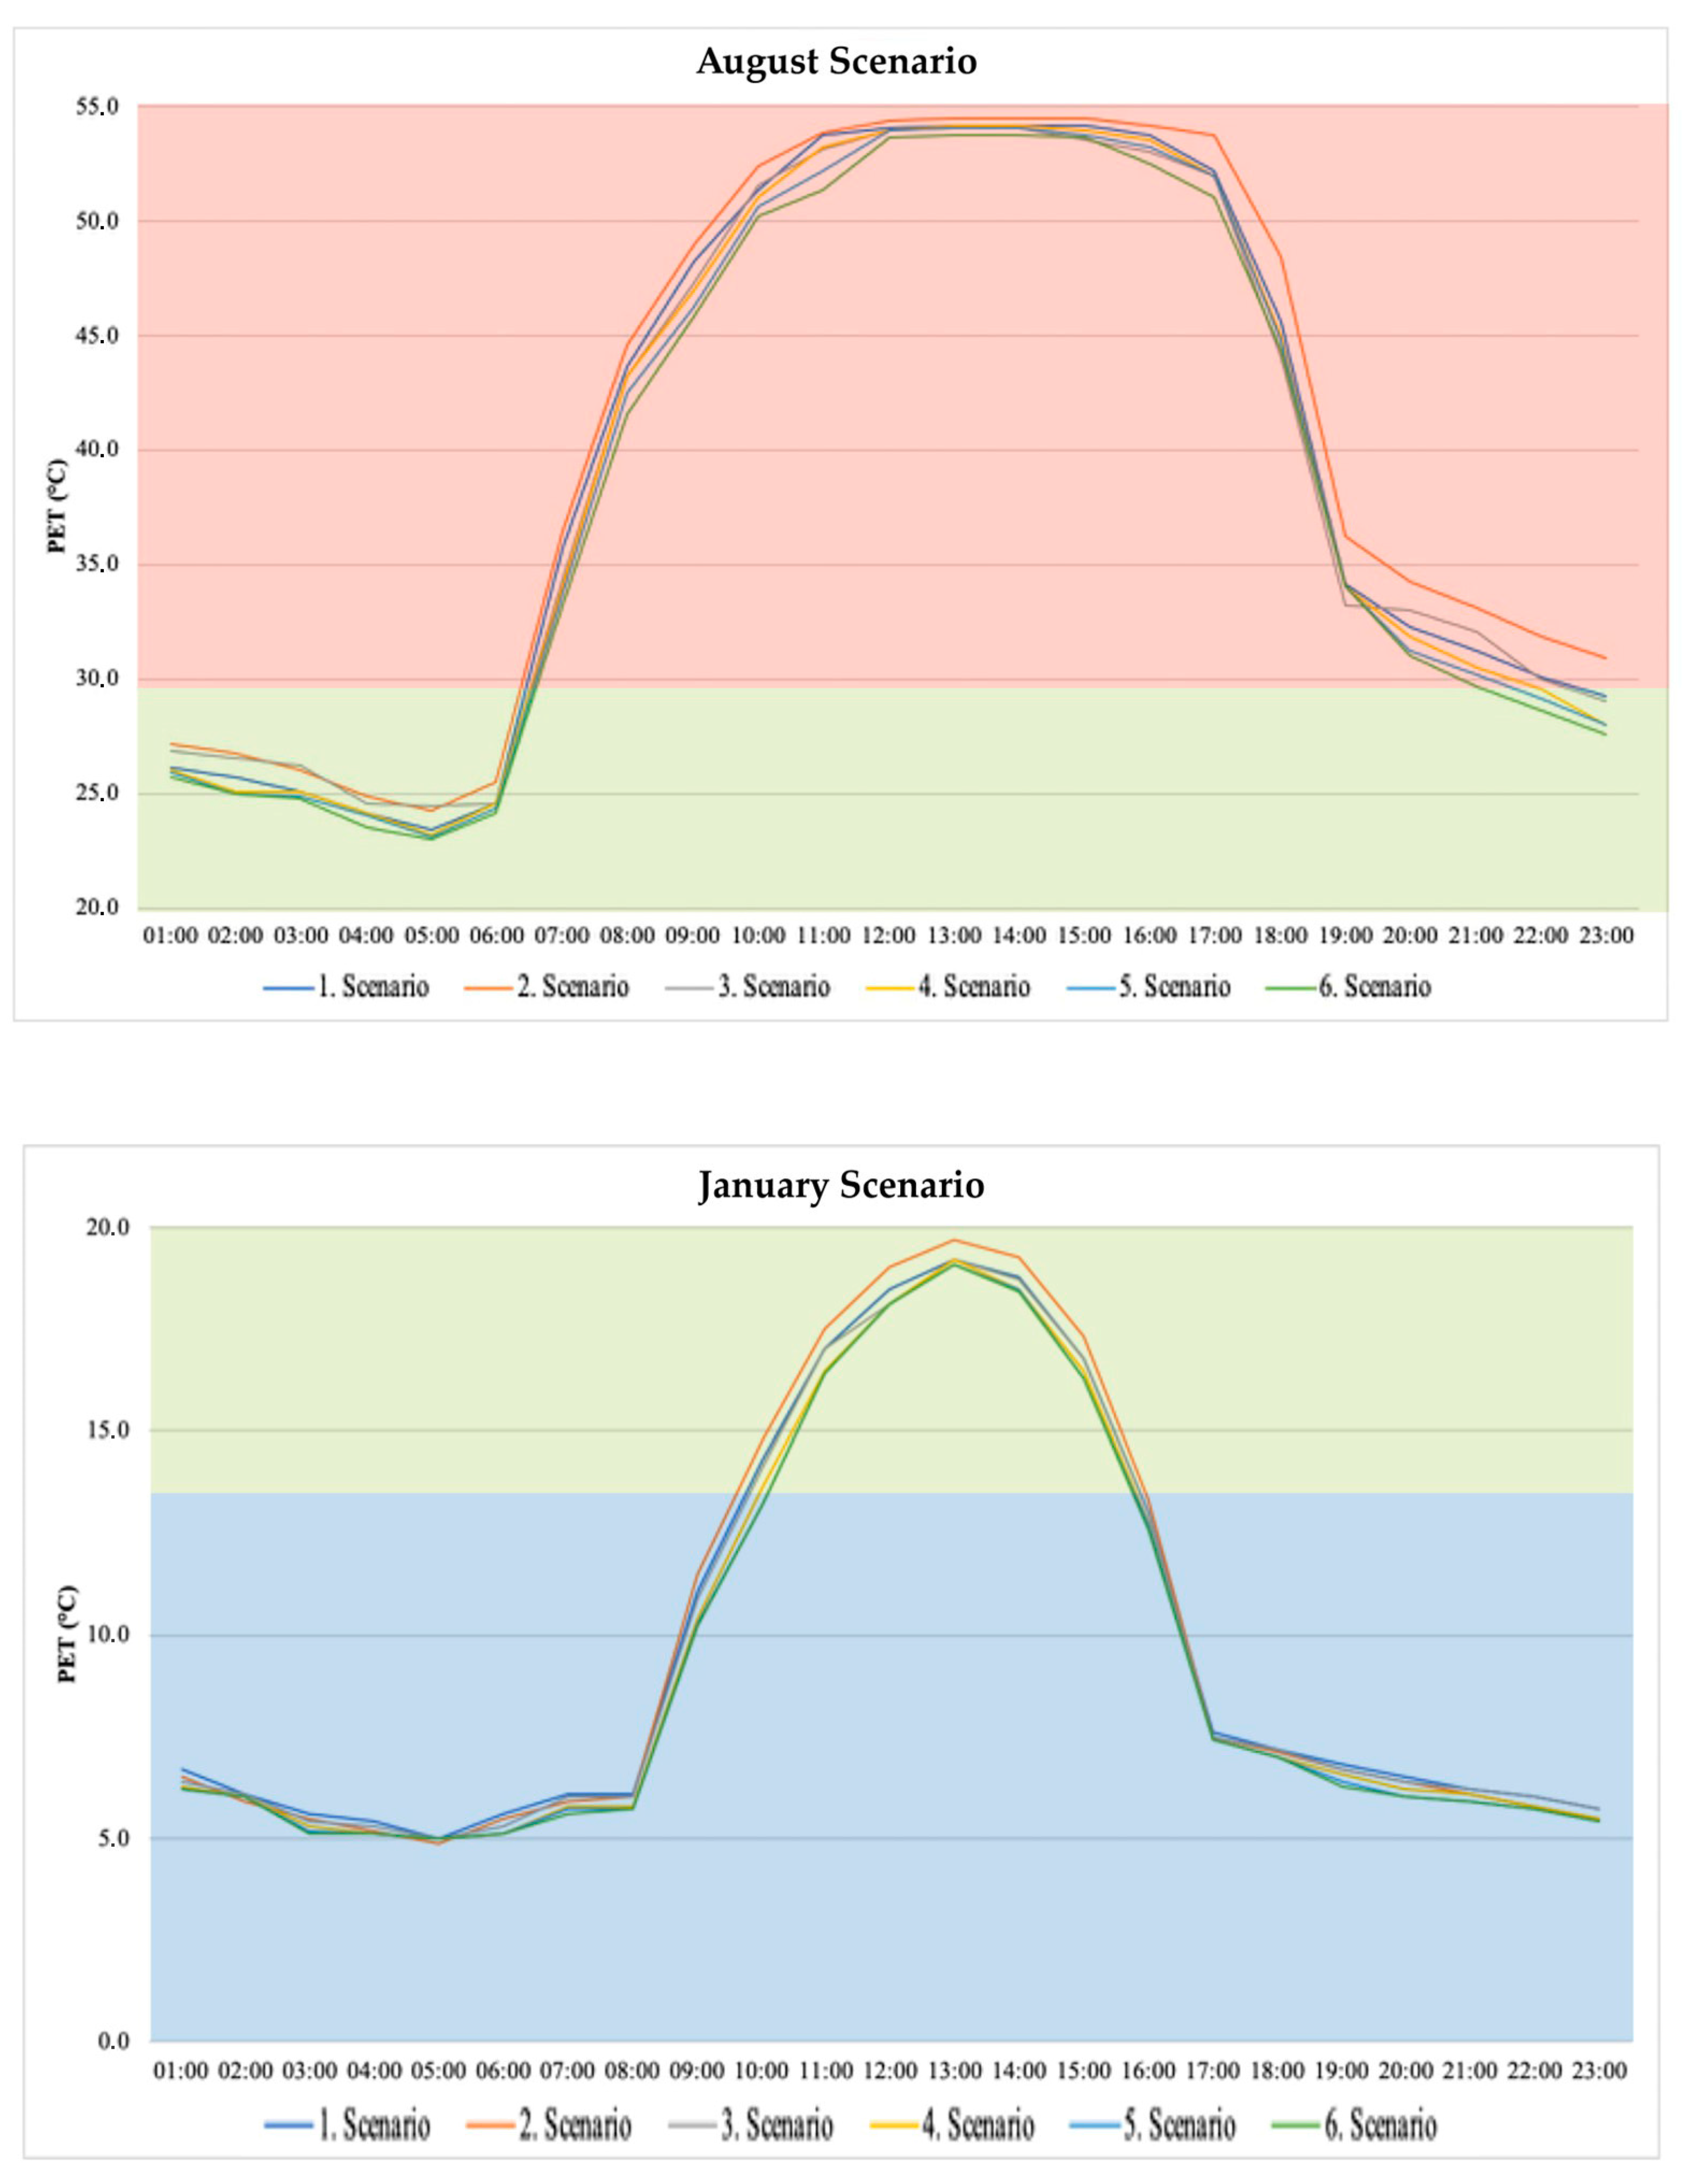

| 11 August (Summer) | 8 January (Winter) | |||||
|---|---|---|---|---|---|---|
| Time | Air-T (°C) | Relative-H(%) | Wind-S (m/s) | Air-T (°C) | Relative-H(%) | Wind-S (m/s) |
| 00:00 | 30.1 | 22.4 | 1.0 | 0.1 | 77.9 | 1.5 |
| 01:00 | 29.5 | 23.4 | 0.8 | −0.2 | 78.2 | 1.7 |
| 02:00 | 29.0 | 23.9 | 1.1 | −0.5 | 78.5 | 1.6 |
| 03:00 | 28.1 | 25.6 | 1.2 | −1.0 | 80.3 | 1.8 |
| 04:00 | 26.3 | 28.2 | 1.4 | −1.2 | 81.7 | 2.1 |
| 05:00 | 25.3 | 31.7 | 1.8 | −1.7 | 83.0 | 2.4 |
| 06:00 | 26.9 | 35.3 | 1.3 | 0.7 | 76.5 | 2.0 |
| 07:00 | 28.6 | 32.8 | 1.0 | 1.6 | 77.6 | 1.8 |
| 08:00 | 32.7 | 27.5 | 0.8 | 1.9 | 77.9 | 1.7 |
| 09:00 | 34.1 | 24.1 | 1.2 | 3.1 | 73.3 | 1.9 |
| 10:00 | 35.9 | 22.5 | 0.8 | 4.3 | 68.7 | 1.6 |
| 11:00 | 38.5 | 18.7 | 1.4 | 5.8 | 61.2 | 1.5 |
| 12:00 | 40.1 | 15.6 | 2.1 | 6.3 | 55.3 | 1.5 |
| 13:00 | 41.2 | 10.5 | 2.2 | 7.2 | 51.9 | 1.4 |
| 14:00 | 40.5 | 9.5 | 1.5 | 7.5 | 50.6 | 1.3 |
| 15:00 | 39.8 | 12.3 | 1.2 | 6.9 | 53.3 | 1.6 |
| 16:00 | 39.1 | 8.7 | 0.9 | 5.3 | 56.8 | 1.7 |
| 17:00 | 38.3 | 14.3 | 1.3 | 4.0 | 59.5 | 1.8 |
| 18:00 | 37.5 | 16.6 | 1.2 | 3.5 | 64.7 | 1.5 |
| 19:00 | 36.1 | 17.2 | 1.3 | 2.8 | 68.2 | 1.4 |
| 20:00 | 34.2 | 17.9 | 1.0 | 2.2 | 70.1 | 1.9 |
| 21:00 | 33.2 | 18.5 | 1.2 | 1.6 | 73.5 | 2.0 |
| 22:00 | 31.7 | 20.8 | 1.3 | 1.1 | 75.4 | 2.1 |
| 23:00 | 30.8 | 21.3 | 0.8 | 0.5 | 76.7 | 2.0 |
| ENVI-met Views | SketchUp Views | ||
|---|---|---|---|
| Scenario 1 |  | existing conditions of the study area | 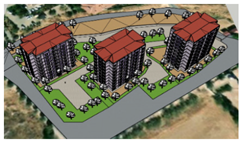 |
| Scenario 2 | 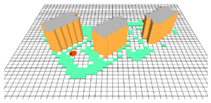 | the study area without vegetation |  |
| Scenario 3 | 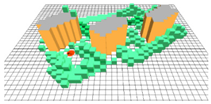 | +10% grass coverage | 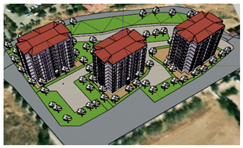 |
| Scenario 4 | 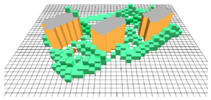 | +10% grass coverage +20% increase in tree density | 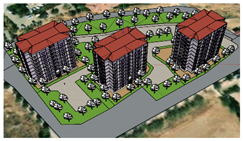 |
| Scenario 5 | 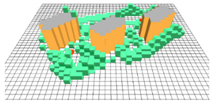 | +10% increase in grass coverage +20% increase in tree density +10% water bodies | 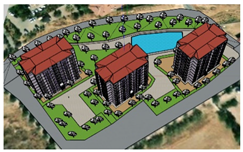 |
| Scenario 6 | 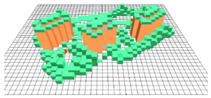 | +10% increase in grass coverage +20% increase in tree density +10% water bodies +extensive green rooftops | 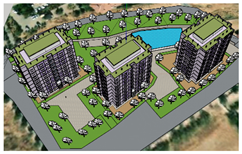 |
| Location | Hilalkent Neighborhood | |
|---|---|---|
| Climate type | Urban ecosystem | |
| Simulation time | August and January | |
| Total simulation time | 24 h for one alternative | |
| Field size (x, y, z) | 41 m × 39 m × 15 m | |
| Grid size (m) (x, y, z) | 5 × 4 × 3 | |
| Rotation (0° 360°) [0.0 N] | 0 | |
| Measurement time | 11.08.2023 | 08.01.2024 |
| Basic meteorological input | Unshaded | Unshaded |
| Average wind speed (m/s) | 1.2 | 1.7 |
| Wind direction (0:N.90:E.180:S.270:W) | 90 °C | 90 °C |
| 24 h average air temperature | 33.6 | 2.6 |
| 24 h average relative humidity | 20.8 | 69.6 |
| Minimum air temperature (°C)/h | 25.3 °C/05:00 | −1.7 °C/05:00 |
| Maximum air temperature (°C)/h | 41.2 °C/13:00 | 7.5 °C/14:00 |
| Minimum humidity (%)/h | 8.7%/16:00 | 50.6%/14:00 |
| Maximum humidity (%)/h | 35.3%/06:00 | 83.0%/05:00 |
| Sky visibility ratio | Open | Open |
| Summer | Winter | |||||||||||||
|---|---|---|---|---|---|---|---|---|---|---|---|---|---|---|
| Time | Air Temperature (°C) | Relative Humidity (%) | Wind Speed (m/s) | Air Temperature (°C) | Relative Humidity (%) | Wind Speed (m/s) | ||||||||
| Min | Max | Average | Min | Max | Average | Min | Max | Average | Min | Max | Average | |||
| 01:00 | 27.0 | 30.1 | 29.0 | 23.3 | 29.3 | 26.1 | 1.0 | 0.3 | 4.0 | 2.3 | 83.0 | 94.7 | 88.7 | 0.8 |
| 02:00 | 26.6 | 29.6 | 28.6 | 23.8 | 29.9 | 26.6 | 1.0 | 0.0 | 3.2 | 1.6 | 84.4 | 96.5 | 90.6 | 0.8 |
| 03:00 | 26.2 | 28.9 | 28.0 | 25.3 | 30.9 | 27.8 | 1.0 | −0.5 | 2.6 | 1.0 | 86.4 | 98.7 | 92.9 | 0.8 |
| 04:00 | 25.5 | 28.0 | 26.9 | 27.2 | 32.2 | 29.6 | 1.0 | −0.7 | 2.2 | 0.6 | 87.8 | 100.4 | 94.5 | 0.8 |
| 05:00 | 24.9 | 27.4 | 26.1 | 29.3 | 34.0 | 32.0 | 1.0 | −1.2 | 1.7 | 0.1 | 89.4 | 102.2 | 96.1 | 0.8 |
| 06:00 | 25.2 | 27.7 | 26.8 | 31.0 | 36.1 | 34.4 | 1.0 | 0.7 | 2.0 | 1.0 | 82.4 | 100.2 | 93.3 | 0.8 |
| 07:00 | 25.9 | 29.0 | 28.0 | 31.1 | 36.3 | 33.9 | 1.0 | 1.4 | 2.4 | 1.7 | 82.8 | 99.7 | 93.4 | 0.8 |
| 08:00 | 27.5 | 32.3 | 30.8 | 27.4 | 34.7 | 31.0 | 1.0 | 1.6 | 2.5 | 1.9 | 83.0 | 99.9 | 93.7 | 0.9 |
| 09:00 | 29.8 | 33.8 | 32.8 | 24.4 | 30.8 | 27.7 | 0.9 | 2.4 | 3.7 | 2.8 | 79.4 | 97.1 | 91.3 | 0.9 |
| 10:00 | 31.5 | 35.7 | 34.5 | 27.7 | 28.4 | 24.9 | 0.9 | 3.3 | 4.6 | 3.9 | 76.3 | 96.5 | 90.4 | 0.9 |
| 11:00 | 33.7 | 38.1 | 36.8 | 19.2 | 25.3 | 21.1 | 0.9 | 4.2 | 5.9 | 5.1 | 69.7 | 92.5 | 85.8 | 0.9 |
| 12:00 | 35.4 | 40.0 | 38.7 | 16.1 | 22.2 | 17.9 | 0.9 | 4.8 | 6.8 | 5.9 | 64.4 | 88.3 | 80.8 | 0.9 |
| 13:00 | 36.5 | 41.3 | 39.7 | 11.5 | 18.9 | 14.4 | 0.9 | 5.4 | 7.6 | 6.6 | 60.5 | 84.3 | 76.7 | 0.9 |
| 14:00 | 35.0 | 41.2 | 39.7 | 10.4 | 17.5 | 13.0 | 0.9 | 5.8 | 7.8 | 6.9 | 58.8 | 81.9 | 74.2 | 0.9 |
| 15:00 | 34.5 | 40.9 | 39.3 | 12.4 | 18.6 | 14.0 | 0.9 | 5.7 | 7.5 | 6.6 | 60.9 | 82.2 | 74.6 | 0.9 |
| 16:00 | 33.6 | 40.3 | 38.6 | 10.1 | 17.8 | 12.9 | 0.9 | 5.1 | 6.4 | 5.6 | 64.3 | 84.5 | 77.1 | 0.9 |
| 17:00 | 32.6 | 39.3 | 37.7 | 13.8 | 20.3 | 15.2 | 0.9 | 4.0 | 5.1 | 4.3 | 66.7 | 87.5 | 80.0 | 0.9 |
| 18:00 | 31.7 | 37.9 | 36.6 | 16.0 | 22.9 | 17.4 | 0.9 | 3.3 | 4.4 | 3.6 | 71.4 | 91.2 | 84.0 | 0.9 |
| 19:00 | 30.1 | 36.1 | 35.0 | 17.3 | 25.0 | 18.0 | 0.9 | 2.8 | 3.9 | 3.1 | 74.9 | 94.1 | 87.1 | 0.9 |
| 20:00 | 28.7 | 34.5 | 33.7 | 18.1 | 26.5 | 19.8 | 0.9 | 2.3 | 3.4 | 2.6 | 77.0 | 96.3 | 89.2 | 0.9 |
| 21:00 | 27.7 | 33.6 | 32.7 | 18.7 | 27.8 | 20.5 | 0.9 | 1.8 | 3.0 | 2.2 | 80.4 | 98.7 | 91.9 | 0.9 |
| 22:00 | 26.7 | 32.5 | 31.7 | 20.7 | 29.7 | 22.1 | 0.9 | 1.3 | 2.6 | 1.8 | 82.4 | 100.7 | 93.8 | 0.9 |
| 23:00 | 25.9 | 31.7 | 30.9 | 21.3 | 30.9 | 22.9 | 0.9 | 0.8 | 2.2 | 1.3 | 84.1 | 102.4 | 95.5 | 0.9 |
| PET [°C] | Grade of Physiological Stress | Thermal Sensitivity |
|---|---|---|
| ≤4 | Extreme cold stress | Very cold |
| 4.1–8 | Strong cold stress | Cold |
| 8.1–13 | Moderate cold stress | Cool |
| 13.1–18 | Slight cold stress | Slightly cool |
| 18.1–23 | No thermal stress | Comfortable |
| 23.1–29 | Slight heat stress | Slightly warm |
| 29.1–35 | Moderate heat stress | Warm |
| 35.1–41 | Strong heat stress | Hot |
| 41< | Extreme heat stress | Very hot |
| Period | 1. Scenario | 2. Scenario | 3. Scenario | 4. Scenario | 5. Scenario | 6. Scenario | |
|---|---|---|---|---|---|---|---|
| Air temperature (°C) | August | 33.2 | 34.0 | 32.9 | 32.3 | 31.9 | 31.7 |
| January | 3.2 | 3.3 | 3.1 | 3.0 | 2.8 | 2.8 | |
| Relative humidity (%) | August | 22.7 | 22.1 | 23.4 | 23.8 | 24.1 | 24.3 |
| January | 87.6 | 87.3 | 87.9 | 87.3 | 88.0 | 88.1 | |
| Mean radiant temperature(°C) | August | 37.7 | 44.1 | 36.8 | 35.8 | 35.6 | 35.3 |
| January | 4.5 | 5.8 | 4.3 | 4.1 | 4.0 | 4.0 | |
| PET (°C) | August | 39.4 | 40.5 | 39.3 | 39.0 | 38.7 | 38.3 |
| January | 9.6 | 9.7 | 9.5 | 9.3 | 9.2 | 9.2 | |
| Wind speed (m/s) | August | 0.9 | 1.0 | 0.9 | 0.9 | 0.9 | 0.9 |
| January | 0.9 | 0.9 | 0.9 | 0.9 | 0.9 | 0.9 |
Disclaimer/Publisher’s Note: The statements, opinions and data contained in all publications are solely those of the individual author(s) and contributor(s) and not of MDPI and/or the editor(s). MDPI and/or the editor(s) disclaim responsibility for any injury to people or property resulting from any ideas, methods, instructions or products referred to in the content. |
© 2025 by the authors. Licensee MDPI, Basel, Switzerland. This article is an open access article distributed under the terms and conditions of the Creative Commons Attribution (CC BY) license (https://creativecommons.org/licenses/by/4.0/).
Share and Cite
Yilmaz, S.; Menteş, Y.; Jamei, E. Investigating the Effect of Blue–Green Infrastructure on Thermal Condition—Case Study: Elazığ, Turkey. Land 2025, 14, 891. https://doi.org/10.3390/land14040891
Yilmaz S, Menteş Y, Jamei E. Investigating the Effect of Blue–Green Infrastructure on Thermal Condition—Case Study: Elazığ, Turkey. Land. 2025; 14(4):891. https://doi.org/10.3390/land14040891
Chicago/Turabian StyleYilmaz, Sevgi, Yaşar Menteş, and Elmira Jamei. 2025. "Investigating the Effect of Blue–Green Infrastructure on Thermal Condition—Case Study: Elazığ, Turkey" Land 14, no. 4: 891. https://doi.org/10.3390/land14040891
APA StyleYilmaz, S., Menteş, Y., & Jamei, E. (2025). Investigating the Effect of Blue–Green Infrastructure on Thermal Condition—Case Study: Elazığ, Turkey. Land, 14(4), 891. https://doi.org/10.3390/land14040891