Article

Mapping Re-Naturalization Pathways for Urban Ecological Governance: A Spatial Decision-Support Framework Based on Ecosystem Service Valuation

1
The Center for Modern Chinese City Studies, Institute of Urban Development, East China Normal University, Shanghai 200062, China
2
State Key Laboratory of Urban and Regional Ecology, Research Center for Eco-Environment Sciences, Chinese Academy of Sciences, Shuangqing Rd. 18, Beijing 100085, China
3
Department of Landscape Architecture and Horticulture, School of Architecture and Design, Chongqing College of Humanities, Science & Technology, Chongqing 401524, China
4
The Digital Engineering Technology Innovation Center for Ecological Governance of Land and Space Under the Ministry of Natural Resources, Shanghai Jiao Tong University, Shanghai 200240, China
5
College of Landscape Architecture and Art, Fujian Agriculture and Forestry University, Fuzhou 350002, China
*
Author to whom correspondence should be addressed.
Land 2025, 14(5), 917; https://doi.org/10.3390/land14050917
Submission received: 4 March 2025 / Revised: 16 April 2025 / Accepted: 21 April 2025 / Published: 23 April 2025

Abstract

:
Traditional urban expansion struggles to balance economic and ecological demands. Intensive development planning based on re-naturalization has become the policymakers’ choice. However, planning-oriented land use patterns and re-naturalization pathways remain difficult to determine. This study developed a spatial decision-support framework integrating ecosystem service valuation (ESV), land-use simulation, and ecological planning for Shanghai. This study assessed the spatiotemporal dynamics of ESV and simulated land use patterns and ESV for 2035 under different scenarios (inertial development, cropland protection, and ecological development). The optimal scenario and corresponding re-naturalization pathways were determined based on the principle of the optimal ESV. The results showed that ESV has declined over the past 20 years (−5.21%/5 years). High-value areas shrank significantly due to ecological space degradation. The planning-oriented ecological development scenario is the optimal scenario, with the highest ESV of CNY 189,240.29 million, which is higher than the status quo, inertia development scenario, and cropland protection scenario by 9.69%, 23.27%, and 9.53%, respectively. Taking the land use patterns under the ecological development scenario as the re-naturalization objective, 12 re-naturalization pathways totaling 686.88 km2 were identified. Cropland to forestland and built-up land to cropland were the largest, accounting for 67.88% and 15.02%, respectively. This study provides valuable insights into ecological planning and re-naturalization in urbanized areas.

1. Introduction

Global population growth and industrial agglomeration have intensified the rapid expansion of urban built-up land [1]. The United Nations Habitat’s World Cities Report 2022 documents a critical urban demographic shift: while 56% of humanity resides in cities as of 2021, projections indicate that this proportion will escalate to 68% within three decades [2]. The rational advancement of urbanization has positive implications for the development of human society, as it can enhance the living standards of residents [3,4], improve the production efficiency of enterprises [5], and optimize the allocation of regional resources [6,7]. Since its reform and opening-up, China has made remarkable achievements in the urbanization process [8]. Statistics show that China’s urban population has increased to 70% of the total population [9]. In the economically developed eastern and southeastern coastal areas, some cities have urbanization rates as high as 80–90%. Moreover, as the built-up land of cities in the region continues to expand and interconnect with each other, urban agglomerations with a higher level of socioeconomic development are gradually formed, such as the Yangtze River Delta Urban Agglomeration, Pearl River Delta Urban Agglomeration, and Beijing–Tianjin–Hebei Urban Agglomeration.
From the viewpoint of China’s urban expansion pattern over the past 20 years, although the production and living standards of the region have greatly improved, rough built-up land expansion and economic growth patterns that unilaterally pursue the growth of the total amount of social production ignore the increasingly serious ecological problems and resource shortages caused by the continuous degradation of ecological space [10], such as urban flooding [11], extremely high temperatures [12,13,14,15], water resource scarcity [16,17], air pollution [18], and agricultural non-point source pollution [19]. These ecological problems caused by traditional development concepts seriously threaten the future sustainable socio-economic development of the region, and the health of the residents and the security of economic production are continuously affected.
For policymakers, to improve the anti-risk ability of the ecosystem and ensure the overall ecological security and stable socioeconomic development of the city, it is an effective method to explore sustainable urban development modes by preparing a systematic ecological spatial planning scheme [20,21]. In the field of land planning, the intensive urban development model emphasizes the quality and effectiveness of regional socioeconomic development and has gradually become the preferred choice for many cities when carrying out old city renewal and new city construction [22]. A series of measures, such as restoring ecological space, improving the quality of urban green areas, and increasing the efficiency of built-up land use under the concept of re-naturalization, are important for implementing the intensive urban development model. Urban re-naturalization, also called urban rewilding, refers to the restoration of natural urban processes and the enhancement of the wild character of urban landscapes through the reduction of anthropogenic interference or the adoption of moderate restoration measures [23,24]. However, a mature, comprehensive, and systematic framework has not yet been developed for the identification of re-naturalization spaces and the determination of specific pathways. In traditional ecological restoration projects, the selection of spaces is often passive, typically focusing on damaged, low-value, or sensitive areas under the status quo through the construction of simple or complex indicator systems for evaluation [25,26]. Future ecological development objectives in urban planning documents are less frequently included in the identification of spaces for ecological restoration. Furthermore, human beings are the main beneficiaries of ecosystem function enhancement [27,28], and under the concept of re-naturalization, the purpose of promoting sustainable urban development is to increase the benefits of ecosystems for human production and life. Therefore, spatial identification research on re-naturalization needs to consider the benefits of ecosystems to humans, which is lacking in the existing research.
There are currently two views on the assessment of ecosystem services. On one side, ecosystem services are only relevant to urban green spaces, either within or around cities. The other side argues that ecosystem services are linked to the whole urban system and that ecosystem services are both produced and utilized by humans [29]. However, the current academic community generally recognizes that ecosystem services encompass the direct and indirect benefits derived by humans from ecosystems and are systematically categorized into four categories: provisioning services, regulating services, supporting services, and cultural services [30,31]. Among these, regulating and supporting services play a crucial role in maintaining overall regional ecological security and ensuring sustainable socioeconomic development. Several studies have demonstrated that ecosystem services can be used as scientific indicators to quantify ecological functions from the perspective of ecosystem benefits. Many studies on ecosystem services have focused mostly on assessment methods, spatial mapping [32,33], trade-offs/synergies [34,35], and supply/demand balance [36,37]. These research results have been widely applied in the fields of ecological red line demarcation [38], ecological protection benefit evaluation [39], and ecological compensation policies [40]. However, the application of ecosystem services in land use planning is relatively rare. Although some studies have demonstrated that ecosystem service valuation can effectively support future urban land planning strategies [9], practical re-naturalization pathways have not yet been proposed for planning objectives. Therefore, incorporating ecosystem service value into future sustainable land development planning and proposing spatialized re-naturalization pathways is of great practical significance for policymakers to mitigate urban development problems.
Shanghai is located in a highly developed urban agglomeration of the Yangtze River Delta (YRD). Since the reform and opening up, Shanghai has achieved a high degree of urbanization in terms of population, industry, and land through the rapid expansion of urban built-up land owing to its excellent location and policy conditions [41]. However, under the traditional urban development mode, ecological problems, such as urban heat islands, waterlogging, agricultural nonpoint source pollution, and water scarcity, seriously threaten the safety of residents’ lives and industrial production [41,42]. Therefore, this paper took Shanghai as a research case and integrated multi-source remote sensing data, monitoring data, ecological function parameters, and socioeconomic data to propose a spatial decision-support framework for answering the following four research questions: (1) What are the spatial and temporal characteristics of ecosystem services during 2000–2020? (2) What probability distribution does the spatial expansion of different land uses exhibit? (3) What are the differences in land use distribution patterns and ecosystem service value under different development scenarios? (4) How can spatialized re-naturalization strategies aimed at enhancing the value of ecosystem services under optimal development scenarios be mapped? The results of this paper can guide urban land use development planning in the future and identify feasible re-naturalization pathways.

2. Materials and Methods

2.1. Study Area

Shanghai, located in the estuary of the Yangtze River [41], is the most economically dynamic city in the highly developed Yangtze River Delta. (Figure 1a and Figure 1b, respectively). Shanghai primarily consists of alluvial plains and estuarine sandbar landforms, with the highest point reaching 103.4 m (Figure 1d). The city is densely covered with rivers (Figure 1c), including the famous Huangpu and Wusong Rivers. Additionally, there are many peripheral islands, of which Chongming Island is the largest. The average annual temperature in Shanghai is 15.2–15.9 °C, but under the influence of the subtropical high-pressure system, there are more high-temperature days in summer, particularly in the central urban areas where the heat island effect is significant. The average annual precipitation is 1048–1138 mm, which belongs to the subtropical monsoon climate, with abundant rainfall in summer, and there is a high risk of urban flooding [43]. Additionally, the dense population and industrial activities not only result in severe air pollution and carbon emissions [44] but also lead to a substantial demand for water for both domestic and industrial use in the city [45]. However, water scarcity has become a critical factor constraining economic development, and is influenced by regional water pollution and river water salinization.
Urbanization in Shanghai over the past 20 years has exacerbated the significant degradation of cropland and wetland areas in the city [46]. Official data released by Shanghai show that the city’s cropland area in 2020 decreased by 43.95% compared to 2000 [47,48]. Against the backdrop of cropland degradation, agricultural practitioners have intensified the use of chemical fertilizers to ensure the stability of agricultural product supply, further exacerbating the pressure of regional non-point source pollution [49]. Therefore, to support future sustainable social and economic development strategies, policymakers urgently need to explore sustainable land use distribution patterns and re-naturalization pathways based on existing planning documents, ultimately enhancing ecosystem benefits to human society.

2.2. Framework

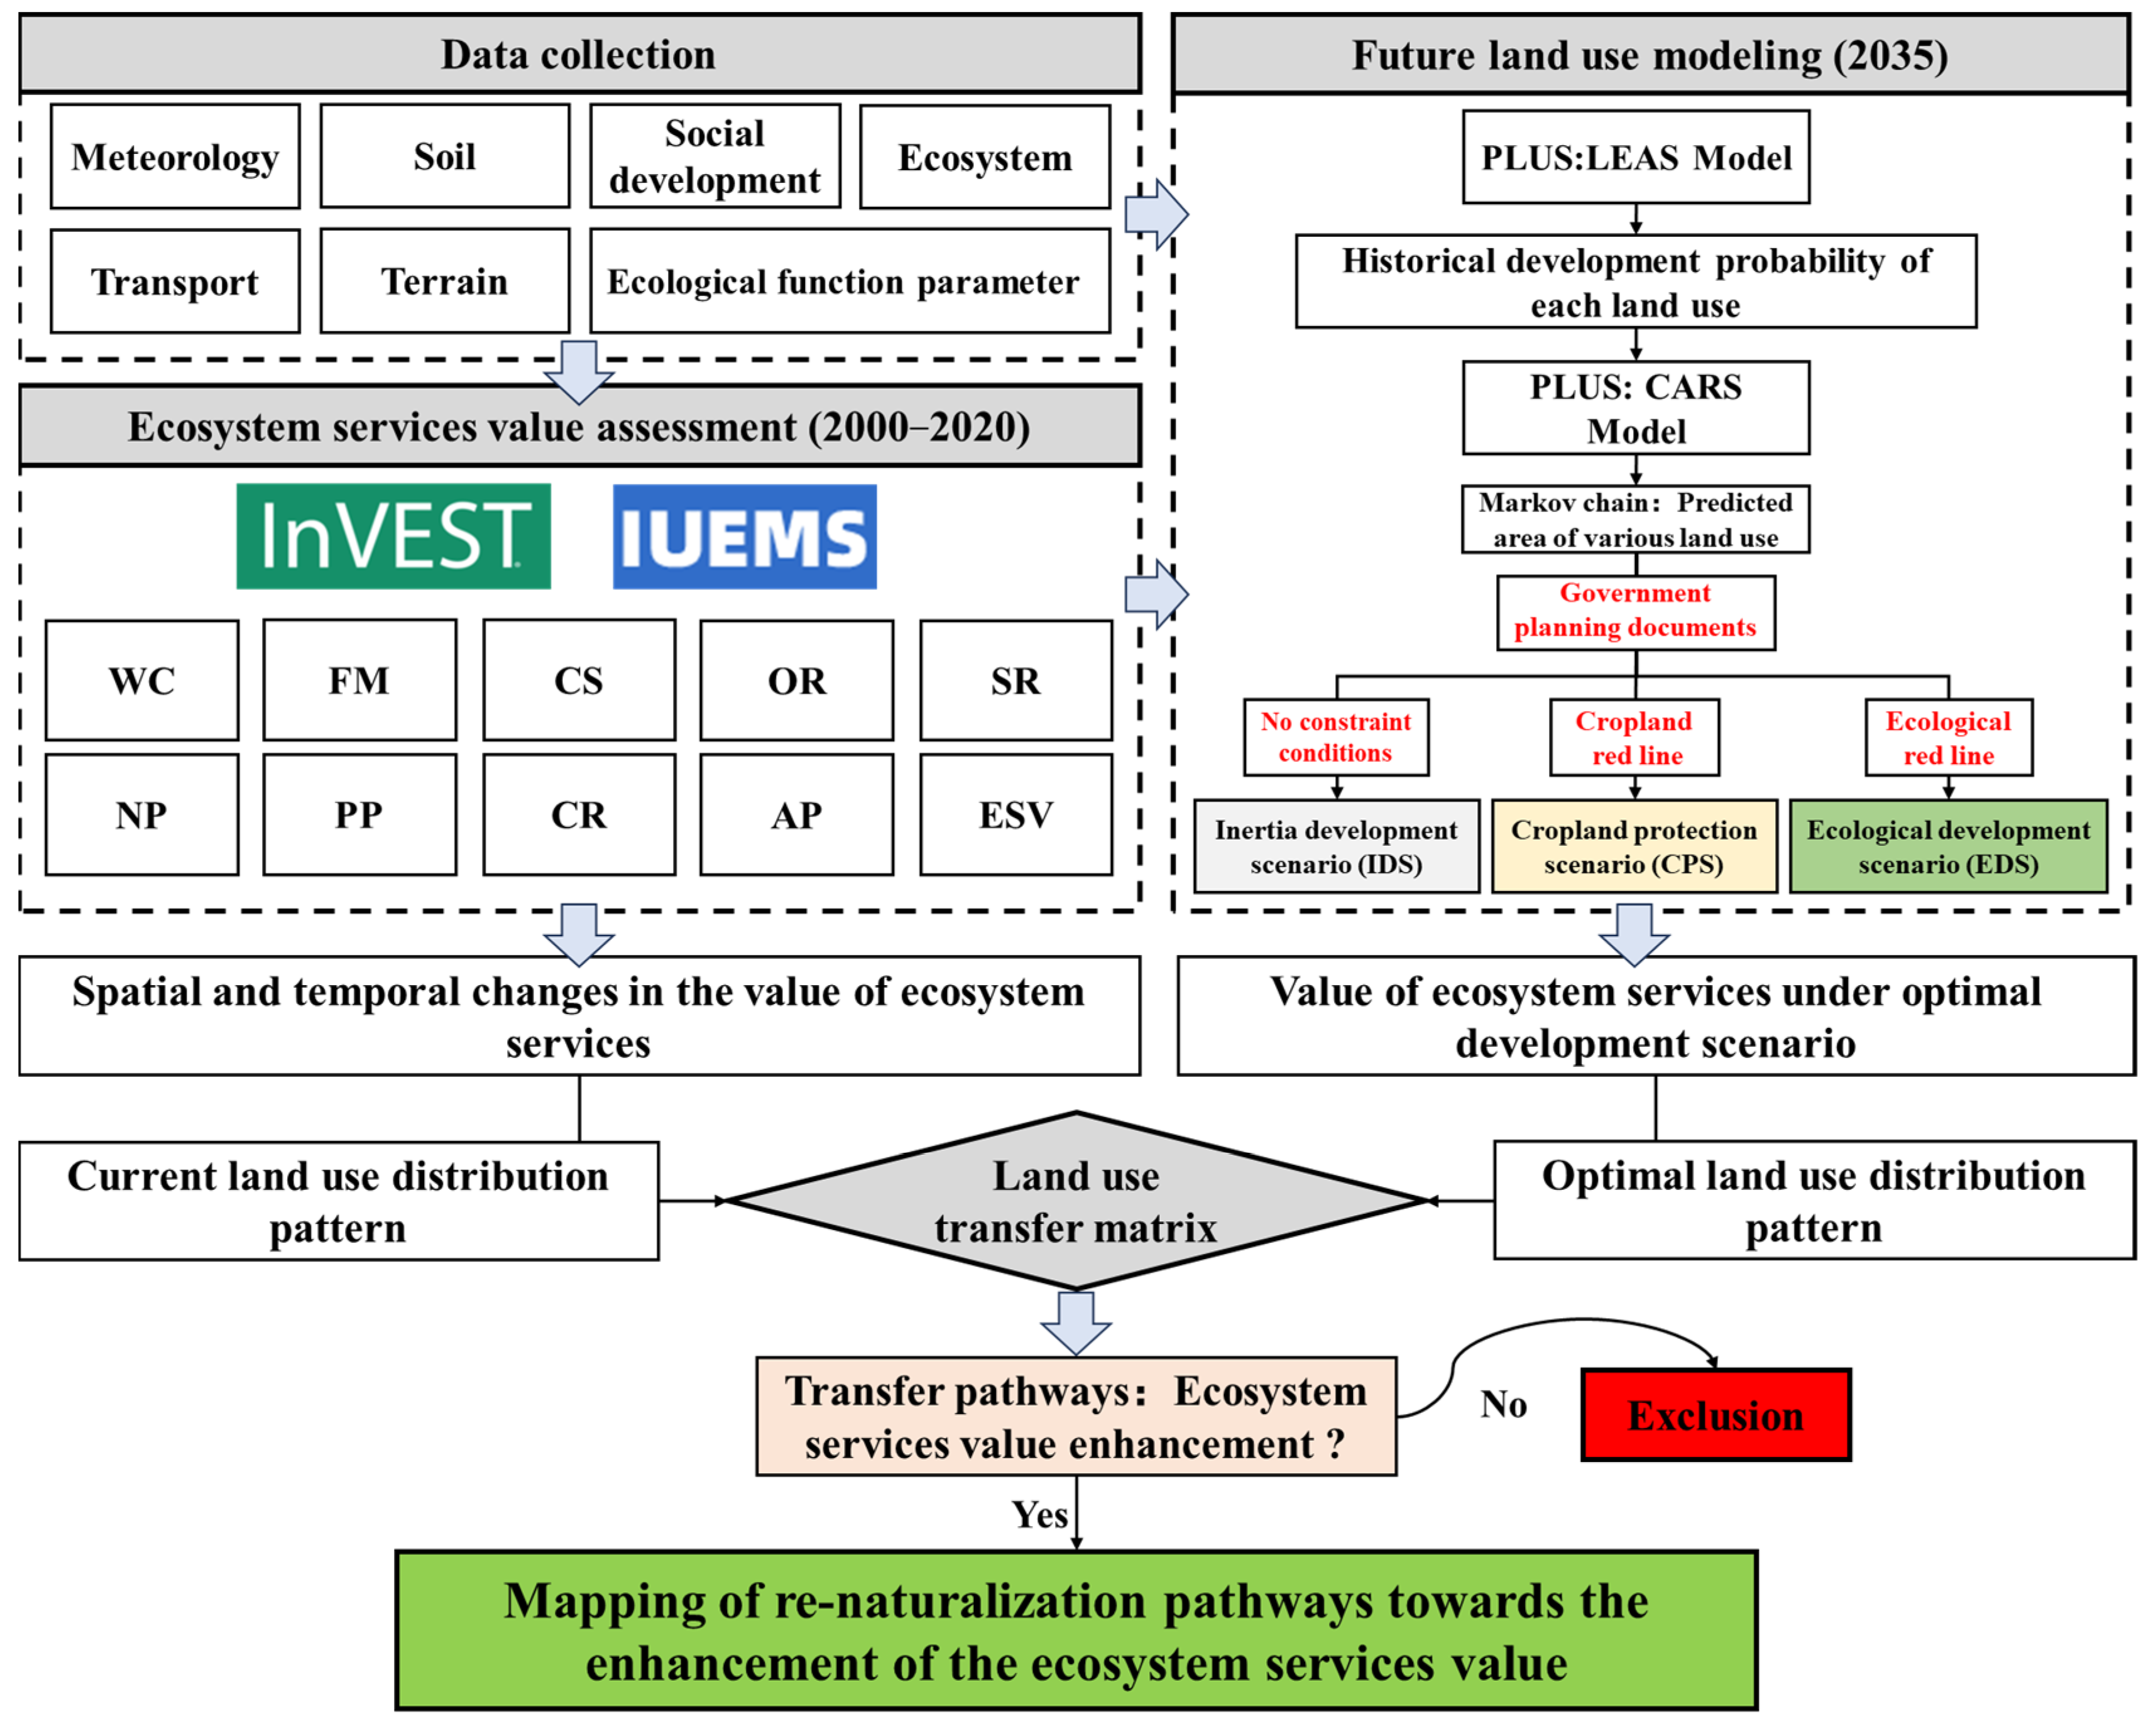
This study proposed a decision-support framework to guide future land use development planning and identify feasible re-naturalization pathways (Figure 2).
First, we established a comprehensive database for ecosystem service assessments and land use simulations under different development scenarios. Second, based on the land use data of 2005 and 2020, the Land Expansion Strategy Analysis Model (LEAS) built into the Patch-generating Land Use Simulation Model (PLUS) was used to plot the historical growth probability of various types of land use. Third, we used the Markov chain to predict the area of various land types in Shanghai and integrated government planning documents, different constraints (cropland protection red line or ecological red line), and the Cellular Automaton Model based on multiclass random patch seeds (CARS) built into the PLUS model to simulate the land use distribution pattern under different development scenarios. Fourth, we employed the Integrated Valuation of Ecosystem Services and Tradeoffs Platform (InVEST) [50,51] and the Intelligent Urban Ecosystem Management System (IUEMS) [52] to conduct ecosystem services value assessments from 2000 to 2020 under different future development scenarios. Fifth, we considered the development scenario with the highest ecosystem services value as the optimal development scenario and made a spatial comparison between the current land use distribution pattern and the land use distribution pattern under the optimal scenario to identify all transformation pathways. Ultimately, we calculated the average ecosystem service value of each land use type and reserved the transformation pathways that could achieve value enhancement as re-naturalization pathways.

2.3. Future Development Scenarios Simulation

The PLUS V1.0 is a software developed by the China University of Geosciences (CUG) based on the C++ language to serve in the fields of land use change simulation, policymaking, and urban planning [53]. The software integrates two modules: LEAS and CARS. The LEAS module extracts the expansion portion of various land uses between two periods and utilizes the Random Forest algorithm to mine the driving factors, obtaining the contribution of each factor to land expansion as well as the distribution probability of each land use. The CARS model combines the random seed generation and threshold-decreasing mechanisms to simulate the formation of various land use patches under different development scenarios in time and space based on user-input development probability of each land use type, predetermined area of each land use type, constraint conditions, and neighborhood factors. Considering different development goals, this study presupposes three different development scenarios for Shanghai in 2035: inertial development scenario (IDS), cropland protection scenario (CPS), and ecological development scenario (EDS). It integrates the PLUS model, policy documents, and socio-economic–natural multidimensional driving factors to simulate the corresponding land use distribution patterns. By reviewing the previous literature [53,54,55,56,57], we integrated 17 indicators as potential driving factors affecting land use change, covering socio-economic, meteorological, environmental, topographical, and transportation aspects. Detailed indicators are listed in Table 1.
First, we simulated the land use distribution pattern in 2020 based on the land use distribution pattern in 2005 and various driving factors. We then calculated the kappa coefficient and the figure of merit (FOM) coefficient between the simulation results and the actual land use distribution pattern using the confusion matrix and the FOM index built into the PLUS model, respectively, which are used to characterize the accuracy of the simulation results. The FOM coefficient is calculated as shown in Equation (1). The results showed that the kappa coefficient was 0.89, the FOM coefficient was 0.216, and the overall accuracy of the model was 0.91. This implies that the PLUS model and the combination of driving factors listed in this article are robust in simulating future land use distribution patterns. During the simulation process, we simultaneously obtained the spatial distribution of growth probabilities for each land use category, which were used in the following land use simulations under different future development scenarios.
F O M = T P + T N T P + T N + F P + F N
where T P is the area that is both simulated as a certain land use type and actually belongs to that type in reality (km2). T N is the area that is neither classified as a specific land use type in the simulation nor in reality (km2). F P is the area that is incorrectly simulated as a particular land use type but does not actually belong to that category (km2). F N is the area that is not identified as a specific land use type in the simulation but actually exists as that type in reality (km2).
Second, we calculated the neighborhood factor for each land use type using land use distribution data for 2005 and 2020. The neighborhood factor is used to characterize the expansion capacity of the land use types, with a value range of 0–1. The closer the value is to 1, the stronger the expansion capacity. The calculation method is shown in Equation (2) [58].
N F i = S i S m i n S m a x S m i n
where N F i is the neighborhood factor for land use category i (dimensionless). S i is the area of change for the land use category i (km2). S m i n is the minimum value for the area for all land use changes (km2). S m a x is the maximum value of the area for all land use changes (km2).
Third, we incorporate differentiated planning policy elements into three different development scenarios. (1) Under the inertial development scenario, we use the Markov chain model to predict the area of each land use type in 2035 and input it into the model. In addition, no spatial constraints were input, and the spatial changes of each land use type simply followed their historical patterns. (2) Under the cropland protection scenario, we input the cropland protection red line as a spatial restriction to avoid cropland degradation within the red line. In addition, on the basis of the area predicted by the Markov chain model, we refer to the ‘Special Plan for Shanghai’s Ecological Space (2018–2035)’ and ‘Special Plan for Ecological Restoration of Shanghai’s Land Space (2021–2035)’ to reduce the conversion probability of cropland to forests, grasslands, and wetlands, and increase the conversion probability of forests, grasslands, and wetlands to cropland, and at the same time, prohibit the conversion of cropland to built-up land. (3) Under the ecological development scenario, we input the ecological protection red line as the spatial restriction in the PLUS model to avoid the degradation of high-quality ecological spaces, such as forests and wetlands. Meanwhile, based on the area predicted by the Markov chain model, this study follows the development objectives in the ‘Special Plan for Shanghai’s Ecological Space (2018–2035)’ and ‘Special Plan for Ecological Restoration of Shanghai’s Land Space (2021–2035)’ to reduce the conversion probability of forests and wetlands to farmland, and to prohibit the conversion of forests and wetlands to built-up land, and to increase the conversion probability of built-up land and cropland to high-quality ecological space such as forests and wetlands.

2.4. Ecosystem Services Evaluation and Valuation

Considering the typical ecological problems faced by Shanghai and its natural ecological background characteristics, nine ecosystem services were quantified at the grid scale using biophysical modeling methods: water conservation (WC), flood mitigation (FM), carbon sequestration (CS), sedimentation reduction (SR), nitrogen purification (NP), phosphorus purification (PP), climate regulation (CR), air purification (AP), and oxygen release (OR). The calculation method for each ecosystem service refers to the national standard issued by the Chinese government in 2024 [59]; the detailed calculation formula is shown in Table S1. This study used the InVEST 3.12 [50,51] and IUEMS [52] platforms to calculate the physical quantity and monetary value of ecosystem services.

2.5. Developing Re-Naturalization Pathways

Among the three scenarios of inertial development, ecological development, and cropland protection, the scenario with the highest ecosystem service value will be considered the optimal development scenario, and the corresponding spatial distribution of land use will be taken as the target of re-naturalization. In this study, a land use transfer matrix was used to characterize the changes between current land use and target land use to determine the spatial distribution of different re-naturalization paths. Pathways that satisfy the re-naturalization concept should meet the following principle: the ecosystem service value-provisioning capacity of the converted land use type should be higher than that of the pre-conversion land use type.

2.6. Data Collection

The data used for ecosystem service assessment mainly include land use, topographic, soil, meteorological, environmental monitoring, and ecological function parameters. The detailed data are provided in Table S2. In addition, in order to reduce the impact of interannual fluctuations of meteorological elements on the results of ecosystem service assessment, so that the results of ecosystem service assessment can better represent the changes in ecosystem quality and quantity, this study referred to the concept of “comparable meteorological conditions” proposed in previous studies, and used meteorological data from Shanghai in 2020 as the basis for comparable meteorological conditions. The 2020 meteorological data will be used for historical, present, and future ecosystem service assessment [60,61]. Land use change is mainly affected by social, economic, and natural factors. In this study, 11 socioeconomic factors and six climatic and environmental factors were comprehensively considered as driving factors when simulating land use distribution patterns under different development scenarios. See Table 1 for detailed data description.

3. Results

3.1. Spatial and Temporal Changes of Ecosystem Service Value (2000–2020)

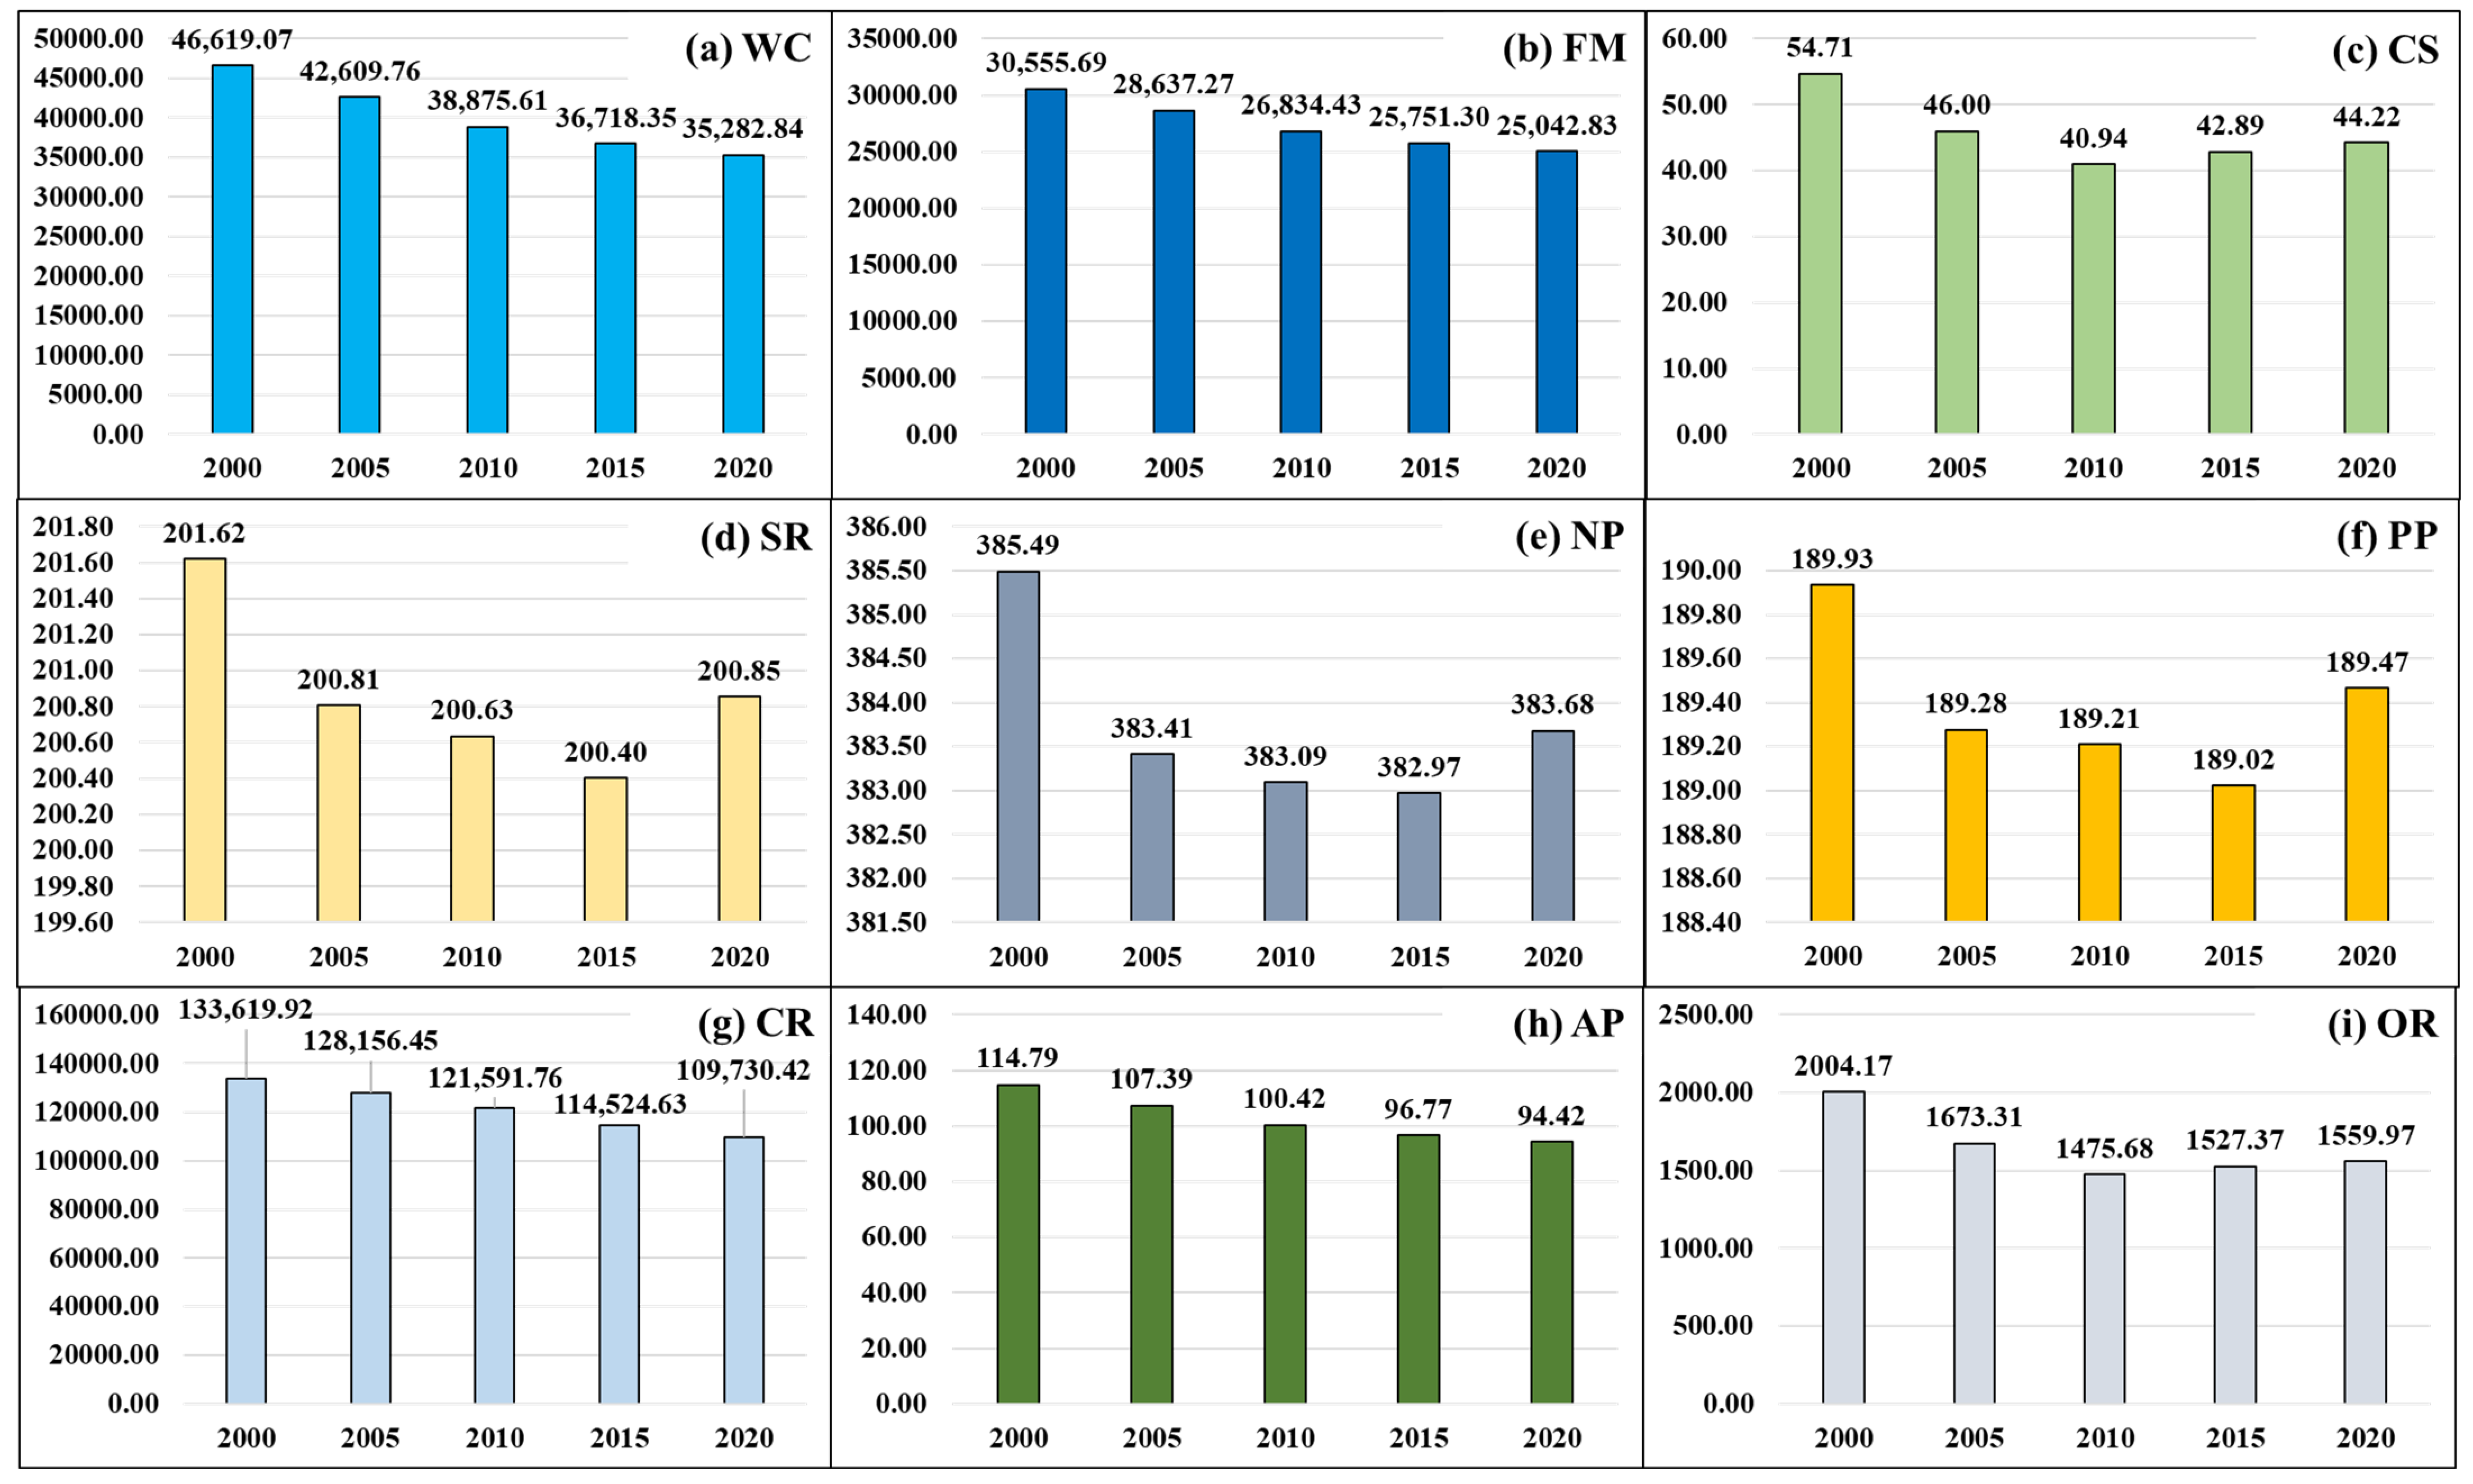
The results showed that ecosystem service value in Shanghai exhibited a downward trend from 2000 to 2020, decreasing from CNY 213,745.40 million in 2000 to CNY 172,528.70 million in 2020, with a decrease of 19.28% and an average decrease of 5.21% every five years (Figure S1). However, there were significant differences in the trends of changes in the values of various ecosystem services. The values of WC, FM, CR, and AP showed decreasing trends, with average decreases of 6.71, 4.84, 4.80, and 4.75% per 5-year period over the 20-year period (Figure 3a,b,g,h). The values of SR, NP, and PP, while decreasing significantly between 2000 and 2015, rebounded to the levels in 2005 by 2020 (Figure 3d–f). The CS and OR values entered a state of stable growth after experiencing significant decreases over nearly 10 years, from 2000 to 2010. From 2010 to 2020, the average increases per 5-year period were 3.93% and 5.64%, respectively (Figure 3c,i).
We utilized the natural breaks method to spatially classify the ecosystem service value into five levels based on their supply capabilities: low, low-to-medium, medium, medium-to-high, and high. The high-value areas were mainly distributed in the Yangtze River estuary area in the north and a large area south of the Dianshan Lake scenic area in the west. Large areas of croplands in the southwestern and southeastern parts of the city center also exhibited medium-to-high ecosystem service values. However, the supply capabilities of the city’s built-up land and the large areas of cropland in the southern part were relatively low (Figure 4). During the past 20 years, with the continuous expansion of built-up land and significant degradation of ecological space, low- and low-to-medium-value areas have spread outward from the urban center area. The high-value areas in the southwestern part of the city were significantly degraded. The high-value areas in the eastern part of Chongming Island have almost completely disappeared. A large medium-to-high-value area in the southwestern and eastern parts of the city was significantly degraded (Figure 4).
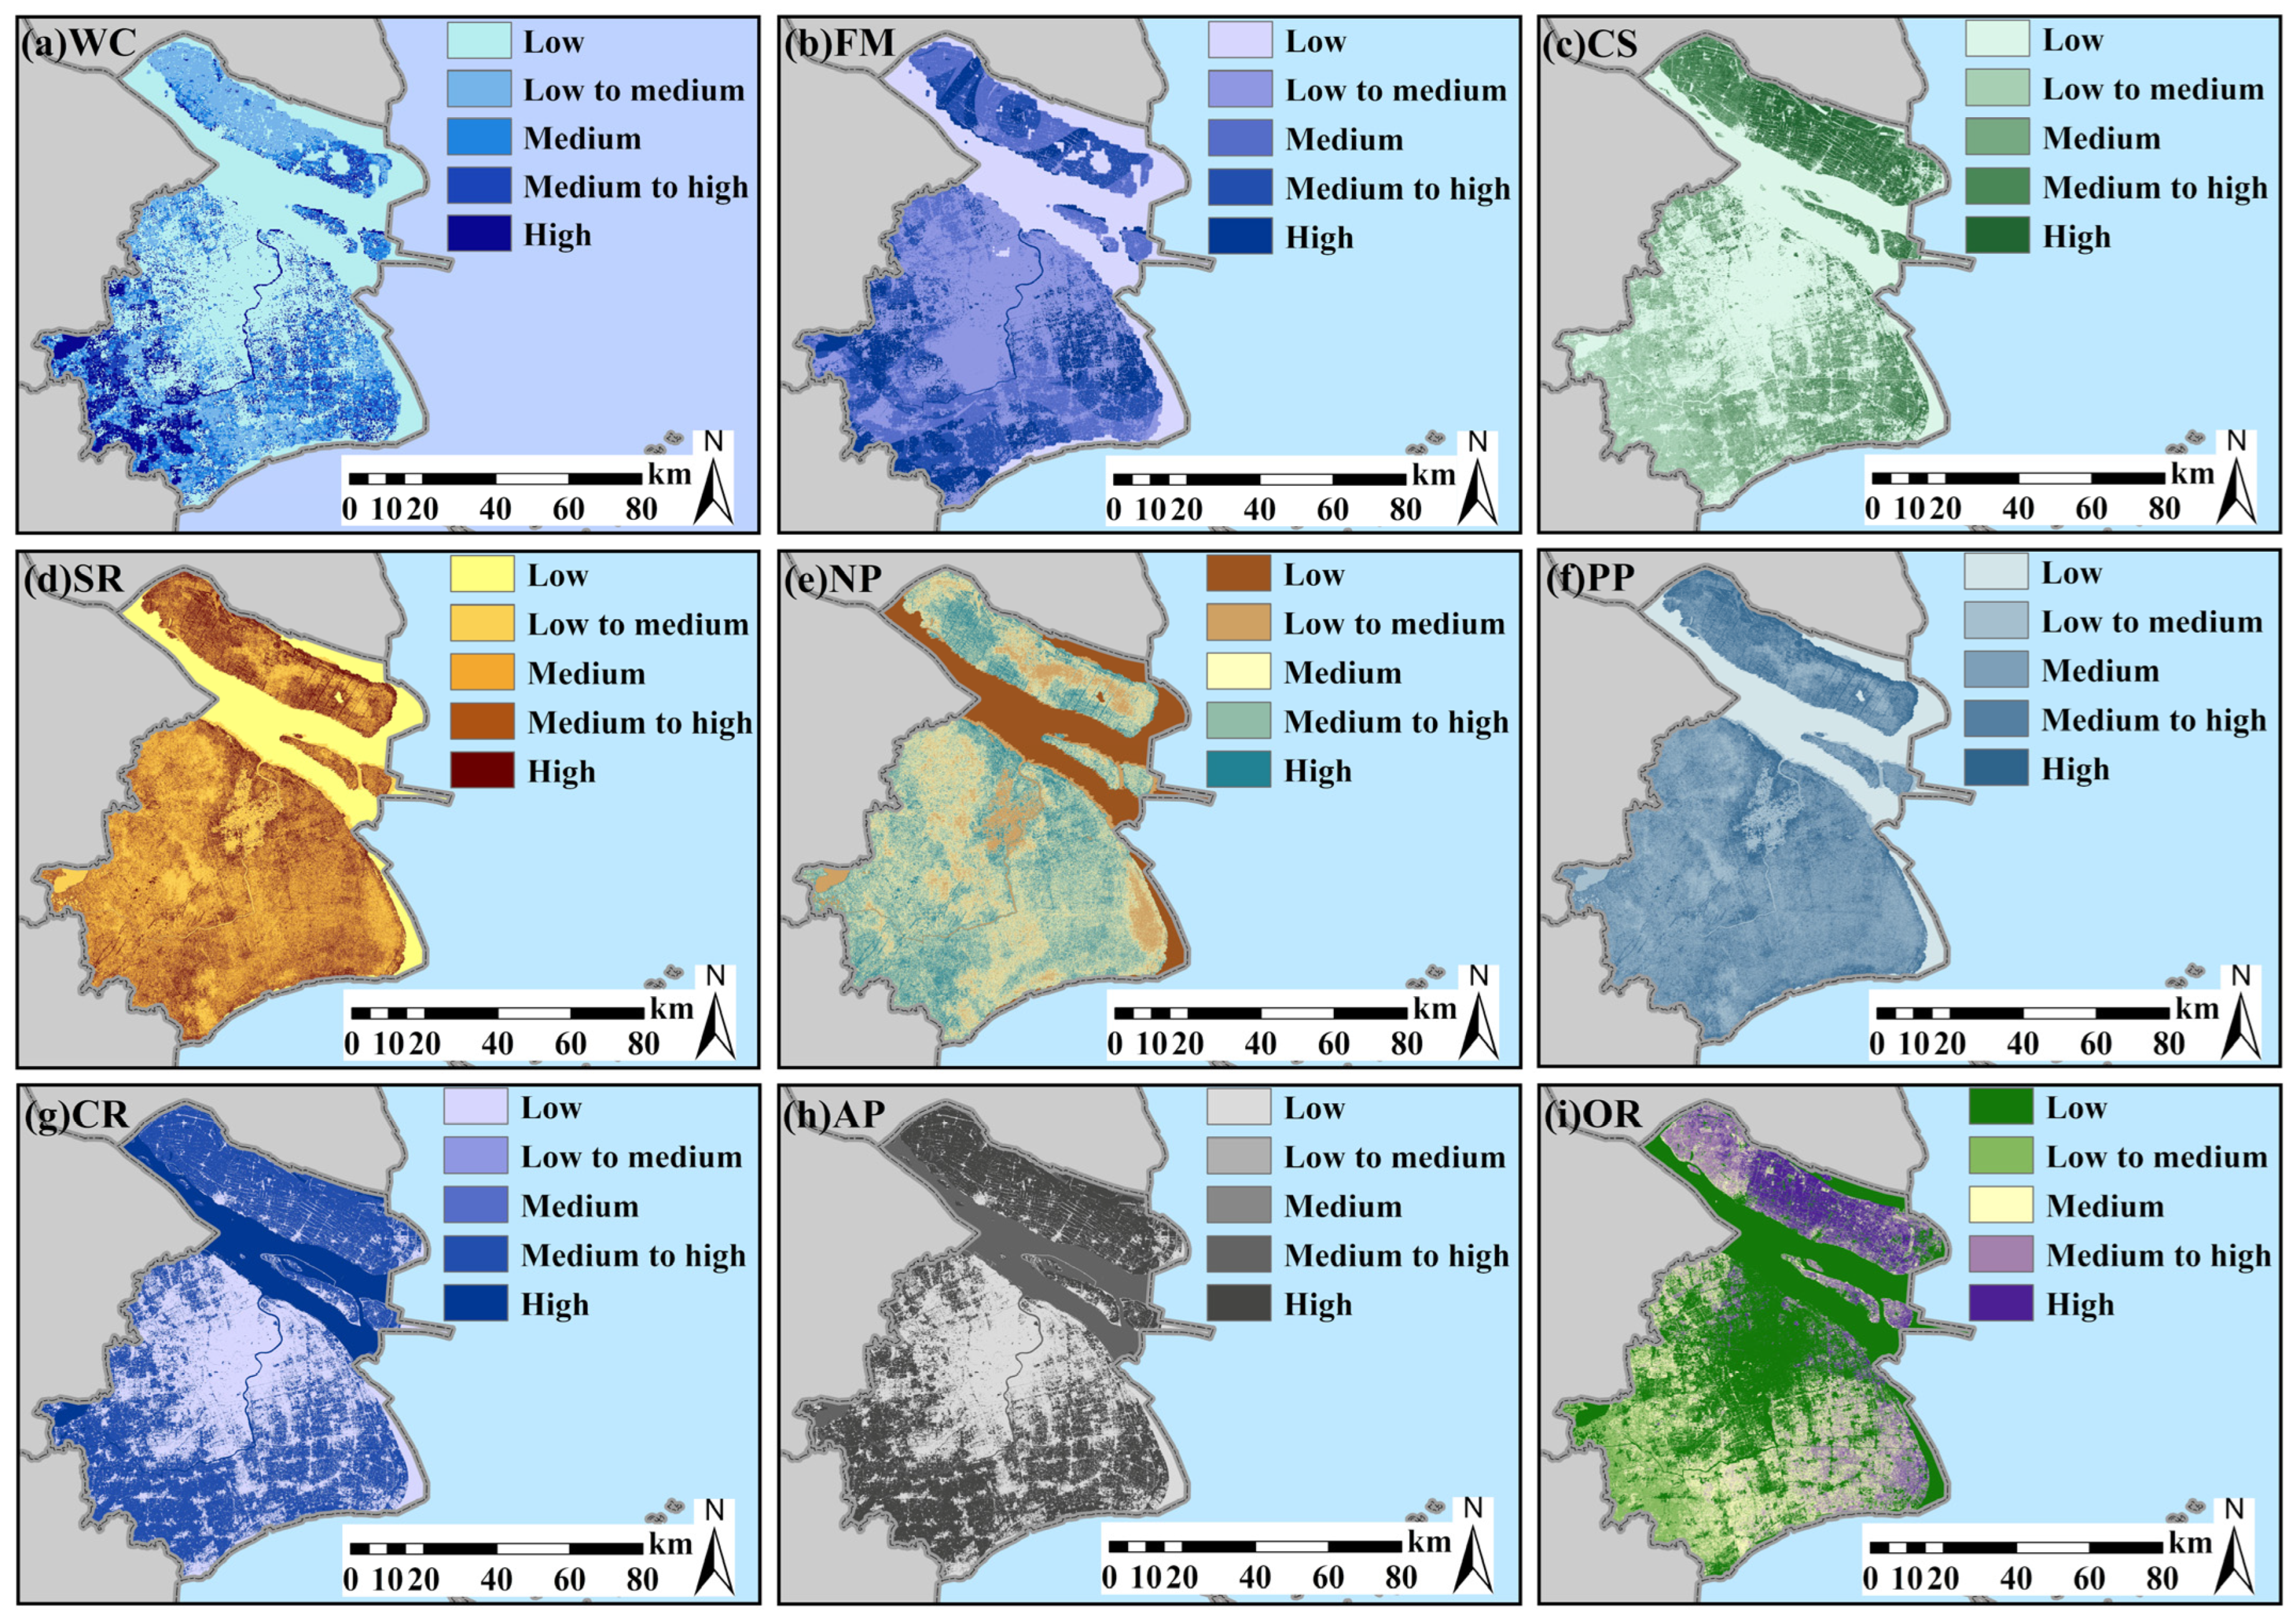
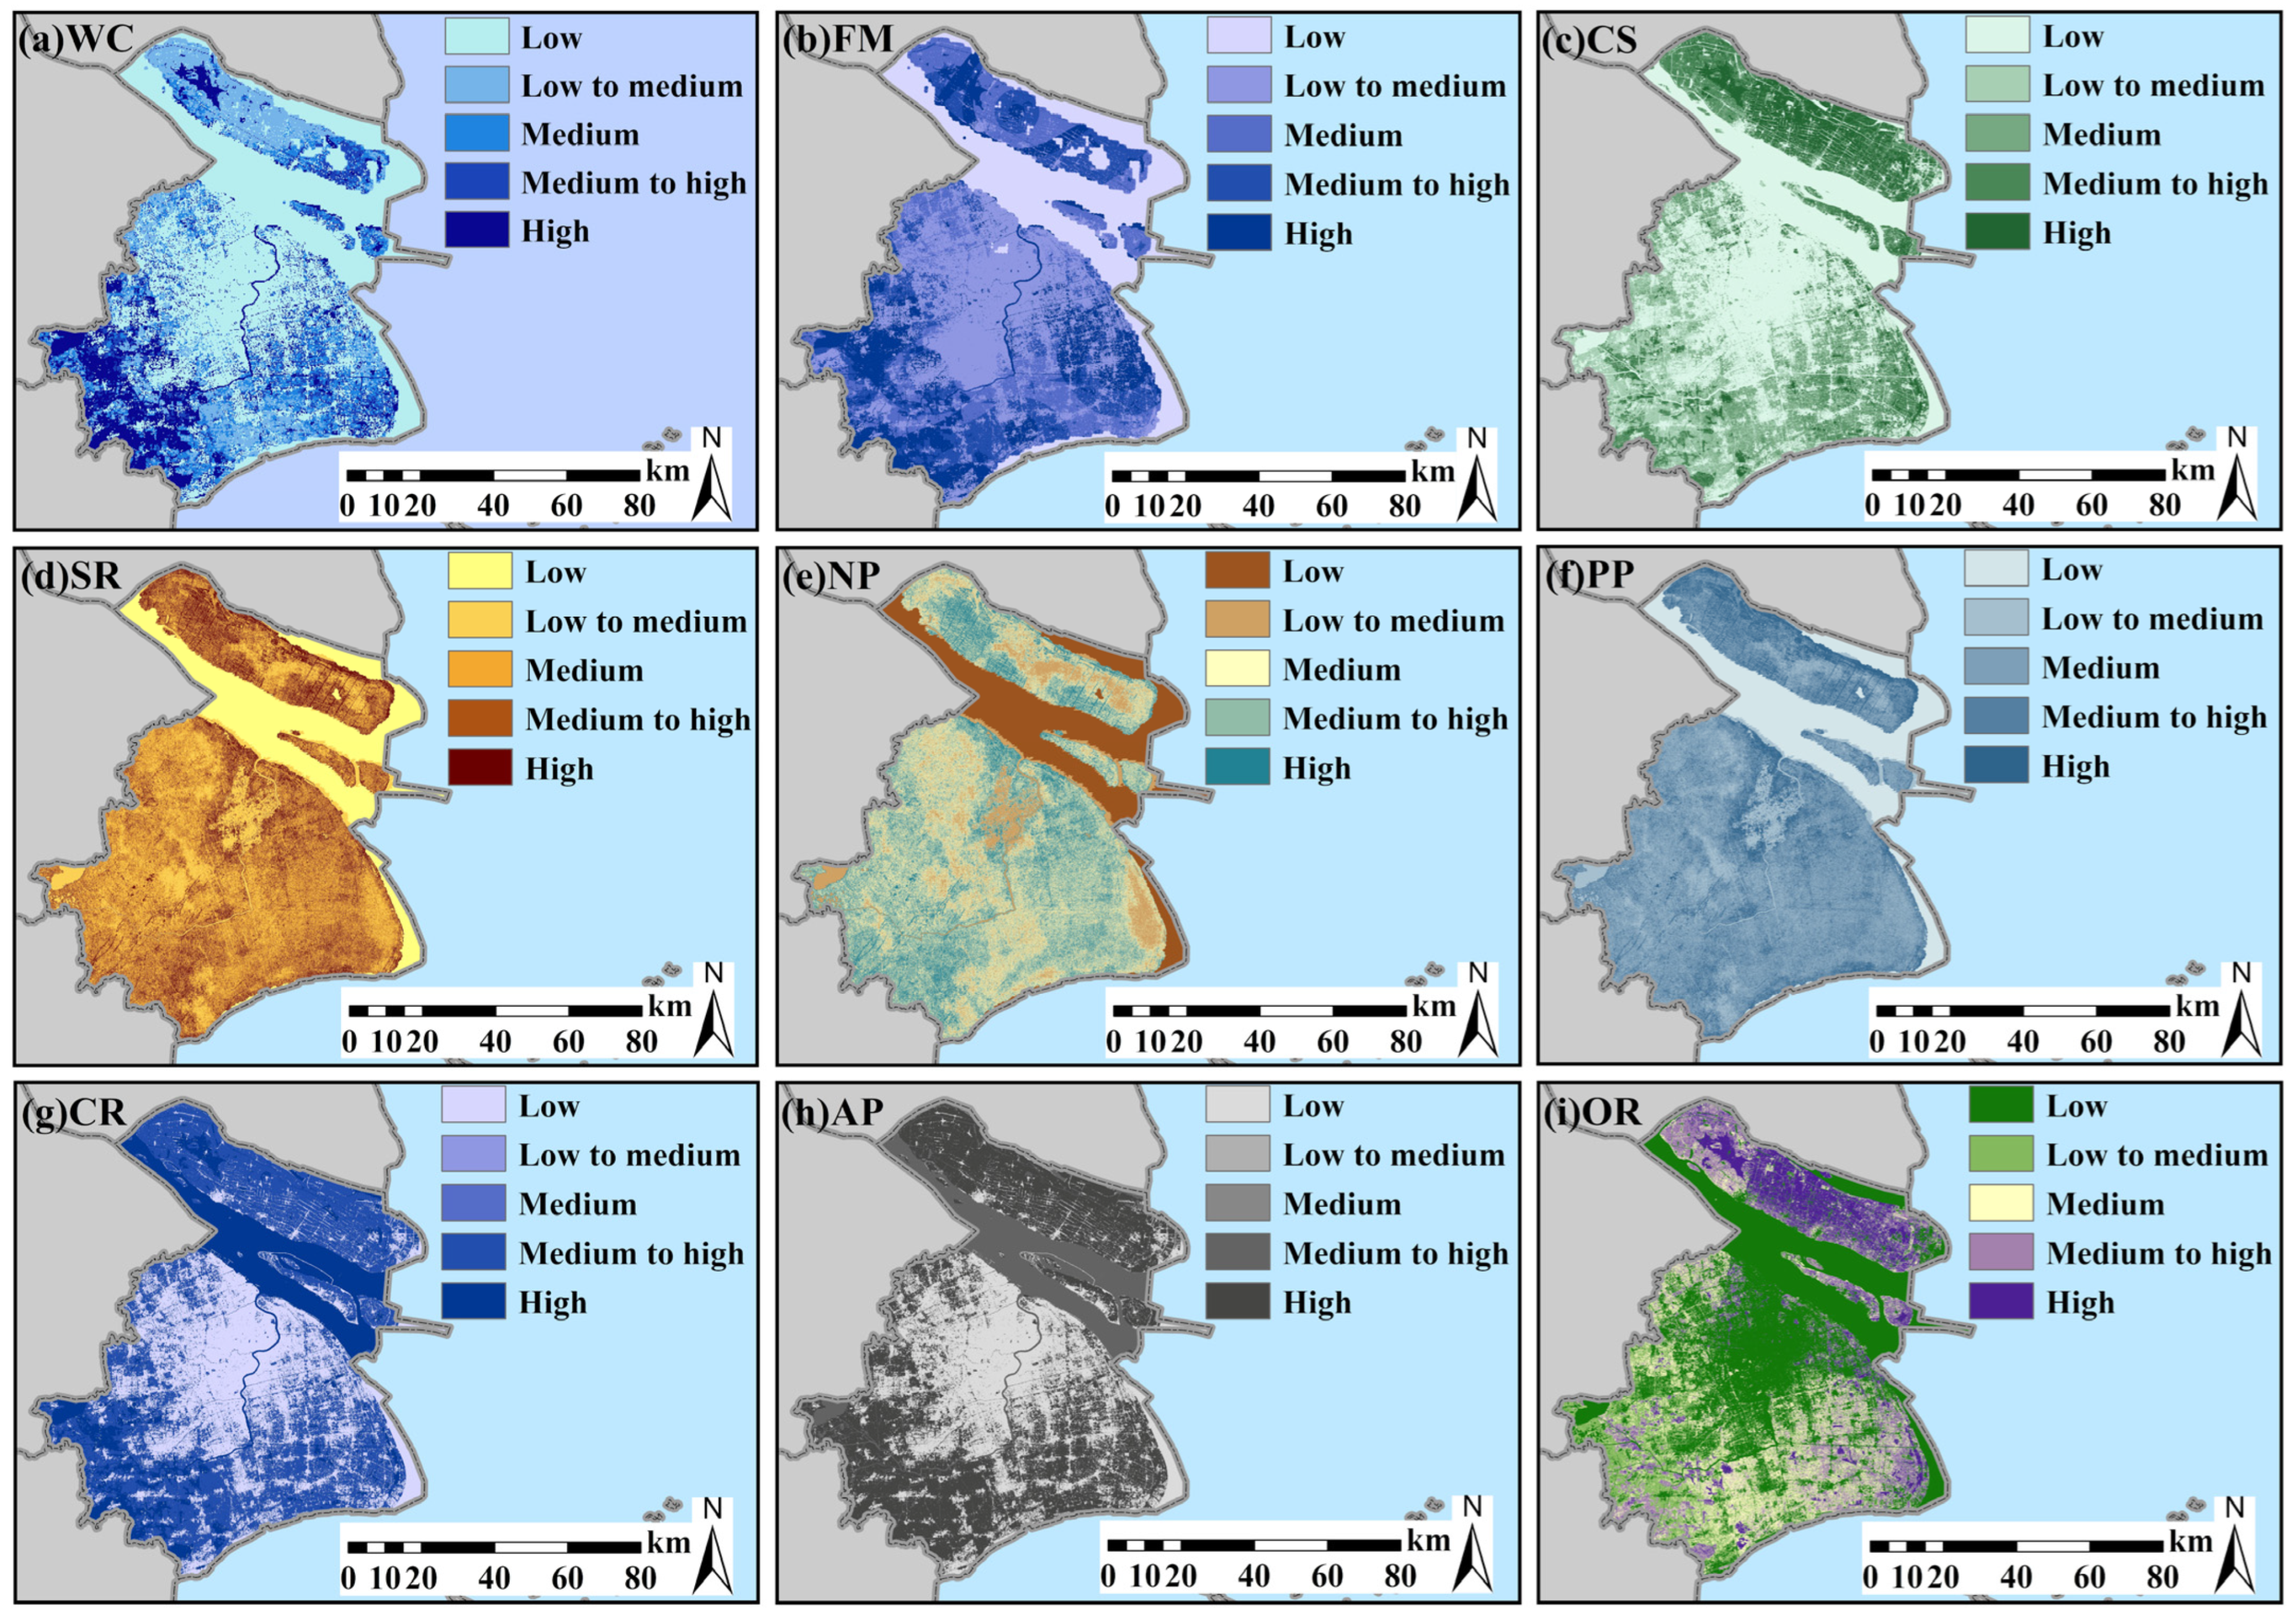
There were significant differences in the spatial distribution patterns and changes in the various ecosystem services. Driven by both spatial differences in ecological quality and precipitation, the high-value areas for WC and FM were primarily distributed in the southwestern part of the city and the eastern part of Chongming Island, especially the large area south of the Dianshan Lake scenic area. Additionally, FM had a high value in the eastern part of the city. The high-value areas for CS and OR were mainly distributed in the Chongming Island area and the Pudong New District in the east, where the ecological background is better. The CS and OR were generally low in the city center and the southwestern region. The high-value areas for SR, NP, and PP were primarily distributed in regions with relatively large differences in elevation and better vegetation conditions, thus exhibiting a more scattered spatial distribution across the city. The high-value areas for AP were mainly distributed in cropland spaces across the city, whereas the high-value areas for CR were distributed in wetland spaces within the Yangtze River estuary area in the north and the Dianshan Lake scenic area in the east. Notably, for all types of services, the low- and low-to-medium-value areas were concentrated in the built-up land or in the vicinity of the built-up land (Figures S2–S6).
Similar to the spatial changes in the total value of ecosystem services over the 20 years, the continuous expansion of built-up land, which has led to the degradation of ecological spaces such as wetlands and croplands, has significantly deteriorated the medium-to-high-value and high-value areas for ecosystem services such as WC, FM, CR, and AP. However, the spatial distribution patterns of SR, NP, and PP values remained relatively stable, with little interannual variation. This was mainly because the topographical factors that significantly influenced the value of these services did not exhibit significant inter-annual changes. For CS and OR, the medium-to-high-value and high-value areas exhibited a degradation trend between 2000 and 2010. However, with the continuous improvement of vegetation quality from 2010 to 2020, the medium-to-high-value and high-value areas have shown an expanding trend, particularly in the Chongming Island area and the eastern part of Pudong New District (Figures S2–S6).

3.2. Growth Probability Distributions for Various Land Use Types

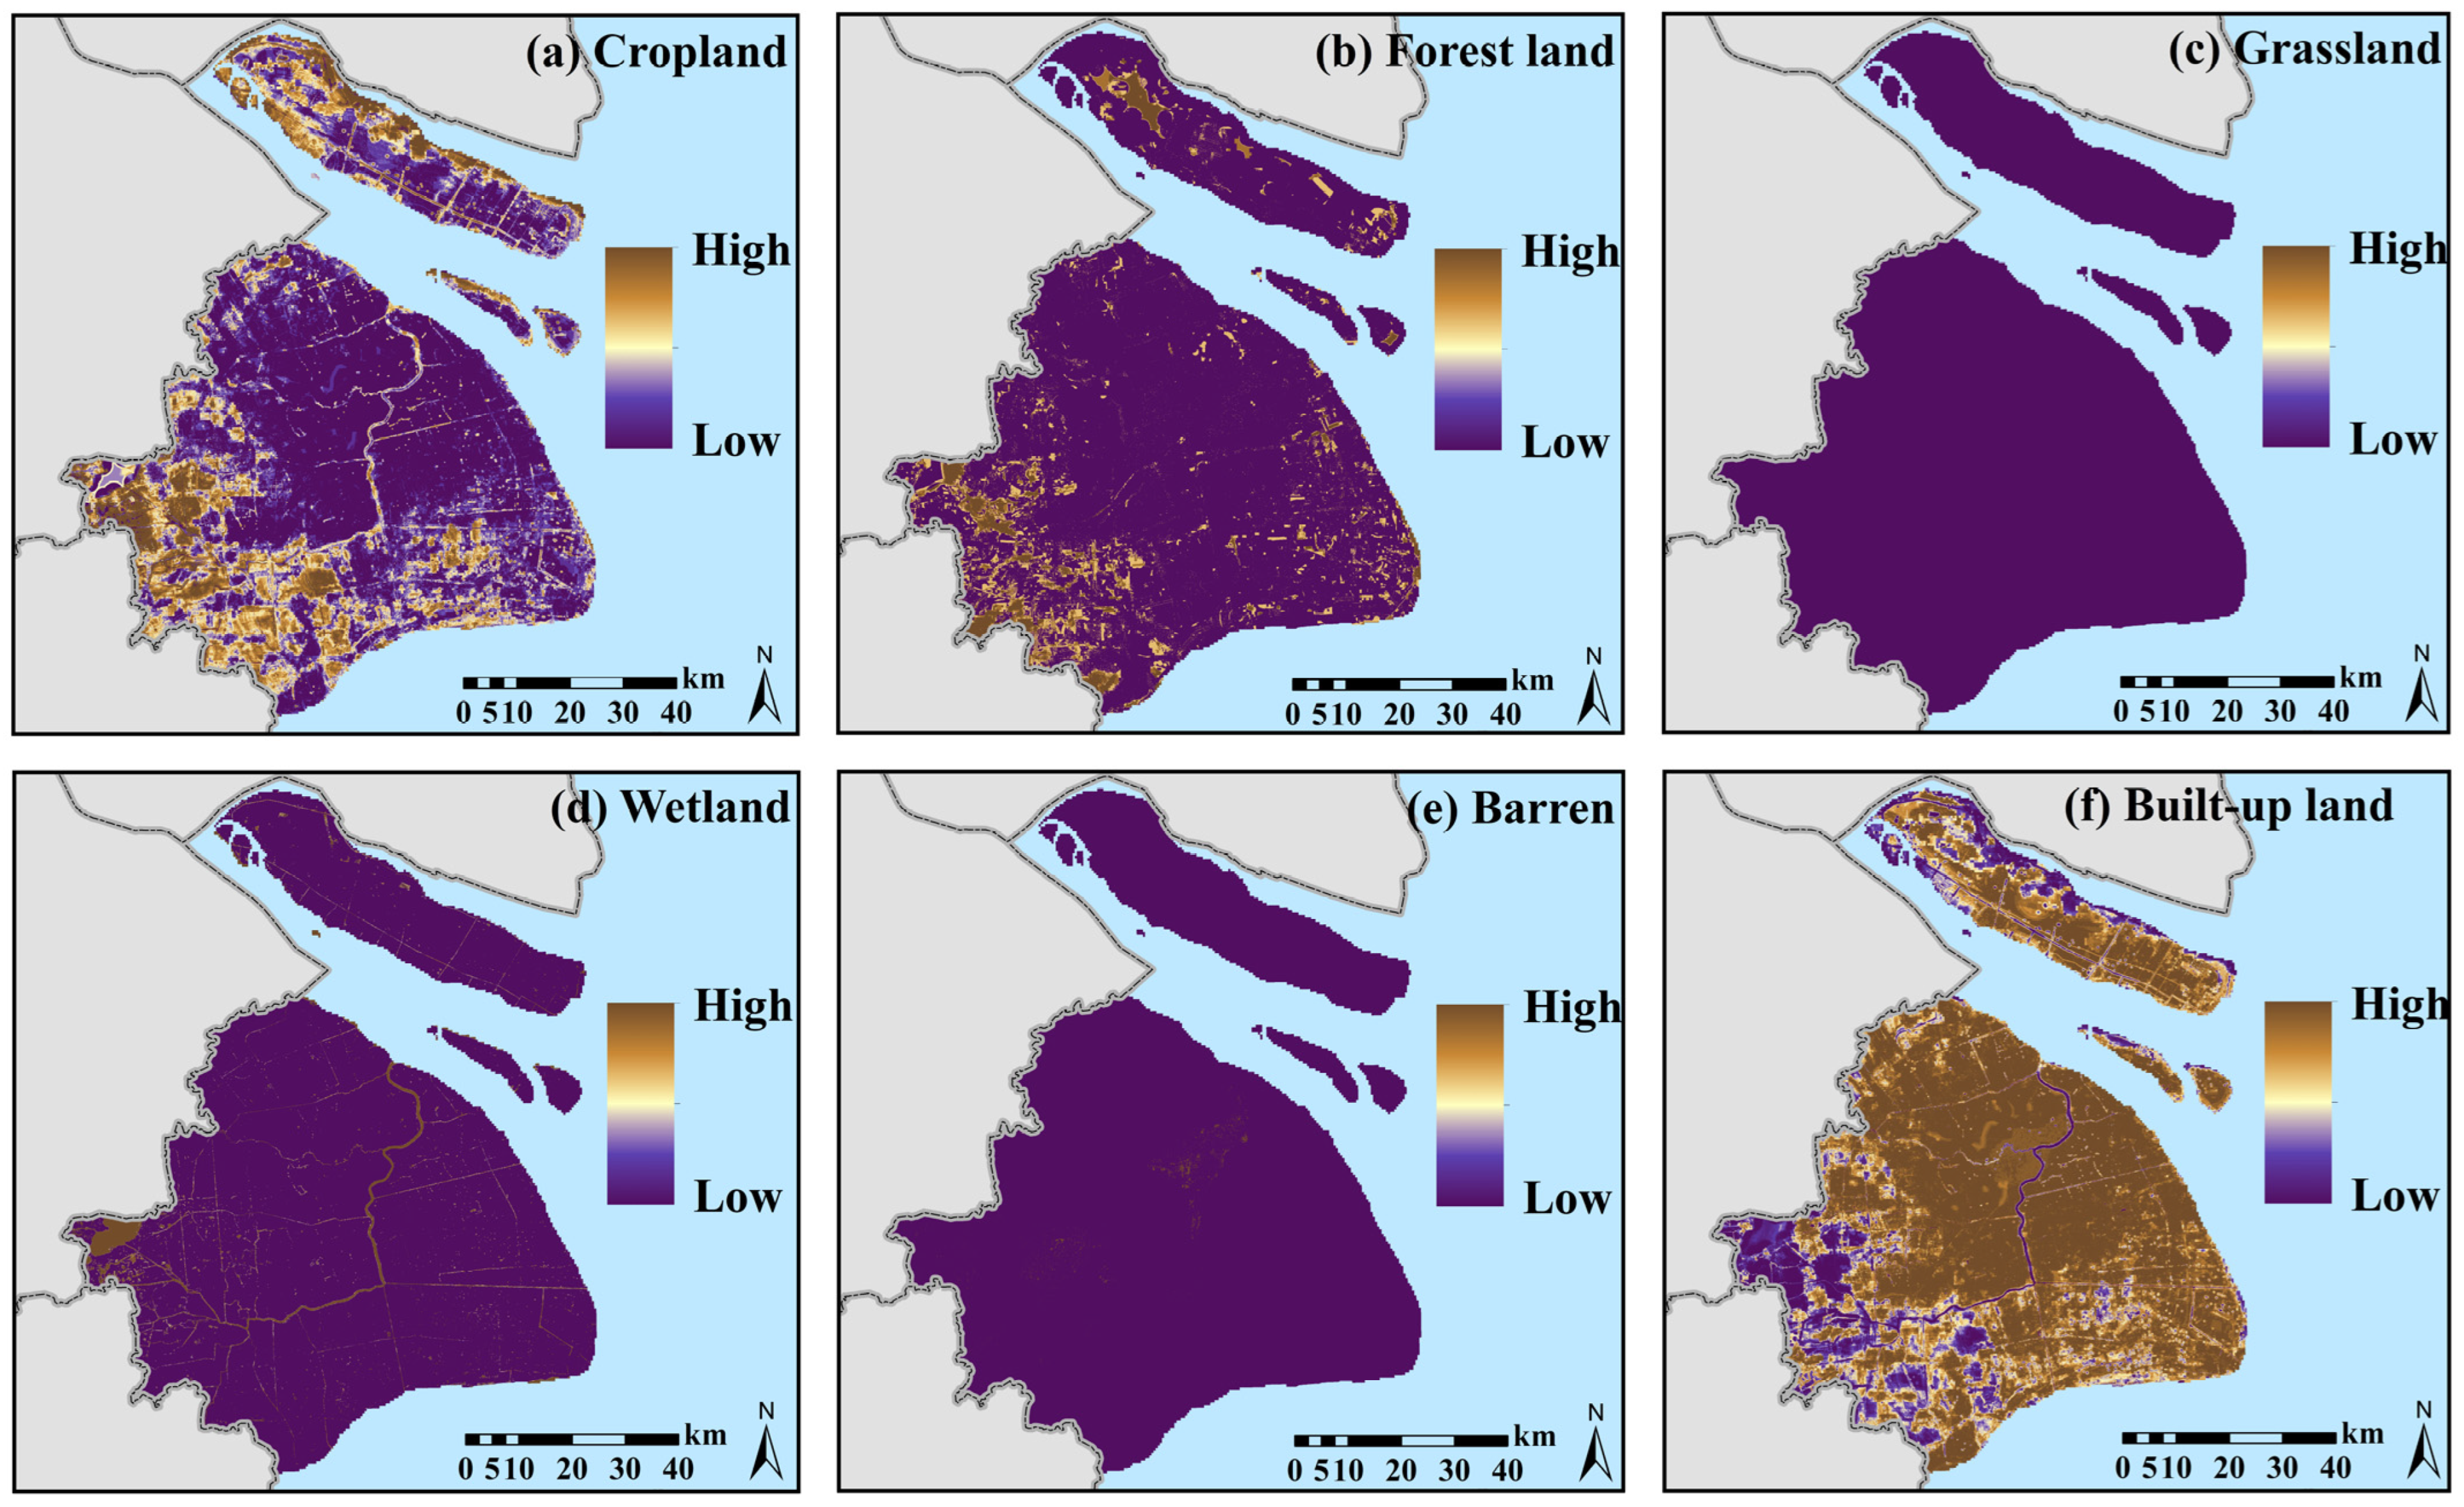
Strategic trade-offs between socioeconomic development and ecological conservation have shaped divergent growth probability distributions across ecosystem types. Owing to the intense urban expansion in the last 15 years, the high-probability growth area of built-up land covered almost the entire city of Shanghai, and only the southwestern part of the city and the northern side of Chongming Island had a lower probability of growth (Figure 5f). This implies that built-up land has caused large-scale encroachment on other land use types. Owing to the favorable environment for agricultural production, such as topography and irrigation, the high-probability growth areas of cropland were mainly located in the southwest and south of the city, as well as on the northern side of Chongming Island (Figure 5a). However, the growth probabilities of grassland and barren land were generally low across the city (Figure 5c,e). The high-probability growth areas for wetlands were mainly distributed along both sides of the water system throughout the city, especially in the densely networked area around the Dianshan Lake (Figure 5d). The high-probability growth areas for forestland were concentrated in the northwestern part of Chongming Island and the southwestern part of the city, with a scattered distribution of numerous high-probability growth areas in the eastern part of Pudong New District (Figure 5b).

3.3. Land Use Distribution Patterns Under Different Development Scenarios

Figure 6a–c shows the land-use distribution patterns of Shanghai in 2035 under different development scenarios. Under the IDS (Figure 6a), the area of built-up land expanded to 3035.66 km2, an increase of 22.75% compared with 2020. Under the influence of the expansion of built-up land, cropland and wetland have been continuously encroached upon, and the area has decreased by 467.15 km2 and 95.85 km2, respectively, compared to that in 2020, with a decrease of 11.18% and 8.01%, respectively. Although the proportion of forest area was relatively low, it increased by 5.26% under IDS, indicating that the city’s forestland has the potential for restoration. Under the CPS (Figure 6b), the expansion trend of built-up land has been suppressed to some extent, with a decrease of 10.58 km2 compared to 2020. The cropland, forestland, and wetland areas recovered by 0.22%, 2.41%, and 0.11%, respectively. The re-greening of the barren area was significantly effective, with the area of barren land reduced by 27.94%. Under the EDS (Figure 6c), in order to achieve the predetermined goals of the ‘Shanghai Ecological Space Special Plan (2018–2035)’ and the ‘Shanghai Territorial Spatial Ecological Restoration Special Plan (2021–2035)’, a large amount of built-up land and cropland have been transformed into forestland and wetlands. The level of intensification of built-up land and the quality of cropland have been further improved. Compared to 2020, the areas of built-up land and cropland decreased by 6.34% and 10.10%, respectively. The added 491.39 km2 of forestland is mainly distributed in the northwestern part of Chongming Island and the southwestern part of the city. The added 87.47 km2 wetland further strengthened the connectivity of the city’s water system.

3.4. Differences in Ecosystem Service Values Under Various Land Development Scenarios

The results showed that the value of ecosystem services under the three scenarios of IDS, CPS, and EDS was CNY 153,520.78 million, CNY 172,777.98 million, and CNY 189,240.29 million, respectively. Compared with the status quo, the value of ecosystem services under IDS decreased by 11.02%, and the value of ecosystem services under CPS and EDS increased by 0.14% and 9.69%, respectively (Table S3). The high- and medium-to-high-value areas under EDS were significantly larger than those under CPS and IDS (Figure 6d–f). Under IDS, the high- and medium-to-high-value areas shrank further compared to the status quo, influenced by the degradation of wetlands, grasslands, and cropland (Figure 4e and Figure 6d). Under CPS, the median value areas of ecosystem service values recovered significantly as influenced by cropland restoration, but there was no significant change in the high- and medium-to-high-value areas (Figure 4e and Figure 6e). Under EDS, forest and wetland areas were restored on a large scale, built-up land was further intensified, and the high- and medium-to-high-value areas expanded significantly compared to the status quo (Figure 4e and Figure 6f).
Under IDS, the values of SR, NP, and PP increased slightly, whereas all other ecosystem values were smaller than the status quo. WC, FM, and AP exhibited the largest decreases of 16.76%, 11.79%, and 10.47%, respectively. Under CPS, only the values of SR, NP, and PP were less than the status quo, whereas the other ecosystem services showed slight increases to varying degrees. Under EDS, all ecosystem service values were better than the status quo, with WC and CR showing the largest increases compared to the status quo at 10.37% and 10.07%, respectively (Table S3).
As there was no significant change in the topographic factors that most significantly affected SR, NP, and PP, there was no significant difference in the spatial distribution of the supply capacity of these three services under the different development scenarios (Figure 7, Figure 8 and Figure 9). The spatial distribution of high-value and medium-to-high-value areas for the supply capacity of other ecosystem services showed that EDS was greater than CPS and IDS. Under the EDS, large areas of medium-to-high-value and high-value areas of various ecosystem services were restored in the northwestern part of Chongming Island, the southwestern part of the city, and the eastern part of the Pudong New Area compared with the status quo (Figure 9 and Figure S6), whereas under the CPS, the spatial distribution pattern of the value of various ecosystem services did not significantly change compared with the status quo (Figure 8 and Figure S6). Under IDS, the high- and medium-to-high-value areas of the supply capacity of all ecosystem services decreased significantly (Figure 7 and Figure S6).

3.5. Land Re-Naturalization Pathways Under Optimal Development Scenarios

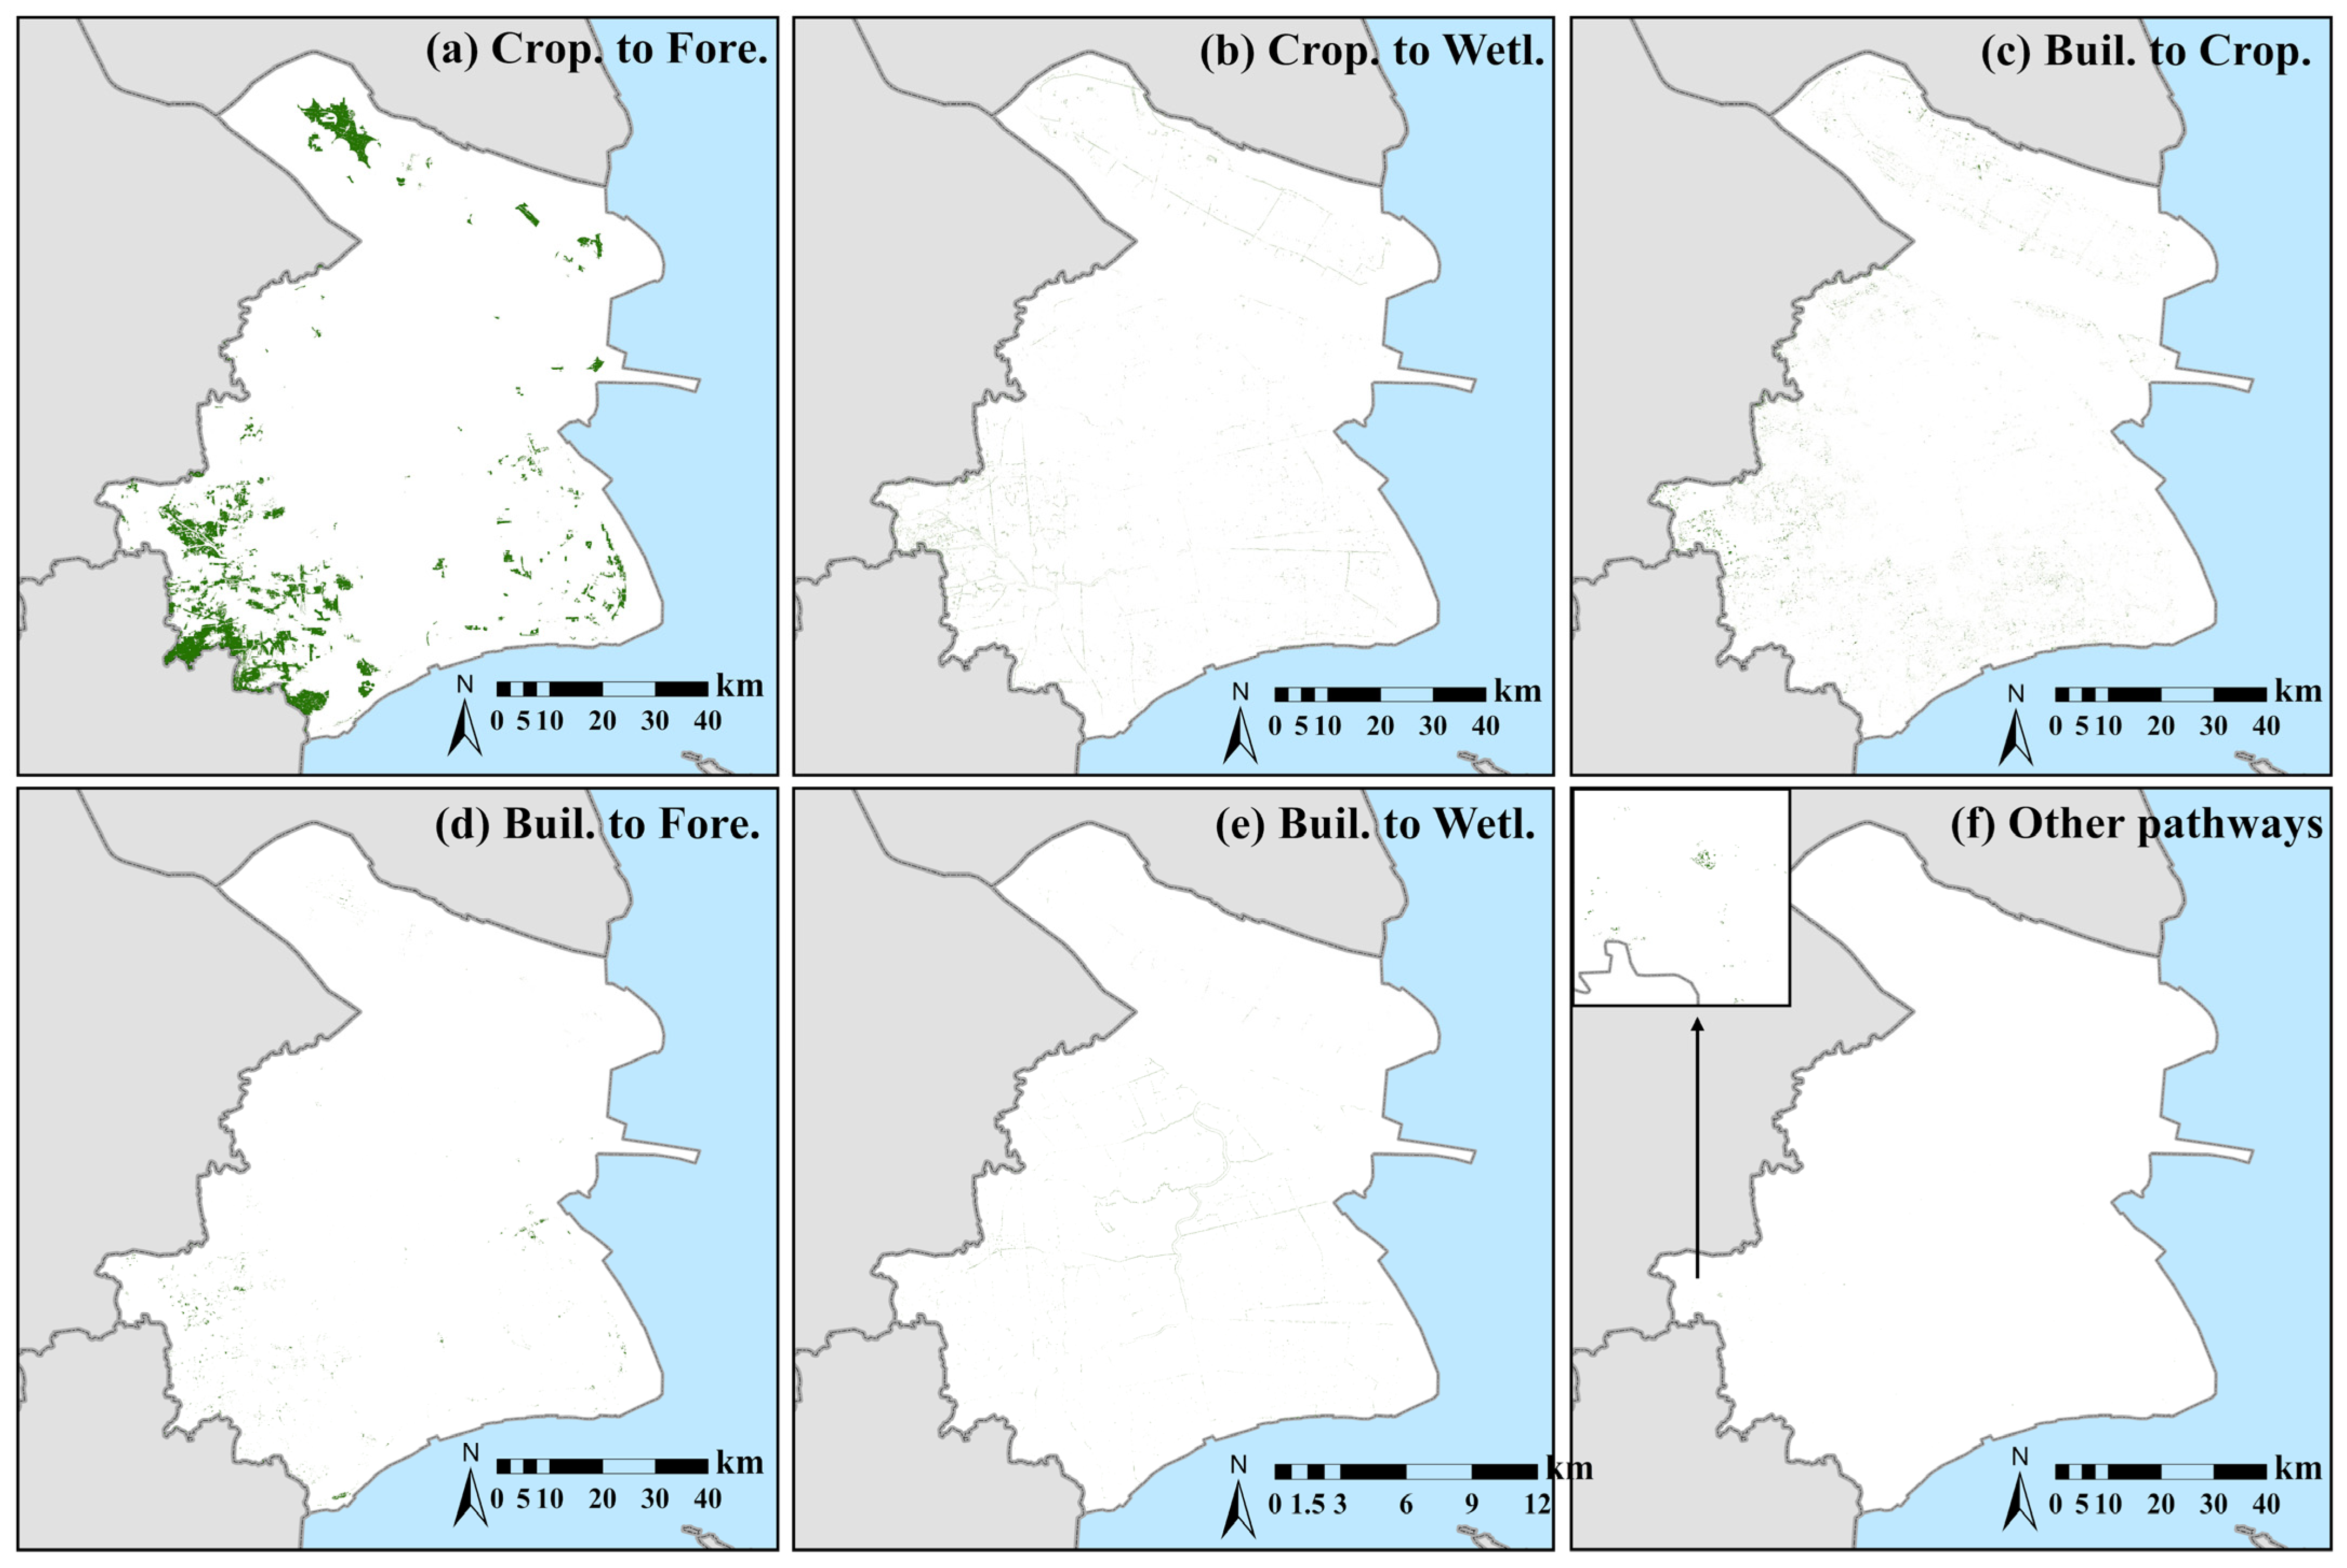
Under the ecological development scenario, the ecosystem service value of Shanghai was superior to that of the other scenarios and the status quo. Therefore, this study used the land use distribution pattern under EDS as a re-naturalization target. It was statistically found that the ecosystem service value supply capacity of each land use type in 2020, from highest to lowest, are as follows: wetlands at 66.09 CNY/m2, forestland at 32.76 CNY/m2, croplands at 21.42 CNY/m2, grasslands at 18.28 CNY/m2, barren land at 9.15 CNY/m2, and built-up land at 2.02 CNY/m2. Therefore, we conducted a land use matrix analysis of the land use data for the year 2020 and EDS and found 12 re-naturalization pathways that can enhance ecosystem service values: cropland to forestland, cropland to wetland, forestland to wetland, grassland to cropland, grassland to forestland, grassland to wetland, grassland to cropland, grassland to forestland, grassland to wetland, barren land to cropland, barren land to forestland, barren land to wetland, built-up land to cropland, built-up land to forestland, and built-up land to wetlands. The total area of all re-naturalization pathways was 686.88 km2 (Figure 10).
The results showed that, among the 12 re-naturalization pathways, the cropland to forestland and built-up land to cropland had the highest proportions of area, accounting for 67.88% and 15.02%, respectively. The cropland to forestland pathway was mainly distributed in the northwestern part of Chongming Island and the southwestern part of the city (Figure 10a), whereas the built-up land to cropland pathway was widely distributed in the southern part of the city and throughout Chongming Island (Figure 10c). Proportions of crop areas to wetland, built-up land to forestland, and built-up land to wetland pathways were 9.18%, 3.91%, and 3.90%, respectively. The cropland to wetland and built-up land to wetland pathways were mainly distributed around the water system throughout the city (Figure 10b,e), whereas the built-up land to forestland pathway was primarily located in rural areas outside the city center (Figure 10d). Other re-naturalization pathways accounted for less than 0.1% of the area, with insignificant spatial distribution, concentrated in the Dianshan Lake area in the western part of the city (Figure 10f).

4. Discussion

For developing countries, relying on geographical advantages and policy support can achieve urbanization in a short period to enhance the level of regional socio-economic development. However, the early land development model, which prioritized the economy, did not give due importance to the protection of ecological spaces. This has led to frequent ecological and environmental issues, such as high temperatures, flooding, and pollution, which seriously threaten the overall ecological security of cities [12,13,18] and sustainable socio-economic development in the future. Moreover, the developed built-up land was less intensive, and the land utilization efficiency was lower. Against the backdrop of dwindling undeveloped land, in order to meet the city’s continued economic growth and population influx in the future, there is an urgent need for policymakers to adopt targeted ecological planning to guide citywide ecological restoration and improve the efficiency of built-up land.
As China’s largest international economic center and an important international financial center, Shanghai has made remarkable progress in the past 20 years. At the same time, the ecological space was seriously degraded, with cropland and wetland areas decreasing by 17.74% and 18.02%, respectively. This study found that the value of ecosystem services in Shanghai decreased by 19.28% between 2000 and 2020, with an average decrease of 5.21% over five years. The four indicators that are highly related to the health and safety of urban residents and industrial production—water conservation, flood mitigation, climate regulation, and air purification—showed a declining trend. Xu Xin [62] and Lan Yang [63] similarly found a systematic decreasing trend in their study about the ecosystem services in Shanghai. Moreover, the high-value and medium-to-high-value areas of ecosystem service supply capacity are shrinking in spatial distribution, which greatly threatens the future sustainable socio-economic development of Shanghai. However, the urbanization rate of Shanghai reached 89.46% by 2023, and the expansion of built-up land was close to saturation. Facing future development and ecological restoration pressures, Shanghai’s urban construction model urgently needs to change from traditional incremental development with economic priority to stock optimization with efficiency priority.
Although Shanghai has formulated the Shanghai Ecological Space Special Plan (2018–2035) and the Shanghai Territorial Space Ecological Restoration Special Plan (2021–2035), there is a lack of clear pathways for the restoration of ecological spaces and the intensification of built-up land. The concept of urban re-naturalization, which advocates the reconstruction of natural urban processes and the enhancement of the wild characteristics of the landscape through the reduction of human interference or moderate restoration measures [24], is a highly effective and sustainable ecological restoration pathway suitable for mitigating the ecological problems faced by Shanghai when combined with land use planning. However, future patterns of land use are the result of the dual influence of historical change patterns and policy interventions. Currently, there is a lack of methodological systems for evaluating the effectiveness of land-use planning and identifying areas suitable for re-naturalization. Brom et al. proposed a ‘Decision Support Tool’ that integrates remote sensing, modeling, weighting, and stakeholders. The framework effectively applied spatialization results to guide the conservation and restoration of urban ecological spaces by assessing six benefits with significant ecological, social, and economic impacts [64]. Lanfranchi et al. proposed to prioritize project areas for green infrastructure development through risk assessment at the project scale [65]. This paper further considers the influence of historical patterns of land use change and local planning documents on the basis of the ecological benefits assessment. By integrating ecosystem service valuation, multi-scenario simulation of land use based on historical patterns and policy constraints, and the land use transfer matrix, this study proposes a spatial decision-support framework to determine the optimal land use distribution pattern that supports sustainable socio-economic development from the perspective of ecological benefits and maps different re-naturalization pathways from the perspectives of ecological restoration and land stock optimization.
We found that the ecosystem service supply capacity of wetlands and forests in Shanghai is 66.09 CNY/m2 and 32.76 CNY/m2, respectively, which are significantly higher than other land use types. Among the three land-use development scenarios presented in this study, the land-use distribution pattern under EDS provides the highest ecosystem service value because the two types of ecological land, forests and wetlands, which have a higher ecosystem service value provisioning capacity, are restored on a large scale. Moreover, for the total value of ecosystem services and most of the sub-ecosystem service indicators, the distribution areas of high and medium-to-high supply capacity areas were better than those of the status quo and the other two development scenarios. This result suggests that, in the future ecological planning practices of Shanghai, policymakers should prioritize the intensification process of built-up land, actively develop vertical space, and increase economic output efficiency per unit area. This series of measures has proven effective in many applications, such as three-dimensional greening and multifunctional land construction [66,67,68]. Furthermore, it is essential to steadily promote the effective implementation of the ‘Returning Farmland to Forest’ policies. Similar to the findings of this study, some studies have also found that the ecosystem service supply capacity of forests is significantly higher than that of croplands [69,70]. The land use distribution pattern under the ecological development scenario is not only in line with the historical pattern of change in land use types, but also with reference to the content of the relevant ecological plan of Shanghai. Therefore, this study considers the land-use distribution pattern under this scenario as a target for land re-naturalization, which is rational and provides a useful reference. Based on the principle of enhancing the value of ecosystem services, we identified and mapped 12 re-naturalization paths, covering a total area of 686.88 km2. Cropland to forest and built-up to cropland had the highest proportions of area, accounting for 67.88% and 15.02%, respectively.
For policymakers, ecological planning is a common method to guide the sustainable development of land use in the future, but how to achieve the planning objectives is the difficult point. Within the framework proposed in this paper, policymakers can integrate historical land-use change patterns, ecosystem services, and ecological planning to map spatial land-use distribution patterns in line with planning objectives. Globally, many cities in developed countries, as well as developed regions in developing countries, are facing difficult trade-offs between development and conservation, and the framework proposed in this paper can inform the implementation of sustainable development strategies in these cities. However, urban planning is a comprehensive, systematic, and integrated work that covers municipal, transportation, electricity, water conservancy, and many other special plans, which will greatly affect future land use distribution patterns. This study considered only two comprehensive planning initiatives and did not incorporate specific planning into the methodological framework. In addition, many studies have demonstrated the existence of spatial flows and mismatches between the supply and demand for ecosystem services. Ecosystem service inflow areas are under less pressure for ecological restoration and re-naturalization, and low-demand and low-supply areas can be developed more intensively. The optimal land use distribution pattern should be determined based only on optimal ecosystem service value scenarios oriented by the relevant planning and driving factors. In future studies, the supply and demand of ecosystem services, ecosystem service flow, and various special urban planning can be incorporated into the spatial decision-support framework to determine the spatial distribution pattern of land use and the re-naturalization strategy that is more in line with actual needs.

5. Conclusions

Stable ecosystem service provision can guarantee the sustainable development of urban socio-economics, especially for highly urbanized and ecological space degradation areas such as Shanghai. The reduction of ecosystem service provisioning capacity can seriously threaten the life and health of local residents and the safety of industrial production. In the face of predictable economic and population growth, striking a balance between land use demand and ecological benefits is a challenge for policymakers. We integrated the value of ecosystem services, multi-scenario land use simulation, and land use transfer matrix to propose a decision-support framework to determine the optimal land use distribution pattern to support sustainable socio-economic development and map different re-naturalization pathways from the perspectives of ecological restoration and land stock optimization. The intense expansion of built-up land in Shanghai over the past 20 years has seriously encroached cropland and wetland space, with the area declining by 17.74% and 18.02%, respectively. The ecosystem services value is generally declining, from CNY 213,745.40 million in 2000 to CNY 172,528.70 million in 2020, with an average decrease of 5.21% every five years. The high- and medium-to-high-value areas for ecosystem services were also shrinking spatially. Among the three predefined land use development scenarios in 2035, the land use distribution pattern under the EDS produced the highest ecosystem service value of CNY 189,240.29 million, which was 9.69%, 23.27%, and 9.53% higher than the status quo, the IDS, and the CPS, respectively. Under EDS, two types of high-quality ecological spaces, wetlands and forests, were significantly restored compared with the status quo. The spatial distribution of high- and medium-to high-value areas for ecosystem services under the EDS scenario is much larger, and built-up land is further intensified. Targeting the land use distribution pattern under the EDS, we can adopt 12 types of re-naturalization pathways totaling 686.88 km2. Among them, the cropland to forest and built-up land to cropland pathways accounted for a relatively high percentage of the total area, accounting for 67.88% and 15.02% of all re-naturalized areas, respectively. In the future, the study also plans to further integrate urban-specific planning and ecosystem service flows into a spatial decision-support framework to form more comprehensive re-naturalization strategies.

Supplementary Materials

The following supporting information can be downloaded at: https://www.mdpi.com/article/10.3390/land14050917/s1, Figure S1: Changes in the total value of ecosystem services (Million CNY); Figure S2: Distribution of ecosystem services value supply capacity in 2000. (a) Water conservation. (b) Flood mitigation. (c) Carbon sequestration. (d) Sedimentation reduction. (e) Nitrogen purification. (f) Phosphorus purification. (g) Climate regulation. (h) Air purification. (i) Oxygen release; Figure S3: Distribution of ecosystem service value supply capacity in 2005. (a) Water conservation. (b) Flood mitigation. (c) Carbon sequestration. (d) Sedimentation reduction. (e) Nitrogen purification. (f) Phosphorus purification. (g) Climate regulation. (h) Air purification. (i) Oxygen release; Figure S4: Distribution of ecosystem services value supply capacity in 2010. (a) Water conservation. (b) Flood mitigation. (c) Carbon sequestration. (d) Sedimentation reduction. (e) Nitrogen purification. (f) Phosphorus purification. (g) Climate regulation. (h) Air purification. (i) Oxygen release; Figure S5: Distribution of ecosystem service value supply capacity in 2015. (a) Water conservation. (b) Flood mitigation. (c) Carbon sequestration. (d) Sedimentation reduction. (e) Nitrogen purification. (f) Phosphorus purification. (g) Climate regulation. (h) Air purification. (i) Oxygen release; Figure S6: Distribution of ecosystem service value supply capacity in 2020. (a) Water conservation. (b) Flood mitigation. (c) Carbon sequestration. (d) Sedimentation reduction. (e) Nitrogen purification. (f) Phosphorus purification. (g) Climate regulation. (h) Air purification. (i) Oxygen release; Table S1: Calculation method; Table S2: Data used for ES assessment [71,72]; Table S3: Value of various ecosystem services in different years (million CNY).

Author Contributions

Conceptualization, C.S., K.D. and W.C.; methodology, C.S., K.D. and W.C.; software, C.S. and W.C.; validation, W.C., C.S. and L.L.; formal analysis, W.C. and K.D.; investigation, C.S., Z.C. and W.C.; resources, W.C.; data curation, Z.C., K.D. and L.L.; writing—original draft preparation, C.S.; writing—review and editing, W.C.; visualization, Z.C. and L.L.; supervision, W.C.; project administration, W.C.; funding acquisition, W.C. All authors have read and agreed to the published version of the manuscript.

Funding

This research was funded by the National Natural Science Foundation of China (Grant No. 72104232), Research on the Ecological Element Assessment System for the Project “Ecological Element Identification and Tracking Monitoring in the Yangtze River Delta Demonstration Region”, commissioned by the Shanghai Urban Planning and Design Research Institute, and “Research on Re-naturalization and Enhancement of Ecological Value in Rural and Suburban Areas of Shanghai Based on BEC Multidimensional Methods”, a soft science research project (Grant No. 24692116500) under the 2024 “Science and Technology Innovation Action Plan” of Shanghai.

Data Availability Statement

The data are contained within the article.

Acknowledgments

The authors gratefully acknowledge the support of the Research Institute and the State Key Laboratory of Urban and Regional Ecology, the Research Center for Eco-Environment Sciences, and the Center for Modern Chinese City Studies & Institute of Urban Development, East China Normal University.

Conflicts of Interest

The authors declare no conflicts of interest.

References

  1. Mahtta, R.; Fragkias, M.; Güneralp, B.; Mahendra, A.; Reba, M.; Wentz, E.A.; Seto, K.C. Urban land expansion: The role of population and economic growth for 300+ cities. npj Urban Sustain. 2022, 2, 5. [Google Scholar] [CrossRef]
  2. UN-Habitat. World Cities Report 2022: Envisaging the Future of Cities; UN-Habitat: Nairobi, Kenya, 2022. [Google Scholar]
  3. Saiedlue, S.; Hosseini, S.B.; Yazdanfar, S.A.; Maleki, S.N. Enhancing Quality of Life and Improving Living Standards through the Expansion of Open Space in Residential Complex. Procedia-Soc. Behav. Sci. 2015, 201, 308–316. [Google Scholar] [CrossRef]
  4. Yang, L.; Chen, W.; Fang, C.; Zeng, J. How does the coordinated development of population urbanization and land urbanization affect residents’ living standards? Empirical evidence from China. Cities 2024, 149, 104922. [Google Scholar] [CrossRef]
  5. Chen, H.; Yu, J.; Ma, S.; Zhang, W. Urban scale, production efficiency, and dynamic development paths. Cities 2023, 143, 104566. [Google Scholar] [CrossRef]
  6. Zhang, H.; Zheng, J.; Hunjra, A.I.; Zhao, S.; Bouri, E. How does urban land use efficiency improve resource and environment carrying capacity? Socio-Econ. Plan. Sci. 2024, 91, 101760. [Google Scholar] [CrossRef]
  7. Gao, Y.; Shi, X.; Zhang, H.; Tang, R. Optimized Resource Allocation for Sustainable Development in Beijing: Integrating Water, Land, Energy, and Carbon Nexus. Land 2024, 13, 1723. [Google Scholar] [CrossRef]
  8. Hu, Y.n.; Connor, D.S.; Stuhlmacher, M.; Peng, J.; Turner Ii, B.L. More urbanization, more polarization: Evidence from two decades of urban expansion in China. npj Urban Sustain. 2024, 4, 33. [Google Scholar] [CrossRef]
  9. Cai, W.; Shu, C.; Lin, L. Integrating Ecosystem Service Values into Urban Planning for Sustainable Development. Land 2024, 13, 1985. [Google Scholar] [CrossRef]
  10. Wei, H.; Zhang, Y. Analysis of Impact of Urbanization on Environmental Quality in China. China World Econ. 2017, 25, 85–106. [Google Scholar] [CrossRef]
  11. Aghaloo, K.; Sharifi, A.; Habibzadeh, N.; Ali, T.; Chiu, Y.-R. How nature-based solutions can enhance urban resilience to flooding and climate change and provide other co-benefits: A systematic review and taxonomy. Urban For. Urban Green. 2024, 95, 128320. [Google Scholar] [CrossRef]
  12. Lin, X.; Wang, Y.; Song, L. Urbanization Amplified Compound Hot Extremes Over the Three Major Urban Agglomerations in China. Geophys. Res. Lett. 2024, 51, e2023GL106644. [Google Scholar] [CrossRef]
  13. Yan, H.; Li, Y.; Xing, Y.; Chen, X.; Guo, X.; Yin, Y.; Yu, W.; Huang, M.; Zhuang, J. Increasing human-perceived temperature exacerbated by urbanization in China’s major cities: Spatiotemporal trends and associated driving factors. Sustain. Cities Soc. 2025, 118, 106034. [Google Scholar] [CrossRef]
  14. Feng, R.; Wang, F.; Liu, S.; Qi, W.; Zhengchen, R.; Wang, D. Synergistic effects of urban forest on urban heat island-air pollution-carbon stock in mega-urban agglomeration. Urban For. Urban Green. 2025, 103, 128590. [Google Scholar] [CrossRef]
  15. Elliot, T.; Babí Almenar, J.; Rugani, B. Modelling the relationships between urban land cover change and local climate regulation to estimate urban heat island effect. Urban For. Urban Green. 2020, 50, 126650. [Google Scholar] [CrossRef]
  16. Ba, W.; Wang, D.; Gong, B.; Dai, Y.; Yang, Z.; Liu, Z. Urban water scarcity in China: A systematic review of research advances and future directions. Appl. Geogr. 2023, 159, 103069. [Google Scholar] [CrossRef]
  17. Li, W.; Hai, X.; Han, L.; Mao, J.; Tian, M. Does urbanization intensify regional water scarcity? Evidence and implications from a megaregion of China. J. Clean. Prod. 2020, 244, 118592. [Google Scholar] [CrossRef]
  18. Liang, L.; Wang, Z.; Li, J. The effect of urbanization on environmental pollution in rapidly developing urban agglomerations. J. Clean. Prod. 2019, 237, 117649. [Google Scholar] [CrossRef]
  19. Yang, L.; Ma, K.M.; Guo, Q.H.; Zhao, J.Z. Impacts of the urbanization on waters non-point source pollution. Huan Jing Ke Xue 2004, 25, 32–39. [Google Scholar]
  20. Simonson, W.D.; Miller, E.; Jones, A.; García-Rangel, S.; Thornton, H.; McOwen, C. Enhancing climate change resilience of ecological restoration—A framework for action. Perspect. Ecol. Conserv. 2021, 19, 300–310. [Google Scholar] [CrossRef]
  21. Prodanovic, V.; Bach, P.M.; Stojkovic, M. Urban nature-based solutions planning for biodiversity outcomes: Human, ecological, and artificial intelligence perspectives. Urban Ecosyst. 2024, 27, 1795–1806. [Google Scholar] [CrossRef]
  22. Frolking, S.; Mahtta, R.; Milliman, T.; Esch, T.; Seto, K.C. Global urban structural growth shows a profound shift from spreading out to building up. Nat. Cities 2024, 1, 555–566. [Google Scholar] [CrossRef]
  23. Russo, A.; Sardeshpande, M.; Rupprecht, C.D.D. Urban rewilding for sustainability and food security. Land Use Policy 2025, 149, 107410. [Google Scholar] [CrossRef]
  24. Perino, A.; Pereira, H.M.; Navarro, L.M.; Fernández, N.; Bullock, J.M.; Ceaușu, S.; Cortés-Avizanda, A.; van Klink, R.; Kuemmerle, T.; Lomba, A.; et al. Rewilding complex ecosystems. Science 2019, 364, eaav5570. [Google Scholar] [CrossRef]
  25. Tang, B.; Wang, H.; Liu, J.; Zhang, W.; Zhao, W.; Cheng, D.; Zhang, L.; Jiao, L. Identification of ecological restoration priority areas integrating ecological security and feasibility of restoration. Ecol. Indic. 2024, 158, 111557. [Google Scholar] [CrossRef]
  26. Bian, H.; Li, M.; Deng, Y.; Zhang, Y.; Liu, Y.; Wang, Q.; Xie, S.; Wang, S.; Zhang, Z.; Wang, N. Identification of ecological restoration areas based on the ecological safety security assessment of wetland-hydrological ecological corridors: A case study of the Han River Basin in China. Ecol. Indic. 2024, 160, 111780. [Google Scholar] [CrossRef]
  27. Jurjonas, M.; May, C.; Cardinale, B.; Kyriakakis, S.; Pearsall, D.; Doran, P. The perceived ecological and human well-being benefits of ecosystem restoration. People Nat. 2023, 6, 4–19. [Google Scholar] [CrossRef]
  28. Fedele, G.; Locatelli, B.; Djoudi, H. Mechanisms mediating the contribution of ecosystem services to human well-being and resilience. Ecosyst. Serv. 2017, 28, 43–54. [Google Scholar] [CrossRef]
  29. LopezDeAsiain, M.; Castro Bonaño, J.M.; Borrallo-Jiménez, M.; Mora Esteban, R. Urban socio-ecosystem renewal: An ecosystem services assessment approach. Int. J. Environ. Sci. Technol. 2024, 21, 2445–2464. [Google Scholar] [CrossRef]
  30. Ouyang, Z.; Zheng, H.; Xiao, Y.; Polasky, S.; Liu, J.; Xu, W.; Wang, Q.; Zhang, L.; Xiao, Y.; Rao, E.; et al. Improvements in ecosystem services from investments in natural capital. Science 2016, 352, 1455–1459. [Google Scholar] [CrossRef]
  31. Costanza, R.; d’Arge, R.; de Groot, R.; Farber, S.; Grasso, M.; Hannon, B.; Limburg, K.; Naeem, S.; O’Neill, R.V.; Paruelo, J.; et al. The value of the world’s ecosystem services and natural capital. Nature 1997, 387, 253–260. [Google Scholar] [CrossRef]
  32. Pereira, P.; Inácio, M.; Pinto, L.; Kalinauskas, M.; Bogdzevic, K.; Zhao, W. Mapping ecosystem services in urban and peri-urban areas. A systematic review. Geogr. Sustain. 2024, 5, 491–509. [Google Scholar] [CrossRef]
  33. Inácio, M.; Baltranaitė, E.; Bogdzevič, K.; Kalinauskas, M.; Valença Pinto, L.; Barceló, D.; Pereira, P. Mapping and assessing the future provision of lake ecosystem services in Lithuania. J. Environ. Manag. 2024, 372, 123349. [Google Scholar] [CrossRef]
  34. Amoroso, M.M.; Chillo, V.; Enríquez, A. Sustainable timber production in afforestations: Trade-offs and synergies in the provision of multiple ecosystem services in northwest Patagonia. For. Ecol. Manag. 2024, 574, 122345. [Google Scholar] [CrossRef]
  35. Medina-Roldán, E.; Lorenzetti, R.; Calzolari, C.; Ungaro, F. Disentangling soil-based ecosystem services synergies, trade-offs, multifunctionality, and bundles: A case study at regional scale (NE Italy) to support environmental planning. Geoderma 2024, 448, 116962. [Google Scholar] [CrossRef]
  36. de Knegt, B.; Lof, M.E.; Le Clec’h, S.; Alkemade, R. Growing mismatches of supply and demand of ecosystem services in the Netherlands. J. Environ. Manag. 2025, 373, 123442. [Google Scholar] [CrossRef]
  37. Hegetschweiler, K.T.; de Vries, S.; Arnberger, A.; Bell, S.; Brennan, M.; Siter, N.; Olafsson, A.S.; Voigt, A.; Hunziker, M. Linking demand and supply factors in identifying cultural ecosystem services of urban green infrastructures: A review of European studies. Urban For. Urban Green. 2017, 21, 48–59. [Google Scholar] [CrossRef]
  38. Deng, H.; Zhou, X.; Liao, Z. Ecological redline delineation based on the supply and demand of ecosystem services. Land Use Policy 2024, 140, 107109. [Google Scholar] [CrossRef]
  39. Campos, F.S.; David, J.; Lourenço-de-Moraes, R.; Rodrigues, P.; Silva, B.; Vieira da Silva, C.; Cabral, P. The economic and ecological benefits of saving ecosystems to protect services. J. Clean. Prod. 2021, 311, 127551. [Google Scholar] [CrossRef]
  40. Vaissière, A.-C.; Levrel, H.; Hily, C.; Le Guyader, D. Selecting ecological indicators to compare maintenance costs related to the compensation of damaged ecosystem services. Ecol. Indic. 2013, 29, 255–269. [Google Scholar] [CrossRef]
  41. Cui, L.; Shi, J. Urbanization and its environmental effects in Shanghai, China. Urban Clim. 2012, 2, 1–15. [Google Scholar] [CrossRef]
  42. Tian, Z.; Cao, G.; Shi, J.; McCallum, I.; Cui, L.; Fan, D.; Li, X. Urban transformation of a metropolis and its environmental impacts. Environ. Sci. Pollut. Res. 2012, 19, 1364–1374. [Google Scholar] [CrossRef] [PubMed]
  43. Sun, X.; Li, R.; Shan, X.; Xu, H.; Wang, J. Assessment of climate change impacts and urban flood management schemes in central Shanghai. Int. J. Disaster Risk Reduct. 2021, 65, 102563. [Google Scholar] [CrossRef]
  44. Wang, G.-X.; Liu, Y.-Y. A Correlation Analysis on the Growth of Population and Economy and Its Influence on Environment in Shanghai. 2006. Available online: https://en.cnki.com.cn/Article_en/CJFDTotal-FJDL200603007.htm (accessed on 1 February 2025).
  45. Maotian, L.; Finlayson, B.; Webber, M.; Barnett, J.; Webber, S.; Rogers, S.; Chen, Z.; Wei, T.; Chen, J.; Wu, X.; et al. Estimating urban water demand under conditions of rapid growth: The case of Shanghai. Reg. Environ. Change 2017, 17, 1153–1161. [Google Scholar] [CrossRef]
  46. Gao, C.; Feng, Y.; Wang, R.; Lei, Z.; Chen, S.; Tang, X.; Xi, M. 50-Year Urban Expansion Patterns in Shanghai: Analysis Using Impervious Surface Data and Simulation Models. Land 2023, 12, 2065. [Google Scholar] [CrossRef]
  47. Shanghai Land Resources “Tenth Five-Year Plan” and 2015 Long-Term Plan. Available online: https://hd.ghzyj.sh.gov.cn/xxgk/ghjh/200812/t20081223_144260.html (accessed on 1 February 2025).
  48. Strengthening the Use Control of Land Space and Strictly Abiding by the Red Line of Arable Land Protection. Available online: https://ghzyj.sh.gov.cn/nw2396/20221107/2fefca67cfeb42f78bed8cccbba918d6.html (accessed on 1 February 2025).
  49. Qian, X.; Shen, G.; Guo, C.; Gu, H.; Zhu, Y.; Wang, Z. Source apportionment and spatial heterogeneity of agricultural non-point source pollution based on water environmental function zoning. Trans. Chin. Soc. Agric. Eng. 2011, 27, 103–108. [Google Scholar]
  50. Dashtbozorgi, F.; Hedayatiaghmashhadi, A.; Dashtbozorgi, A.; Ruiz-Agudelo, C.A.; Fürst, C.; Cirella, G.T.; Naderi, M. Ecosystem services valuation using InVEST modeling: Case from southern Iranian mangrove forests. Reg. Stud. Mar. Sci. 2023, 60, 102813. [Google Scholar] [CrossRef]
  51. Benra, F.; De Frutos, A.; Gaglio, M.; Álvarez-Garretón, C.; Felipe-Lucia, M.; Bonn, A. Mapping water ecosystem services: Evaluating InVEST model predictions in data scarce regions. Environ. Model. Softw. 2021, 138, 104982. [Google Scholar] [CrossRef]
  52. Han, B.; Ouyang, Z. The comparing and applying Intelligent Urban Ecosystem Management System (IUEMS) on ecosystem services assessment. Acta Ecol. Sin. 2021, 41, 8697–8708. [Google Scholar]
  53. Liang, X.; Guan, Q.; Clarke, K.C.; Liu, S.; Wang, B.; Yao, Y. Understanding the drivers of sustainable land expansion using a patch-generating land use simulation (PLUS) model: A case study in Wuhan, China. Comput. Environ. Urban Syst. 2021, 85, 101569. [Google Scholar] [CrossRef]
  54. Jian, L.; Xia, X.; Liu, X.; Zhang, Y.; Wang, Y. Spatiotemporal variations and multi-scenario simulation of urban thermal environments based on complex networks and the PLUS model: A case study in Chengdu central districts. Sustain. Cities Soc. 2024, 115, 105833. [Google Scholar] [CrossRef]
  55. Huang, C.; Zhou, Y.; Wu, T.; Zhang, M.; Qiu, Y. A cellular automata model coupled with partitioning CNN-LSTM and PLUS models for urban land change simulation. J. Environ. Manag. 2024, 351, 119828. [Google Scholar] [CrossRef] [PubMed]
  56. Zhang, C.; Jia, Q.; Liu, Y.; Zheng, Z.; Gao, Y.; Li, K. Evaluation and multi scenario simulation of ecosystem service value in Zhengzhou Metropolitan Area based on PLUS model. Meas. Sens. 2024, 32, 101079. [Google Scholar] [CrossRef]
  57. Shi, J.; Zhang, P.; Liu, Y.; Tian, L.; Cao, Y.; Guo, Y.; Li, J.; Wang, Y.; Huang, J.; Jin, R.; et al. Study on spatiotemporal changes of wetlands based on PLS-SEM and PLUS model: The case of the Sanjiang Plain. Ecol. Indic. 2024, 169, 112812. [Google Scholar] [CrossRef]
  58. Wang, B.; Liao, J.; Zhu, W.; Qiu, Q.; Wagn, L.; Tang, L. The weight of neighborhood setting of the FLUS model based on a historical scenario: A case study of land use simulation of urban agglomeration of the Golden Triangle of Southern Fujian in 2030. Acta Ecol. Sin. 2019, 39, 4284–4298. [Google Scholar]
  59. GB/T 43678-2024; Ecosystem Assessment—Methodology for Ecosystem Services Assessment. State Administration for Market Regulation & National Standardization Administration: Beijing, China, 2024.
  60. Shu, C.; Meng, H.; Han, B.; Yang, H.; Pan, X.; Lin, L.; Ouyang, Z. Impact of precipitation factors on gross ecosystem product. Acta Ecol. Sin. 2023, 43, 1054–1063. [Google Scholar]
  61. Cai, W.; Shu, C. Integrating System Perspectives to Optimize Ecosystem Service Provision in Urban Ecological Development. Systems 2024, 12, 375. [Google Scholar] [CrossRef]
  62. Xin, X.; Zhang, T.; He, F.; Zhang, W.; Chen, K. Assessing and simulating changes in ecosystem service value based on land use/cover change in coastal cities: A case study of Shanghai, China. Ocean Coast. Manag. 2023, 239, 106591. [Google Scholar] [CrossRef]
  63. Yang, L.; Zhou, X.; Gu, X.; Liang, Y. Impact mechanism of ecosystem services on resident well-being under sustainable development goals: A case study of the Shanghai metropolitan area. Environ. Impact Assess. Rev. 2023, 103, 107262. [Google Scholar] [CrossRef]
  64. Brom, P.; Engemann, K.; Breed, C.; Pasgaard, M.; Onaolapo, T.; Svenning, J.-C. A Decision Support Tool for Green Infrastructure Planning in the Face of Rapid Urbanization. Land 2023, 12, 415. [Google Scholar] [CrossRef]
  65. Lanfranchi, M.; Giannetto, C.; Pascale, A.; Remus, H. An Application of Qualitative Risk Analysis as a Tool Adopted by Public Organizations for Evaluating “Green Projects”. Amfiteatru Econ. 2015, 17, 872–890. [Google Scholar]
  66. Dong, J.; Zuo, J.; Li, C.; Fan, D.; Wu, Y. Research on ecological spatial planning method in high-density area under the urban regeneration vision: A case study of a three-dimensional greening plan on Xiamen Island. Acta Ecol. Sin. 2018, 38, 4412–4423. [Google Scholar]
  67. Wang, Y.; Dong, R.; Xiao, Y.; Yue, M.; Wang, P.; Duan, C.; Liu, C.e. Analysis of the connotation and function of urban three-dimensional greening based on landsenses ecology:a case study of Shenzhen. Acta Ecol. Sin. 2020, 40, 8085–8092. [Google Scholar]
  68. Wang, F.; Tang, P. Multi-function Performance Evaluation on Urban Construction Land Considering Regional Development Stage Differences: A Case Study on Urban Agglomeration in Pearl River Delta. China Land Sci. 2020, 34, 87–95. [Google Scholar]
  69. Huang, H.; Lei, M.; Kong, X.; Wen, L. Spatial Pattern Change of Cultivated Land and Response of Ecosystem Service Value in China. Res. Soil Water Conserv. 2022, 29, 339–348. [Google Scholar]
  70. Zhao, T.; Ou, Y.; Zheng, H.; Wang, X.; Miao, H. Forest ecosystem services and their valuation in China. J. Nat. Resour. 2004, 19, 480–491. [Google Scholar]
  71. Tao, Y.; Li, Z.; Sun, X.; Qiu, J.; Pueppke, S.G.; Ou, W.; Guo, J.; Tao, Q.; Wang, F. Supply and demand dynamics of hydrologic ecosystem services in the rapidly urbanizing Taihu Lake Basin of China. Appl. Geogr. 2023, 151, 102853. [Google Scholar] [CrossRef]
  72. Wang, L.; Xiao, Y.; Ouyang, Z.; Wei, Q.; Bo, W.; Zhang, J.; Ren, L. Gross ecosystem product accounting in the national key ecological function area: An example of Arxan. China Popul. Resour. Environ. 2017, 27, 146–154. [Google Scholar]
Figure 1. Location map. (a) The red area is the location of Jiangsu, Zhejiang, and Shanghai provinces within China. (b) The red area is the location of Shanghai. (c) Land use distribution pattern of Shanghai in 2020. (d) Spatial distribution of elevation in Shanghai (m). Projection information: CGCS2000_3_Degree_GK_CM_120E.
Land 14 00917 g001
Figure 2. A spatial decision-support framework for mapping re-naturalization pathways based on ecosystem service value.
Land 14 00917 g002
Figure 3. Changes in ecosystem service value (million CNY). (a) Water conservation. (b) Flood mitigation. (c) Carbon sequestration. (d) Sedimentation reduction. (e) Nitrogen purification. (f) Phosphorus purification. (g) Climate regulation. (h) Air purification. (i) Oxygen release.
Land 14 00917 g003
Figure 4. Changes in the spatial distribution pattern of ecosystem service value (2000–2020). (a) The spatial distribution of ecosystem service value in 2000. (b) The spatial distribution of ecosystem service value in 2005. (c) The spatial distribution of ecosystem service value in 2010. (d) The spatial distribution of ecosystem service value in 2015. (e) The spatial distribution of ecosystem service value in 2020. Projection information: CGCS2000_3_Degree_GK_CM_120E.
Land 14 00917 g004
Figure 5. Growth probabilities of each land use type. (a) The growth probability distribution of Cropland. (b) The growth probability distribution of Forest land. (c) The growth probability distribution of Grassland. (d) The growth probability distribution of Wetland. (e) The growth probability distribution of Barren. (f) The growth probability distribution of Built-up land. Projection information: CGCS2000_3_Degree_GK_CM_120E.
Land 14 00917 g005
Figure 6. Land use distribution pattern and ecosystem service value under multi-development scenarios. (a) The land use distribution pattern under the inertial development scenario. (b) The land use distribution pattern under the cropland protection scenario. (c) The land use distribution pattern under the ecological development scenario. (d) The ecosystem service values under the inertial development scenario. (e) The ecosystem service values under the cropland protection scenario. (f) The ecosystem service values under the ecological development scenario. Projection information: CGCS2000_3_Degree_GK_CM_120E.
Land 14 00917 g006
Figure 7. Distribution of ecosystem services value supply capacity under the IDS. (a) Water conservation. (b) Flood mitigation. (c) Carbon sequestration. (d) Sedimentation reduction. (e) Nitrogen purification. (f) Phosphorus purification. (g) Climate regulation. (h) Air purification. (i) Oxygen release. Projection information: CGCS2000_3_Degree_GK_CM_120E.
Land 14 00917 g007
Figure 8. Distribution of ecosystem services value supply capacity under the CPS. (a) Water conservation. (b) Flood mitigation. (c) Carbon sequestration. (d) Sedimentation reduction. (e) Nitrogen purification. (f) Phosphorus purification. (g) Climate regulation. (h) Air purification. (i) Oxygen release. Projection information: CGCS2000_3_Degree_GK_CM_120E.
Land 14 00917 g008
Figure 9. Distribution of ecosystem services value supply capacity under the EDS. (a) Water conservation. (b) Flood mitigation. (c) Carbon sequestration. (d) Sedimentation reduction. (e) Nitrogen purification. (f) Phosphorus purification. (g) Climate regulation. (h) Air purification. (i) Oxygen release. Projection information: CGCS2000_3_Degree_GK_CM_120E.
Land 14 00917 g009
Figure 10. Spatial distribution of various re-naturalization pathways under EDS. (a) Re-naturalization pathway for the conversion of ‘cropland to forestland’. (b) Re-naturalization pathway for the conversion of ‘cropland to wetland’. (c) Re-naturalization pathway for the conversion of ‘built-up land to Cropland’. (d) Re-naturalization pathway for the conversion of ‘built-up land to forestland’. (e) Re-naturalization pathway for the conversion of ‘built-up land to wetland’. (f) Other types of re-naturalization pathways. Crop. represents cropland. Fore. represents forestland. Gras. represents grassland. Wetl. represents wetland. Barr. represents barren land. Buil. represents built-up land. Projection information: CGCS2000_3_Degree_GK_CM_120E.
Land 14 00917 g010
Table 1. Data used for the PLUS model.
TypePotential Driving ForcesData Source
Socio-economic factorsPopulationChinese Academy of Sciences Resource and Environmental Data Center (https://www.resdc.cn/), accessed on 1 February 2025
Gross domestic product
Night-time light
Proximity to railway stationOpenStreetMap (https://www.openstreetmap.org/), accessed on 1 February 2025
Proximity to railway
Proximity to trunk
Proximity to highway
Proximity to primary roads
Proximity to secondary roads
Proximity to tertiary roads
Proximity to government
Climate and environmental factorsProximity to open waterOpenStreetMap (https://www.openstreetmap.org/), accessed on 1 February 2025
Digital ElevationASTER GDEM V3
SlopeASTER GDEM V3
Annual mean temperatureChinese Academy of Sciences Resource and Environmental Data Center (https://www.resdc.cn/), accessed on 1 February 2025
Annual precipitation
Soil typeHarmonized World Soil Database v2.0 (https://www.fao.org/home/en/), accessed on 1 February 2025
Disclaimer/Publisher’s Note: The statements, opinions and data contained in all publications are solely those of the individual author(s) and contributor(s) and not of MDPI and/or the editor(s). MDPI and/or the editor(s) disclaim responsibility for any injury to people or property resulting from any ideas, methods, instructions or products referred to in the content.