Abstract
Rain gardens are efficient nature-based solutions (NBSs) for the sustainable management of surface run-off in urban areas. The functionality of a rain garden in an urban environment depends on the resistance of plant and soil components to anthropogenic stressors. In temperate climates, the negative effects of de-icing chemicals applied in wintertime are one of the major anthropogenic stressors for the rain gardens’ ecosystem. The research aimed to study the effect of a NaCl-based de-icer in the mesocosm experiment, where materials of soil mixtures (seven parts by volume of quartz or carbonate sand and three parts by volume of loam or peat), plants (Hemerocallis hybrida), de-icer dose (529 mg L−1 for Cl− and 472 mg L−1 for Na+ concentrations), and irrigation period simulated typical conditions for the Moscow city—the largest world megapolis with permanent snow cover during the wintertime. For all soil mixtures, a short-term negative impact of salinization on soil health included a decrease in microbial biomass (4–7-times) and basal respiration (2–3.6-times). After six months, soil health indicators recovered by 80–90% in the peat and carbonate sand mixture, whereas the negative effects on the quartz sand and loam mixtures remained irreversible (1.3 and 3 times lower than the control, respectively). The chlorophyll content of the plants on all soil mixtures was reduced compared to the control plants (37.1 ± 4.1 vs. 39.9 ± 1.2 SPAD units). The worst plat condition was observed for soil mixtures based on quartz sand. In this variant, the negative effect of salinization coincided with low nutrient content. In our results, the ash content was up to three times less compared to the initial state, as well as to the other materials. Plants grown in mixtures based on loam were more resistant to salinization due to higher nutrient content than peat. Overall, based on soil Na uptake, plant biomass, and recovery of soil microbiota, soil mixtures based on peat, loam, and carbonate sand will be the most resistant to NaCl-based de-icers and could be recommended for the creation of rain gardens in cities with permanent snow cover in winter.
1. Introduction
Urbanization presents significant challenges. While it offers economic, social, and cultural benefits, it also leads to the depletion of natural resources, biodiversity loss, and the degradation of ecosystem services (ESs), adversely impacting human health and well-being [1,2]. Cities, as major contributors to climate change, are increasingly vulnerable to its effects, such as heat waves, droughts, and flooding [3,4]. Addressing these challenges requires enhancing urban resilience, improving resource efficiency, promoting social inclusiveness, and mitigating ecological impacts [5]. Nature-based solutions (NBSs) have been adopted as a central concept in the principal policies on sustainable development, such as the European Union’s Nature Restoration Law and Green Deal [6,7,8]. NBSs are natural-anthropogenic systems that use the natural processes of ecosystems to solve environmental, social, and economic problems in cities, including those caused by the consequences of climate change. Based on the worldwide expert survey by Castellar et al. (2021) [9], NBS categories include NBS units defined as ‘green technologies and green urban spaces, either autonomous or integrated into a larger assemble forming complex living systems’ and NBS interventions defined as ‘acts of intervening in specific ecosystems to support natural processes and biodiversity’ [9]. NBSs are considered an efficient tool to enhance ecosystem services (ESs), e.g., noise reduction [10], air quality improvement [11,12,13], carbon sequestration [14], maintaining the microclimate of urban spaces [15,16] and biodiversity [17], flood control [18], improving the condition of water bodies [19,20], etc. NBS integration and development have shown a positive impact on citizens’ longevity, health, and psycho-emotional state [21,22,23]. Under ongoing climate change, flood mitigation and surface runoff management are widely considered among the most important ESs provided by NBS in cities. The rain garden is recognized as a ready-to-use NBS for surface water uptake and flood mitigation [24,25]. The efficiency of these NBS units strongly depends on the state and functionality of the main ecosystem components: plants and soil constructions. In urban environments, plants and soils are exposed to multiple anthropogenic stressors, such as over-compaction, contamination, and anthropogenic salinization [26,27,28].
The main sources of anthropogenic soil salinization are chloride-based de-icing agents. These de-icers are applied to roads and walking paths in cold-climate regions, such as Canada, the USA, China, Russia, Japan, and many European countries, to lower the freezing point and prevent traffic accidents and injuries during wintertime [29,30,31,32]. The negative effects of chloride-based de-icers on plant condition and soil health include osmotic stresses and ion toxicity for plants, alteration of soil structure, mineralization, and suppression of soil microbial activity [33,34,35,36,37]. For example, a comparative toxicological study of NaCl, NaCl + CaCl2, and MgCl2 showed that the implementation of Na-based de-icers inhibited plant biomass and root growth of non-halophytic turf grasses from 30 to 100%, depending on the dose [38]. However, tolerance to different chlorine salts varies from species to species as it depends on plant adaptation mechanisms [39,40]. The effects of salinization on soil’s physical properties include structural disruption and changes in soil texture. In results, the fine fraction poses risks of soil erosion and denudation, followed by an increased particulate matter content in air with a potential health hazard to humans [41,42].
Studies focused on salinization consequences for soil microbiomes report a decrease in microbial diversity under salt exposure, along with a marked increase in halotolerant and halophilic Bacteria and Archaea in soils adjacent to treated roads, with salt-impacted soils harboring up to 10 times more halophiles than unaffected areas [36,43]. Nevertheless, research on the physiological responses of microorganisms to salinization stress remains limited and often contradictory [44,45], although soil physiological functions appear to be more susceptible to salt levels than the structural diversity of microbial communities [46].
The dose-effect study of sodium chloride (NaCl)-based de-icers showed inhibition of microbial biomass and respiration at the electrical conductivity (EC) of 11 mS cm−1, with severe suppression occurring at 31 mS cm−1 [47]. A complex effect of several salts can either increase or decrease microbial activity depending on the soil type, salt composition, and doses. For example, in floodplain soils, a 3.6-fold reduction in microbial biomass and a 2.5-fold decrease in basal respiration were observed in a NaCl + MgCl2 + CaCl2 treatment with an electrical conductivity of just 2.66 mS cm−1 [48]. In contrast, in sodosols and solonetz soils, microbial biomass increased by up to 3.5 times under high-salinity treatment (30 mS cm−1 NaCl + CaCl2), while cumulative respiration decreased up to fivefold under mid-salinity conditions (10 mS cm−1) [49]. Research on the long-term effects of salt exposure on the soil microbiome physiological functions—particularly in relation to the resilience of different soil textures used in urban greening—remains scarce [37].
Despite well-documented adverse effects, sodium chloride (NaCl) remains the most widely used road de-icer because of its low cost and effectiveness at temperatures below −10 °C [34,50]. However, its toxicity to soil and plants is also concentration dependent [38]. In urban areas where sodium chloride is widely used, soil conductivity ranges from 0.15 to 0.6 mS cm−1 in the topsoil near pedestrian areas, with increasing concentration towards roads [32,51,52]. Near motorways, EC can reach 20 mS cm−1, which indicates a very high salt concentration. Given that rain gardens are usually located near motorways and pedestrian roads, a negative effect of NaCl on soils and vegetation is usually reported [33,53]. NaCl is a rapidly soluble compound, and previous studies have shown that up to 60% of the application dose can leach into groundwater, especially in soils with coarse texture and high infiltration [51,54]. Rain gardens’ soils are dominated by coarse materials [55,56], and an active vertical migration of soluble salts during snowmelt can result in groundwater pollution and secondary salinization. However, in contrast to agricultural areas [57,58], vertical migration of soluble salts in rain gardens remains overlooked. We are not aware of any field or mesocosm experiments that quantify the processes and mechanisms of soluble salts transport in rain garden soil constructions exposed to NaCl-based de-icers. There is a lack of information on the parameters of water retention curves, Peclet numbers, hydrodynamic dispersion, and sorption constants needed to support process-based modeling of water and salt transport in layered soil constructions of rain gardens. The experimental determination of these parameters could complement the wide range of laboratory and field studies on the salinity tolerance and biofiltration capacity of herbaceous plants [59,60,61] to select the most sustainable NBS units in temperate cities.
The research aimed to study the effect of NaCl application on the plant and soil health, and the groundwater quality of a model rain garden. The short-term (hours and days) and long-term (half a year) consequences for the plant condition, soil health, and groundwater quality were studied for the case of Moscow (Russia)—the largest city with permanent snow cover in wintertime. Model rain gardens with different materials used for soil construction (mixtures of sand, loam, and peat) were compared to promote the most tolerant soil construction for further implementation in rain gardens exposed to salinization in urban areas.
2. Materials and Methods
2.1. Selecting Materials for Soil Construction
A typical soil constructed for a rain garden includes a fertile organo-mineral topsoil layer underlain by one or several drainage layers. Prior to the experimental set-up, soil substrates and materials recommended for rain garden construction were analyzed based on existing standards and best practices (Table 1).

Table 1.
Mixture standards for the top organomineral horizon of a rain garden.
For the experiment, seven types of mixtures were selected and adapted to the landscaping practices of the Moscow metropolis (with compost replaced by peat). These mixtures were created by combining locally available substrates (components): medium loam (L), sphagnum peat (P), and two types of fine sand (S) with predominant fractions of 1–2 mm—carbonate sand (Sc), which is widely used in landscape design, and quartz sand (Sq), which was used as a reference. All seven types of mixtures were prepared using carbonate and quartz sand in the following substrate ratios by volume: S9L1, S7L3 (LID), S7P3 (LID), S7L1P2 (LID), S7L2P1 (LID), S5L2P3 (G1760), and S3L4P3 (RGA).
2.2. Hydrophysical Properties of Soil Substrates and Mixtures
Filtration and accumulation of surface water run-off is the primary function of the soil construction of rain gardens. Therefore, testing the hydrophysical properties of the selected soil substrates and mixtures was the first research step. Soil texture was determined by standard sieve, pipette, and areometric methods [67]. The Soil–Water Retention Curves (SWRCs) of the substrates and mixtures were assessed using the equilibrium centrifugation method [68], and an approximation of the experimental outcomes was performed with the van Genuchten model [69]. The infiltration coefficient (Kf) was measured in vitro for individual substrates (components) and mixture variants (Table 1). The analysis was conducted using the pressure-absorption method, which calculates the volume of filtrate per unit of time based on the capacity of the column filled with a mixture and the height of the water column [70] based on Formula (1):
Kf = V × L/(S × t × (L + h)),
Kf—is infiltration coefficient, cm s−1 (mm h−1 units used in results);
V—is volume of filtered water, mL;
t—is time, s;
L—is the soil column height in the experiment, cm;
Q—is volume of filtered water per unit time, mL s−1;
S—is cross-sectional area, cm2;
h—is water head, cm;
The Kf (infiltration coefficient) values were then converted to standard values at 10 °C using Hazen’s formula that accounts for the filtration rate as a function of water viscosity at different temperatures (Formula (2)) [70]:
K10 = Kf/(0.7 + 0.03 T),
K10—infiltration coefficient at 10 °C, cm s−1 (mm h−1 units used in results),
T—temperature, °C.
The resulting filtration properties (K10) of the soil mixtures were compared with the LID and SuDS recommendation range. The SUDS requirements of 100 to 300 mm filtration were used as the main criteria, as they standardize the upper limit of filtration, which is also the basis for recommendations from Northern European countries and Russian recommendations. The mixtures with Kf within the recommended range were used to create soil construction for the mesocosm experiment.
Substrate volumes and weights, including the top and sub layers of the monoliths, were calculated to model pore filling in the columns. The bulk density of the monolith layers was determined by ring sampling and the gravimetric method as a result of drying in a muffle furnace (105 °C), the solid phase density was determined by a pycnometer (OAO ‘KHIMLABORPRIBOR’, Klin, Russia), and the total porosity and porosity coefficients had already been calculated on the basis of the values of these indices [71]. For the sub layers, these characteristics were determined after removing the top layers from columns.
2.3. Chemical Properties of Soil Substrates, Mixtures, and Filtrate
The following chemical properties were measured in soil substrates and mixtures: (1) pH in water and salt extracts by potentiometric method is the soil-to-water ratio 1:5 for soil and 1:10 for peat [72,73]; (2) available phosphorus content by spectrophotometer DR3900 (HACH LANGE GMBH, Düsseldorf, Germany) (depending on pH, GOST 26205-91, GOST 26204-91, or GOST R 54650-2011 methods were used) [74,75,76]; (3) potassium and sodium content by atomic emission spectroscopy [74,75,76,77]; (4) total nitrogen by Kjeldahl method, which includes sequential ignition, distillation, and determination of the titration endpoint (EP) [78]; (5) total carbon (TC) content using the nondispersive infrared method with an Elementar vario TOC select (Elementar Analysensysteme GmbH, Langenselbold, Germany) analyzer at a combustion temperature of 900 °C; and (6) total content (bulk content) of heavy metals by express pXRF method [79].
During the salinization experiment, the electrical conductivity of the substrates and filtrates was measured using an Ohaus Starter ST3100C conductometer (OHAUS Instruments (Shanghai) Co.,Ltd., Shanghai, China) [72]. Chloride ions in water extracts and filtrates were measured using the direct ionometry method [80]. Potassium and sodium were determined by atomic emission spectroscopy [74,75,76,77,81], while calcium and magnesium were determined using the complexometric method [82]. The content of total, organic, and inorganic carbon in liquid samples was analyzed with the Elementar vario TOC select analyzer at a combustion temperature of 850 °C.
2.4. Microbial Properties of Soil Substrates and Mixtures
For assessing soil health, microbial community characteristics, such as microbial biomass, basal respiration, and the metabolic quotient (qCO2) (the ratio of basal respiration to microbial biomass), were chosen as the most sensitive and effective indicators due to their responsiveness to biotic and abiotic factors [83]. The carbon content of microbial biomass (Cmic) was assessed using the substrate-induced respiration (SIR) method, measuring the maximum concentrations of CO2 from the soil after adding a readily available substrate, glucose, and incubating the samples for 3.5–5 h at 22 °C, then measuring them using a gas chromatograph Chromatec-Crystall-2000M (Chromatec instruments, Yoshkar-Ola, Russia) [84,85]. The Cmic value was calculated using the Formula (3):
Cmic (μgC g−1) = SIR (μl CO2 g−1 h−1) × 40.04 + 0.37,
The rate of basal (microbial) respiration (BR) of soil samples was assessed based on CO2 production in the unamended sample after incubation at 22 °C for 24 h. The concentration of CO2 was measured using gas chromatograph. The specific respiration of microbial biomass or the microbial metabolic coefficient (qCO2) was calculated as the ratio of BR to Cmic.
2.5. Set-Up of the Mesocosm Experiment
To simulate the effect of NaCl on rain gardens in Moscow conditions, a mesocosm experiment was set up. Rain gardens were simulated by PVC columns (100 cm height, 15 cm inner diameter, PVC external sewer pipe SN4, OOO «POLITECH-SPB», Saint Petersburg, Russia) filled with a three-layer soil construction and vegetated with Hemerocallis hybrida. The following layers were used (from bottom to top): (1) a 10 cm drainage layer consisting of crushed gravel with a fraction size of 5–20 cm; (2) a 30 cm mineral layer consisting of quartz or carbonate sand; (3) a 30 cm organo-mineral topsoil layer composed from the mixtures, selected based on the hydrophysical properties (see Section 2.2). For each column, one specimen of the hybrid daylily (Hemerocallis hybrida) was planted in the topsoil layer. All plants were pre-grown in a plant growth chamber under controlled conditions before being planted into columns.
To model the input of NaCl, the period of active spring snowmelt was considered. Water volumes were calculated based on the average snowdrift height in Moscow over the past five years (a period of snowy winters), estimated at approximately 1 m with a snow cover density of 380 kg m−3. Based on these calculations, 6.7 L of water was expected to flow into a pipe with an internal cross-section of 15 cm (excluding horizontal runoff). The amount of de-icing reagent KP-2 (LLC Construction Company “RAMON”, Moscow, Russia) was determined using an application rate of 20 g m−2 for roads and walking paths, with an increased dose of up to 150 g m−2 during extreme weather events [86]. The number of applications was estimated from the averaged data over the past five years (November to March) and included transitions through 0 °C (n = 34), precipitation above 5 mm (n = 19), and freezing rains (n = 2) [87]. It was further assumed that approximately 30% of the applied reagents used for road and path maintenance reached the green areas. The studied de-icing reagent consisted of 50% of the mass being a sand and gravel mix, and the other 50% being a soluble portion based on NaCl, with up to 10% sodium formate also present in the composition. Based on this assumption, the soil monolith columns were treated with a solution of 3.95 g de-icing reagent per 1 L of water at a rate of 1.675 L per day for four days. Following this, the columns were spiked daily with 1000 mL of pure water until the EC values of blank solutions were reached. In parallel, blank columns (n = 2 for each) were irrigated with identical volumes to serve as a reference for comparison.
During the experiment, the filtration rate and EC were measured directly in each 200 mL of filtrate. Soil moisture was determined with a Delta-T HH150 portable moisture meter (Delta-T Devices, Cambridge, United Kingdom (UK), filtrate EC was measured with a Hanna HI98130 analyzer (Hanna Instruments Deutschland GmbH, Vöhringen, Germany), and the substrate EC was assessed with a Hanna HI98331 analyzer (Hanna Instruments Deutschland GmbH, Vöhringen, Germany). Substrate conductivity was measured at the surface and along the profile through pre-prepared holes in the columns, both before spillage and after the runoff of gravity water. At the end of each day, final filtrates were collected for laboratory analysis of pH, chloride ion content, sulfate, and water-soluble forms of potassium, sodium, calcium, and magnesium. After the salinization and washing phases, soil samples were collected to analyze chemical and microbiological properties in comparison to the initial and blank substrates. Additionally, after six months of the experiment, soil samples were collected and analyzed to assess the recovery of the soil microbiome. The experimental design and observations are summarized in Figure 1.

Figure 1.
Salinization experiment: set-up and observed indicators.
2.6. Plant Properties and Condition
The physiological properties and conditions of Hemerocallis hybrida plants were observed before and after salinization. The following indicators were observed: (1) plant morphology (number, length, and raw weight of leaves; length and raw weight of roots; and plant condition by visual assessment); (2) chlorophyll levels detected by measuring leaf optical density using a SPAD-502 Plus chlorophyll meter (Konica Minolta Inc, Langenhagen, Germany); (3) elemental composition of plants. To measure the elemental composition, plant samples were prepared by drying them at 105 °C to a constant weight, followed by combustion in a muffle furnace EKPS 10 mod.4005 (OAO ‘Smolensk SKTB SPU’, Smolensk, Russia) at 525 °C with gradual heating. Humidity and dry matter fraction were determined by the gravimetric method, while ash content was calculated as the percentage of ash mass relative to the dry plant mass [88]. Extraction of elements from the ashes was performed using a solution of nitric acid (1:1 with water), heated to boiling [89]. The bulk contents of Pb, Zn, Cu, Ni, Mn, Fe, P, K, Na, and Mo were determined by atomic emission spectrometry (ICP-OES) [90].
2.7. Data Analysis and Modeling
Significant differences were assessed using a one-way ANOVA followed by Tukey’s Honestly Significant Difference (HSD) test for pairwise comparisons. Results are presented as means ± standard deviations. Data visualization was performed in RStudio (version 2024.12.0 + 467) using the ggplot2 package (version 3.5.2), with bar and stacked bar plots illustrating soils, filtrates, and plants properties across treatments.
The hydrodynamic dispersion parameter (mixing step) was estimated as the height of substrates in the monolith divided by the Peclet number (Pe), which was calculated in the STANMOD for Windows (Version: 2.xx, December 2003) program based on real geometric and physical parameters of column monoliths.
3. Results
3.1. Hydrophysical Properties of Soil Substrates and Mixtures Used in Rain Gardens
Carbonate sand was dominated by medium (0.25–0.5 mm, 32.7%) and coarse (0.5–1.0 mm, 37.9%) fractions, whereas the medium fraction had 64.4% in the quartz sand. Loam was dominated by the clay fraction (81.6%). Peat material is usually not analyzed following the standard soil texture protocols. To obtain an idea about the particle size, we analyzed the fraction of particles between 0.25 and 2 mm (an optimal fraction based on LID and SUDS standards) based on the sieve residue and obtained 56%. Based on the SWRc, soil hydrological constants (wilting point (WP), field capacity (FC), and water holding capacity (WHC)). The highest water holding capacity was obtained for peat, whereas loam and sand had values similar to natural Retisols dominating in the Moscow region [71,91]. Soil mixtures S3L4P3 and S5L2P3 had water holding capacity comparable to loam, whereas the water holding capacity of the mixtures with a sand fraction of 70% was about 6% higher compared to sand substrate. The lowest water holding capacity was obtained for the mixture S9L1, whose volumetric fraction of sand was 90% (Table 2).
Table 2.
Hydrologic constants of the soil substrates and mixtures based on the SWSc.
The average infiltration rate (K10) was measured in six subsequent trials to confirm the linearity of the flux (R2 of the linear model considered for K10 estimation was 0.97–0.99). Among the substrates, the highest K10 was obtained for carbonate and quartz sand, whereas the values for loam were the lowest. For peat, a huge difference was shown between air-dry (5 mm h−1) and moisture-saturated (above 1100 mm h−1) conditions. Among the mixtures, the highest K10 values were obtained for S7L2P1 and S5L2P3, where sand volumetric fractions were 70 and 50%, respectively. The loam fraction also had an impact on K10 of the mixture. For the mixture with the same sand fraction, an increase in the loam fraction decreased K10. For example, K10 of the S7L3 mixture was only half of the S7L1P2 mixture. S7L2P1 and S3L4P3 were at the upper and lower limits of the SuDS recommendations. Of all the mixtures, only S7L3 and S7P3 were within the SuDS recommendations (Figure 2).

Figure 2.
K10 of soil substrates and mixtures determined under laboratory conditions using the pressure absorption method. * For peat, values are provided for both the air-dry state and after full saturation. ** Substrates S7L3 and S7P3 exhibit infiltration coefficient values recommended by SuDS.
Mixing carbonate sand with peat or loam resulted in alkaline soil mixtures, whereas the mixture of quartz sand and peat was acidic. A neutral reaction was obtained only for the S7L3 mixture. Total C content in soil mixtures ranged between 1 and 3%. TC is below the optimum level in all mixtures when assessed against the Moscow soil standard for greening and landscaping [92]. With regard to the nitrogen content, the majority of the mixtures even exceeded the values recommended by the standard for Moscow soils. The highest potassium and phosphorus were obtained for the mixtures, where peat, sand, and loam components were balanced or predominantly loam over peat. The S7P3 mixture, composed of peat and quartz sand, had P and K content indicating a substantial nutrient deficit (Table 3).
Table 3.
Agrochemical properties of substrates and soil mixtures for rain gardens in comparison with the standard of Moscow soils for greening and landscaping.
Mixtures with the sand volumetric fractions below 50% had better agrochemical properties (higher soil fertility) compared to sand-dominated mixtures, however these mixtures did not meet the filtration requirements described above. Therefore, the mesocosm experiments were based on the mixtures with 70% sand content (S7P3 on carbonate and quartz sand and S7L3 on carbonate sand), even though the nutrient content in these mixtures was limited.
3.2. The Effects of Salinization on a Raingarden Ecosystem in the Mesocosm Experiment
A mesocosm experiment was carried out for soil columns composed of S7L3 or S7P3 (organo-mineral topsoil layer) underlain by carbonate or quartz sand (mineral subsoil layer) and a drainage layer. For S7P3, both subsoil materials were studied, whereas only carbonate sand was studied as a subsoil layer for S7L3. The drainage horizon was the same for all variants. For each of the three variants of soil constructions, the effect of salinization on groundwater quality, soil health, and plant condition was studied by comparing the affected (salinized) construction to a non-affected (blank) construction.
3.2.1. The Effect of Salinization on Groundwater Quality
To explore the transport of NaCl solution in porous soil systems, we estimated the basic hydrophysical parameters of topsoil and subsoil layers in soil columns. Subsoil bulk density was on average 0.6 g cm−3 higher, and total porosity on average 20% lower compared to topsoil layers. The Peclet number indicated the domination of advective solute transport over dispersive transport in all constructions, with the highest value obtained for S7P3 underlain by quartz sand (Table 4). At first, soil constructions were irrigated by pure water (in total 3 L) until a stable linear flux was achieved. The EC of the filtrate was 0.6 mS cm−1 in S7L3carb, S7P3, and S7P3carb, respectively. Then, the soil constructions were irrigated with NaCl solution, and changes in EC of the filtrate were observed. After 5.2 L of NaCl solution was added, the EC of the filtrates for all constructions stabilized at values close to 3.65 mS cm−1—the EC of the solution. Based on the estimated porosity and the irrigation volume, the entire pore space of the soil constructions was filled in by the time the EC equilibrium was achieved (Figure 3).
Table 4.
Hydrophysical properties and modeling parameters of the soil construction.

Figure 3.
The ratio of cycles of pore volume changes for monoliths from left to right S7L3carb, S7P3, S7P3carb, to the relative concentration (the ratio of the electrical conductivity of the solution to the maximum electrical conductivity). Points are experimental data; curved lines are convective diffusion model from STANMOD for Windows (Version: 2.xx, December 2003).
The average concentrations of sodium and chlorine in the solution for all irrigation days were 604 mg L−1 and 562 mg L−1, respectively, giving, in total, 175.7 mmol of sodium and 99.4 mmol of chlorine in the irrigation water. The maximum concentrations of chlorine ions in the filtrates of all columns were already observed at the end of the third day of continuous irrigation with a mean value of 529 mg L−1, while the sodium concentrations on the fourth day averaged 472 mg kg−1 for all columns. Moreover, after the second day of irrigation, the chloride (234 mg L−1) and sodium (112 mg L−1) concentrations in the filtrate of the S7P3 column on quartz sand were lower compared to S7P3carb (288 mg L−1 and 141 mg L−1, respectively) and the S7L3carb mixture (332 mg L−1 and 192 mg L−1, respectively). On the fourth day, the highest concentrations in the leachate were also recorded for chloride for the S7L3carb mixture −537 mg L−1 and sodium for the S7P3 mixture with peat on quartz sand −493 mg L−1. The total irrigation water simulated an intensive snow melting with a fast solute transport down the soil profile. Therefore, the results show the amount of substance that can leach out of the different soil constructions. For example, the amount of chlorine leached from the filtrate after complete solution run-off (before washing) from the S7L3carb column was higher (63.0 mmol) than for the substrates on peat-sand mixtures (55.4 mmol for S7P3 and 56.6 mmol for S7P3carb). For sodium, the values in the filtrate were distributed in ascending order as follows: 70.5 mmol—S7L3carb, 67.0 mmol—S7P3, and 64.1 mmol—S7P3carb.
After reaching the maximum ion concentration in the filtrate, the columns were washed with distilled water at 1000 mL per day, simulating the second stage of spring snowmelt and the arrival of ‘clean’ runoff. Washing on day 8 (7.5 L of distilled water) resulted in EC values similar to baseline; however, some sodium and chlorine ions remained in the substrates. The amount of chlorine in the substrate after washing decreased from 27.7 to 10.5 mmol for S7L3carb, from 31.2 to 7.7 mmol for S7P3carb, and from 36.8 to 7.7 mmol for S7P3. The amount of sodium in the total substrate mass after washing decreased from 33.9 to 11.0 mmol for S7L3carb, from 31.8 to 14.2 mmol for S7P3carb, and from 37.5 to 6.3 mmol for S7P3. Meanwhile, measurements of chlorine and sodium ions six months after salinization and irrigation by pure water showed that sodium and chlorine continued to leach slowly, with the chlorine concentration decreasing by almost a further half to average values of 5.2 mmol and background sample averages of 5.0 mmol. The amount of sodium decreased over the six-month period to average values of 1.1 mmol with background averages of 0.7 mmol (Figure 4).

Figure 4.
Dynamics of sodium and chlorine ions yield from the filtrate during salinization and irrigation with clean water.
3.2.2. The Effect of Salinization on Soil Health
Before salinization, microbial biomass in the topsoil layer ranged from 130 to 145 µg C g−1, and basal respiration ranged from 0.25 to 0.50 C-CO2 g h−1, which is comparable to the values reported for constructed Technosols in Moscow [93,94]. After salinization, microbial biomass significantly decreased in all variants of soil constructions from a minimum of 4.3 times in the S7L3carb mixture to 7 times in the S7P3carb mixture. Similarly, basal respiration after salinization decreased from 2 to 3.6 times for the S7P3quartz and S7L3carb mixtures, respectively. The microbial metabolic coefficient of the soil mixtures prior to salinization ranged from a minimum of 1.9 to a maximum of 5.6 CO2-C mg−1 Cmic h−1 for the S7P3quartz and S7L3carb mixtures, respectively. Even though these values are already high and indicate stressful conditions for the soil microbiome, after salinization, the qCO2 of S7P3carb and S7P3quartz mixtures increased by 2 to 2.5 times, respectively. Six months after, microbial biomass carbon and basal respiration in all constructions significantly increased in comparison to the values measured directly after salinization. The best recovery rate was obtained for the S7P3carb mixture, where microbial biomass and basal respiration reached 80–90% of the pre-salinization values, and qCO2 decreased almost twofold. Moreover, these values were not significantly different from the blank S7P3carb mixture not exposed to salinization. In contrast, in the salinized S7P3quartz and S7L3carb, microbial biomass and basal respiration were 1.3 and 3 times lower compared to the corresponding salt-free variants. Apparently, the salinization effect on the soil microbiome of these mixtures was irreversible, or at least half a year was not enough for recovery (Figure 5).

Figure 5.
The values (mean ± sd) of microbial biomass Cmic, basal respiration BR, and microbial metabolic coefficient qCO2 for soil mixtures in different experimental variants. Values with different letters (p < 0.05; ANOVA, Tukey test) indicate significant differences between time points across each treatment (salinization and no salinization).
3.2.3. The Effect of Salinization on Plant Condition
Salinization had a clear effect on Hemerocallis hybrida plant morphology, biomass, chemical composition, and physiology. Based on the visual assessment six months after salinization, plants in all mixtures were oppressed. The worst plant condition was observed for S7P3, where almost all leaves were dry except for one young leaf, for which further measurements were made, and the root biomass was less than in the other variants. The negative changes in plant conditions were less severe for the other two constructions. Although edge burn and chlorosis on individual leaves were observed, leaf length and number of live leaves were considerably higher. The root biomass and maximum root length were higher for the plants on the peat-sand mixture (Table 5, Figure 6).
Table 5.
Morphometric characteristics of plants are exposed to the salinity of de-icing salt.

Figure 6.
Visual comparison of daylily (Hemerocallis hybrida) exposed to de-icing salinity and control samples.
The effect of salinization on plant physiology was studied based on the chlorophyll content in plant leaves. No significant (p > 0.05) differences were found between plants on the three types of mixtures and control plants on the zero point and after 2 months of observation, but after two months of the experiment, the chlorophyll content was significantly (p < 0.05) lower than at the zero moment, for both salinized and control plants. The relative decrease was higher for the plants affected by salinization (37.1 ± 4.1 SPAD units) than for control plants (39.9 ± 1.2 SPAD units) (Figure 7).
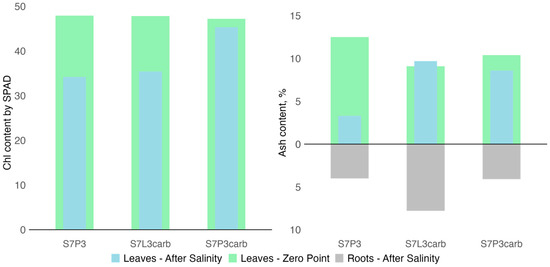
Figure 7.
Chlorophyll content in leaves of hybrid daylilies (Hemerocallis hybrida) at the zero moment and 2 months after salinization (on the left side) and ash content in leaves and roots of hybrid daylilies (Hemerocallis hybrida) at the zero moment and 6 months after salinization (on the right side).
The chemical composition of plant biomass was studied based on the ash content and composition. Six months after salinization, the ash content decreased from 17% for S7P3carb to 3.8 times for S7P3 compared to the values obtained prior to salinization. Among the salinized variants, the lowest ash content in roots and leaves was observed in the plant growing on peat-sand quartz mixture (Figure 7). For this mixture, sodium, manganese, and zinc accumulation in roots and leaves was also shown, whereas potassium contents were the lowest compared to other mixtures (Figure 8). A depletion in potassium, copper, and plant biomass as a result of salinization was shown for all variants of soil constructions. However, plants on the S7L3carb mixture were more resistant to salinization compared to the other variants, which can be illustrated by visual assessment, higher content of P, K, and total ash content.
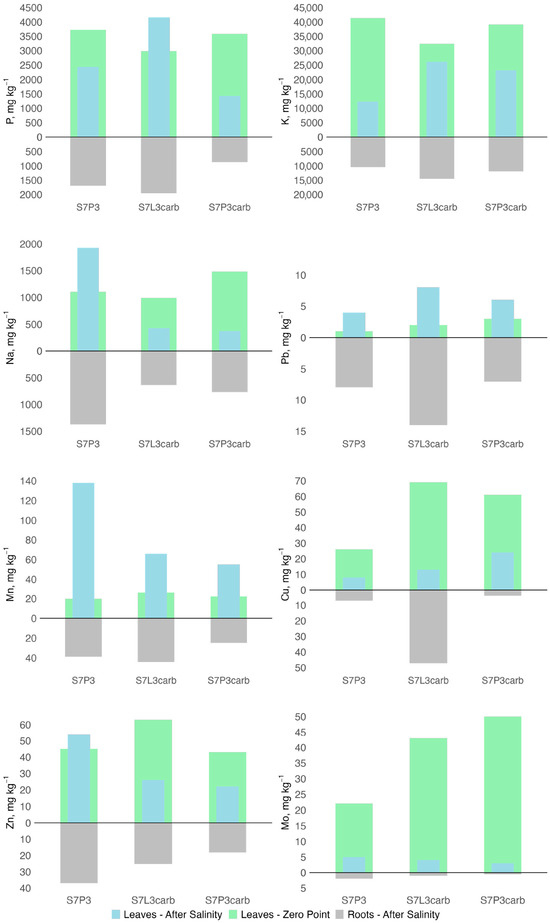
Figure 8.
Changes in elemental composition (P, K, Na, Cu, Pb, Mn, Zn, and Mo) in leaves and roots of hybrid daylilies (Hemerocallis hybrida) 6 months after salinization.
4. Discussion
4.1. The Effect of De-Icing Reagent on Water Quality
The use of NaCl-based de-icers results in increased concentrations of chlorides, sodium, and other mineral components of de-icing agents in groundwater and surface water. For example, a long-term study of groundwater in Minnesota, USA [95] shows increases in chloride concentrations in groundwater, as well as intra-annual fluctuations in groundwater chloride concentrations reaching 40% during snowmelt periods. Similar changes in groundwater salt concentrations are noted in other studies [96,97]. An increase in chlorides and sodium ions’ concentration in groundwater has a negative impact on freshwater ecosystems, limits the possibility of using water for domestic and technological needs, and increases the corrosion of buildings basements and engineering infrastructure [98,99,100], however the threshold concentrations depend on the national/state regulations and water use category (e.g., sewage water, irrigation water, water for fishery, etc.). Alternative de-icers derived from agricultural by-products (acetates, formates, glycols, and succinates) are less toxic and less aggressive to infrastructure. However, their use increases the biological oxygen demand (BOD) of water systems, which can lead to the depletion of dissolved oxygen and the death of aquatic organisms [101].
In our study, the maximal concentrations of chlorine and sodium ions in filtrates were observed after 3–4 days of irrigation and exceeded 500 mg L−1. These concentrations are considerably higher than Russian and international thresholds for discharge into the freshwater bodies (Table 5). The results indicate that during the snow melting period, the filtrate shall be isolated from the groundwater and needs special treatment. The observed maximal concentrations were also 5–7 times higher than FAO recommendations for the irrigation water, therefore filtrate cannot be used for this purpose either. At the same time, the observed concentrations are below 1000 mg L−1, which is the threshold for entering the stormwater system in Russia (Table 6). Further irrigation with pure water, simulating the volume of spring rainfall during an approximately one-month period, decreased NaCl concentrations to the baseline values. It can be concluded that the snow melting period, which in Moscow usually occurs for 10–14 days in March–April, is the most risky for the groundwater quality. For this period, the rain garden drainage system shall be disconnected from the groundwater and shall not be accumulated in irrigation tanks, unless further water treatment is planned. Approximately one month after the period of active snow melting, the negative effect of de-icers on groundwater is negligible, and free drainage as well as collecting filtrate for irrigation is possible.
Table 6.
Limit values in mg L−1 of permissible concentrations for different types of water use.
Comparison of the total amount of NaCl leached through different soil constructions and dynamics showed that S7P3carb was the most efficient barrier to protect groundwater from the de-icing reagents. The total amount of NaCl leached through this construction was 10% less compared to others, and the maximal concentrations in the leachate were reached several days later, which indicates a slower solute transport through the soil construction and, therefore, a lower contamination over a given time period. Likely, this outcome can be explained by a higher sorption of chlorine ions on peat particles and chemical reaction with carbonates in sandy subsoil. On the other hand, a higher sorption in topsoil can increase the negative effect of de-icers on soil health and plant condition.
4.2. The Effect of De-Icing Salts on Soil Health and Plant Condition
Salinization had a significant negative effect on microbial biomass and respiratory activity across all types of mixtures, by causing osmotic stress and ion toxicity, which impair water uptake, disrupt cellular functions, and reduce energy available for growth and metabolism [14,37,44,108]. After salinization, the lowest microbial biomass was observed in the S7L3carb mixture; however, compared to its initial values, the reduction in biomass in this mixture was minimal. While this mixture experienced the least short-term effect, salinization significantly impacted the long-term recovery of the microbiome, as no significant changes in biomass were detected after six months compared to the initial values. Soils amended with loam exhibit good aeration, water retention capacity, and nutrient availability, which provide favorable conditions for microbial communities. However, under salinization, the high-water retention capacity may exacerbate osmotic stress, reduce microbial biomass and respiratory activity, and hinder further recovery of microbial activity. These results are consistent with earlier findings highlighting that fine-textured soils exacerbate the effects of salinization by limiting water movement and retaining ions [44].
Soils amended with peat and different types of sand demonstrated lower short-term resilience to salinization but better long-term recovery, which can be explained by their lower water retention capacity and better aeration. These properties facilitate salt leaching and reduce osmotic stress. The chemical inertness of quartz sand and its high drainage capacity are believed to support more effective microbial community recovery after salinization [109]. However, this was not confirmed in the current experiment, as soils with carbonate sand showed more effective recovery. It is likely that the carbonates neutralized the acidity resulting from the biochemical activity in saline soils, stabilized pH, and restored favorable conditions for microbial communities.
As noted by Wichern et al. (2006) [108], prolonged salinization causes microbial communities to use substrates less efficiently, as indicated by the high metabolic coefficient observed six months later in the S7L3carb and S7P3quartz mixtures. This reflects the higher energy expenditure of microorganisms to adapt to salinity stress.
On the other hand, salinization also negatively affects the productivity of plants that act as remediates in rain gardens. In comparison to our case, studies on the salinity tolerance of different daylily species have yielded inconclusive results. For example, the resistance of daylily plants when irrigated under controlled conditions with water containing three times less sodium and 1.5 times less chloride showed average resistance, with less than 10% of the leaves showing signs of salinity-induced stress [110]. The work of Kratsch et al. 2008 [111] indicates that daylilies are resistant under EC < 4 mS cm−1 conditions, which is the same as our results [111]. Work on the effects of complex salt solutions and carbonate compounds, but at lower concentrations, gives a moderate tolerance rating for the genus Hemerocallis [112,113].
As for the morphological evaluation of Hemerocallis hybrida, none of the plants showed any yellowing of the leaves during 4 days of salinization, a single chlorosis appeared during washing and intensified during half a year, in contrast to studies on other cultivars (with almost twice as high of a NaCl concentration), where signs of chlorosis were already observed on the second day [114]. The ash content of the plants corresponded to that of lily of the valley under urban conditions, except for lily of the valley on the S7P3 mixture [115].
In comparison with samples of Hemerocallis hybrida lily of the valley growing under urban conditions in the continental climate zone, the content of Pb, Zn, Cu, K, and Mo in roots corresponded to samples from the city, while Mn was 2–3 times lower. In leaves, before salinization, Pb and Mn corresponded to the samples from the city; after salinization, they became 2–3 times higher, and Zn, Cu, K, and Mo decreased, but within the range of values typical for the city [116,117]. Phosphorus and potassium are primarily responsible for plant responses to stress conditions, and their deficiency in the soil of the S7P3 mixture could be reflected in the form of plant desiccation 6 months after salinization [118,119]. Zinc, which is responsible for proline synthesis and salinity tolerance, increased in the plant with worse conditions on the S7P3 substrate [120,121]. However, this may be due to the fact that zinc is more easily assimilated in acidic and slightly acidic soils [122].
4.3. Recommendations for Raingardens Soil Guidelines
Based on the results of our work, we offer the following recommendations for rain gardens in temperate regions:
- The design of rain gardens in temperate regions should consider not only hydrophysical recommendations, but also the agrochemical properties of the soil mixtures in the context of the plant substrate to perform bioremediation functions and tolerance. It is fair to say that in some cases, there are agrochemical recommendations, e.g., the LID Guideline regulates not only mechanical composition but also phosphorus and acidity. The guideline compares well with the demonstrably poor condition of the plant in the S7P3 mixture, where the phosphorus content was below 10 mg kg−1. Agrochemical indicators are also used in SuDS to assess the immobilization capacity of soils. According to these criteria, the mixtures presented fall into the medium-risk category for carbon (1–15%) and acidity (pH 5–8). Mixtures with a carbonate sand volume fraction of 70% have a pH above eight and are therefore in the low-risk category. An alkaline environment favors the immobilization of most heavy metals, e.g., Ni, Zn, Pb, Cb, but values above eight are detrimental to plant growth and development and inhibit microbiological activity [123]. Therefore, rain garden substrates cannot be considered solely in terms of their function as a geochemical barrier.
- Consider snow management when siting rain gardens to reduce plant stress. Rain gardens in temperate climates should be located at least 1.5–2 m from the edge of the road, as this area is used for snow storage and is most susceptible to contamination by reagents. In addition, studies of plant conditions under real-life conditions in temperate regions have noted the resistance of daylilies, with uncertain salt tolerance depending on the distance from the road and necrotic leaf lesions observed, which was also illustrated in our experiments [124].
- Separate areas into ‘conditionally clean’ and ‘contaminated’ runoff from winter de-icing salts when planning the location of rain gardens or ‘gray’ stormwater systems. SuDS and LID are recommended for all land uses, including green strips along roads and streets, car parks, and pavements. In terms of modeling concentrations, our study has generally shown that soil mixes have a rather limited capacity to intercept chlorine and sodium when applied for a short period of time. In real-world conditions, NaCl and other highly soluble salts can exceed our study’s calculations by a factor of 10 during the city’s snow management regime [86]. In such cases, the use of rain gardens to intercept runoff in front of water bodies or to treat irrigation water should be partially or fully combined with a gray stormwater system, and full substitution with rain gardens for these functions is possible on sites without inputs of runoff contaminated with highly soluble salts according to FAO recommendations (Table 5, [107]).
- Monitoring rain garden components in an area with ‘contaminated’ runoff from de-icing salts to adjust maintenance regimes. It will be difficult to assess the impact of salts on the condition of broadleaved plants in early spring using simple visual and instrumental methods, but the presence of dangerous salt concentrations can be assessed by direct measurements of soil substrates and leachates, the simplest of which are conductivity values. High concentrations allow maintenance and flushing of rain gardens to be adjusted in the event of insufficient rainfall before active plant growth begins. Some studies show that at NaCl concentrations up to 150 mM, the application of low concentrations of zinc has a positive effect on plant resistance [121]. More comprehensive monitoring systems, including indicators of the soil microbiome and nutrient elements, should be targeted at fertilizer application, especially in the case of substrates designed for high leachate.
Following these recommendations will allow the development of sustainable rain garden systems even in cities with permanent snow cover in wintertime, like Moscow.
5. Conclusions
The mesocosm experiment clearly showed the negative impact of NaCl-based de-icers on the rain garden ecosystems. The negative effects on plants resulted in an oppressed condition, a decrease in stem height of 2–4 times, and changes in chemical composition with low nutrient content in ash. Consequences for soil health included a decrease in microbial biomass of 2 to 7 times, followed by an increase in the metabolic quotient of 2–2.5 times, which indicates stressful conditions for the soil microbiome. Although the negative effects were observed for all variants of soil constructions, the variant based on peat and carbonate sand was more resistant compared to the others. For this variant, plant oppression was lower than for the others, and microbial biomass and activity have almost recovered six months after salinization stopped. This outcome allows drawing a more general conclusion on the relevance of revising existing standards and guides for rain garden construction, which are mainly based on hydrologic properties and give less attention to soil health indicators. We recommend considering agrochemical and microbial indicators of soil health as sensitive predictors of the resilience of raingarden ecosystems to salinization stress. This can be achieved by using multicomponent mixtures composed of peat, loam, and carbonate sand. Finally, water management, drainage, and recycling systems in rain gardens shall be tuned to avoid water quality violations. During the 10–12 days of the snow melting period, the filtrate shall be drained to the sewage water system or treated locally, whereas the remaining part of the city water reused for irrigation is possible and recommended.
The research conclusions are based on the mesocosms experiment, which was limited in the number of investigated factors. The mechanisms of ion sorption by different natural and artificial materials used for soil construction (e.g., peat, biochar, vermiculite, or hydrogels), and the effects of different de-icers composition and doses were out of the experimental scope. Standard laboratory conditions of the mesocosm experiment limit extrapolation of the experimental outcomes to the larger areas and real-life conditions, where the effects of de-icers on plants and soil health will also depend on the seasonal dynamics of microclimatic conditions and complex anthropogenic pressures (e.g., physical disturbance or pollution by heavy metals and oil products). These limitations shall be addressed by further research, including multi-factorial laboratory and field experiments, real-time monitoring in Living Labs, and process-based modeling. This approach will further improve our understanding of the functionality of rain gardens’ ecosystems under the stressful conditions of an urban environment
Author Contributions
Conceptualization, O.R.; methodology, O.R.; software, A.S.; validation, O.R., V.V. and I.S.; formal analysis, E.K., A.L. and A.S.; investigation, A.L.; resources, O.R.; data curation, E.K.; writing—original draft preparation, O.R.; writing—review and editing, V.V., E.K., I.S. and A.S.; visualization, O.R. and E.K.; supervision, A.S. and V.V.; project administration, O.R.; funding acquisition, O.R. All authors have read and agreed to the published version of the manuscript.
Funding
Lab experiments and monitoring, water, soil chemical and hydrophysical analyses, data analyses, and paper preparation were supported by the Russian Science Foundation, Project No. 23-77-01069. Soil microbiology analysis and data preparation in this area were supported by the RUDN University Scientific Projects Grant System, Project No. 202103-2-000. The effect of de-icing salt on the elemental composition of plants was supported by project FSSF-2024-0023.
Data Availability Statement
The data presented in the study are available upon request from the corresponding authors.
Acknowledgments
We would like to thank the Soil-Ecological Laboratory of RUDN Agrarian-Technological Institute and Egor Berezhnoi for his valuable assistance in conducting the laboratory experiments.
Conflicts of Interest
The authors declare no conflicts of interest.
References
- German Advisory Council on Global Change (WBGU). Annual Report; WBGU: Berlin, Germany, 2021. [Google Scholar]
- Sarkar, C.; Webster, C. Healthy Cities of Tomorrow: The Case for Large Scale Built Environment–Health Studies. J. Urban Health 2017, 94, 4–19. [Google Scholar] [CrossRef] [PubMed]
- Baccini, M.; Biggeri, A.; Accetta, G.; Kosatsky, T.; Katsouyanni, K.; Analitis, A.; Anderson, H.R.; Bisanti, L.; D’Ippoliti, D.; Danova, J.; et al. Effects of Summer Heat on Mortality in 15 European Cities: Results of the EU PHEWE Project. Epidemiology 2008, 19, 711–719. [Google Scholar] [CrossRef]
- Revi, A. Urban Areas. In Climate Change 2014: Impacts, Adaptation, and Vulnerability. Part A: Global and Sectoral Aspects. Contribution of Working Group II to the Fifth Assessment Report of the Intergovernmental Panel on Climate Change; Field, C.B., Barros, V.R., Dokken, D.J., Mach, K.J., Mastrandrea, M.D., Bilir, T.E., Chatterjee, M., Ebi, K.L., Estrada, Y.O., Genova, R.C., et al., Eds.; Cambridge University Press: Cambridge, UK, 2014; pp. 535–612. [Google Scholar]
- United Nations Department of Economic and Social Affairs (UN DESA). Sustainable Development Goals. Available online: https://sdgs.un.org/goals (accessed on 18 March 2025).
- The European Green Deal. Available online: https://ec.europa.eu/info/publications/communication-european-green-deal_en (accessed on 18 March 2025).
- Proposal for a Regulation on Nature Restoration. Available online: https://environment.ec.europa.eu/publications/nature-restoration-law_en (accessed on 18 March 2025).
- EU Nature Restoration Law. Available online: https://eur-lex.europa.eu/legal-content/EN/TXT/?uri=CELEX%3A32024R1991&qid=1722240349976 (accessed on 18 March 2025).
- Castellar, J.A.C.; Russo, A.; Giezen, M. Nature-Based Solutions in the Climate Adaptation Policy Arena: Worldwide Expert Survey on Mainstreaming Challenges. Environ. Sci. Policy 2021, 120, 36–45. [Google Scholar] [CrossRef]
- Stuhlmacher, M.; Woods, J.; Yang, L.; Sarigai, S. How does the composition and configuration of green space influence urban noise?: A systematic literature review. Curr. Landsc. Ecol. Rep. 2024, 9, 73–87. [Google Scholar] [CrossRef]
- Jiang, B.; Fan, S.; Sun, C.; Mu, S.; Gao, T.; Qiu, L. The regulation effect of urban green space on air particulate matter concentration under different matrices in Xi’an city. Air Qual. Atmos. Health 2024, 17, 1951–1968. [Google Scholar] [CrossRef]
- Shen, J.; Cui, P.; Huang, Y.; Wu, Y.; Luo, Y.; Sin, C.H.; Guan, J. New insights on precise regulation of pollutant distribution inside a street canyon by different vegetation planting patterns. Environ. Sci. Pollut. Res. 2023, 30, 63148–63174. [Google Scholar] [CrossRef]
- Vashist, M.; Kumar, T.V.; Singh, S.K. A comprehensive review of urban vegetation as a Nature-based Solution for sustainable management of particulate matter in ambient air. Environ. Sci. Pollut. Res. 2024, 31, 26480–26496. [Google Scholar] [CrossRef] [PubMed]
- Zhang, X.; Huang, H.; Tu, K.; Li, R.; Zhang, X.; Wang, P.; Li, Y.; Yang, Q.; Acerman, A.C.; Guo, N.; et al. Effects of plant community structural characteristics on carbon sequestration in urban green spaces. Sci. Rep. 2024, 14, 7382. [Google Scholar] [CrossRef]
- Ren, Z.; Zhao, H.; Fu, Y.; Xiao, L.; Dong, Y. Effects of urban street trees on human thermal comfort and physiological indices: A case study in Changchun city, China. J. For. Res. 2021, 33, 911–922. [Google Scholar] [CrossRef]
- Ahmed, N.M.; Altamura, P.; Giampaoletti, M.; Hemeida, F.A.; Mohamed, A.F.A. Optimizing human thermal comfort and mitigating the urban heat island effect on public open spaces in Rome, Italy through sustainable design strategies. Sci. Rep. 2024, 14, 19931. [Google Scholar] [CrossRef]
- Bowler, D.E.; Callaghan, C.T.; Felappi, J.F.; Mason, B.M.; Hutchinson, R.; Kumar, P.; Jones, L. Evidence-base for urban green-blue infrastructure to support insect diversity. Urban Ecosyst. 2024, 28, 54. [Google Scholar] [CrossRef] [PubMed]
- Wang, J.; Zhao, M.; Xu, M.; Li, Y.; Gou, A. Effect of land cover types evolution in megacities on flood regulation capacity: The case of Zhengzhou since 1990. Nat. Hazards 2024, 121, 3001–3021. [Google Scholar] [CrossRef]
- Fontanarrosa, M.S.; Gómez, L.; Avigliano, L.; Lavarello, A.; Zunino, G.; Sinistro, R.; Vera, M.S.; Allende, L. Land uses in cities and their impacts on the water quality of urban freshwater blue spaces in the Pampean region (Argentina). Environ. Monit. Assess. 2023, 195, 648. [Google Scholar] [CrossRef] [PubMed]
- Koner, K.; Samanta, G. Urban environment and sustainable water supply: A comprehensive analysis of Darjeeling city, India. Environ. Dev. Sustain. 2021, 23, 17459–17482. [Google Scholar] [CrossRef]
- Garber, M.D.; Benmarhnia, T.; Zhou, W.; Mudu, P.; Rojas-Rueda, D. Greening urban areas in line with population density and ecological zone can reduce premature mortality. Commun. Earth Environ. 2024, 5, 650. [Google Scholar] [CrossRef]
- Niazi, Z.; Khan, M.A. Greening South Asian cities for health: A study of urban green space usage and physical well-being. Environ. Dev. Sustain. 2024, 1–24. Available online: https://link.springer.com/article/10.1007/s10668-024-05527-z#citeas (accessed on 21 April 2025).
- Xu, J.; Liu, N.; Polemiti, E.; Garcia-Mondragon, L.; Tang, J.; Liu, X.; Lett, T.; Yu, L.; Nöthen, M.M.; Feng, J.; et al. Effects of urban living environments on mental health in adults. Nat. Med. 2023, 29, 1456–1467. [Google Scholar] [CrossRef] [PubMed]
- Sharma, R.; Malaviya, P. Management of stormwater pollution using green infrastructure: The role of rain gardens. Wiley Interdiscip. Rev. Water 2021, 8, e1507. [Google Scholar] [CrossRef]
- Burszta-Adamiak, E.; Biniak-Pieróg, M.; Dąbek, P.B.; Sternik, A. Rain garden hydrological performance—Responses to real rainfall events. Sci. Total Environ. 2023, 887, 164153. [Google Scholar] [CrossRef] [PubMed]
- Shi, C.-H.; He, B.-B.; Zhao, J.-L.; Liu, Y.-H.; Liu, A. Characterising polycyclic aromatic hydrocarbons in road dusts and stormwater in urban environments. Environ. Monit. Assess. 2024, 196, 791. [Google Scholar] [CrossRef]
- Spence, K.; Gilbert, I.; Robson, M. Stormwater suspended solids and pollutant concentrations in an urban stream. Water Air Soil Pollut. 2023, 234, 599. [Google Scholar] [CrossRef]
- Popick, H.; Brinkmann, M.; McPhedran, K. Assessment of stormwater discharge contamination and toxicity for a cold-climate urban landscape. Environ. Sci. Eur. 2022, 34, 43. [Google Scholar] [CrossRef] [PubMed]
- Howard, K.W.F.; Maier, H. Road de-icing salt as a potential constraint on urban growth in the Greater Toronto Area, Canada. J. Contam. Hydrol. 2006, 91, 146–170. [Google Scholar] [CrossRef] [PubMed]
- Venkatesan, A.K.; Ahmad, S.; Johnson, W.; Batista, J.R. Systems dynamic model to forecast salinity load to the Colorado River due to urbanization within the Las Vegas Valley. Sci. Total Environ. 2011, 409, 2616–2625. [Google Scholar] [CrossRef]
- Li, Z.; Liang, Y.; Zhou, J.; Sun, X. Impacts of de-icing salt pollution on urban road greenspace: A case study of Beijing. Front. Environ. Sci. Eng. 2014, 8, 747–756. [Google Scholar] [CrossRef]
- Smagin, A.V.; Azovtseva, N.A.; Smagina, M.V.; Stepanov, A.L.; Myagkova, A.D.; Kurbatova, A.S. Some criteria and methods for assessing the ecological state of soils in connection with the greening of urban areas. Soil Sci. 2006, 5, 603–615. (In Russian) [Google Scholar]
- Cain, N.P.; Hale, B.; Berkalaar, E.; Morin, D. Review of Effects of NaCl and Other Road Salts on Terrestrial Vegetation in Canada; Report for Commercial Chemicals Evaluation Branch; Environment Canada: Ottawa, ON, Canada, 2001.
- Cunningham, M.A.; Snyder, E.; Yonkin, D.; Ross, M.; Elsen, T. Accumulation of deicing salts in soils in an urban environment. Urban Ecosyst. 2007, 11, 17–31. [Google Scholar] [CrossRef]
- Litalien, A.; Zeeb, B. Curing the earth: A review of anthropogenic soil salinization and plant-based strategies for sustainable mitigation. Sci. Total Environ. 2019, 698, 134235. [Google Scholar] [CrossRef]
- Ke, C.; Li, Z.; Liang, Y.; Tao, W.; Du, M. Impacts of chloride de-icing salt on bulk soils, fungi, and bacterial populations surrounding the plant rhizosphere. Appl. Soil Ecol. 2013, 72, 69–78. [Google Scholar] [CrossRef]
- Setia, R.; Marschner, P.; Baldock, J.; Chittleborough, D.; Smith, P.; Smith, J. Salinity effects on carbon mineralization in soils of varying texture. Soil Biol. Biochem. 2011, 43, 1908–1916. [Google Scholar] [CrossRef]
- Gerasimov, A.; Chugunova, M.; Polyak, Y. Changes in Salinity and Toxicity of Soil Contaminated with De-Icing Agents during Growing Season. Environ. Res. Eng. Manag. 2021, 77, 53–62. [Google Scholar] [CrossRef]
- Fay, L.; Shi, X. Environmental impacts of chemicals for snow and ice control: State of the knowledge. Water Air Soil Pollut. 2012, 223, 2751–2770. [Google Scholar] [CrossRef]
- Kobayashi, H.; Sato, S.; Masaoka, Y. Tolerance of grasses to calcium chloride, magnesium chloride and sodium chloride. Plant Prod. Sci. 2004, 7, 30–35. [Google Scholar] [CrossRef]
- Ramakrishna, D.M.; Viraraghavan, T. Environmental impact of chemical deicers—A review. Water Air Soil Pollut. 2005, 166, 49–63. [Google Scholar] [CrossRef]
- Bäckström, M.; Karlsson, S.; Bäckman, L.; Folkeson, L.; Lind, B. Mobilisation of heavy metals by deicing salts in a roadside environment. Water Res. 2003, 38, 720–732. [Google Scholar] [CrossRef]
- Pecher, W.T.; Madadha, M.E.A.; DasSarma, P.; Ekulona, F.; Schott, E.J.; Crowe, K.; Gut, B.S.; DasSarma, S. Effects of road salt on microbial communities: Halophiles as biomarkers of road salt pollution. PLoS ONE 2019, 14, e0221355. [Google Scholar] [CrossRef] [PubMed]
- Rath, K.M.; Rousk, J. Salt effects on the soil microbial decomposer community and their role in organic carbon cycling: A review. Soil Biol. Biochem. 2014, 81, 108–123. [Google Scholar] [CrossRef]
- Zhang, G.; Bai, J.; Zhai, Y.; Jia, J.; Zhao, Q.; Wang, W.; Hu, X. Microbial diversity and functions in saline soils: A review from a biogeochemical perspective. J. Adv. Res. 2023, 59, 129–140. [Google Scholar] [CrossRef] [PubMed]
- Zhang, Q.; Wakelin, S.A.; Liang, Y.; Chu, G. Soil microbial activity and community structure as affected by exposure to chloride and chloride-sulfate salts. J. Arid. Land 2018, 10, 737–749. [Google Scholar] [CrossRef]
- Yan, N.; Marschner, P. Response of Soil Respiration and Microbial Biomass to Changing EC in Saline Soils. Soil Biol. Biochem. 2013, 65, 322–328. [Google Scholar] [CrossRef]
- Sardinha, M.; Müller, T.; Schmeisky, H.; Joergensen, R.G. Microbial Performance in Soils along a Salinity Gradient under Acidic Conditions. Appl. Soil Ecol. 2003, 23, 237–244. [Google Scholar] [CrossRef]
- Wong, V.N.L.; Dalal, R.C.; Greene, R.S.B. Salinity and Sodicity Effects on Respiration and Microbial Biomass of Soil. Biol. Fertil. Soils 2008, 44, 943–953. [Google Scholar] [CrossRef]
- Jandová, V.; Bucková, M.; Hegrová, J.; Dostál, I.; Huzlík, J.; Effenberger, K.; Ličbinský, R. The Relationship among Precipitation, Application of Salt in Winter Road Maintenance and the Quality of Waterways and Soil around Motorway. Water 2020, 12, 2206. [Google Scholar] [CrossRef]
- Shannon, T.P.; Ahler, S.J.; Mathers, A.; Ziter, C.D.; Dugan, H.A. Road salt impact on soil electrical conductivity across an urban landscape. J. Urban Ecol. 2020, 6, juaa006. [Google Scholar] [CrossRef]
- Equiza, M.A.; Calvo-Polanco, M.; Cirelli, D.; Señorans, J.; Wartenbe, M.; Saunders, C.; Zwiazek, J.J. Long-term impact of road salt (NaCl) on soil and urban trees in Edmonton, Canada. Urban For. Urban Green. 2017, 21, 16–28. [Google Scholar] [CrossRef]
- Löfgren, S. The chemical effects of deicing salt on soil and stream water of five catchments in Southeast Sweden. Water Air Soil Pollut. 2001, 130, 863–868. [Google Scholar] [CrossRef]
- Sharma, S.; Bhatt, R. Monitoring Water and Soil Salinity across Mentor Marsh to Investigate Their Temporal and Spatial Variability. Water 2023, 15, 4172. [Google Scholar] [CrossRef]
- Low Impact Development Stormwater Management Planning and Design Guide. Toronto and Region Conservation Authority. Available online: https://trca.ca/conservation/stormwater-management/understand/lid-swm-guide-v1-0_2010_1_no-appendices/download (accessed on 18 March 2025).
- Franti, T.G.; Rodie, S.N. Stormwater Management: Installing Rain Gardens in Your Yard; NebGuides on Designing and Installing Rain Gardens to Provide a Functional and Aesthetic Means for Reducing Stormwater Runoff in Urban Areas, G1760; University of Nebraska—Lincoln Extension Publications: Lincoln, NE, USA, 2007. [Google Scholar]
- Hassani, A.; Azapagic, A.; Shokri, N. Predicting long-term dynamics of soil salinity and sodicity on a global scale. Proc. Natl. Acad. Sci. USA 2020, 117, 33017–33027. [Google Scholar] [CrossRef]
- Devkota, K.P.; Devkota, M.; Rezaei, M.; Oosterbaan, R. Managing salinity for sustainable agricultural production in salt-affected soils of irrigated drylands. Agric. Syst. 2022, 198, 103390. [Google Scholar] [CrossRef]
- Jesus, J.M.; Danko, A.S.; Fiúza, A.; Borges, M.-T. Phytoremediation of salt-affected soils: A review of processes, applicability, and the impact of climate change. Environ. Sci. Pollut. Res. 2015, 22, 6511–6525. [Google Scholar] [CrossRef]
- Ju, J.-H. Salt Tolerance of Phragmites australis and Effect of Combing It with Topsoil Filters on Biofiltration of CaCl2 Contaminated Soil. Sustainability 2024, 16, 8522. [Google Scholar] [CrossRef]
- Zhang, W.; Burgis, C.R.; Hayes, G.M.; Henderson, D.A.; Smith, J.A. Mitigation of Deicing Salt Loading to Water Resources by Transpiration from Green Infrastructure Vegetation. Land 2022, 11, 907. [Google Scholar] [CrossRef]
- Three Rivers Rain Garden Alliance. Available online: http://raingardenalliance.org/ (accessed on 26 October 2023).
- Woods Ballard, B.; Udele-Clarke, H.W.; Illman, S.; Scott, T.; Ashley, R.; Kellagher, R. Sustainable Drainage Systems Manual, Publication C753; CIRIA: London, UK, 2015. [Google Scholar]
- Schulte-Herbrüggen, H.; Mácsik, J.; Andersson, J. Raingardens for Stormwater Management—Potential of Raingardens in a Nordic Climate. 2019. Available online: https://www.diva-portal.org/smash/get/diva2:1370826/FULLTEXT01.pdf (accessed on 26 October 2023).
- Sayanov, A.A.; Kondratenko, Y.A.; Shchukin, I.S.; Butserova, O.V. Rain Garden Design: A Methodological Guide, 2nd ed.; LAEN Guild: Moscow, Russia, 2023; pp. 5–7. (In Russian) [Google Scholar]
- Shchukin, I.S.; Melekhin, A.G. Device for Purification of Surface Sewage Waters. RU Patent 2540620, 10 February 2015. Available online: https://rusneb.ru/catalog/000224_000128_0002540620_20150210_C1_RU/ (accessed on 21 April 2025). (In Russian).
- GOST 12536-2014; Soils. Methods of Laboratory Granulometric (Grain-Size) and Microaggregate Distribution. Federal Agency for Technical Regulation and Metrology: Moscow, Russia, 2019. (In Russian)
- Smagin, A. Disjoining pressure model for the entire soil water retention curve. CATENA 2025, 254, 108909. [Google Scholar] [CrossRef]
- van Genuchten, M.T. A closed-form equation for predicting the hydraulic conductivity of unsaturated soils. Soil Sci. Soc. Am. J. 1980, 44, 892–898. [Google Scholar] [CrossRef]
- Smagin, A.V. Synthetic Gel Structures in Soils and Soil Structures; Justitsinform: Moscow, Russia, 2020; p. 556. (In Russian) [Google Scholar]
- Shein, E.V.; Karpachevsky, L.O. Theories and Methods of Soil Physics; Grif and K: Moscow, Russia, 2007; p. 616. (In Russian) [Google Scholar]
- GOST 26423-85; Soils. Methods for Determination of Specific Electric Conductivity, pH and Solid Residue of Water Extract. USSR Gosstandart: Moscow, Russia, 2011. (In Russian)
- GOST 26483-85; Soils. Preparations of Salt Extract and Determination of Its pH by CINAO Method. USSR Gosstandart: Moscow, Russia, 2023. (In Russian)
- GOST 26205-91; Soils. Determination of Mobile Compounds of Phosphorus and Potassium by Machigin Method Modified by CINAO. USSR Gosstandart: Moscow, Russia, 2015. (In Russian)
- GOST 26204-91; Soils. Determination of Mobile Compounds of Phosphorus and Potassium by Chiricov Method Modified by CINAO. USSR Gosstandart: Moscow, Russia, 2015. (In Russian)
- GOST R 54650-2011; Soils. Determination of Mobile Phosphorus and Potassium Compounds by Kirsanov Method Modified by CINAO. Federal Agency for Technical Regulation and Metrology: Moscow, Russia, 2021. (In Russian)
- GOST 26427-85; Soils. Method for Determination of Sodium and Potassium in Water Extract. USSR Gosstandart: Moscow, Russia, 2015. (In Russian)
- GOST R 58596-2019; Soils. Methods for Determination of Total Nitrogen. Federal Agency for Technical Regulation and Metrology: Moscow, Russia, 2021. (In Russian)
- Romzaykina, O.N.; Slukovskaya, M.V.; Paltseva, A.A.; Losev, A.I.; Korneykova, M.V.; Vasenev, V.I. Rapid assessment of soil contamination by potentially toxic metals in the green spaces of Moscow megalopolis using the portable X-ray analyzer. J. Soils Sediments 2024, 25, 539–556. [Google Scholar] [CrossRef]
- GOST 26425-85; Soils. Methods for Determination of Chloride Ion in Water Extract. USSR Gosstandart: Moscow, Russia, 2015. (In Russian)
- GOST R 57165-2016 (ISO 11885:2007); Water. Determination of Elements by Inductively Coupled Plasma Atomic Emission Spectrometry. Federal Agency for Technical Regulation and Metrology: Moscow, Russia, 2021. (In Russian)
- GOST 26487-85; Soils. Determination of Exchangeable Calcium and Exchangeable (Mobile) Magnesium by CINAO methods. USSR Gosstandart: Moscow, Russia, 2015. (In Russian)
- Bhaduri, D.; Sihi, D.; Bhowmik, A.; Verma, B.C.; Munda, S.; Dari, B. A review on effective soil health bio-indicators for ecosystem restoration and sustainability. Front. Microbiol. 2022, 13, 938481. [Google Scholar] [CrossRef] [PubMed]
- Ananyeva, N.D.; Susyan, E.A.; Chernova, O.V.; Wirth, S. Microbial respiration activities of soils from different climatic regions of European Russia. Eur. J. Soil Biol. 2007, 44, 147–157. [Google Scholar] [CrossRef]
- Anderson, T.-H.; Domsch, K.H. Soil Microbial Biomass: The Eco-Physiological Approach. Soil Biol. Biochem. 2010, 42, 2039–2043. [Google Scholar] [CrossRef]
- Regulations on the Performance of Work on Comprehensive Maintenance of Yard Territories in the City of Moscow (No. 01-01-14-226/17). Order of the Department of Fuel and Energy Management of the city of Moscow, Moscow, Russia, 2017. Available online: https://docs.cntd.ru/document/550947972 (accessed on 21 April 2025). (In Russian).
- Weather Schedule. Available online: https://rp5.ru (accessed on 20 February 2025).
- GOST R 56881-2016; Biomass. Determination of Ash Content by Standard Method. Federal Agency for Technical Regulation and Metrology: Moscow, Russia, 2021. (In Russian)
- Methodological Guidelines for the Determination of Heavy Metals in Agricultural Soils and Crop Products by NPO (Typhoon)–CINAO. 2021. Available online: https://docs.cntd.ru/document/1200078918 (accessed on 21 April 2025). (In Russian).
- M-MVI 80-2008; Methods for Measuring the Mass Fraction of Elements in Soil Samples, Soils and Bottom Sediments by Atomic Emission and Atomic Absorption Spectrometry. 2008. Available online: https://files.stroyinf.ru (accessed on 21 April 2025). (In Russian)
- Smagin, A.V. Column-centrifugation method for determining water retention curves of soils and disperse sediments. Eurasian Soil Sci. 2012, 45, 416–422. [Google Scholar] [CrossRef]
- Moscow Government Decree N 514-PP from July 27, 2004 as amended as of October 25, 2011. Available online: https://docs.cntd.ru/document/3660473 (accessed on 21 April 2025).
- Demina, S.; Vasenev, V.; Ivashchenko, K.; Ananyeva, N.; Plyushchikov, V.; Hajiaghayeva, R.; Dovletyarova, E. Microbial properties of urban soils with different Land-Use history in New Moscow. Soil Sci. 2018, 183, 132–140. [Google Scholar] [CrossRef]
- Ivashchenko, K.; Sushko, S.; Selezneva, A.; Ananyeva, N.; Zhuravleva, A.; Kudeyarov, V.; Makarov, M.; Blagodatsky, S. Soil microbial activity along an altitudinal gradient: Vegetation as a main driver beyond topographic and edaphic factors. Appl. Soil Ecol. 2021, 168, 104197. [Google Scholar] [CrossRef]
- McDaris, J.R.; Feinberg, J.M.; Runkel, A.C.; Levine, J.; Kasahara, S.; Alexander, E.C. Documentation and prediction of increasing groundwater chloride in the twin Cities, Minnesota. Ground Water 2022, 60, 837–850. [Google Scholar] [CrossRef] [PubMed]
- Jamshidi, A.; Goodarzi, A.R.; Razmara, P. Long-term impacts of road salt application on the groundwater contamination in urban environments. Environ. Sci. Pollut. Res. 2020, 27, 30162–30177. [Google Scholar] [CrossRef]
- Rivett, M.O.; Cuthbert, M.O.; Gamble, R.; Connon, L.E.; Pearson, A.; Shepley, M.G.; Davis, J. Highway deicing salt dynamic runoff to surface water and subsequent infiltration to groundwater during severe UK winters. Sci. Total Environ. 2016, 565, 324–338. [Google Scholar] [CrossRef] [PubMed]
- Szklarek, S.; Górecka, A.; Wojtal-Frankiewicz, A. The effects of road salt on freshwater ecosystems and solutions for mitigating chloride pollution—A review. Sci. Total Environ. 2021, 805, 150289. [Google Scholar] [CrossRef]
- Hintz, W.D.; Relyea, R.A. A review of the species, community, and ecosystem impacts of road salt salinisation in fresh waters. Freshw. Biol. 2019, 64, 1081–1097. [Google Scholar] [CrossRef]
- Xiong, R.; Chu, C.; Qiao, N.; Wang, L.; Yang, F.; Sheng, Y.; Guan, B.; Niu, D.; Geng, J.; Chen, H. Performance evaluation of asphalt mixture exposed to dynamic water and chlorine salt erosion. Constr. Build. Mater. 2019, 201, 121–126. [Google Scholar] [CrossRef]
- Terry, L.G.; Conaway, K.; Rebar, J.; Graettinger, A.J. Alternative Deicers for Winter Road Maintenance—A Review. Water Air Soil Pollut. 2020, 231, 394. [Google Scholar] [CrossRef]
- On Approval of Water Quality Standards for Water Bodies of Fisheries Importance, Including Standards for Maximum Permissible Concentrations of Harmful Substances in the Waters of Water Bodies of Fisheries Importance. Order No. 552 of December 13, 2016, Ministry of Agriculture of Russian Federation. Available online: http://publication.pravo.gov.ru/Document/View/0001201701160006 (accessed on 18 March 2025).
- EPA 44015-88-001; Ambient Aquatic Life Water Quality Criteria for Chloride. United States Environmental Protection Agency: Minnesota, MN, USA, 1988.
- Canadian Water Quality Guidelines for the Protection of Aquatic Life. In Phosphorus: Canadian Guidance Framework for the Management of Freshwater Systems; Canadian Council of Ministers of the Environment: Winnipeg, MB, Canada. Available online: https://www.ccme.ca/en/res/phosphorus-en-canadian-water-quality-guidelines-for-the-protection-of-aquatic-life.pdf (accessed on 18 March 2025).
- GB 8978-1996; China Integrated Wastewater Discharge Standard. Ministry of ecology and environment of the People’s Republic of China: Beijing, China, 1996. (In Chinese)
- RG 644; On Approval of the Rules of Cold Water Supply and Water Disposal and on Amendments to Certain Acts of the Government of the Russian Federation. Government of the Russian Federation: Moscow, Russia, 2013. (In Russian)
- Ayers, R.S.; Westcot, D.W. FAO irrigation and drainage paper. In Water Quality for Agriculture; Food and Agriculture Organization of the United Nations: Rome, Italy, 1994; Available online: https://www.fao.org/4/t0234e/t0234e00.htm (accessed on 21 April 2025).
- Wichern, J.; Wichern, F.; Joergensen, R.G. Impact of salinity on soil microbial communities and the decomposition of maize in acidic soils. Geoderma 2006, 137, 100–108. [Google Scholar] [CrossRef]
- Akbour, R.A.; Amal, H.; Ait-Addi, A.; Douch, J.; Jada, A.; Hamdani, M. Transport and retention of humic acid through natural quartz sand: Influence of the ionic strength and the nature of divalent cation. Colloids Surf. A Physicochem. Eng. Asp. 2013, 436, 589–598. [Google Scholar] [CrossRef]
- Salinity Management Guide: Choose Salt-Tolerant Plants. Available online: https://watereuse.org/salinity-management/cp/cp_7_table-5.html (accessed on 21 April 2025).
- Kratsch, H. Soil Salinity and Ornamental Plant Selection; DigitalCommons@USU: Logan, UT, USA, 2008; Available online: https://digitalcommons.usu.edu/extension_curall/1079 (accessed on 21 April 2025).
- Han, Z.; Zhang, H.; Zhou, G.L. Change of growth and physiological characteristics of daylily under mixed salt stress. J. Henan Agric. Sci. 2020, 49, 116–122. [Google Scholar] [CrossRef]
- Li, D.; Xia, Y.; Lou, J.; Zhang, D.; Wang, X.; Zhang, J. A Comparative Study between Evergreen and Deciduous Daylily Species Reveals the Potential Contributions of Winter Shoot Growth and Leaf Freezing Tolerance to Foliar Habits. J. Plant Growth Regul. 2019, 39, 1030–1045. [Google Scholar] [CrossRef]
- Tan, Y.-X.; Liang, J.; Zhang, Z.; Dong, S.-Q.; Cao, J.-F.; Qin, Q.-P.; Zhang, Z.-G.; Ni, D.-A. Cloning and molecular characterisation of a putative glyoxalase I Gene (HfGlX I-1) of Daylily (Hemerocallis spp.). J. Plant Biochem. Biotechnol. 2022, 32, 265–273. [Google Scholar] [CrossRef]
- Sedelnikova, L.L.; Tsandekova, O.L. Investigation of the biochemical composition in the leaves of representatives of the genus Hemerocallis l. In the conditions of the cities of the novosibirsk region. Chem. Plant Raw Mater. 2022, 3, 151–158. [Google Scholar] [CrossRef]
- Sedel’nikova, L.L.; Chankina, O.V. The elemental composition of the vegetative organs of sorts Regal air and Speak to me of Hemerocallis hybrida. Chem. Plant Raw Mater. 2020, 1, 245–250. [Google Scholar] [CrossRef]
- Sedel’nikova, L.L.; Chankina, O.V. The content of heavy metals in the vegetative organs of Hemerocallis hybrida in urban environment. Bull. KrasGAU 2016, 2, 34–43. [Google Scholar]
- Mahiwal, S.; Pandey, G.K. Potassium: A vital nutrient mediating stress tolerance in plants. J. Plant Biochem. Biotechnol. 2022, 31, 705–719. [Google Scholar] [CrossRef]
- Houmani, H.; Corpas, F.J. Can nutrients act as signals under abiotic stress? Plant Physiol. Biochem. 2023, 206, 108313. [Google Scholar] [CrossRef]
- Sidhu, G.P.S.; Bali, A.S.; Singh, H.P.; Batish, D.R.; Kohli, R.K. Insights into the tolerance and phytoremediation potential of Coronopus didymus L. (Sm) grown under zinc stress. Chemosphere 2019, 244, 125350. [Google Scholar] [CrossRef]
- Mushtaq, N.U.; Alghamdi, K.M.; Saleem, S.; Tahir, I.; Bahieldin, A.; Henrissat, B.; Alghamdi, M.K.; Rehman, R.U.; Hakeem, K.R. Exogenous zinc mitigates salinity stress by stimulating proline metabolism in proso millet (Panicum miliaceum L.). Front. Plant Scence 2023, 14, 1053869. [Google Scholar] [CrossRef]
- Noulas, C.; Tziouvalekas, M.; Karyotis, T. Zinc in soils, water and food crops. J. Trace Elem. Med. Biol. 2018, 49, 252–260. [Google Scholar] [CrossRef]
- Rousk, J.; Brookes, P.C.; BååTh, E. Contrasting soil pH effects on fungal and bacterial growth suggest functional redundancy in carbon mineralization. Appl. Environ. Microbiol. 2009, 75, 1589–1596. [Google Scholar] [CrossRef] [PubMed]
- Laukli, K.; Vinje, H.; Haraldsen, T.K.; Vike, E. Plant selection for roadside rain gardens in cold climates using real-scale studies of thirty-one herbaceous perennials. Urban For. Urban Green. 2022, 78, 127759. [Google Scholar] [CrossRef]
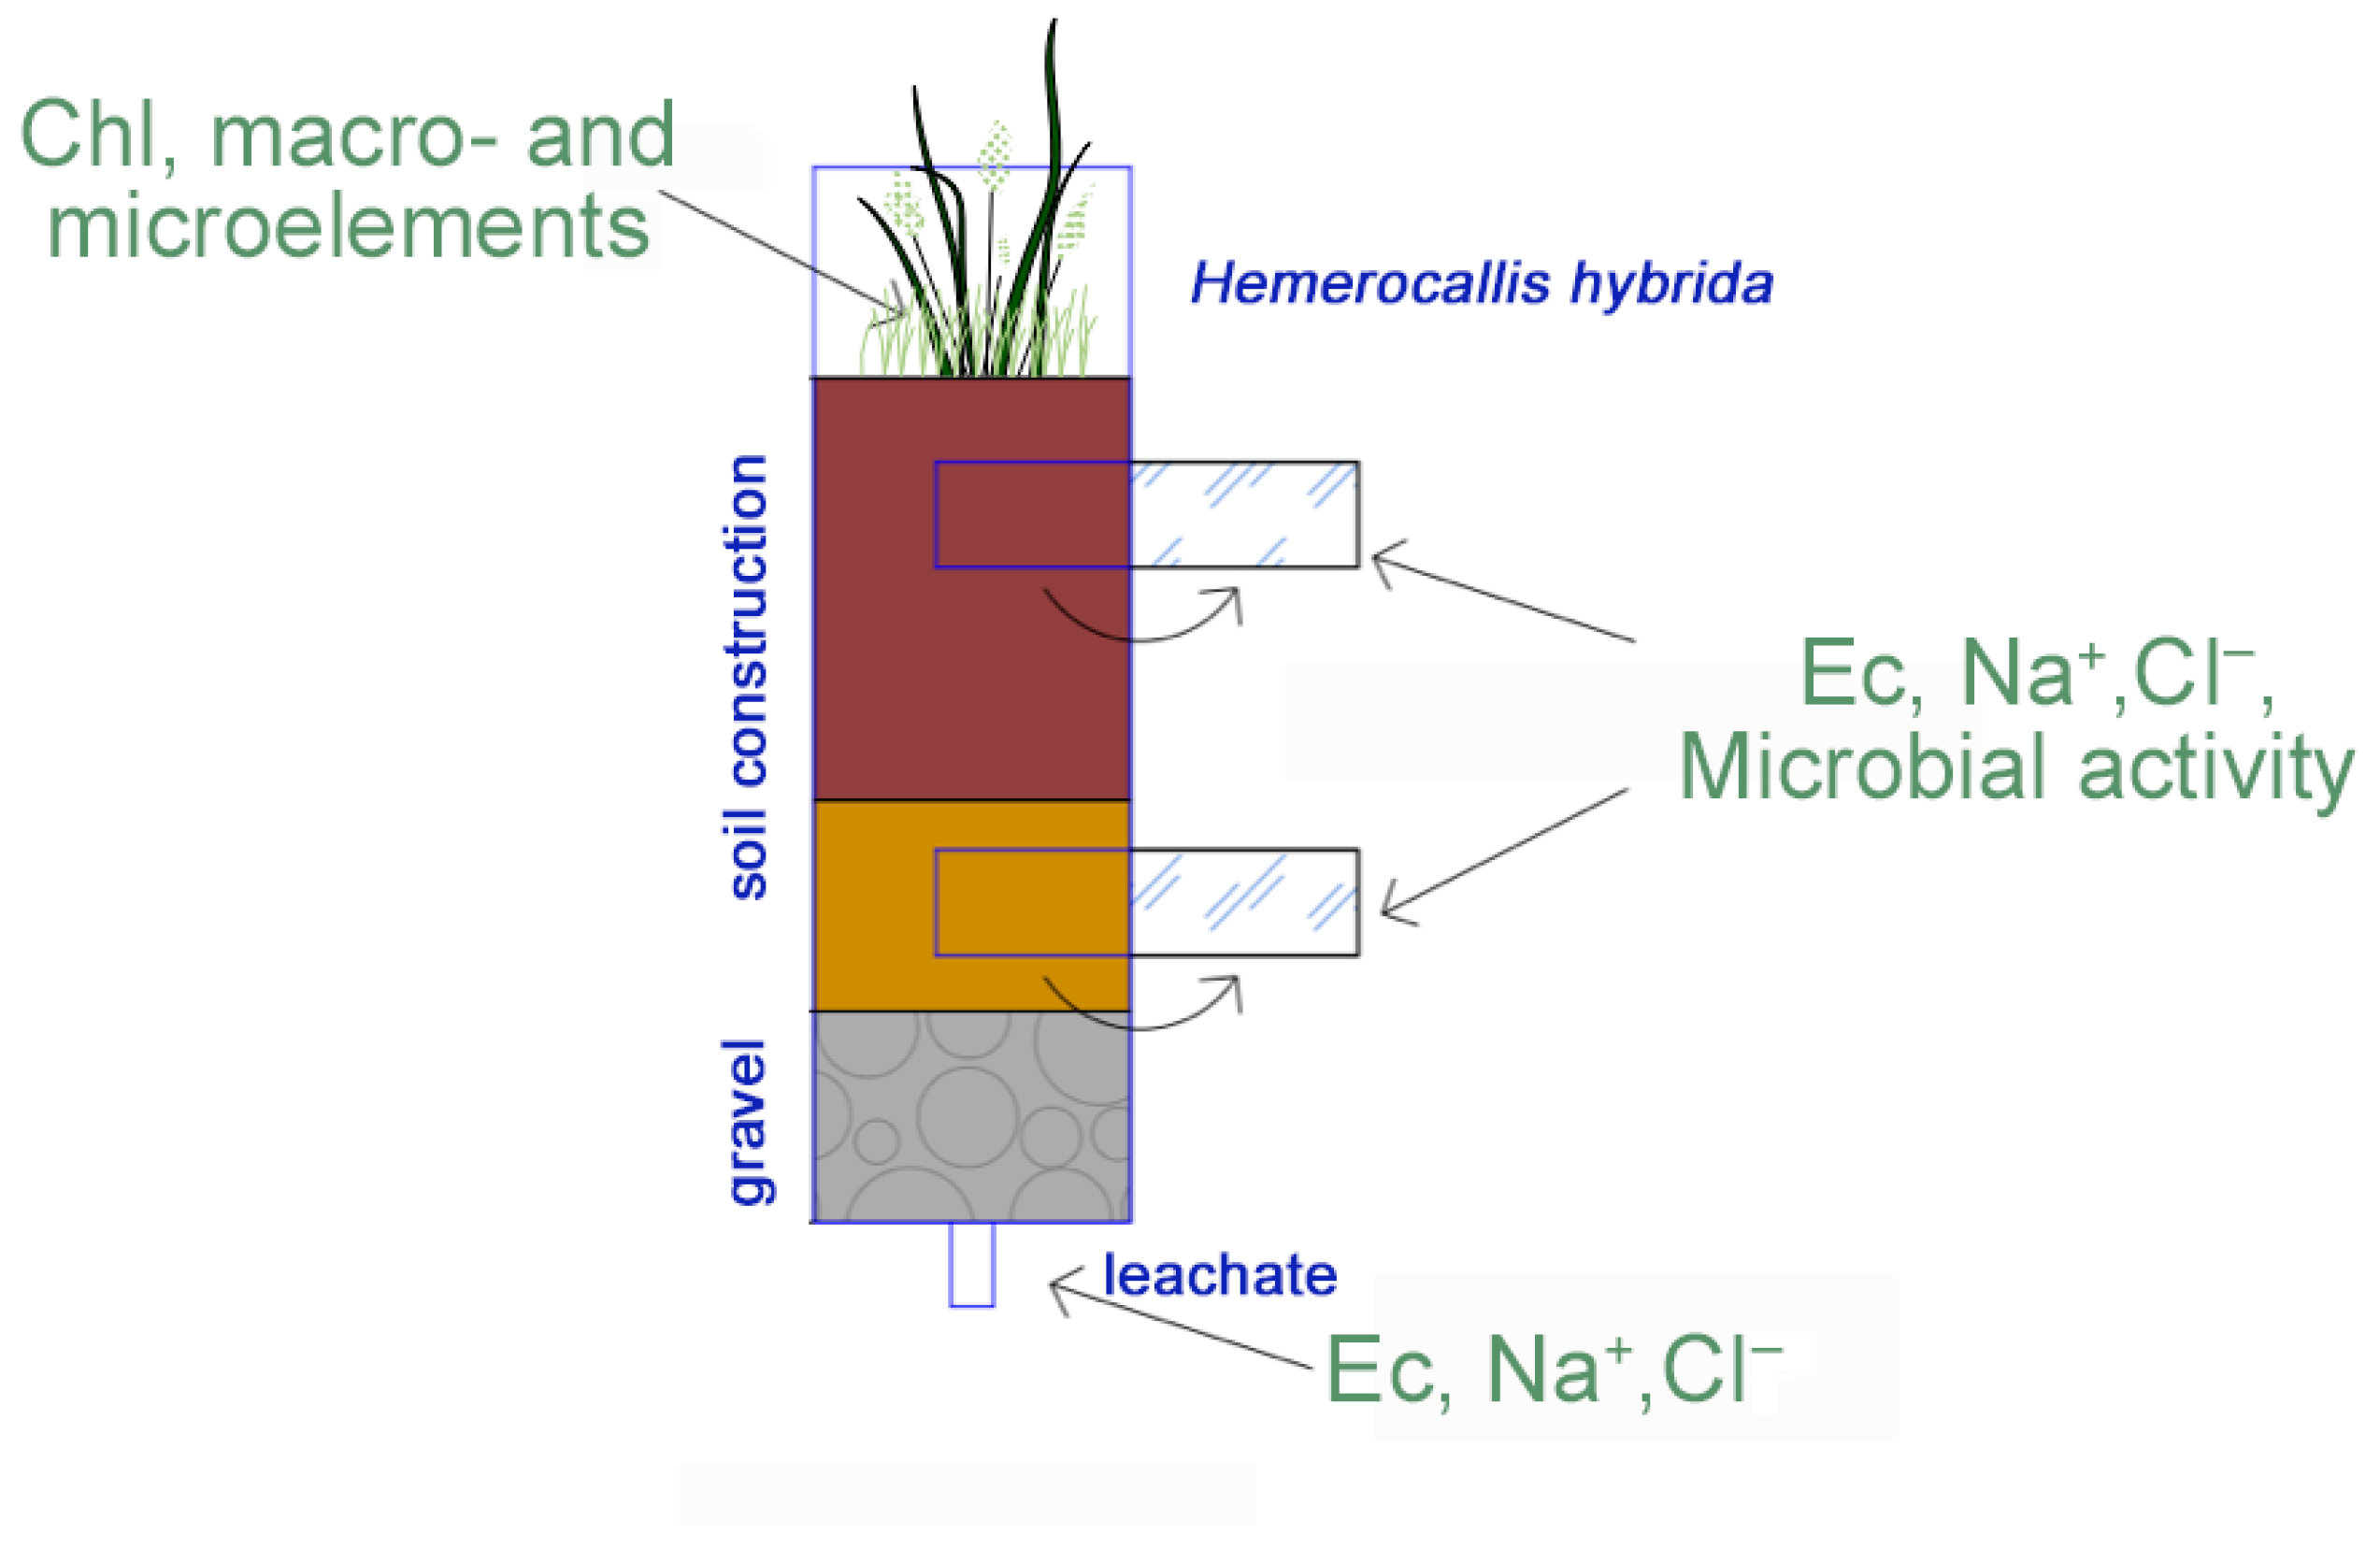
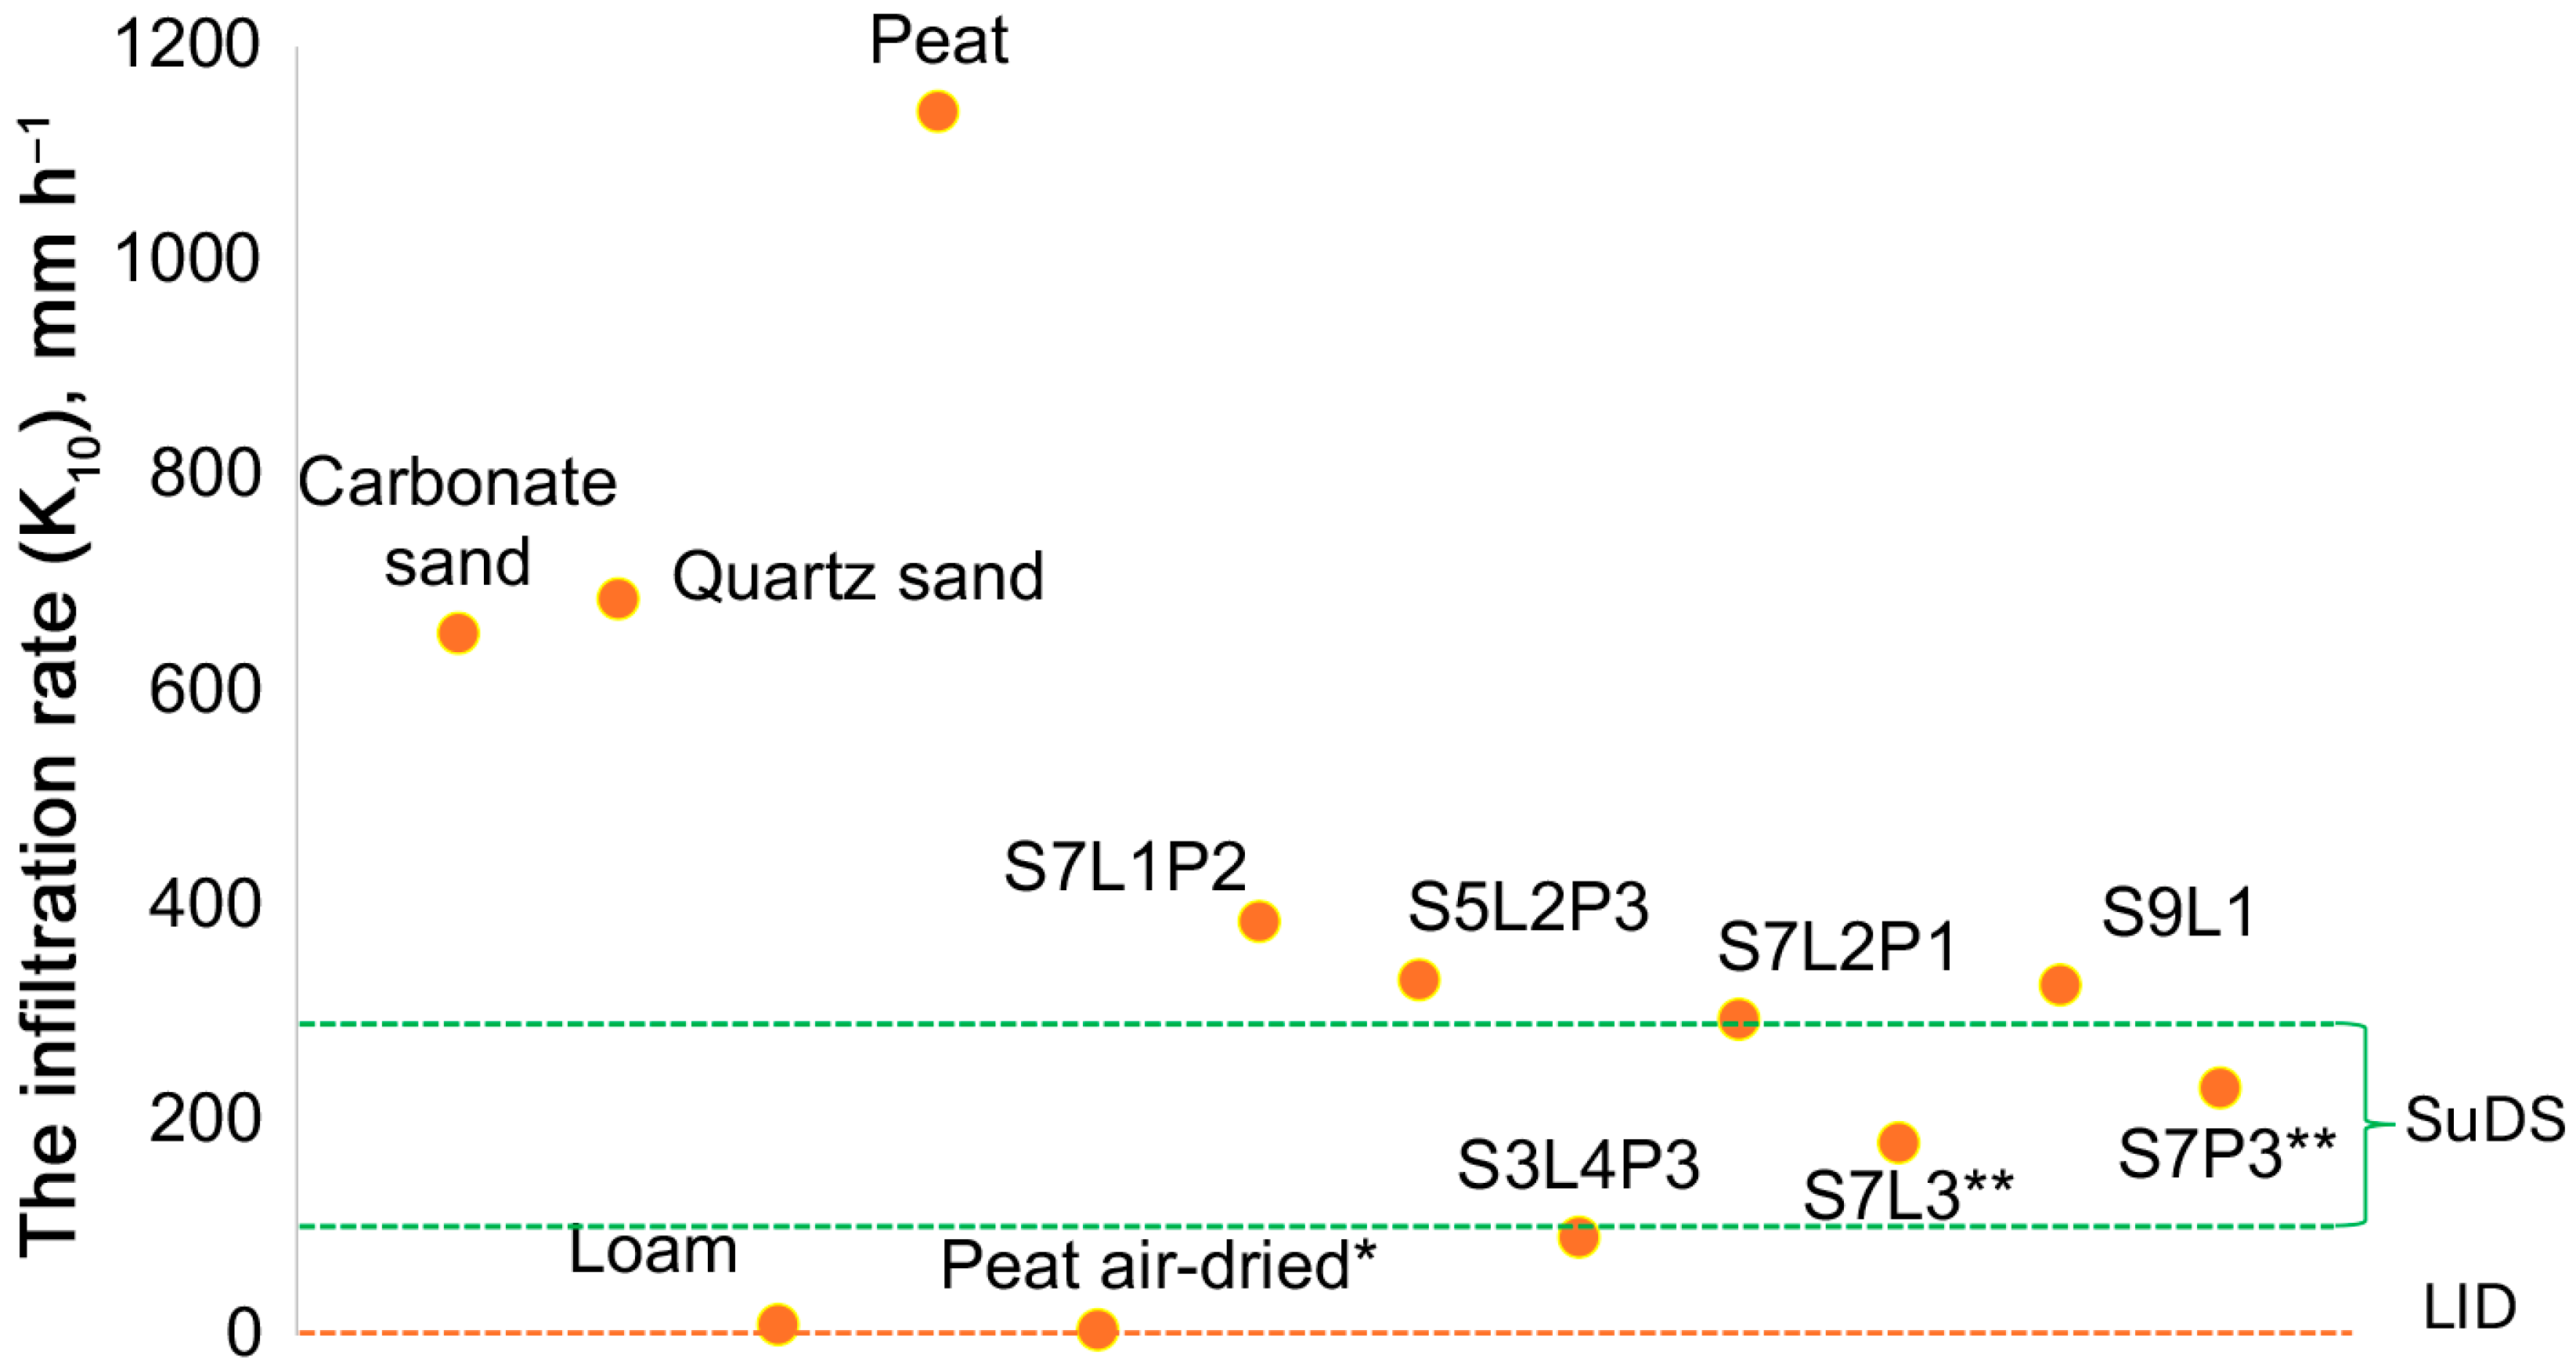
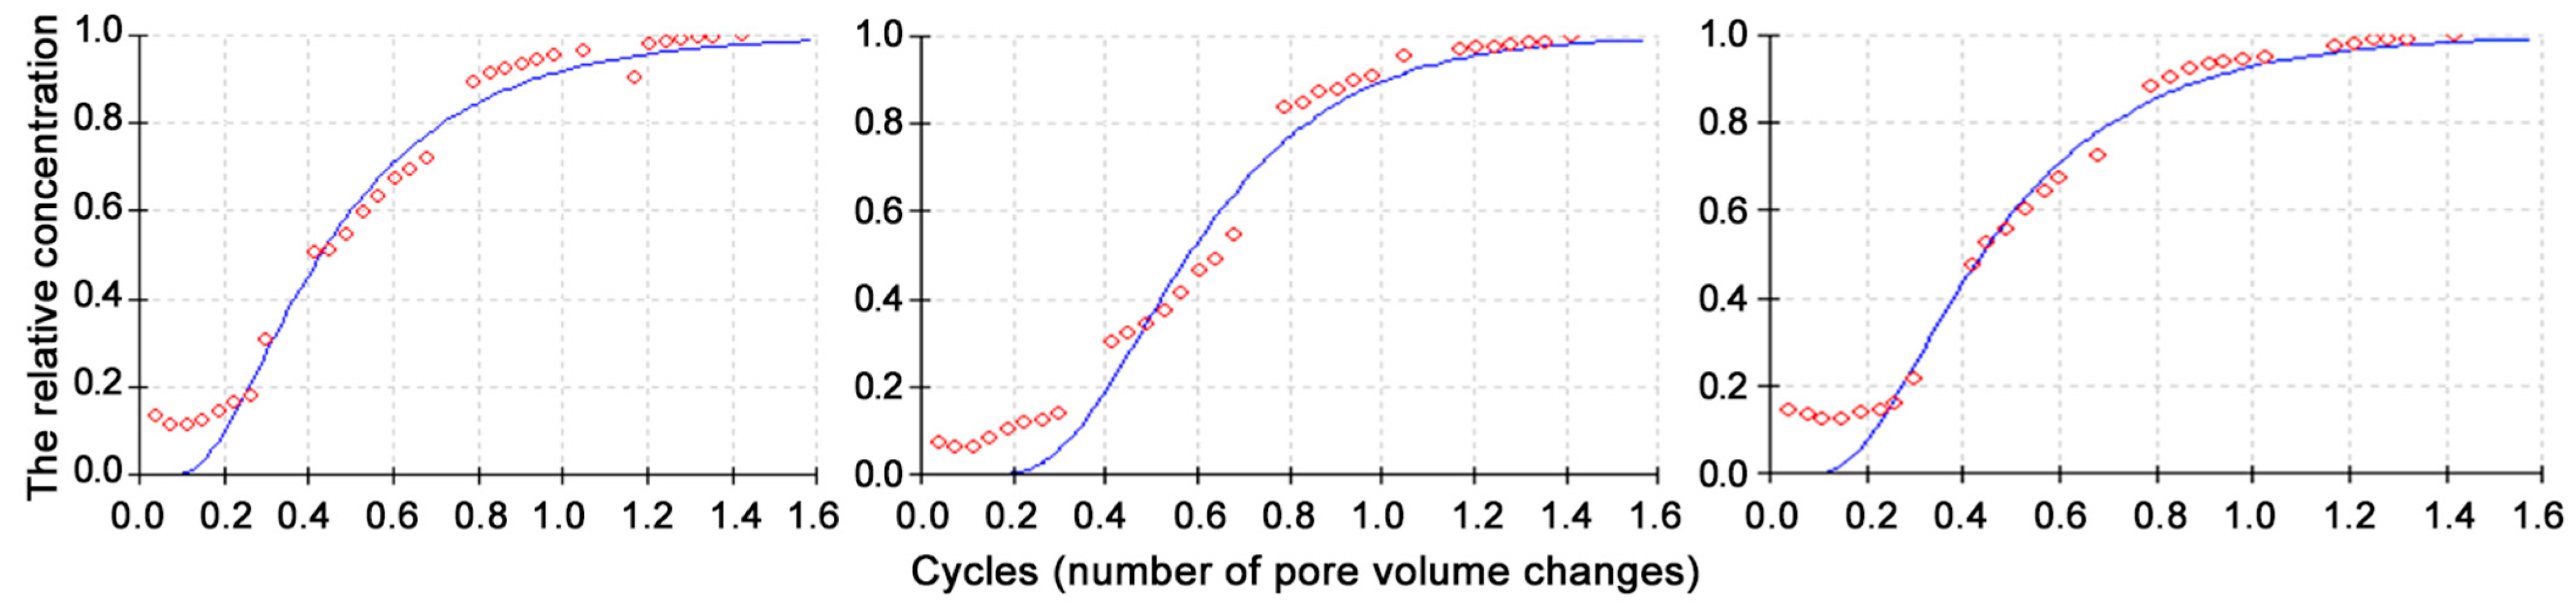
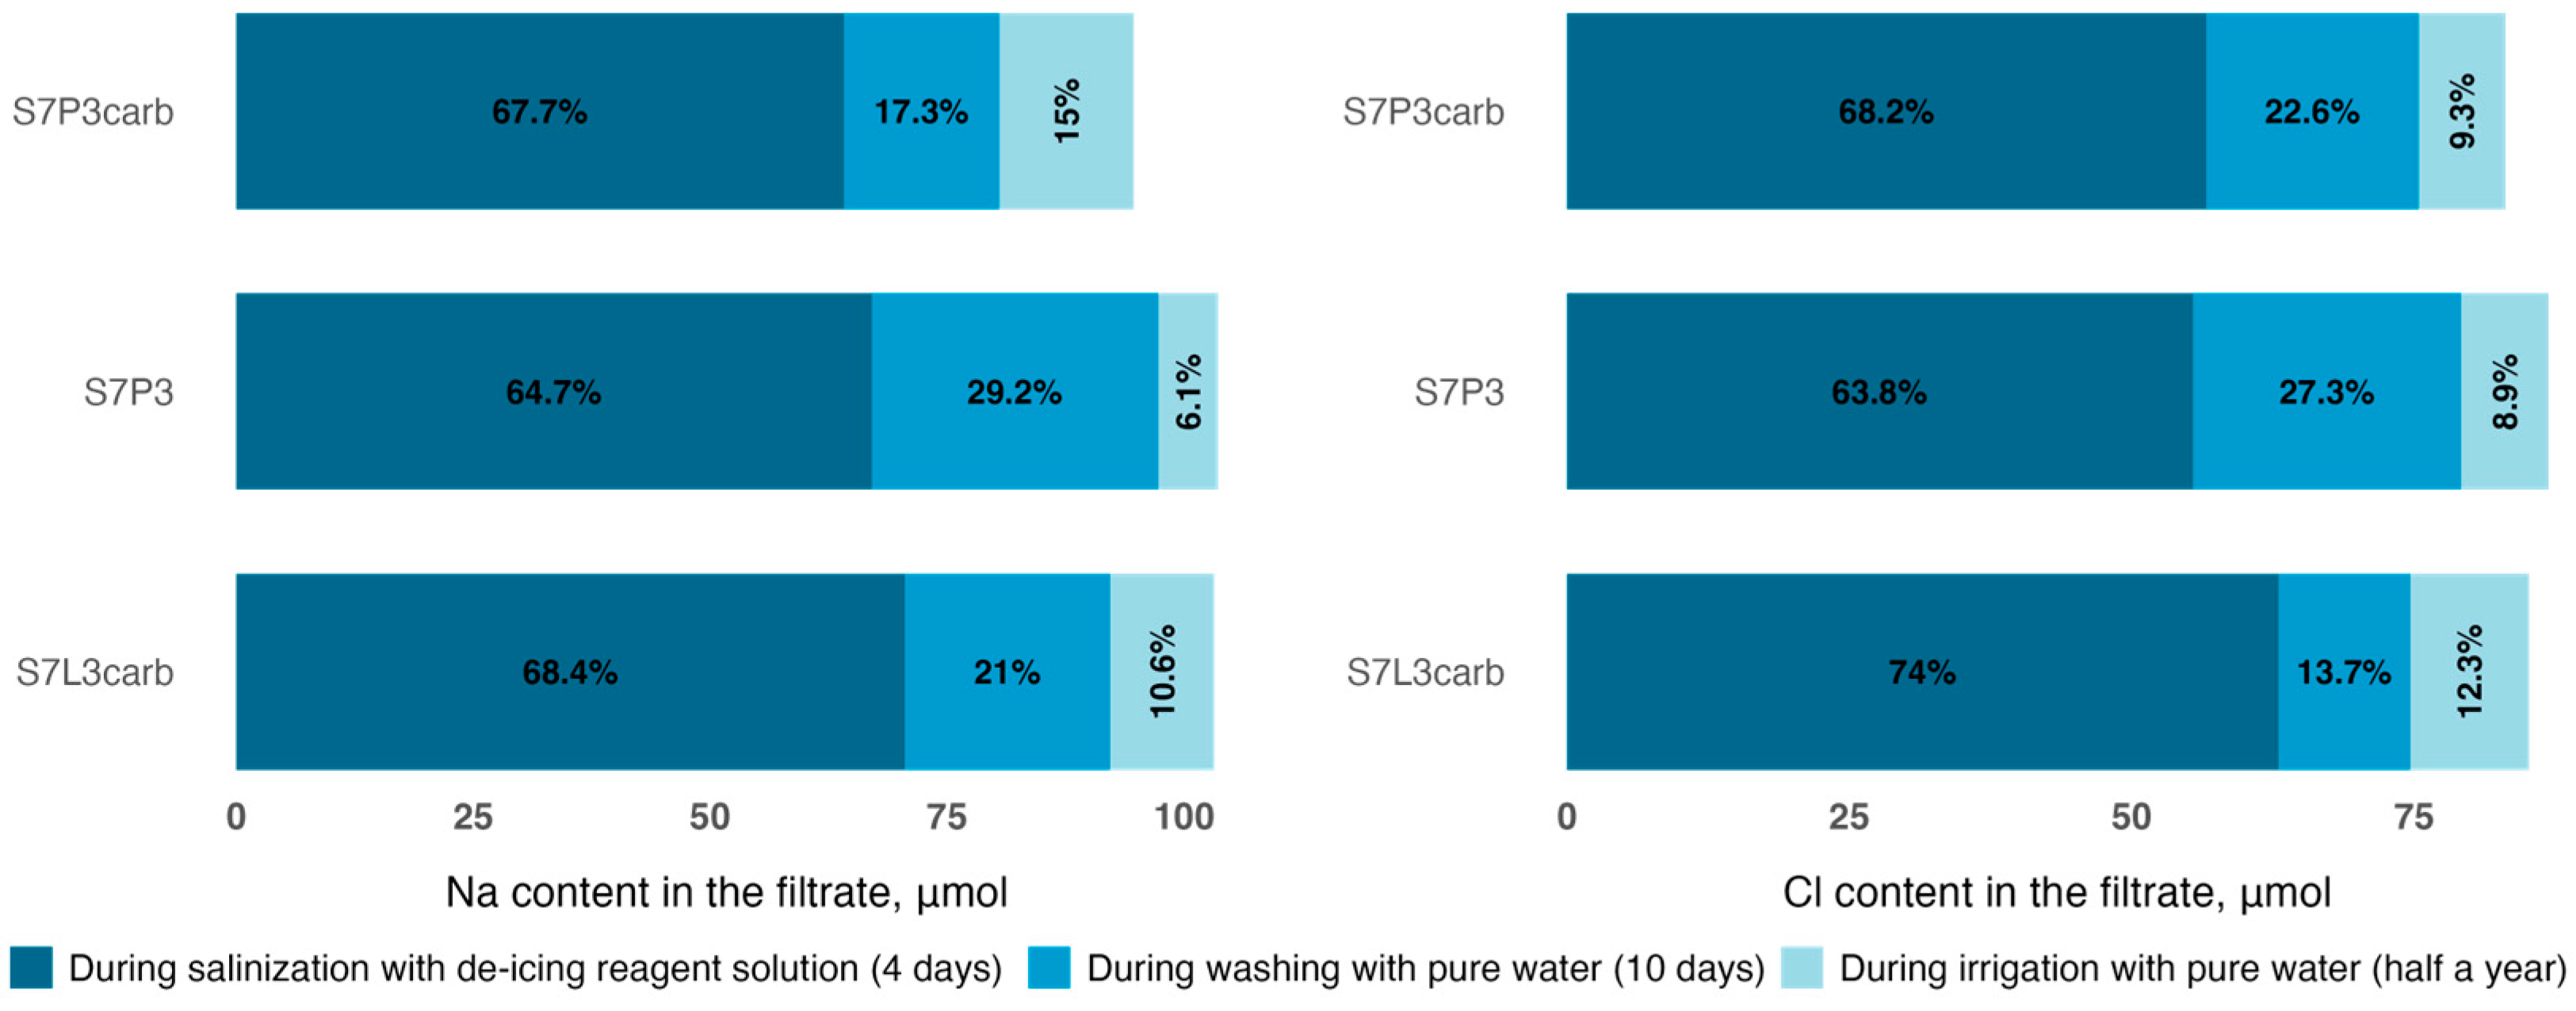
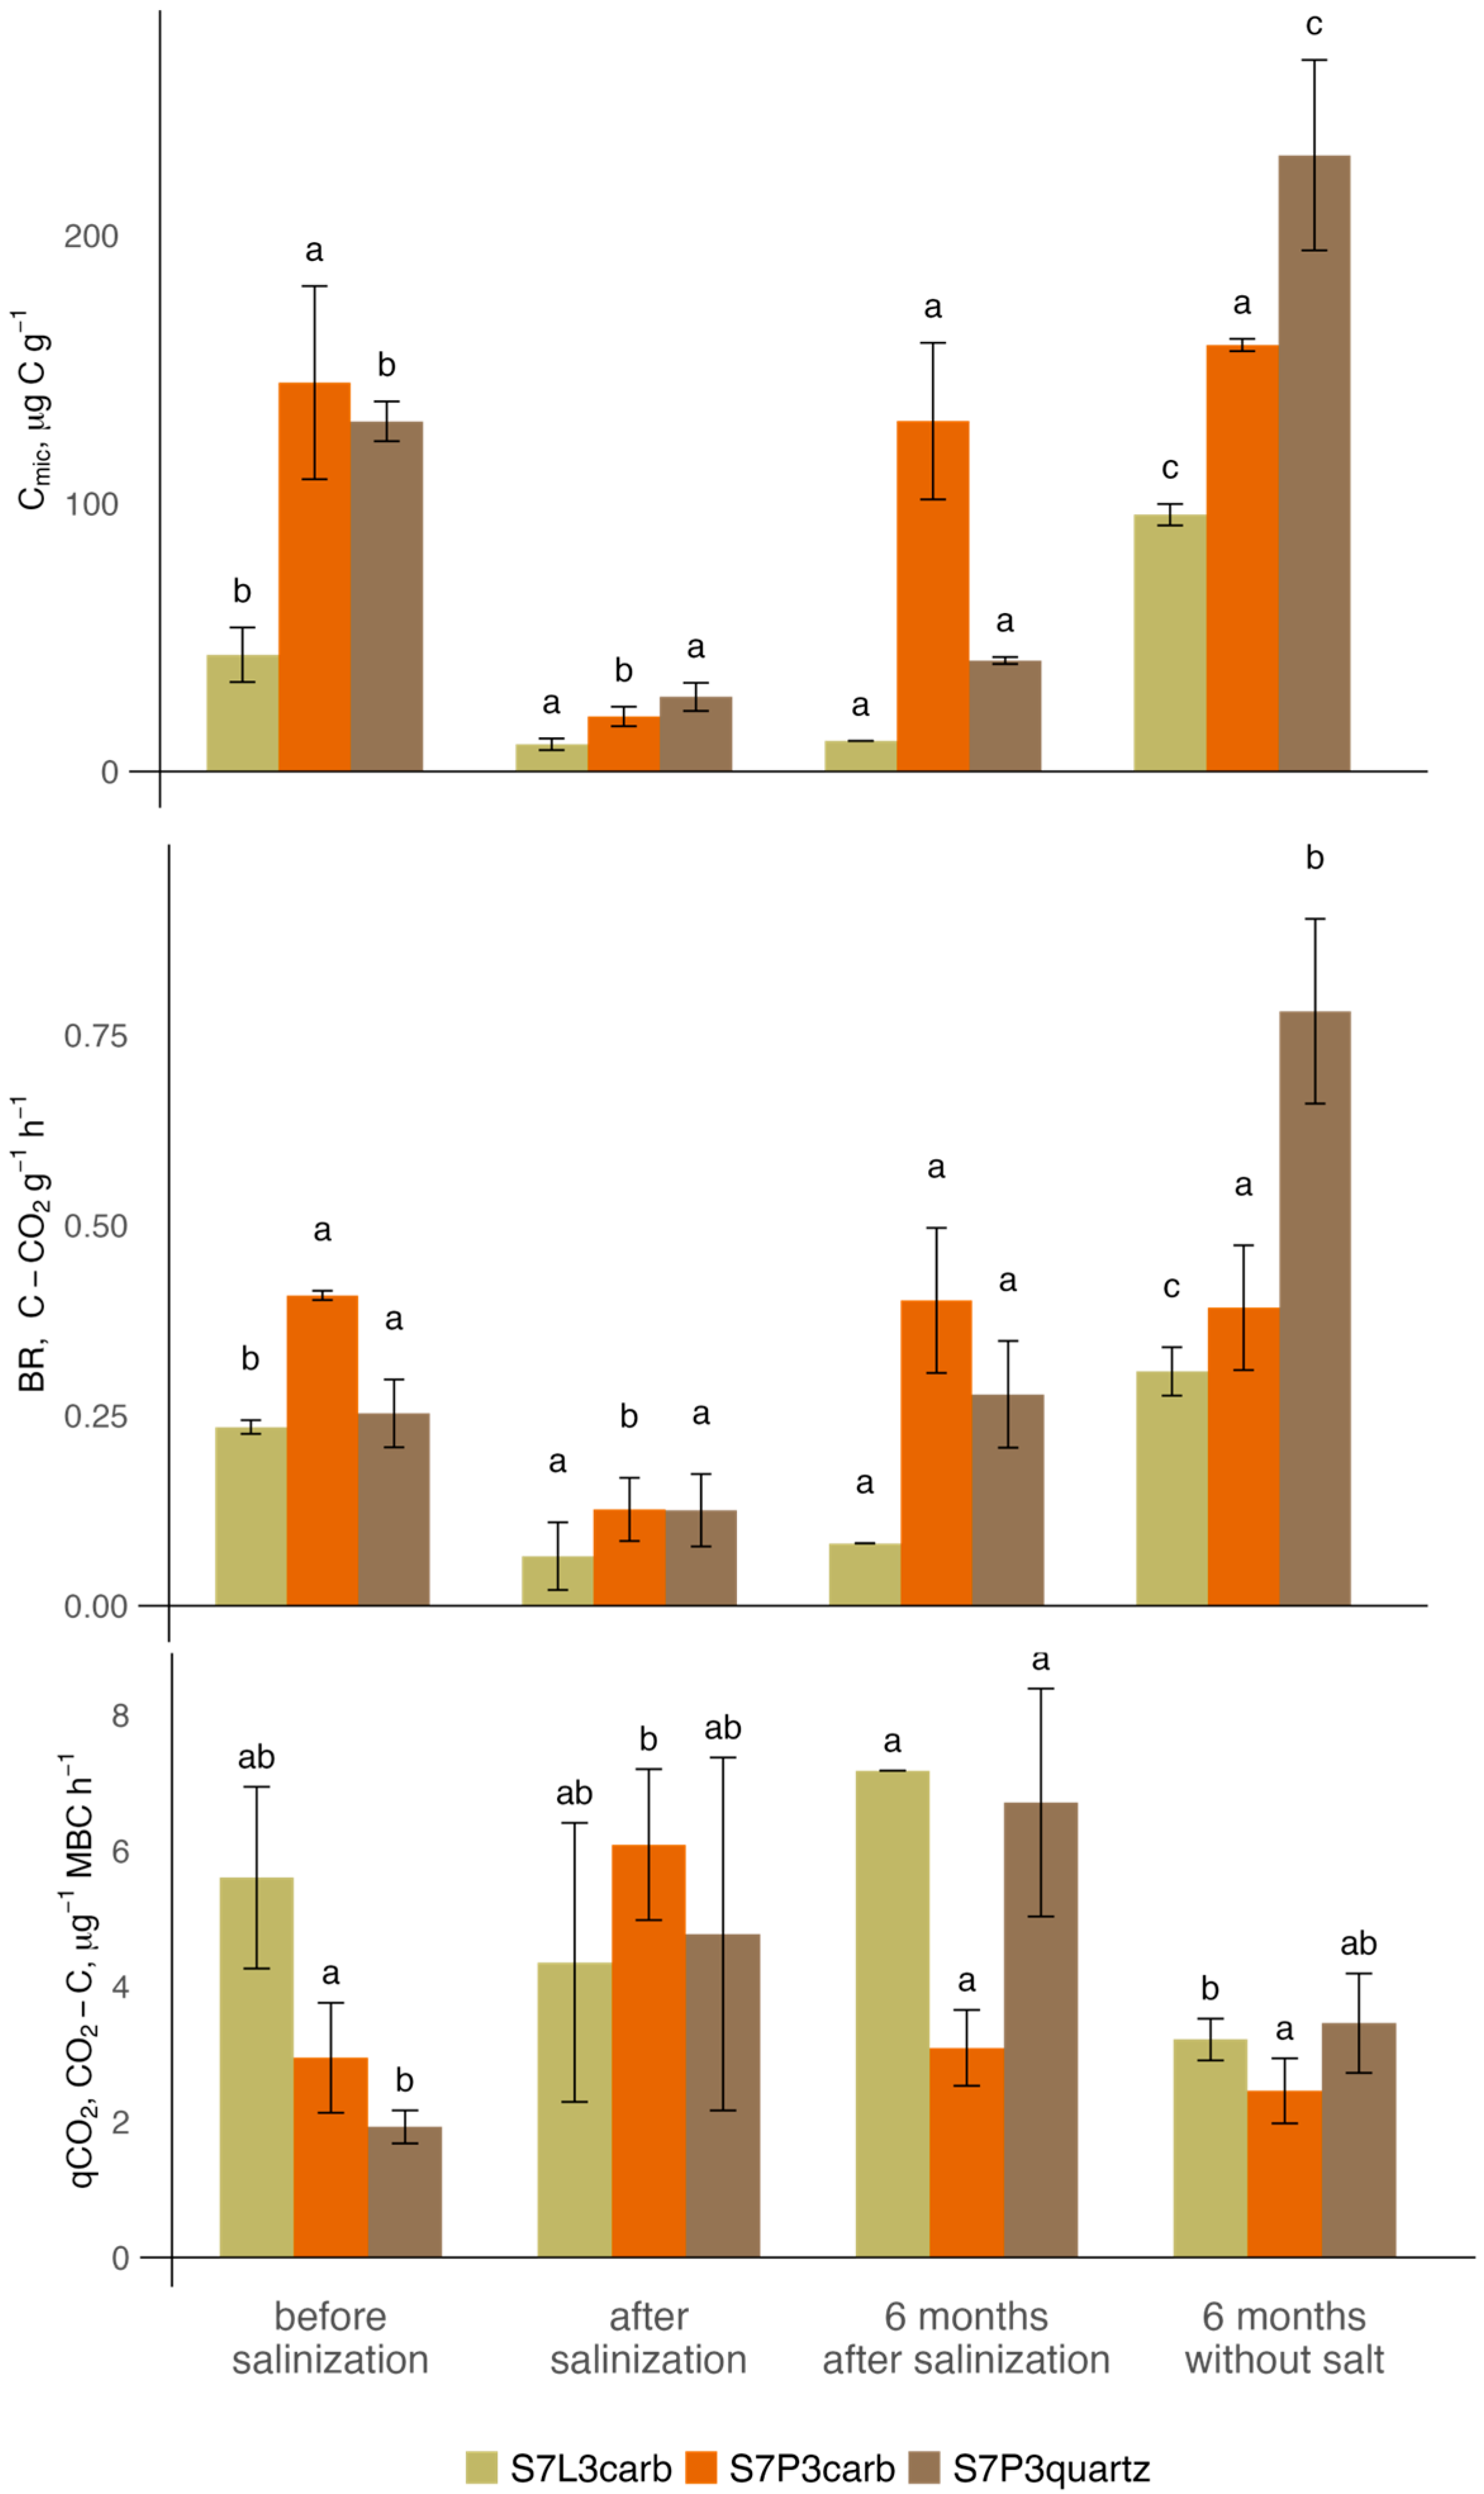
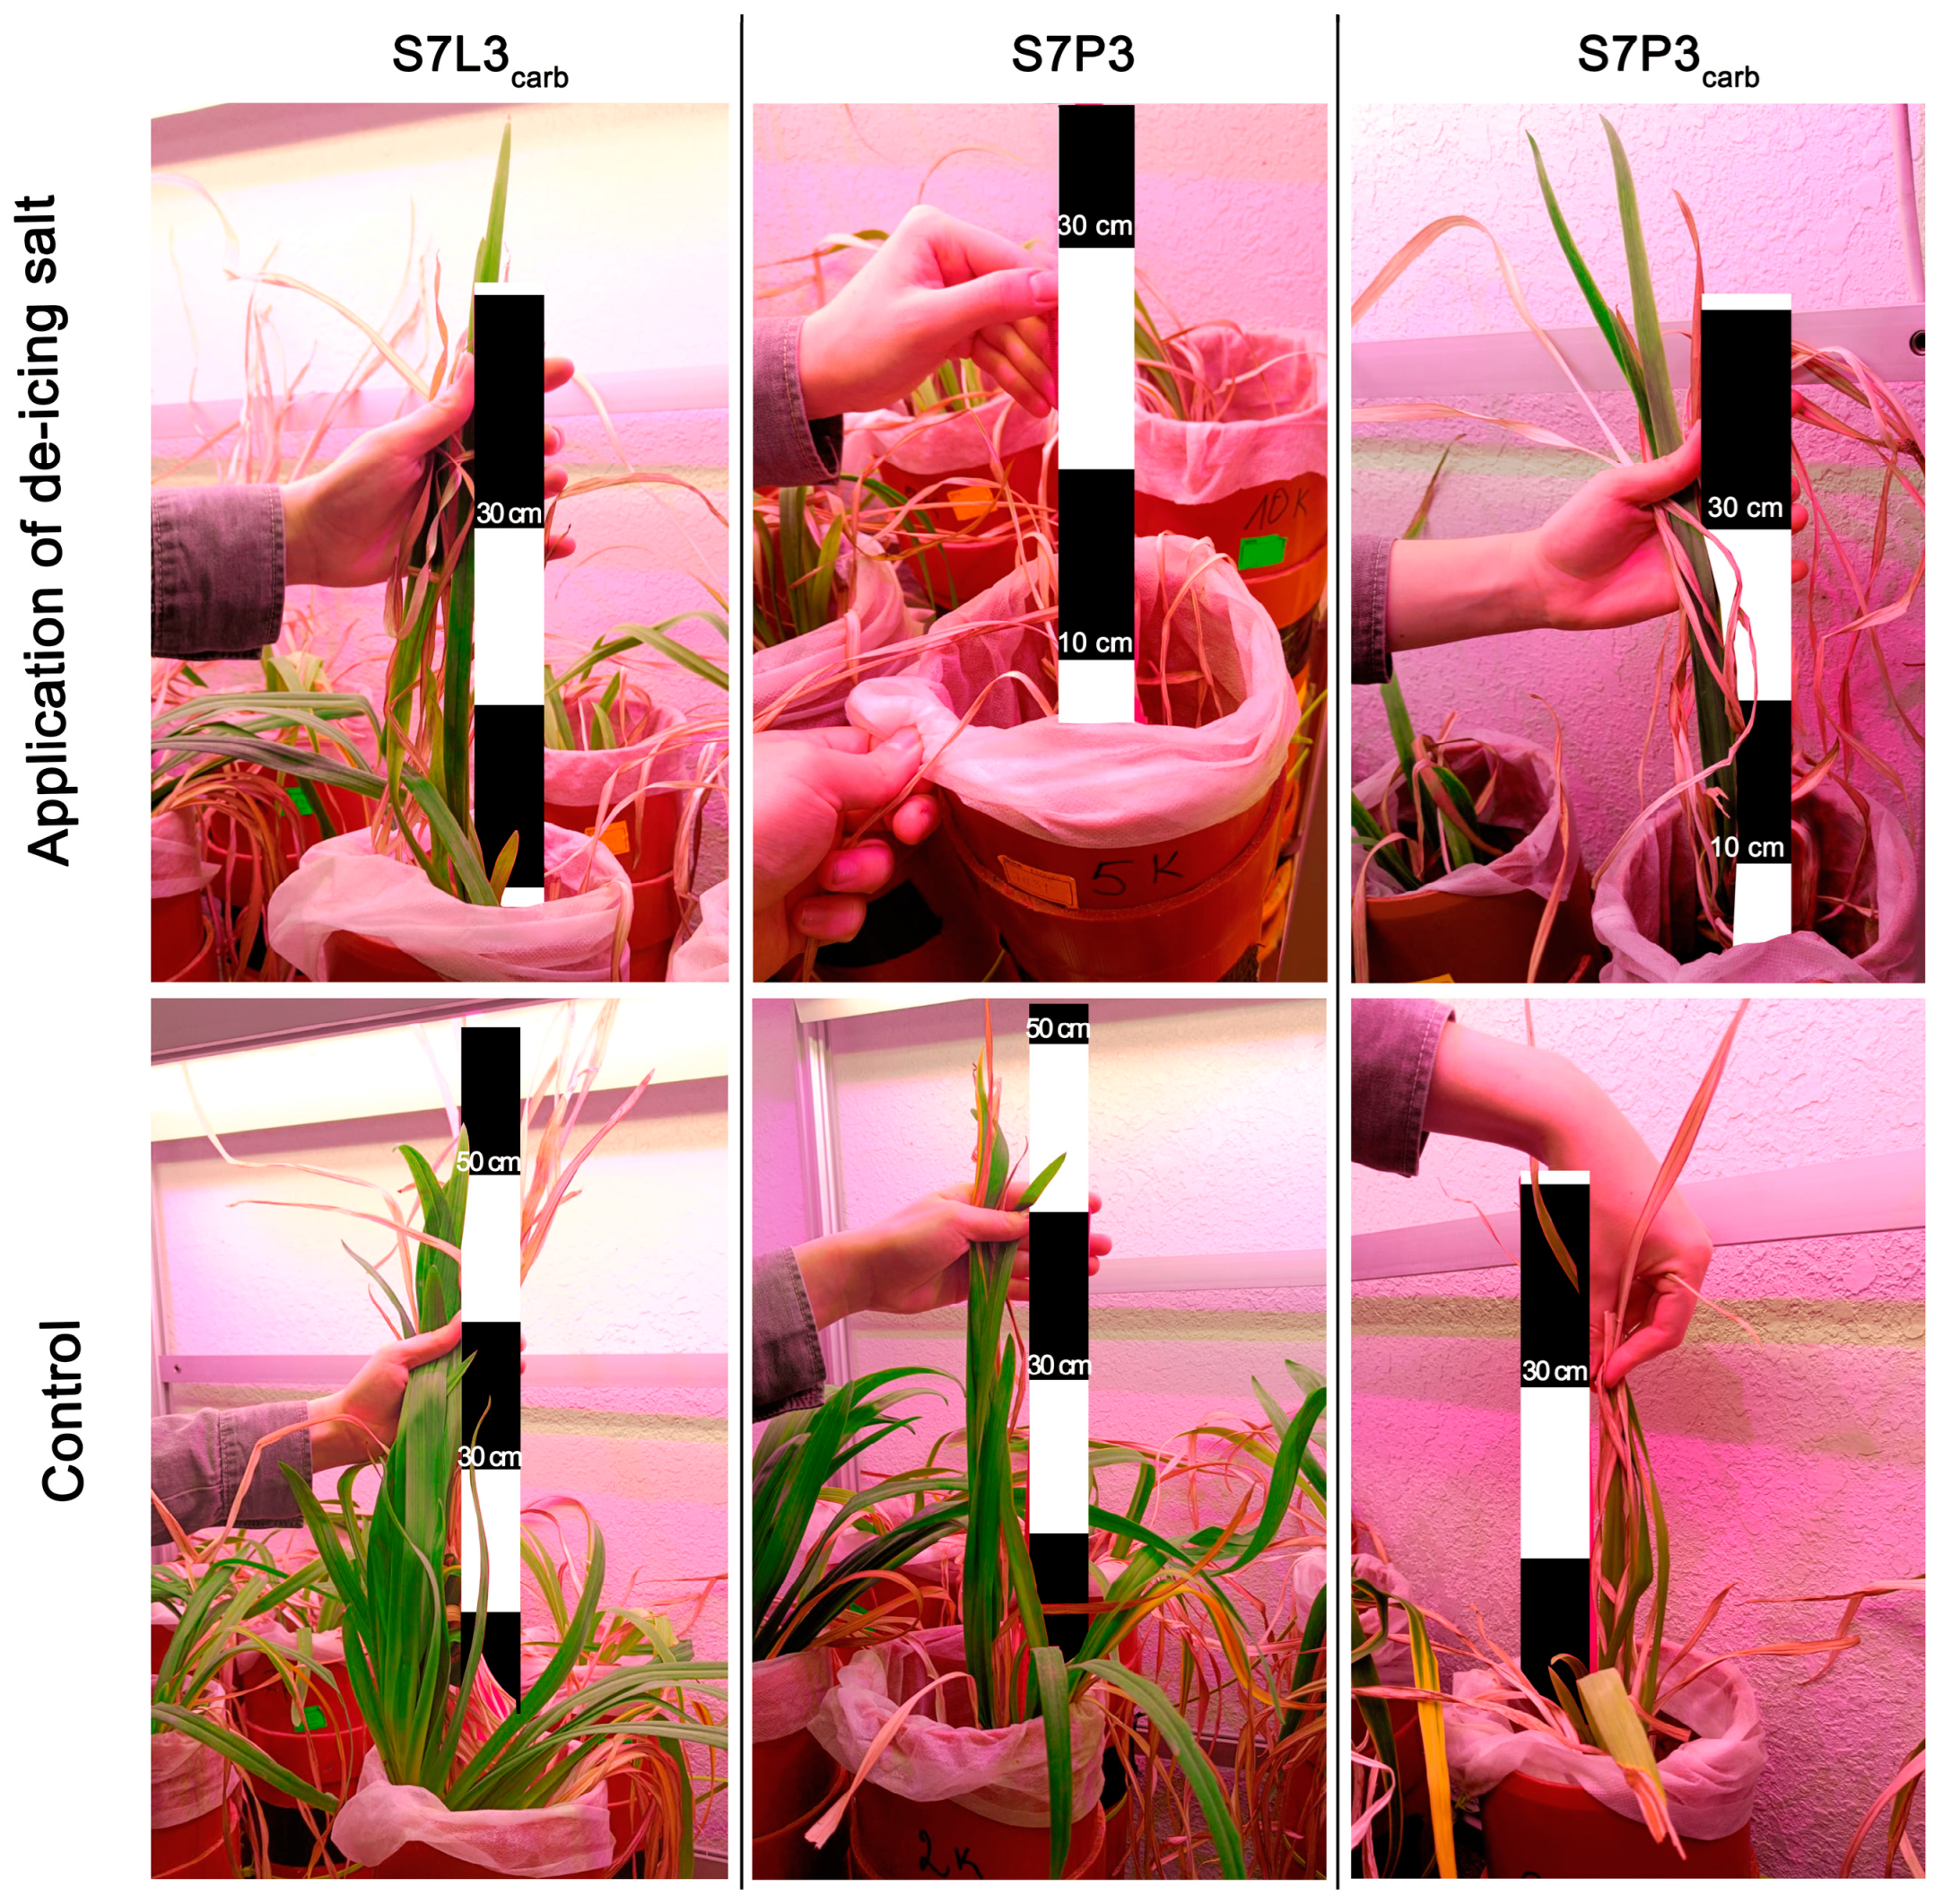

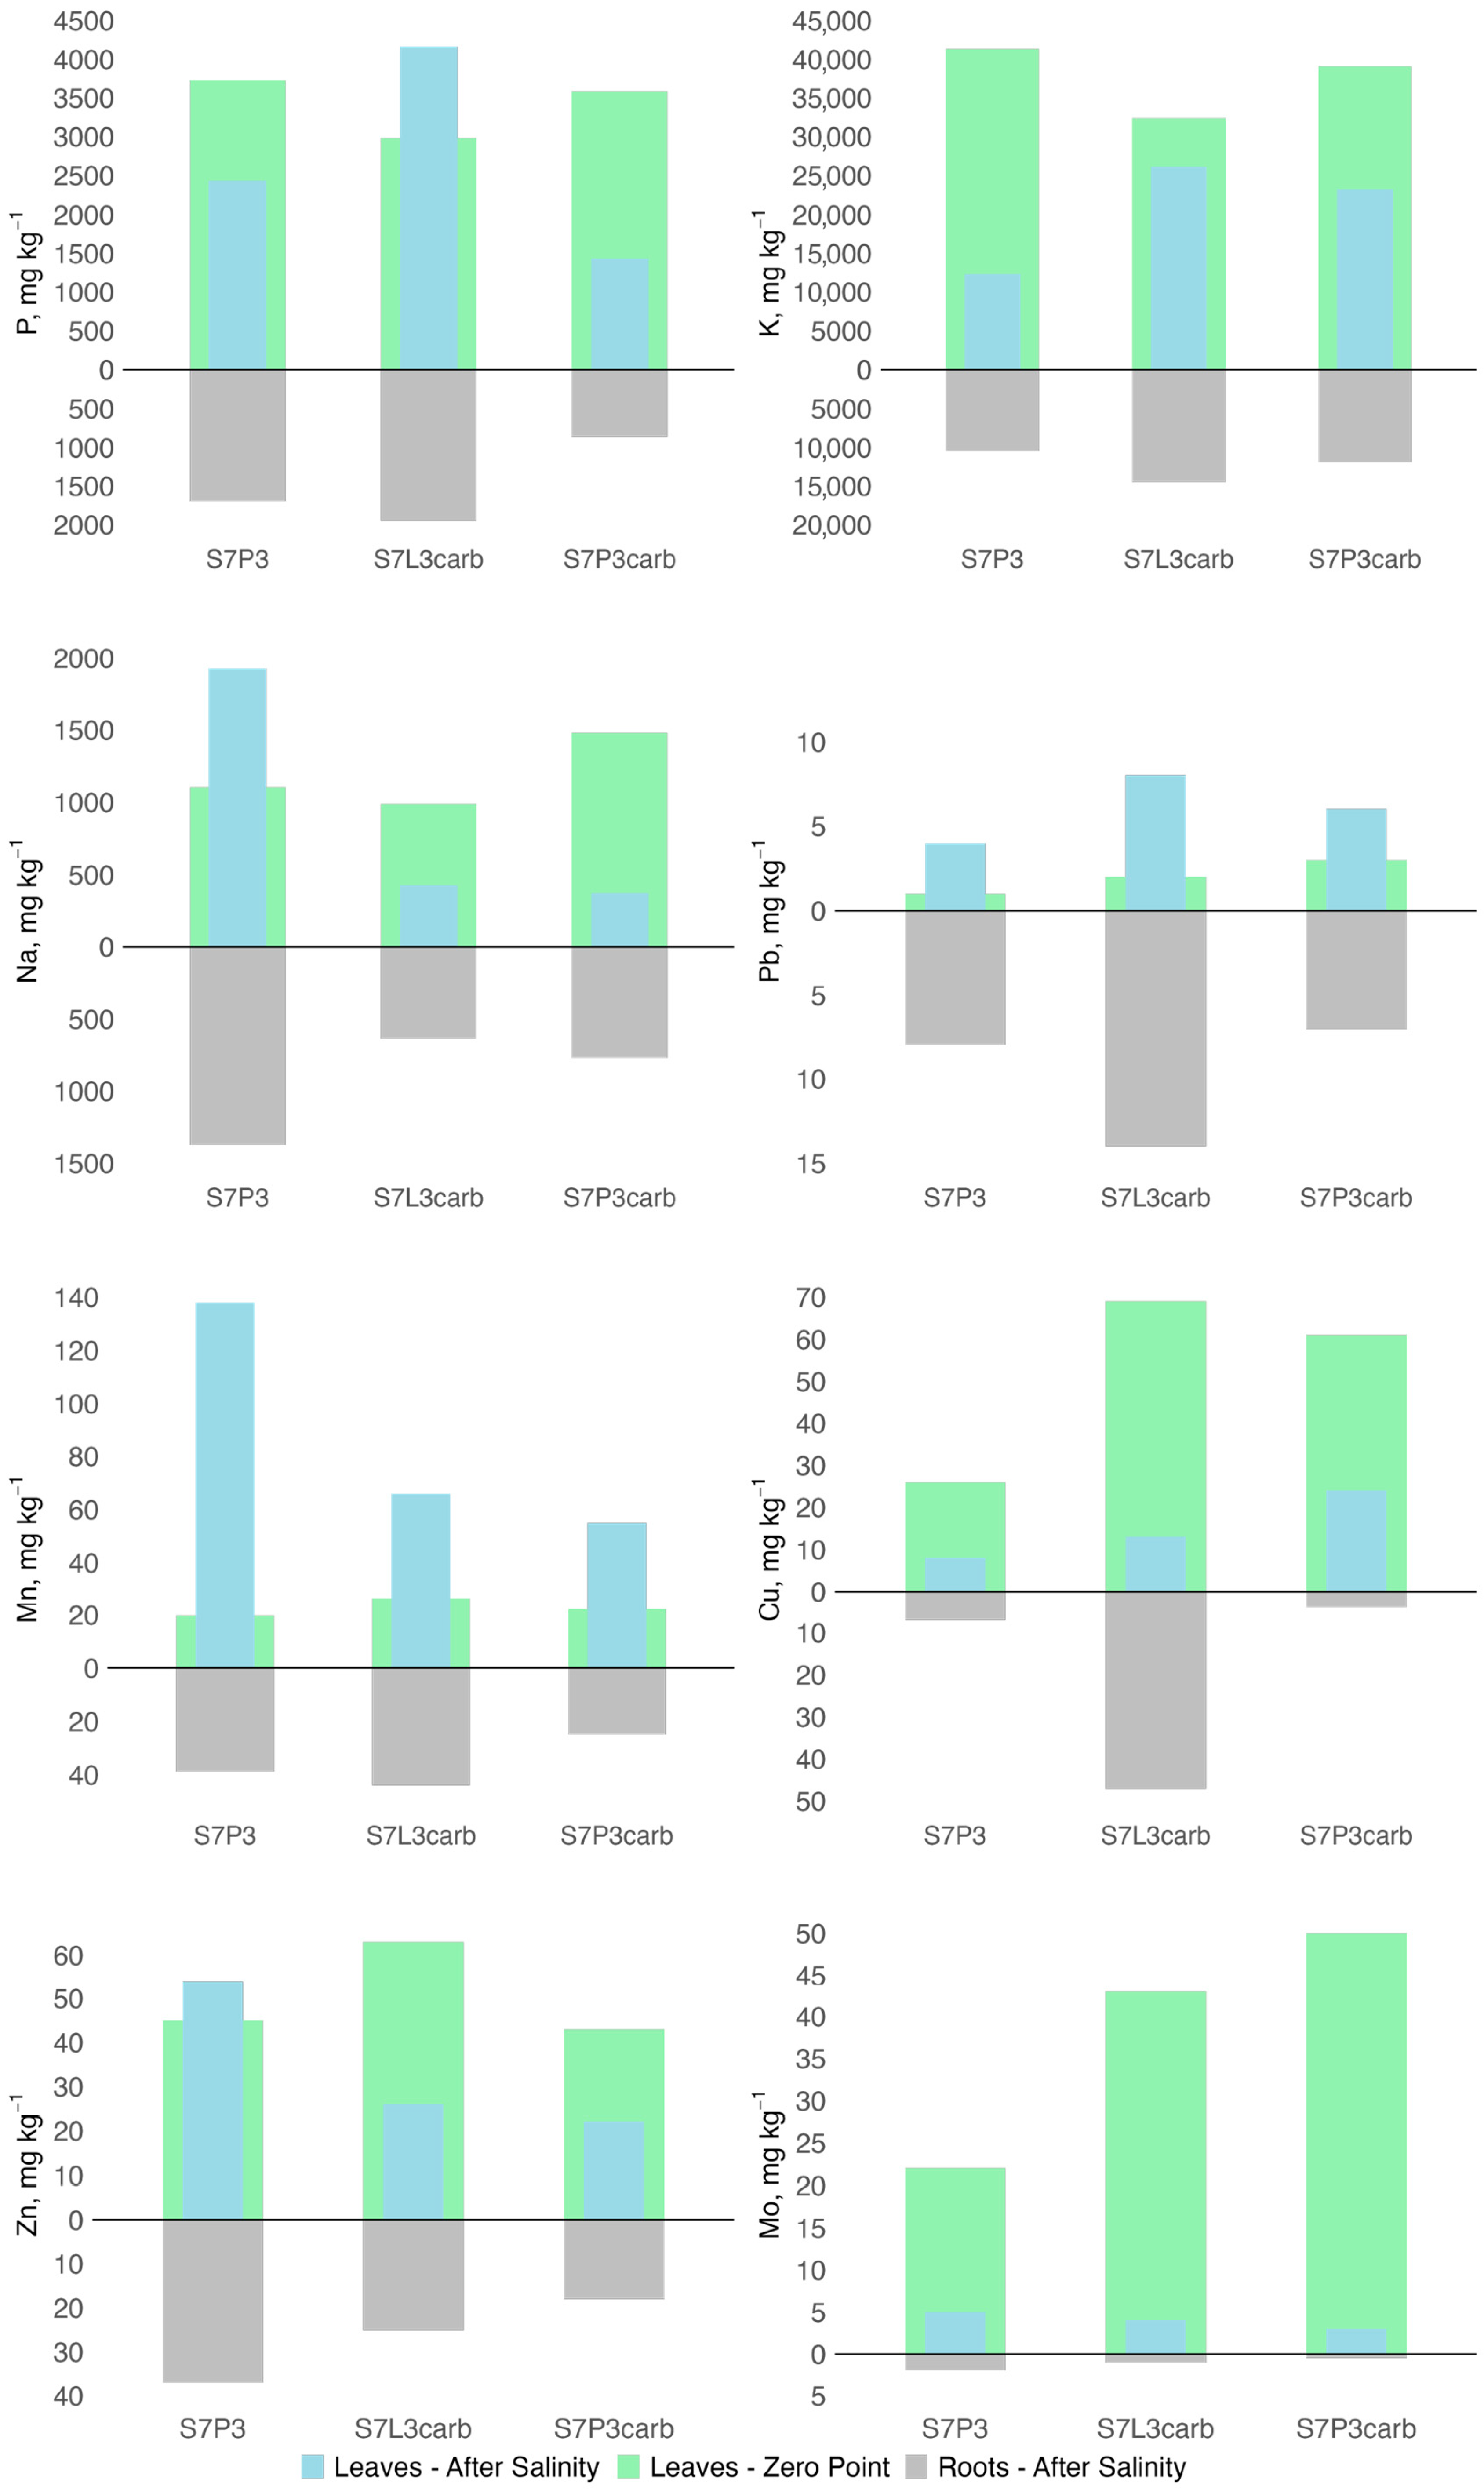
Disclaimer/Publisher’s Note: The statements, opinions and data contained in all publications are solely those of the individual author(s) and contributor(s) and not of MDPI and/or the editor(s). MDPI and/or the editor(s) disclaim responsibility for any injury to people or property resulting from any ideas, methods, instructions or products referred to in the content. |
© 2025 by the authors. Licensee MDPI, Basel, Switzerland. This article is an open access article distributed under the terms and conditions of the Creative Commons Attribution (CC BY) license (https://creativecommons.org/licenses/by/4.0/).