
Assessment of Bucharest Metro Expansion and Its Correlation with the Territorial System

Abstract
:1. Introduction
2. Literature Review
2.1. Topological Analyses
2.2. Functional Analyses
2.3. Analyses of Transportation and Land Use Interaction
3. Materials and Methods
3.1. Topological Analyses of Metro Networks
- Calculate the network connectivity indices at two distinct points in time to assess changes in connectivity.
- Determine the generalized nodal accessibility matrix and vector, which measure the overall accessibility of each node within the network.
- Calculate the Shimbel accessibility matrix and vector, providing the Shimbel nodal index to evaluate network efficiency and accessibility.
- Mij = 1, if Mij or Mji = 1;
- Mij = 0, if Mij or Mji = 0.
3.2. Functional Analyses of Metro Networks
- Identifying the number of metro poles within each analyzed area.
- Evaluating the accessibility characteristics of the 19 analyzed areas, including the number of metro lines and arcs present within each area.
- Measuring area accessibility by determining the number of metro poles that can be reached within a specified time interval.
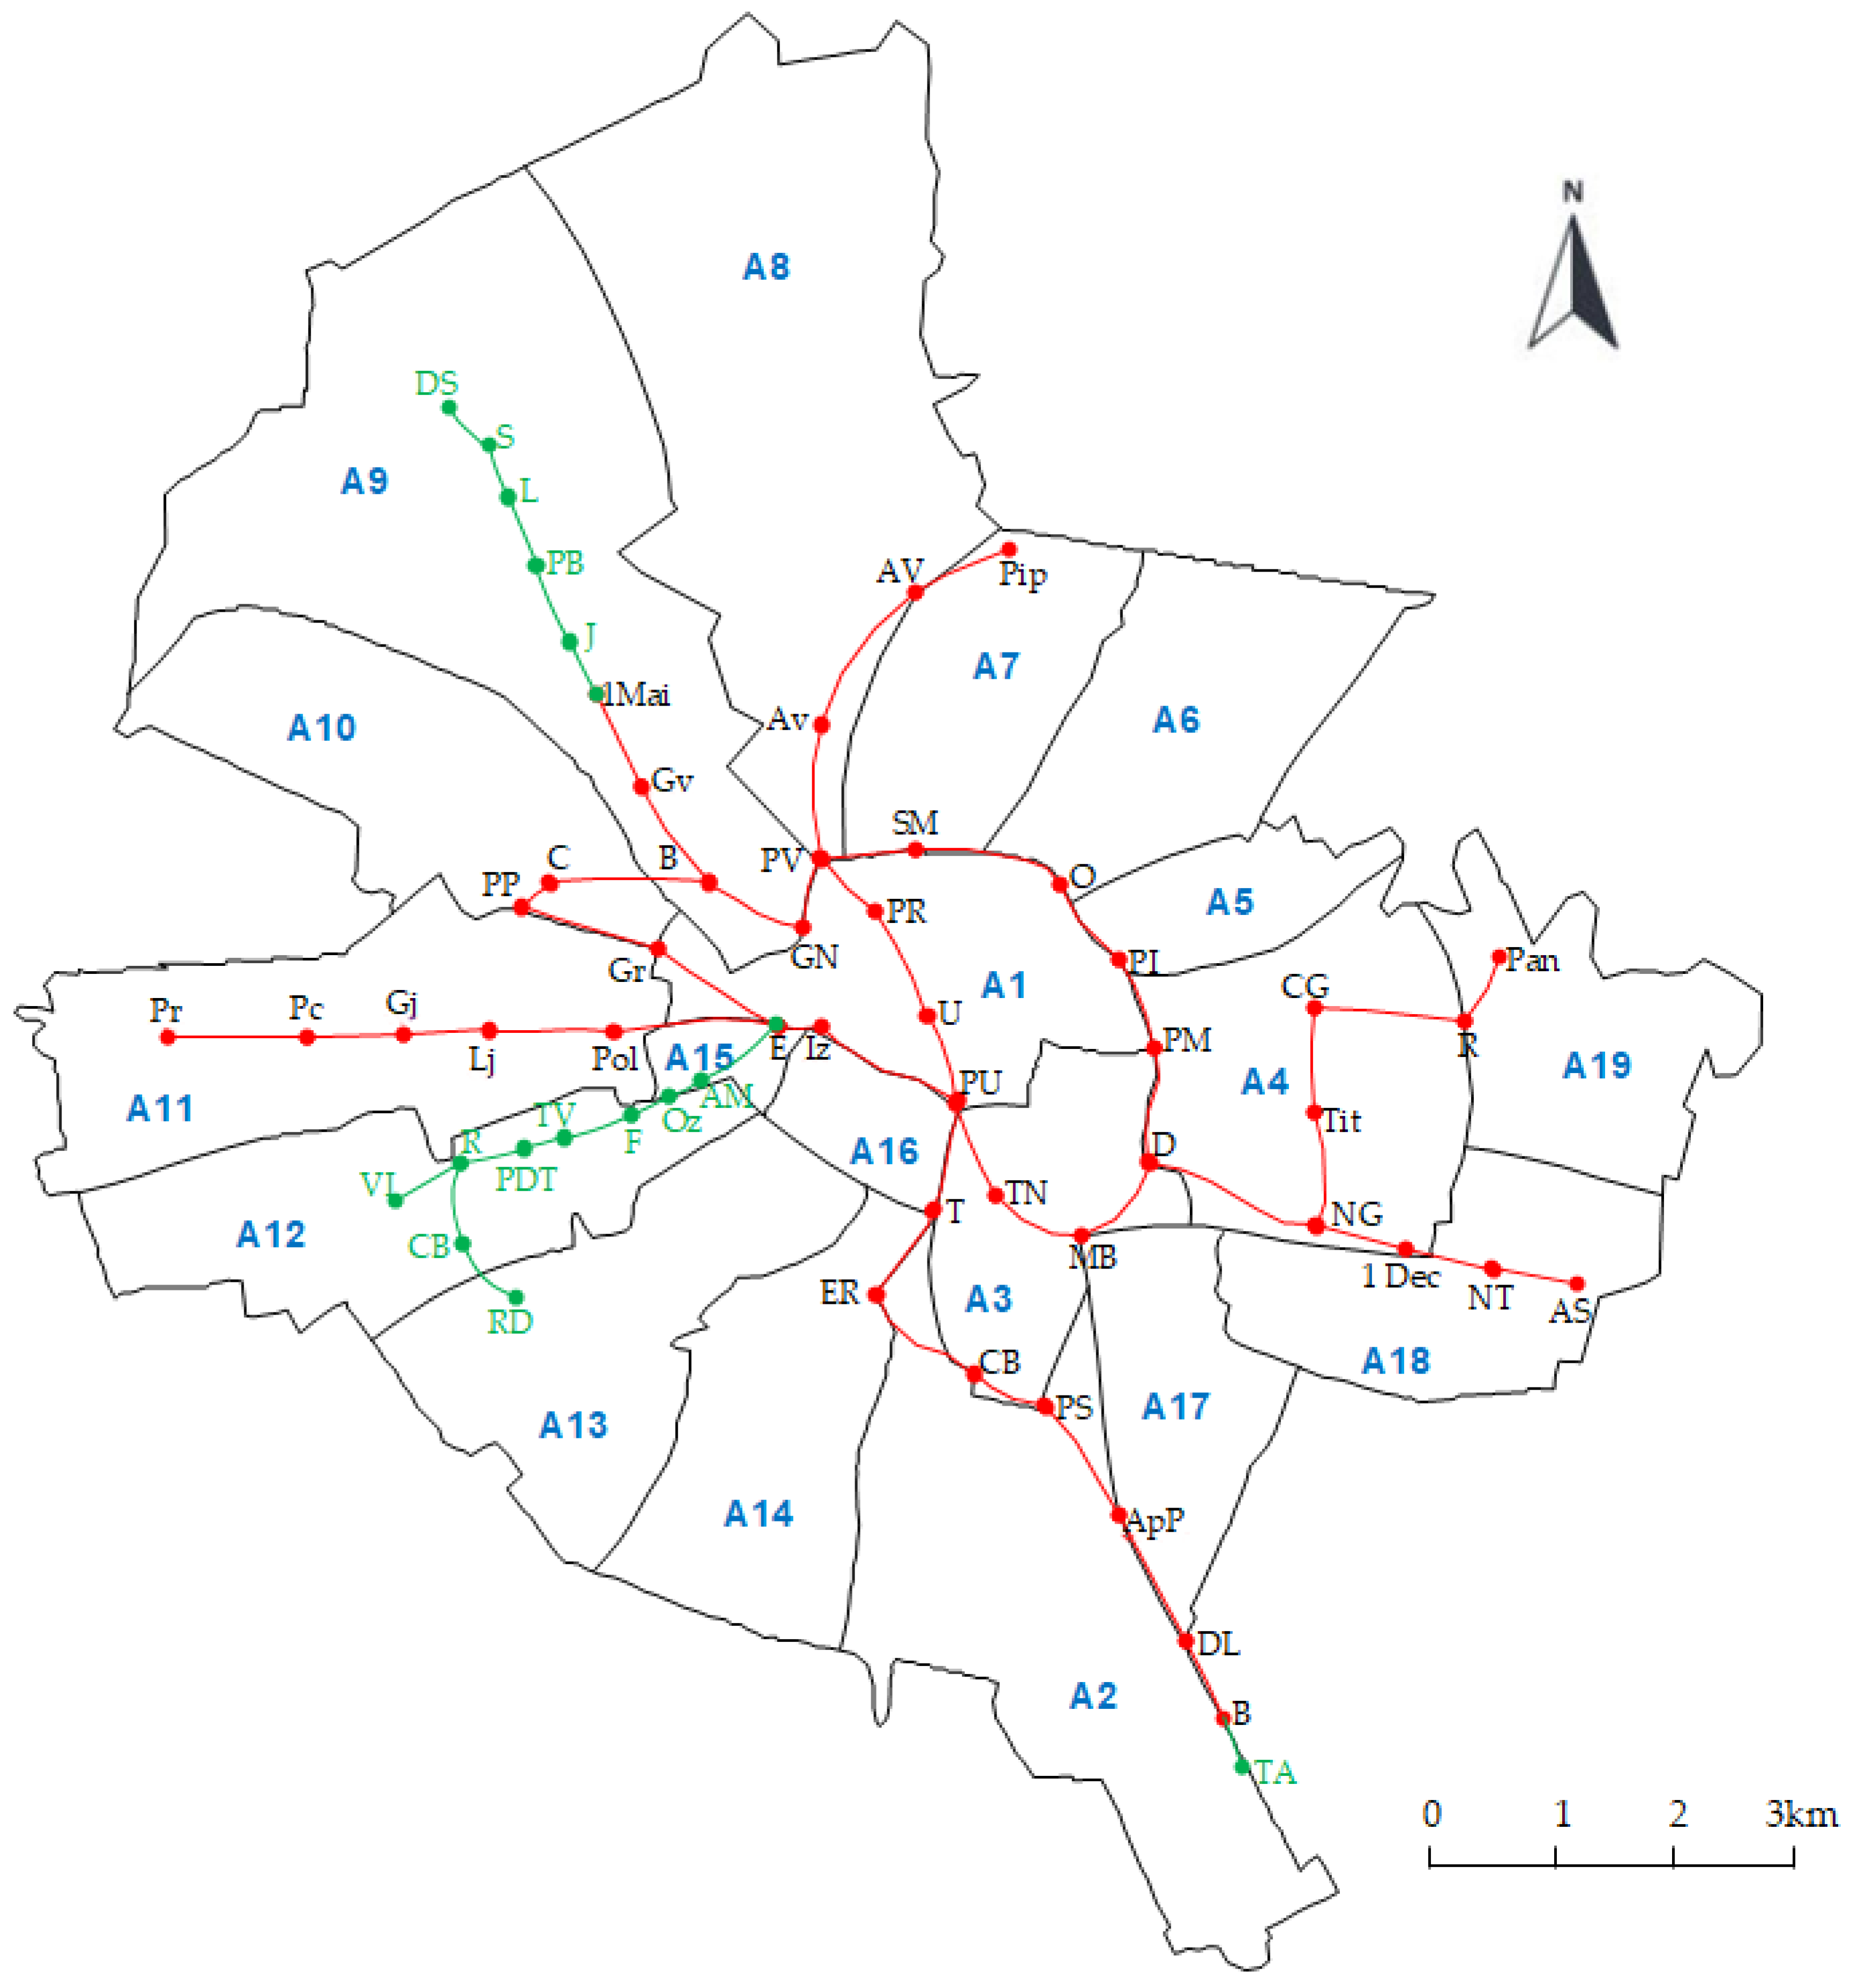
4. Case Study
4.1. The Topological Analysis of the Metro Network
4.2. The Accessibility Analysis Using the Metro Network
5. Discussion
5.1. On the Topological Analysis
5.2. On the Functional Analysis
6. Conclusions
Author Contributions
Funding
Data Availability Statement
Conflicts of Interest
References
- TomTom Trafic Index. Available online: https://www.tomtom.com/traffic-index/ranking/ (accessed on 31 January 2025).
- United Nations. 2018 Revision of World Urbanization Prospects; Department of Economic and Social Affaires: New York, NY, USA, 2018. [Google Scholar]
- Anjaneyulu, M.; Kubendiran, M. Short-Term Traffic Congestion Prediction Using Hybrid Deep Learning Technique. Sustainability 2023, 15, 74. [Google Scholar] [CrossRef]
- Zang, J.; Jiao, P.; Liu, S.; Zhang, X.; Song, G.; Yu, L. Identifying Traffic Congestion Patterns of Urban Road Network Based on Traffic Performance Index. Sustainability 2023, 15, 948. [Google Scholar] [CrossRef]
- Wang, Z.; Safdar, M.; Zhong, S.; Liu, J.; Xiao, F. Public Preferences of Shared Autonomous Vehicles in Developing Countries: A Cross-National Study of Pakistan and China. J. Adv. Transp. 2021, 2021, 5141798. [Google Scholar] [CrossRef]
- Safdar, M.; Jamal, A.; Al-Ahmadi, H.M.; Rahman, M.T.; Almoshaogeh, M. Analysis of the Influential Factors towards Adoption of Car-Sharing: A Case Study of a Megacity in a Developing Country. Sustainability 2022, 14, 2778. [Google Scholar] [CrossRef]
- Ali Aden, W.; Zheng, J.; Ullah, I.; Safdar, M. Public Preferences Towards Car Sharing Service: The Case of Djibouti. Front J. Environ. Sci. 2022, 10, 889453. [Google Scholar] [CrossRef]
- Dadashova, B.; Li, X.; Turner, S.; Koeneman, P. Multivariate time series analysis of traffic congestion measures in urban areas as they relate to socioeconomic indicators. Socioecon. Plann. Sci. 2021, 75, 100877. [Google Scholar] [CrossRef]
- Pan, T.; Lam, W.H.K.; Sumalee, A.; Zhong, R. Multiclass Multilane Model for Freeway Traffic Mixed with Connected Automated Vehicles and Regular Human-Piloted Vehicles. Transp. Sci. 2021, 17, 5–33. [Google Scholar] [CrossRef]
- Borjesson, M.; Hamilton, C.J.; Nasman, P.; Papaix, C. Factors driving public support for road congestion reduction policies: Congestion charging, free public transport and more roads in Stockholm, Helsinki and Lyon. Transp. Res. Part A Policy Pract. 2015, 78, 452–462. [Google Scholar] [CrossRef]
- Mussone, L.; Grant-Muller, S.; Laird, J. Sensitivity analysis of traffic congestion costs in a network under a charging policy. Case Stud. Transp. Policy 2015, 3, 44–54. [Google Scholar] [CrossRef]
- Tiwari, G.; Phillip, C. Development of public transport systems in small cities: A roadmap for achieving sustainable development goal indicator 11.2. IATSS Res. 2021, 45, 31–38. [Google Scholar] [CrossRef]
- Ren, Y.; Shen, L.; Wei, X.; Wang, J.; Cheng, G. A guiding index framework for examining urban carrying capacity. Ecol. Indic. 2021, 133, 108347. [Google Scholar] [CrossRef]
- Madireddy, M.; De Coensel, B.; Can, A.; Degraeuwe, B.; Beusen, B.; De Vlieger, I.; Botteldooren, D. Assessment of the Impact of Speed Limit Reduction and Traffic Signal Coordination on Vehicle Emissions Using an Integrated Approach. Transp. Res. D Transp. Environ. 2011, 16, 504–508. [Google Scholar] [CrossRef]
- Li, Y.; Xiong, W.; Wang, X. Does polycentric and compact development alleviate urban traffic congestion? A case study of 98 Chinese cities. Cities 2019, 88, 100–111. [Google Scholar] [CrossRef]
- Martens, K. Accessibility and Potential Mobility as a Guide for Policy Action. Transp. Res. Rec. 2015, 2499, 18–24. [Google Scholar] [CrossRef]
- Aston, L.; Currie, G.; Kamruzzaman, M.; Delbosc, A.; Teller, D. Study design impacts on built environment and transit use research. J. Transp. Geogr. 2020, 82, 102625. [Google Scholar] [CrossRef]
- Moeckel, R.; Garcia, C.L.; Chou, A.T.M.; Okrah, M.B. Trends in integrated land-use/transport modeling. J. Transp. Land Use 2018, 11, 463–476. [Google Scholar] [CrossRef]
- Raza, A.; Safdar, M.; Zhong, M.; Hunt, J.D. Analyzing Spatial Location Preference of Urban Activities with Mode-Dependent Accessibility Using Integrated Land Use–Transport Models. Land 2022, 11, 1139. [Google Scholar] [CrossRef]
- Raicu, Ş. Transport Systems; AGIR: Bucharest, Romania, 2007. [Google Scholar]
- Bhatnagar, R.V.; Ram, S. Formulating a Railway Station Accessibility (RsAI) Model for Station Hierarchy Classification. Urban Sci. 2023, 7, 48. [Google Scholar] [CrossRef]
- Zhang, L.; Zhu, M.; Yang, W.C.; Dong, D. Modeling and analysis of network topological characteristics of urban rail transit. Urban Mass Transit. 2015, 18, 28–31. [Google Scholar] [CrossRef]
- Yang, R.; Liu, Y.; Liu, Y.; Liu, H.; Gan, W. Comprehensive public transport service accessibility index—A new approach based on degree centrality and gravity model. Sustainability 2019, 11, 5634. [Google Scholar] [CrossRef]
- Yi, C.; Nam, J.; Kim, J.; Lee, J.-S. Comparison of the distributions of centrality indices: Using spatial big data to understand urban spatial structure. Cities 2024, 150, 105046. [Google Scholar] [CrossRef]
- Cai, J.; Li, R.; Liu, Z.; Liu, X.; Wu, H. Quantifying spatial interaction centrality in urban population mobility: A mobility featureand network topology-based locational measure. Sustain. Cities Soc. 2024, 114, 105769. [Google Scholar] [CrossRef]
- Herrera-Acevedo, D.D.; Sierra-Porta, D. Network structure and urban mobility sustainability: A topological analysis of cities from the urban mobility readiness index. Sustain. Cities Soc. 2025, 119, 106076. [Google Scholar] [CrossRef]
- Zhou, Y.; Yang, H.; Wang, Y.; Yan, X. Integrated line configuration and frequency determination with passenger path assignment in urban rail transit networks. Transp. Res. Part B Methodol. 2021, 145, 134–151. [Google Scholar] [CrossRef]
- Niu, F.; Wang, F. Economic Spatial Structure in China: Evidence from Railway Transport Network. Land 2022, 11, 61. [Google Scholar] [CrossRef]
- Kaza, N.; Nesse, K. Characterizing the Regional Structure in the United States: A County-based Analysisof Labor Market Centrality. Internation. Reg. Sci. Rev. 2021, 44, 560–581. [Google Scholar] [CrossRef]
- Taylor, M.A.P. Vulnerability Analysis for Transportation Networks; Elsevier: Amsterdam, The Netherlands, 2017. [Google Scholar]
- Zhu, W.; Liu, K.; Wang, M.; Yan, X. Enhancing the robustness of metro networks using strategic defense. Phys. A Stat. Mech. Appl. 2018, 503, 1081–1091. [Google Scholar] [CrossRef]
- Raicu, S.; Costescu, D. Mobility. Traffic Infrastructure; AGIR: Bucharest, Romania, 2020. [Google Scholar]
- Ebrahimi Golshanabadi, R.; Popa, M. Robustness Assessment of the Metro System: A Case Study of Bucharest, Romania. Systems 2024, 12, 237. [Google Scholar] [CrossRef]
- Hu, J.; Yang, M.; Zhen, Y.; Fu, W. Node Importance Evaluationof Urban Rail Transit Based on Signaling System Failure: A Case Study of the Nanjing Metro. Appl. Sci. 2024, 14, 9600. [Google Scholar] [CrossRef]
- Serdar, M.Z.; Koc, M.; Al-Ghamdi, S.G. Urban transportation networks resilience: Indicators, disturbances, and assessment methods. Sustain. Cities Soc. 2022, 76, 103452. [Google Scholar] [CrossRef]
- Mazzulla, G.; Pirrone, C.G. Accessibility Measures: From a Literature Review to a Classification Framework. ISPRS Int. J. Geo-Inf. 2024, 13, 450. [Google Scholar] [CrossRef]
- Zhu, H.; Li, J.; Yuan, Z.; Li, J. Bibliometric Analysis of Spatial Accessibility from 1999–2022. Sustainability 2023, 15, 13399. [Google Scholar] [CrossRef]
- Bosch-Checa, C.; Lorenzo-Sáez, E.; Haza, M.J.P.d.l.; Lerma-Arce, V.; Coll-Aliaga, E. Evaluation of the Accessibility to Urban Mobility Services with High Spatial Resolution—Case Study: Valencia (Spain). Appl. Sci. 2025, 15, 1382. [Google Scholar] [CrossRef]
- Kuhnel, F.; Schrombges, M.; Braun, N.; Kuhnimhof, T. Public Transport Accessibility and Its Effecton Mode Choice. Urban Sci. 2025, 9, 49. [Google Scholar] [CrossRef]
- Bhellar, M.G.; Talpur, M.A.H.; Khahro, S.H.; Ali, T.H.; Javed, Y. Visualizing Travel Accessibility in a Congested City Center:A GIS-Based Isochrone Model and Trip Rate Analysis Considering Sustainable Transportation Solutions. Sustainability 2023, 15, 16499. [Google Scholar] [CrossRef]
- Dragu, V.; Ruscă, A.; Roşca, M.A. The Spatial Accessibility of High-Capacity Public Transport Networks—The Premise ofSustainable Development. Sustainability 2025, 17, 343. [Google Scholar] [CrossRef]
- Lindner, A.; Kuhnel, F.; Schrombges, M.; Kuhnimhof, T. When to Measure Accessibility? Temporal Segmentation and Aggregation in Location-Based Public Transit Accessibility. Urban Sci. 2024, 8, 165. [Google Scholar] [CrossRef]
- Zini, A.; Roberto, R.; Corrias, P.; Felici, B.; Noussan, M. Accessibility Measures to Evaluate Public Transport Competitiveness: The Case of Rome and Turin. Smart Cities 2024, 7, 3334–3354. [Google Scholar] [CrossRef]
- Guo, S.; Pei, T.; Wang, X.; Song, C.; Chen, X.; Chen, J.; Shu, H.; Liu, Y.; Wu, M. Equity of subway accessibility: A perspective from work commute trips. Transp. Res. Part D Transp. Environ. 2022, 113, 103515. [Google Scholar] [CrossRef]
- Cheng, J.; Hu, L.; Lei, D.; Bi, H. How Bike-Sharing Affects theAccessibility Equity of Public Transit Systems—Evidence from Nanjing. Land 2024, 13, 2200. [Google Scholar] [CrossRef]
- Zhan, Z.; Guo, Y.; Noland, R.B.; He, S.Y.; Wang, Y. Analysis of links between dockless bikeshare and metro trips in Beijing. Transp. Res. Part A Policy Pract. 2023, 175, 103784. [Google Scholar] [CrossRef]
- Bothe, K.; Hansen, H.K.; Winther, L. Spatial restructuring and uneven intra-urban employment growth in metro and non-metro served areas in Copenhagen. J. Transp. Geogr. 2018, 70, 21–30. [Google Scholar] [CrossRef]
- Liu, J.M.; Hou, X.H.; Xia, C.Y.; Kang, X.; Zhou, Y.J. Examining the spatial coordination between metrorail accessibility and urban spatial form in the context of big data. Land 2021, 10, 580. [Google Scholar] [CrossRef]
- Lei, K.; Hou, Q.; Duan, Y.; Xi, Y.; Chen, S.; Miao, Y.; Tong, H.; Hu, Z. The Spatiotemporal Matching Relationship between Metro Networks and Urban Population froman Evolutionary Perspective: Passive Adaptation or Active Guidance? Land 2024, 13, 1200. [Google Scholar] [CrossRef]
- Chen, E.; Ye, Z.; Wang, C.; Zhang, W. Discovering the spatio-temporal impacts of built environment on metro ridership using smart card data. Cities 2019, 95, 102359. [Google Scholar] [CrossRef]
- Bi, H.; Gao, H.; Li, A.; Ye, Z. Using topic modeling to unravel the nuanced effects of built environment on bicycle-metro integrated usage. Transp. Res. Part A Policy Pract. 2024, 185, 104120. [Google Scholar] [CrossRef]
- Guo, Y.; He, S.Y. Perceived built environment and dockless bikeshare as a feeder mode of metro. Transp. Res. Part D Transp. Environ. 2021, 92, 102693. [Google Scholar] [CrossRef]
- Meng, L.; Ishida, T. Analysis of the relationship between Beijing rail transit and urban planning based on space syntax. Sustainability 2022, 14, 8744. [Google Scholar] [CrossRef]
- Zhang, Q.; Yan, J.; Sun, T.; Liu, J. Image-Building and Place Perception of the Subway Station’s Cultural Landscape: A Case Study in Xi’an, China. Land 2023, 12, 463. [Google Scholar] [CrossRef]
- Łukaszkiewicz, J.; Kowalski, P.; Nowak, R. The Potential of Tram Networks in the Revitalization of the Warsaw Landscape. Land 2021, 10, 375. [Google Scholar] [CrossRef]
- Zhao, M.; Tong, H.; Li, B.; Duan, Y.; Li, Y.; Wang, J.; Lei, K. Analysis of Land Use Optimization of Metro Station Areas Based on Two-Way Balanced Ridership in Xi’an. Land 2022, 11, 1124. [Google Scholar] [CrossRef]
- Berta, K.K.; Emagnu, Y.M. Modeling the Impact of Urban Land Use Characteristics on Road Network Accessibility in a Case Study of Addis Ababa City. J. Adv. Transp. 2024, 2024, 5602943. [Google Scholar] [CrossRef]
- Mackiewicz, A.; Ratajczak, W. Towards a new definition of topological accesibility. Transp. Res. Part B Methodol. 1996, 30, 47–79. [Google Scholar] [CrossRef]
- Stutz, E.J. Accesibility and the effect of scalar variation on the powered transportation connection matrix. Geogr. Anal. 1973, 5, 62–66. [Google Scholar] [CrossRef]
- Laporte, G.; Mesa, J.A.; Ortega, F.A.; Perea, F. Planning rapid transit networks. Socio-Econ. Plan. Sci. 2011, 45, 95–104. [Google Scholar] [CrossRef]
- Shen, Q. Spatial technologies, accessibility, and the social construction of urban space. Comput. Environ. Urban Syst. 1998, 22, 447–464. [Google Scholar] [CrossRef]
- Olsson, L.E.; Friman, M.; Lättman, K. Accessibility Barriers and Perceived Accessibility: Implications for Public Transport. Urban Sci. 2021, 5, 63. [Google Scholar] [CrossRef]
- Hansen, W.G. How Accessibility Shapes Land Use. J. Am. Inst. Plan. 1959, 25, 73–76. [Google Scholar] [CrossRef]
- Morris, J.M.; Dumble, P.L.; Wigan, M.R. Accessibility indicators for transport planning. Transp. Res. Part A Gen. 1979, 13, 91–109. [Google Scholar] [CrossRef]
- Stepniak, M.; Rosik, P. The role of transport and population components in change in accessibility: The influence of the distance decay parameter. Netw. Spat. Econ. 2018, 18, 291–312. [Google Scholar] [CrossRef]
- Cascetta, E.; Cartenì, A.; Montanino, M. A behavioral model of accessibility based on the number of available opportunities. J. Transp. Geogr. 2016, 51, 45–58. [Google Scholar] [CrossRef]
- Xiao, Z.; Mao, B.; Xu, Q.; Chen, Y.; Wei, R. Reliability of Accessibility: An Interpreted Approach to Understanding Time-Varying Transit Accessibility. J. Adv. Transp. 2022, 2022, 9380884. [Google Scholar] [CrossRef]
- Raicu, S.; Costescu, D. Contemporary mobility themes—interdisciplinary examinations. AGIR Bull. 2016, 2, 20–27. [Google Scholar]
- Li, M.; Guo, W.; Guo, R.; He, B.; Li, Z.; Li, X.; Liu, W.; Fan, Y. Urban Network Spatial Connection and Structure in China Based on Railway Passenger Flow Big Data. Land 2022, 11, 225. [Google Scholar] [CrossRef]
- Available online: https://doc.pmb.ro/servicii/transporturi_drumuri/docs/planul_de_mobilitate_durabila_2016-2030.pdf (accessed on 10 February 2025).
- Available online: https://www.metrorex.ro/storage/documents/1734954377raport-metrorex-2023-RO.pdf (accessed on 12 February 2025).
- Available online: https://bucuresti.insse.ro/populatia/ (accessed on 4 February 2025).
- Available online: https://www.stb.ro/statistici (accessed on 4 February 2025).
- Frutos Bernal, E.; del Rey, A.M. Study of the structural and robustness characteristics of Madrid metro network. Sustainability 2019, 11, 3486. [Google Scholar] [CrossRef]
- Meng, Y. Vulnerability, Comparisons of Various Complex Urban Metro Networks Under Multiple Failure Scenarios. Sustainability 2024, 16, 9603. [Google Scholar] [CrossRef]
- Wei Yu, W.; Chen, J.; Yan, X. Space-Time Evolution Analysis of the Nanjing Metro Network Based on a Complex Network. Sustainability 2019, 11, 523. [Google Scholar] [CrossRef]
- Li, L.; Ren, H.; Zhao, S.; Duan, Z.; Zhang, Y.; Zhang, A. Two dimensional accessibility analysis of metro stations in Xi’an, China. Transp. Res. Part A Policy Pract. 2017, 106, 414–426. [Google Scholar] [CrossRef]
- Harpalete, O.L. Methods to estimate urban accesibility in a medium size city. Case study: Iaşi, Romania. U.P.B. Sci. Bull. 2023, 85. Available online: https://www.scientificbulletin.upb.ro/rev_docs_arhiva/full1ba_354364.pdf (accessed on 4 February 2025).


| M1 | M2 | M3 | M4 | M5 | M6 | M7 | M8 | M9 | M10 | M11 | M12 | M13 | M14 | M15 | ||||||
|---|---|---|---|---|---|---|---|---|---|---|---|---|---|---|---|---|---|---|---|---|
| M1 | 0 | 0 | 0 | 0 | 0 | 0 | 0 | 0 | 1 | 0 | 0 | 0 | 0 | 0 | 0 | M1 | 1 | |||
| M2 | 0 | 0 | 0 | 0 | 0 | 0 | 0 | 0 | 0 | 1 | 0 | 0 | 0 | 0 | 0 | M2 | 1 | |||
| M3 | 0 | 0 | 0 | 0 | 0 | 0 | 0 | 0 | 0 | 0 | 0 | 1 | 0 | 0 | 0 | M3 | 1 | |||
| M4 | 0 | 0 | 0 | 0 | 0 | 0 | 0 | 0 | 0 | 0 | 0 | 1 | 0 | 0 | 0 | M4 | 1 | |||
| M5 | 0 | 0 | 0 | 0 | 0 | 0 | 0 | 0 | 0 | 0 | 0 | 0 | 1 | 0 | 0 | M5 | 1 | |||
| M6 | 0 | 0 | 0 | 0 | 0 | 0 | 0 | 0 | 0 | 0 | 0 | 0 | 0 | 0 | 1 | M6 | 1 | |||
| M = | M7 | 0 | 0 | 0 | 0 | 0 | 0 | 0 | 0 | 0 | 0 | 0 | 0 | 0 | 0 | 1 | ; | N1 = | M7 | 1 |
| M8 | 0 | 0 | 0 | 0 | 0 | 0 | 0 | 0 | 0 | 0 | 0 | 0 | 0 | 1 | 0 | M8 | 1 | |||
| M9 | 1 | 0 | 0 | 0 | 0 | 0 | 0 | 0 | 0 | 1 | 0 | 0 | 0 | 1 | 0 | M9 | 3 | |||
| M10 | 0 | 1 | 0 | 0 | 0 | 0 | 0 | 0 | 1 | 0 | 1 | 0 | 1 | 0 | 0 | M10 | 4 | |||
| M11 | 0 | 0 | 0 | 0 | 0 | 0 | 0 | 0 | 0 | 1 | 0 | 1 | 1 | 0 | 0 | M11 | 3 | |||
| M12 | 0 | 0 | 1 | 1 | 0 | 0 | 0 | 0 | 0 | 0 | 1 | 0 | 0 | 0 | 0 | M12 | 3 | |||
| M13 | 0 | 0 | 0 | 0 | 1 | 0 | 0 | 0 | 0 | 1 | 1 | 0 | 0 | 1 | 0 | M13 | 4 | |||
| M14 | 0 | 0 | 0 | 0 | 0 | 0 | 0 | 1 | 1 | 0 | 0 | 0 | 1 | 0 | 1 | M14 | 4 | |||
| M15 | 0 | 0 | 0 | 0 | 0 | 1 | 1 | 0 | 0 | 0 | 0 | 0 | 0 | 1 | 0 | M15 | 3 |
| Topological Characterization of the Network | Year | Dif. | ||
|---|---|---|---|---|
| 2009 | 2024 | |||
| Nodes No. | 12 | 15 | +3 | |
| Links No. | 13 | 16 | +3 | |
| 26 | 32 | +6 | ||
| Connectivity indices | αp | 0.1052 | 0.0800 | −0.0252 |
| γp | 0.4334 | 0.4103 | −0.0231 | |
| βp | 1.0834 | 1.0667 | −0.0167 | |
| Line | Station Name | Area | Line | Station Name | Area | ||
|---|---|---|---|---|---|---|---|
| Integral | Short | Integral | Short | ||||
| L1 | Pantelimon | Pan | A19 | L2 | Pţa. Sudului | PS | A2, A3 |
| L1 | Republica | R | A4, A19 | L2 | Ap. Patriei | ApP | A2, A17 |
| L1 | C. Georgian | CG | A4 | L2 | D. Leonida | DL | A2, A17 |
| L1 | Titan | Tit | A4 | L2 | Berceni | B | A2 |
| L1 | N. Grigorescu | NG | A4 | L2 | T. Arghezi | TA | A2 |
| L1 | Dristor | D | A3, A4 | L3 | Preciziei | Pr | A11 |
| L1 | M. Bravu | MB | A3, A17 | L3 | Păcii | Pc | A11 |
| L1 | Timpuri Noi | TN | A3 | L3 | Gorjului | Gj | A11 |
| L1 | Pţa. Unirii | PU | A1, A16 | L3 | Lujerului | Lj | A11 |
| L1 | Izvor | Iz | A1, A16 | L3 | Politehnica | Pol | A11 |
| L1 | Eroilor | E | A1, A15 | L3 | 1 Decembrie 1918 | 1 Dec | A4 |
| L1 | Grozăveşti | Gr | A1, A10 | L3 | Nicolae Teclu | NT | A18 |
| L1 | P. Poenaru | PP | A10 | L3 | Anghel Saligny | AS | A18 |
| L1 | Crângaşi | C | A10 | L4 | Dep. Străuleşti | DS | A9 |
| L1 | Basarab | B | A9 | L4 | Străuleşti | S | A9 |
| L1 | Gara de Nord | GN | A1, A9 | L4 | Laminorului | L | A9 |
| L1 | Pţa. Victoriei | PV | A1, A8, A9 | L4 | Parc Bazilescu | PB | A9 |
| L1 | Şt. cel Mare | SM | A1, A7 | L4 | Jiului | J | A9 |
| L1 | Obor | O | A1, A6 | L4 | 1 Mai | 1 Mai | A9 |
| L1 | Pţa. Iancului | PI | A1, A5 | L4 | Griviţa | G | A9 |
| L1 | Pţa. Muncii | PM | A1, A3, A4 | L5 | Valea Ialomiţei | VI | A12 |
| L2 | Pipera | Pip | A7 | L5 | Râul Doamnei | RD | A13 |
| L2 | Aurel Vlaicu | AV | A8 | L5 | C. Brâncuşi | CB | A12 |
| L2 | Aviatorilor | Av | A8 | L5 | Romancierilor | R | A12 |
| L2 | Pţa. Romană | PR | A1 | L5 | Parc Dr. Taberei | PDT | A12 |
| L2 | Universitate | U | A1 | L5 | T. Vladimirescu | TV | A12 |
| L2 | Tineretului | T | A3, A14, A16 | L5 | Favorit | F | A12 |
| L2 | Eroii Revoluţiei | ER | A14 | L5 | Orizont | Oz | A12, A15 |
| L2 | C. Brâncoveanu | CB | A3 | L5 | Acad. Militară | AM | A15 |
| Node Vector | M1 | M2 | M3 | M4 | M5 | M6 | M7 | M8 | M9 | M10 | M11 | M12 | M13 | M14 | M15 |
|---|---|---|---|---|---|---|---|---|---|---|---|---|---|---|---|
| N1 | 1 | 1 | 1 | 1 | 1 | 1 | 1 | 1 | 3 | 4 | 3 | 3 | 4 | 4 | 3 |
| N2 | 3 | 4 | 3 | 3 | 4 | 3 | 3 | 4 | 9 | 11 | 11 | 5 | 12 | 11 | 6 |
| N3 | 9 | 11 | 5 | 5 | 12 | 6 | 6 | 11 | 25 | 36 | 28 | 17 | 37 | 31 | 17 |
| N4 | 25 | 36 | 17 | 17 | 37 | 17 | 17 | 31 | 76 | 101 | 90 | 38 | 107 | 90 | 43 |
| N5 | 76 | 101 | 38 | 38 | 107 | 43 | 43 | 90 | 216 | 309 | 246 | 124 | 318 | 257 | 124 |
| N6 | 216 | 309 | 124 | 124 | 318 | 124 | 124 | 257 | 642 | 881 | 751 | 322 | 919 | 748 | 343 |
| Ng | 330 | 462 | 188 | 188 | 479 | 194 | 194 | 394 | 971 | 1342 | 1129 | 509 | 1397 | 1141 | 536 |
| M1 | M2 | M3 | M4 | M5 | M6 | M7 | M8 | M9 | M10 | M11 | M12 | M13 | M14 | M15 | N | |||
|---|---|---|---|---|---|---|---|---|---|---|---|---|---|---|---|---|---|---|
| M1 | 0 | 3 | 5 | 5 | 4 | 4 | 4 | 3 | 1 | 2 | 3 | 5 | 3 | 2 | 3 | 47 | ||
| M2 | 3 | 0 | 4 | 4 | 3 | 5 | 5 | 4 | 2 | 1 | 2 | 3 | 2 | 3 | 4 | 45 | ||
| M3 | 5 | 2 | 0 | 4 | 4 | 6 | 6 | 5 | 4 | 3 | 2 | 1 | 3 | 4 | 5 | 54 | ||
| M4 | 5 | 4 | 2 | 0 | 4 | 6 | 6 | 5 | 4 | 3 | 2 | 1 | 3 | 4 | 5 | 54 | ||
| M5 | 4 | 3 | 4 | 4 | 0 | 4 | 4 | 3 | 3 | 2 | 2 | 3 | 1 | 2 | 3 | 42 | ||
| M6 | 4 | 5 | 6 | 6 | 4 | 0 | 2 | 3 | 3 | 4 | 4 | 5 | 3 | 2 | 1 | 52 | ||
| M7 | 4 | 5 | 6 | 6 | 4 | 2 | 0 | 3 | 3 | 4 | 4 | 5 | 3 | 2 | 1 | 52 | ||
| M8 | 3 | 4 | 4 | 4 | 3 | 3 | 3 | 0 | 2 | 3 | 3 | 4 | 2 | 1 | 2 | 41 | ||
| M9 | 1 | 2 | 5 | 5 | 3 | 3 | 3 | 2 | 0 | 1 | 2 | 3 | 2 | 1 | 2 | 35 | ||
| M10 | 2 | 1 | 3 | 3 | 2 | 4 | 4 | 3 | 1 | 0 | 1 | 2 | 1 | 2 | 3 | 32 | ||
| M11 | 3 | 2 | 2 | 2 | 2 | 4 | 4 | 3 | 2 | 1 | 0 | 1 | 1 | 2 | 3 | 32 | ||
| M12 | 4 | 3 | 1 | 1 | 3 | 5 | 5 | 4 | 3 | 2 | 1 | 0 | 2 | 3 | 4 | 41 | ||
| M13 | 3 | 2 | 3 | 3 | 1 | 3 | 3 | 2 | 2 | 1 | 1 | 2 | 0 | 1 | 2 | 29 | ||
| M14 | 2 | 3 | 4 | 4 | 2 | 2 | 2 | 1 | 1 | 2 | 2 | 3 | 1 | 0 | 1 | 30 | ||
| M15 | 3 | 4 | 5 | 5 | 3 | 1 | 1 | 2 | 2 | 3 | 3 | 4 | 2 | 1 | 0 | 39 |
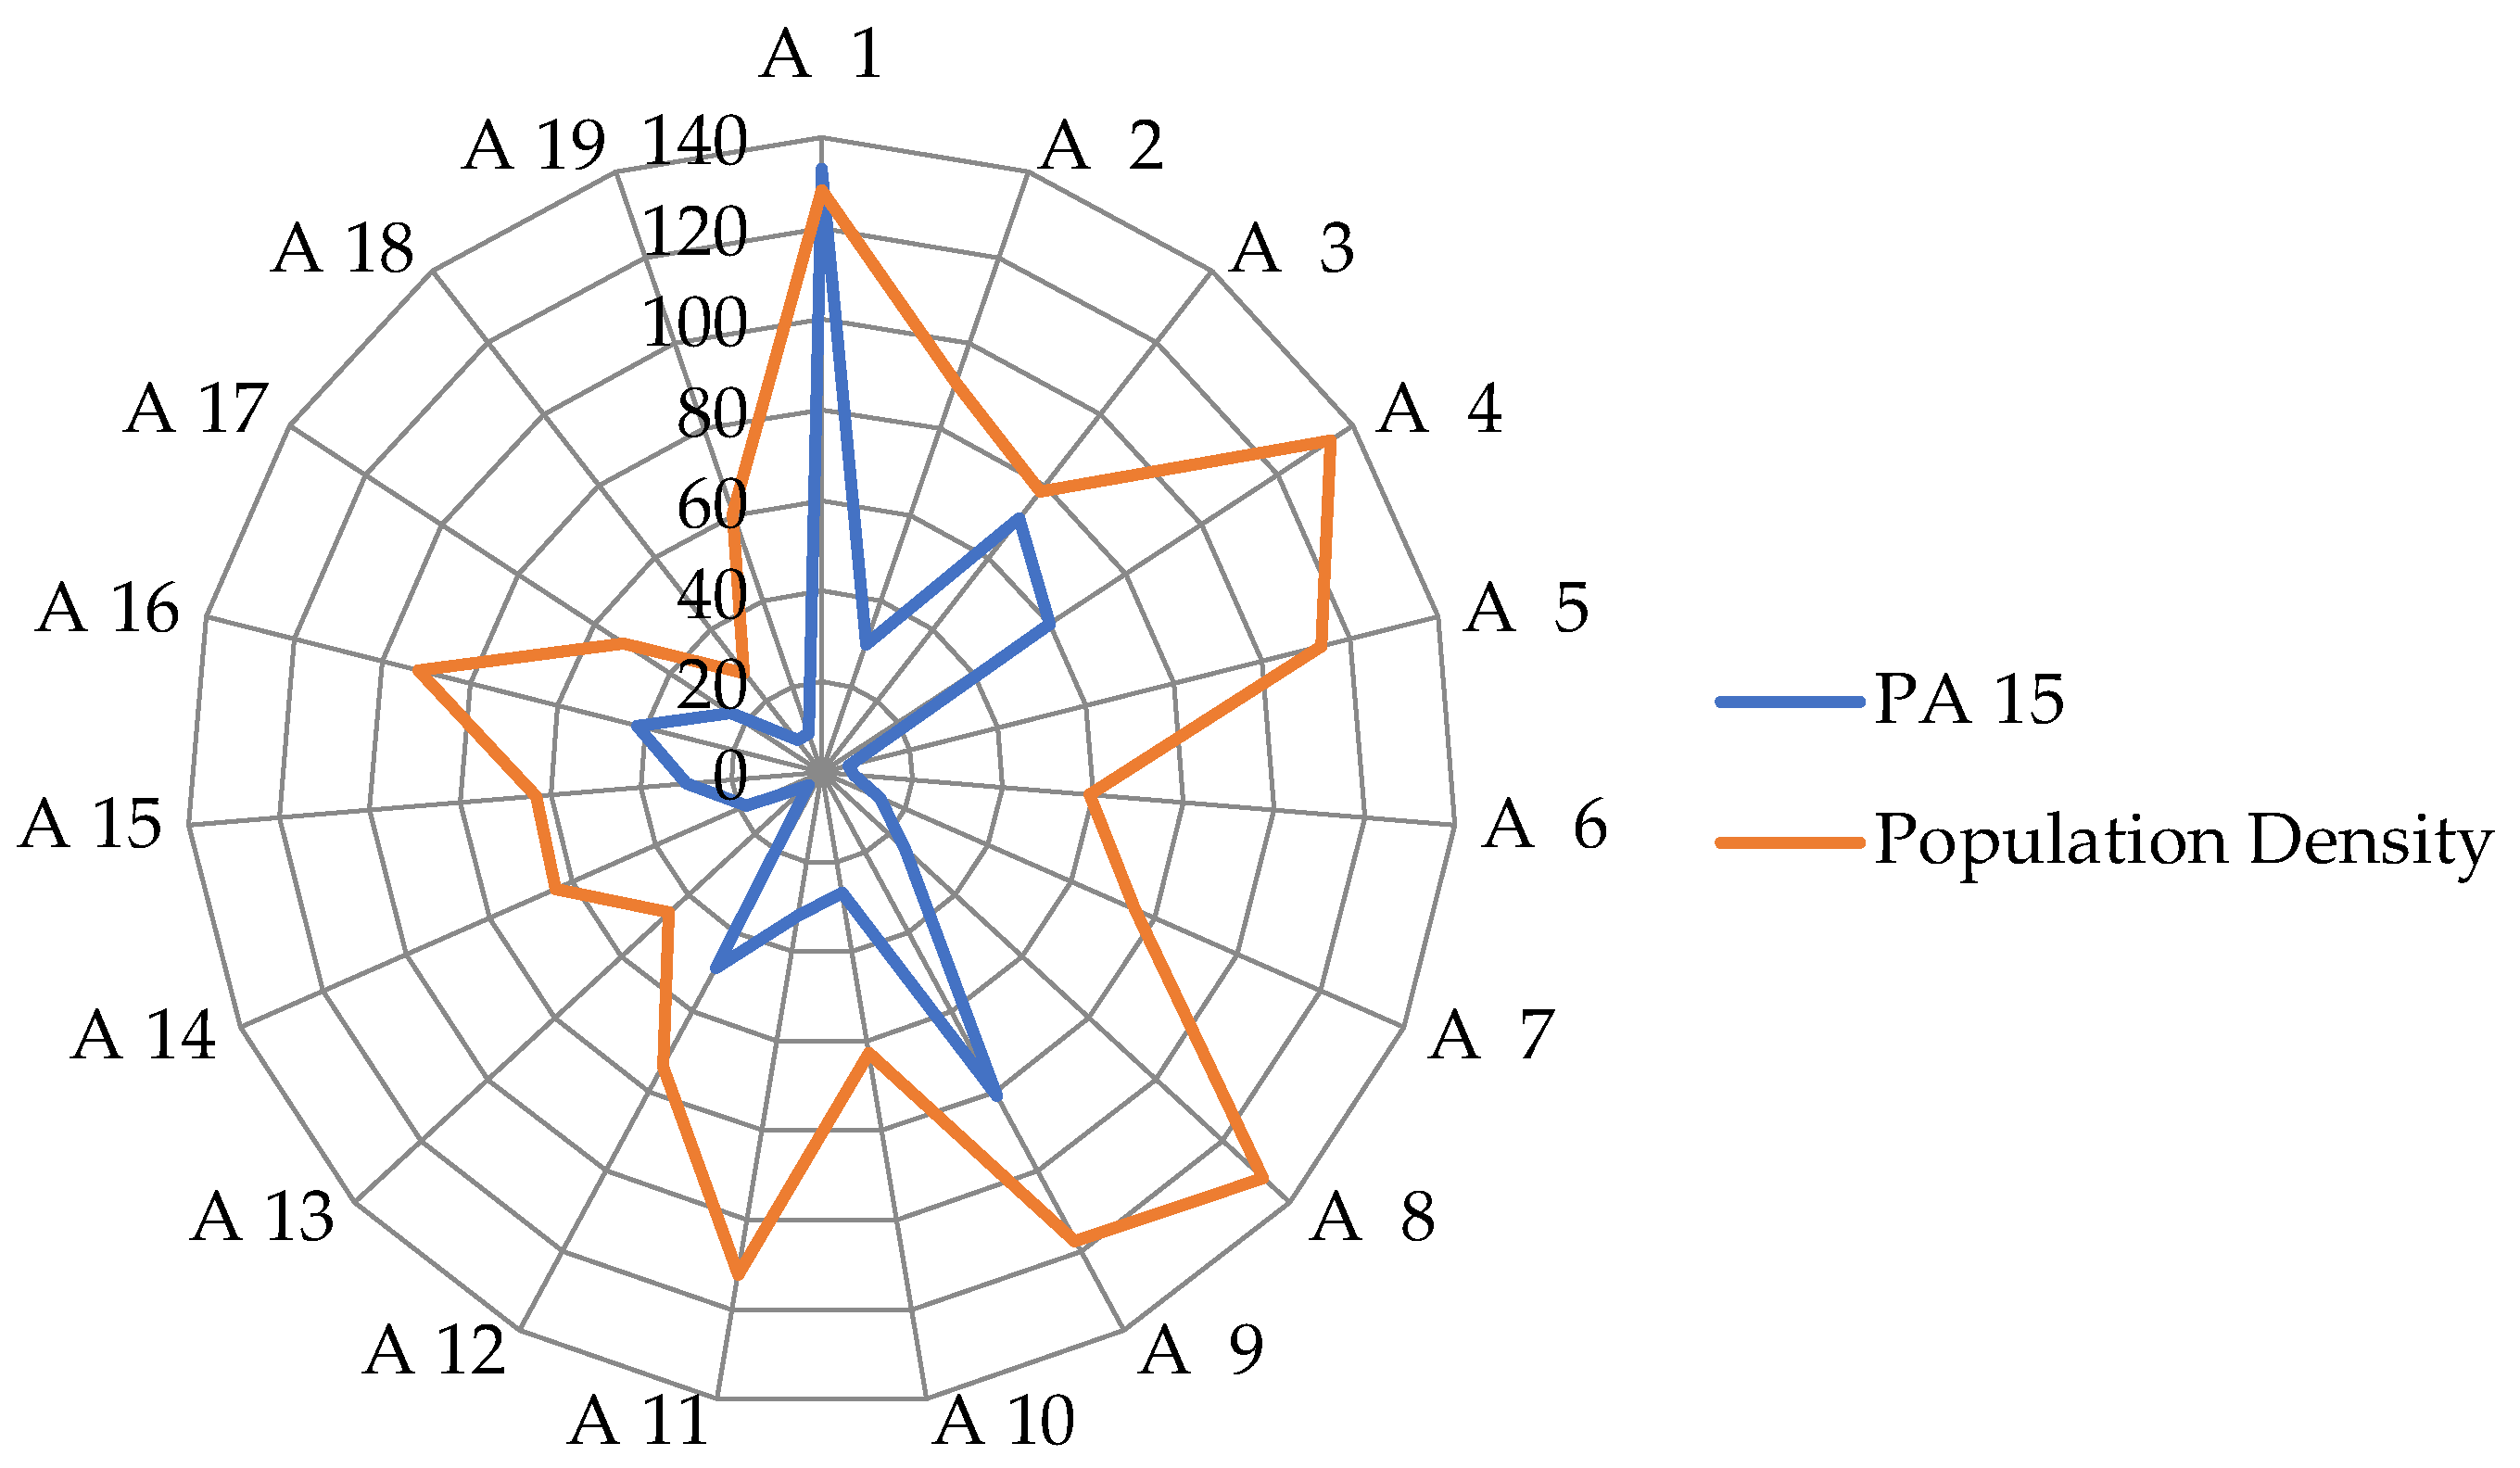
| Area | Surface [km2] | Population [inhab.] | Population Density [inhab./km2] | Nodes No. | NA | NL | Dif. | |||
|---|---|---|---|---|---|---|---|---|---|---|
| NA | NL | |||||||||
| 2009 | 2024 | 2009 | 2024 | 2009 | 2024 | |||||
| A1 | 10.28 | 131,978 | 12,841 | 12 | 28 | 29 | 18 | 19 | 1 | 1 |
| A2 | 19.67 | 178,875 | 9093 | 5 | 7 | 9 | 4 | 5 | 2 | 1 |
| A3 | 8.76 | 68,727 | 7845 | 7 | 15 | 15 | 10 | 10 | 0 | 0 |
| A4 | 13.71 | 183,796 | 13,404 | 7 | 16 | 16 | 9 | 9 | 0 | 0 |
| A5 | 4.22 | 47,985 | 11,372 | 1 | 2 | 2 | 1 | 1 | 0 | 0 |
| A6 | 11.32 | 67,250 | 5939 | 1 | 2 | 2 | 1 | 1 | 0 | 0 |
| A7 | 9.23 | 69,568 | 7536 | 2 | 3 | 3 | 2 | 2 | 0 | 0 |
| A8 | 27.18 | 359,012 | 13,210 | 3 | 7 | 7 | 4 | 4 | 0 | 0 |
| A9 | 33.90 | 397,666 | 11,732 | 10 | 11 | 21 | 8 | 13 | 10 | 5 |
| A10 | 13.02 | 81,736 | 6279 | 3 | 6 | 6 | 3 | 3 | 0 | 0 |
| A11 | 16.65 | 186,794 | 11,216 | 5 | 9 | 9 | 5 | 5 | 0 | 0 |
| A12 | 13.93 | 102,715 | 7376 | 7 | 0 | 13 | 0 | 7 | 13 | 7 |
| A13 | 12.51 | 57,131 | 4568 | 1 | 0 | 1 | 0 | 1 | 1 | 1 |
| A14 | 9.52 | 60,992 | 6404 | 2 | 4 | 4 | 2 | 2 | 0 | 0 |
| A15 | 1.37 | 8648 | 6300 | 3 | 3 | 8 | 2 | 5 | 5 | 3 |
| A16 | 2.52 | 23,137 | 9164 | 3 | 8 | 8 | 6 | 6 | 0 | 0 |
| A17 | 6.64 | 34,626 | 5216 | 3 | 6 | 6 | 4 | 4 | 0 | 0 |
| A18 | 8.85 | 24,635 | 2783 | 2 | 3 | 3 | 2 | 2 | 0 | 0 |
| A19 | 9.55 | 57,659 | 6037 | 2 | 3 | 3 | 2 | 2 | 0 | 0 |
| Total | 232.80 | 2,142,929 | 79 | 133 | 165 | 83 | 101 | |||
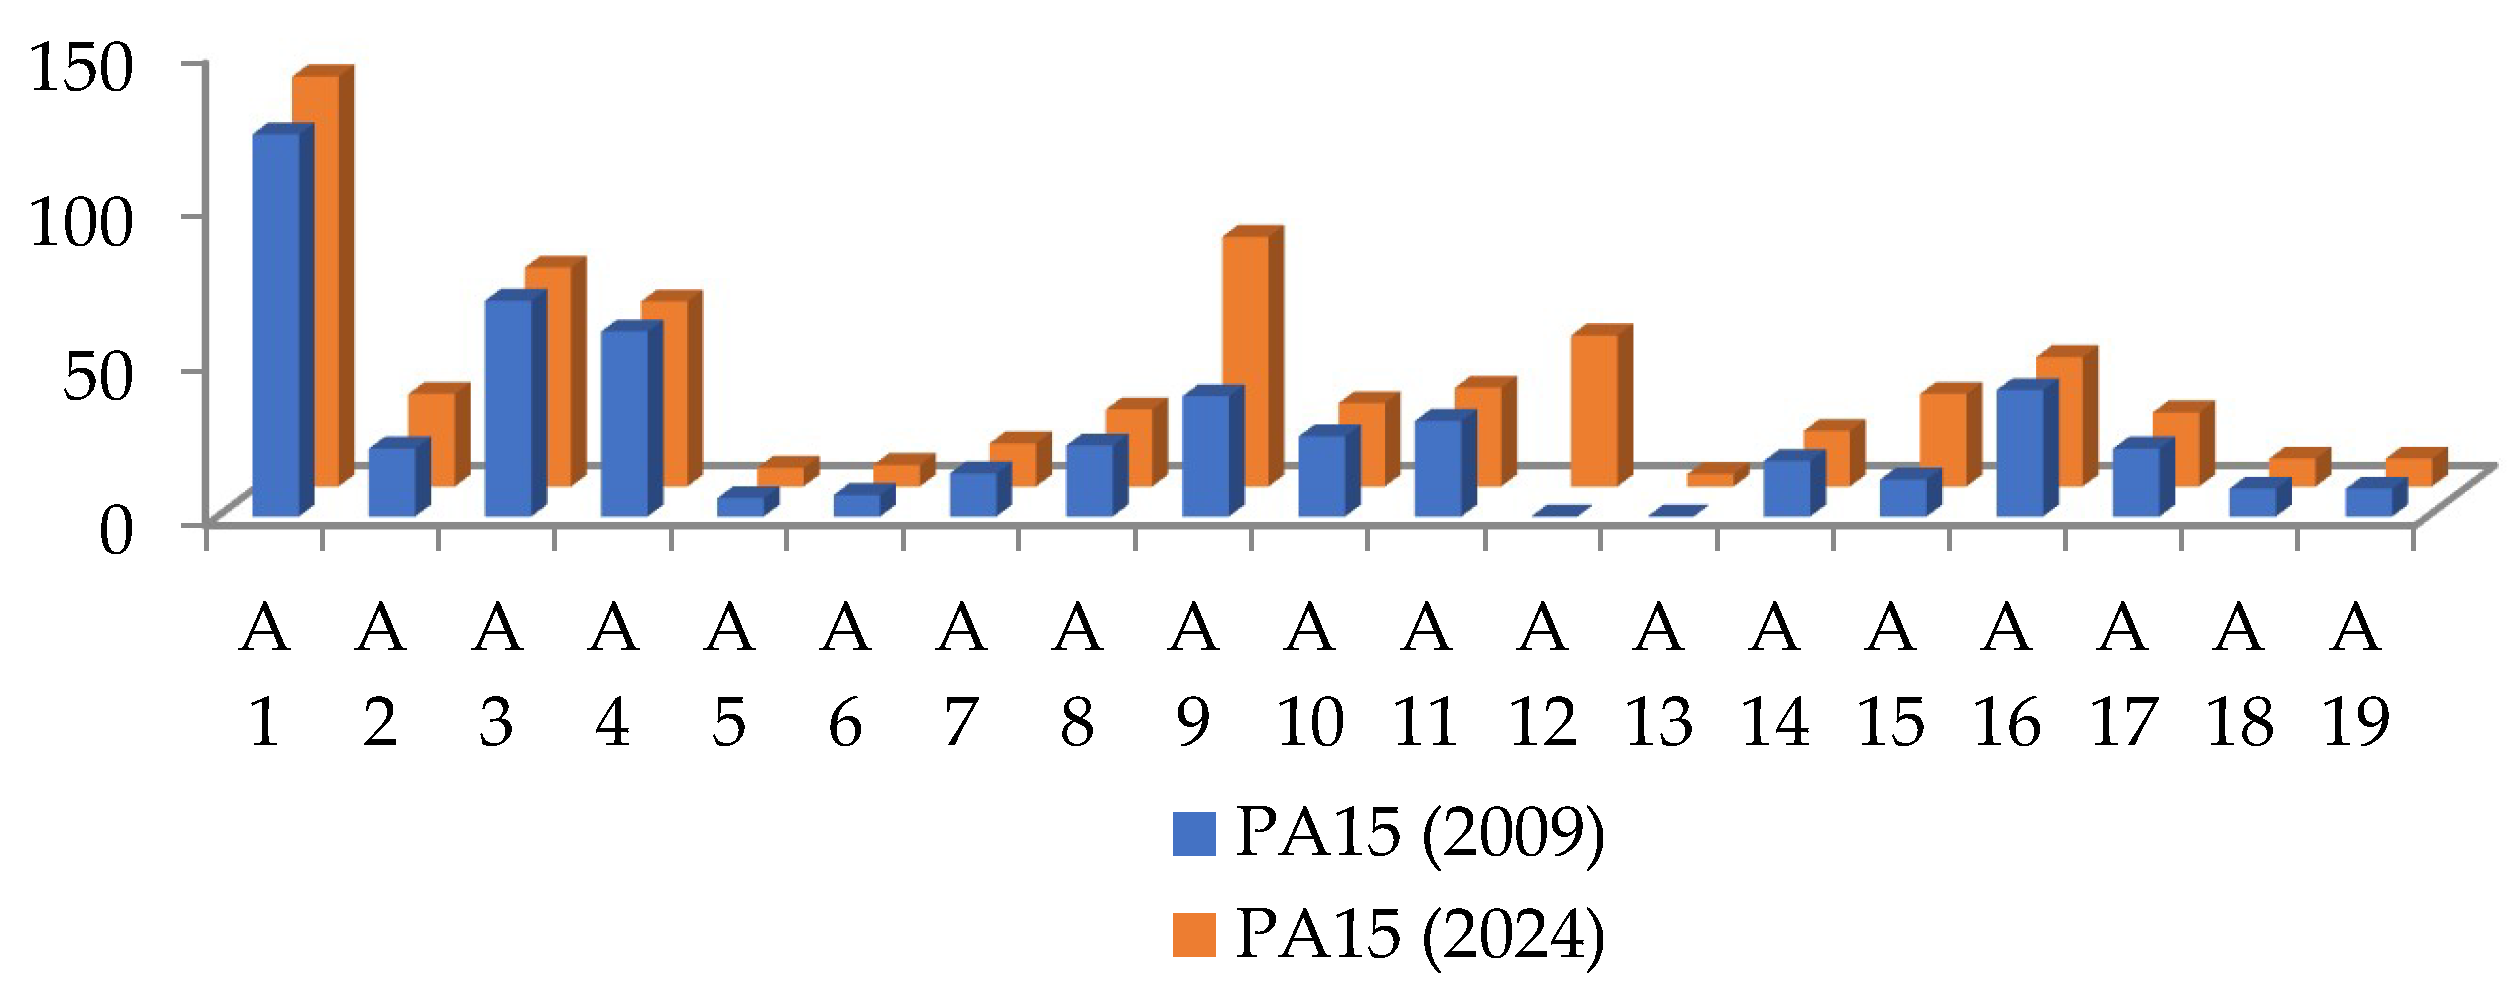
| Area | PDA | PIA | PA 15 | PA 30 | PA 45 | |||||
|---|---|---|---|---|---|---|---|---|---|---|
| 2009 | 2024 | 2009 | 2024 | 2009 | 2024 | 2009 | 2024 | 2009 | 2024 | |
| A1 | 266 | 283 | 236 | 366 | 124 | 133 | 400 | 437 | 473 | 597 |
| A2 | 52 | 70 | 112 | 140 | 22 | 30 | 51 | 63 | 117 | 145 |
| A3 | 143 | 146 | 148 | 208 | 70 | 71 | 218 | 228 | 277 | 323 |
| A4 | 150 | 150 | 142 | 242 | 60 | 60 | 173 | 174 | 262 | 291 |
| A5 | 20 | 20 | 22 | 37 | 6 | 6 | 31 | 31 | 37 | 43 |
| A6 | 20 | 20 | 22 | 37 | 7 | 7 | 31 | 31 | 39 | 47 |
| A7 | 33 | 34 | 50 | 65 | 14 | 14 | 50 | 51 | 68 | 78 |
| A8 | 48 | 55 | 76 | 86 | 23 | 25 | 80 | 85 | 89 | 120 |
| A9 | 72 | 132 | 98 | 223 | 39 | 81 | 115 | 196 | 168 | 326 |
| A10 | 60 | 60 | 66 | 111 | 26 | 27 | 101 | 109 | 124 | 167 |
| A11 | 70 | 70 | 130 | 180 | 31 | 32 | 90 | 104 | 175 | 218 |
| A12 | 0 | 60 | 0 | 199 | 0 | 49 | 0 | 100 | 0 | 212 |
| A13 | 0 | 8 | 0 | 29 | 0 | 4 | 0 | 9 | 0 | 18 |
| A14 | 26 | 28 | 56 | 56 | 18 | 18 | 67 | 70 | 83 | 94 |
| A15 | 28 | 55 | 14 | 76 | 12 | 30 | 36 | 101 | 42 | 150 |
| A16 | 81 | 83 | 44 | 73 | 41 | 42 | 117 | 129 | 126 | 159 |
| A17 | 54 | 56 | 70 | 85 | 22 | 24 | 61 | 65 | 100 | 113 |
| A18 | 28 | 28 | 52 | 72 | 9 | 9 | 34 | 34 | 71 | 76 |
| A19 | 40 | 40 | 44 | 74 | 9 | 9 | 28 | 28 | 61 | 64 |
| Total | 1191 | 1398 | 1382 | 2359 | 533 | 671 | 1683 | 2045 | 2312 | 3241 |
| Area | PDA | PIA | PA 15 | PA 30 | PA 45 | |||||
|---|---|---|---|---|---|---|---|---|---|---|
| Dif1 | PC1 | Dif2 | PC2 | Dif3 | PC3 | Dif4 | PC4 | Dif5 | PC5 | |
| A1 | 17 | 6.4 | 130 | 55.1 | 9 | 7.3 | 37 | 9.3 | 124 | 26.2 |
| A2 | 18 | 34.6 | 28 | 25.0 | 8 | 36.4 | 12 | 23.5 | 28 | 23.9 |
| A3 | 3 | 2.1 | 60 | 40.5 | 1 | 1.4 | 10 | 4.6 | 46 | 16.6 |
| A4 | 0 | 0.0 | 100 | 70.4 | 0 | 0.0 | 1 | 0.6 | 29 | 11.1 |
| A5 | 0 | 0.0 | 15 | 68.2 | 0 | 0.0 | 0 | 0.0 | 6 | 16.2 |
| A6 | 0 | 0.0 | 15 | 68.2 | 0 | 0.0 | 0 | 0.0 | 8 | 20.5 |
| A7 | 1 | 3.0 | 15 | 30.0 | 0 | 0.0 | 1 | 2.0 | 10 | 14.7 |
| A8 | 7 | 14.6 | 10 | 13.2 | 2 | 8.7 | 5 | 6.3 | 31 | 34.8 |
| A9 | 60 | 83.3 | 125 | 127.6 | 42 | 107.7 | 81 | 70.4 | 158 | 94.0 |
| A10 | 0 | 0.0 | 45 | 68.2 | 1 | 3.8 | 8 | 7.9 | 43 | 34.7 |
| A11 | 0 | 0.0 | 50 | 38.5 | 1 | 3.2 | 14 | 15.6 | 43 | 24.6 |
| A12 | 60 | - | 199 | - | 49 | - | 100 | - | 212 | - |
| A13 | 8 | - | 29 | - | 4 | - | 9 | - | 18 | - |
| A14 | 2 | 7.7 | 0 | 0.0 | 0 | 0.0 | 3 | 4.5 | 11 | 13.3 |
| A15 | 27 | 96.4 | 62 | 442.9 | 18 | 150.0 | 65 | 180.6 | 108 | 257.1 |
| A16 | 2 | 2.5 | 29 | 65.9 | 1 | 2.4 | 12 | 10.3 | 33 | 26.2 |
| A17 | 2 | 3.7 | 15 | 21.4 | 2 | 9.1 | 4 | 6.6 | 13 | 13.0 |
| A18 | 0 | 0.0 | 20 | 38.5 | 0 | 0.0 | 0 | 0.0 | 5 | 7.0 |
| A19 | 0 | 0.0 | 30 | 68.2 | 0 | 0.0 | 0 | 0.0 | 3 | 4.9 |
| Average | 10.90 | 15.00 | 51.42 | 73.00 | 7.26 | 19.40 | 19.05 | 20.10 | 48.90 | 37.60 |
Disclaimer/Publisher’s Note: The statements, opinions and data contained in all publications are solely those of the individual author(s) and contributor(s) and not of MDPI and/or the editor(s). MDPI and/or the editor(s) disclaim responsibility for any injury to people or property resulting from any ideas, methods, instructions or products referred to in the content. |
© 2025 by the authors. Licensee MDPI, Basel, Switzerland. This article is an open access article distributed under the terms and conditions of the Creative Commons Attribution (CC BY) license (https://creativecommons.org/licenses/by/4.0/).
Share and Cite
Dragu, V.; Oprea, F.C.; Roman, E.A. Assessment of Bucharest Metro Expansion and Its Correlation with the Territorial System. Land 2025, 14, 946. https://doi.org/10.3390/land14050946
Dragu V, Oprea FC, Roman EA. Assessment of Bucharest Metro Expansion and Its Correlation with the Territorial System. Land. 2025; 14(5):946. https://doi.org/10.3390/land14050946
Chicago/Turabian StyleDragu, Vasile, Floriana Cristina Oprea, and Eugenia Alina Roman. 2025. "Assessment of Bucharest Metro Expansion and Its Correlation with the Territorial System" Land 14, no. 5: 946. https://doi.org/10.3390/land14050946
APA StyleDragu, V., Oprea, F. C., & Roman, E. A. (2025). Assessment of Bucharest Metro Expansion and Its Correlation with the Territorial System. Land, 14(5), 946. https://doi.org/10.3390/land14050946