Abstract
In 2024, significant increases in surface temperature were recorded in Batam City and Bintan Regency, marking the highest levels observed in regional climate monitoring. The rapid conversion of vegetated land into residential and industrial areas has been identified as a major contributor to the acceleration of local climate warming. Climatological analysis also revealed extreme temperature fluctuations, underscoring the urgent need to understand spatial patterns of temperature distribution in response to climate change and weather variability. This research uses a Cellular Automata–Artificial Neural Network (CA−ANN) approach to model spatial and temporal changes in land surface temperature across the Riau Islands. To overcome the limitations of single-model predictions in a geographically diverse and unevenly developed region, Landsat satellite imagery from 2014, 2019, and 2024 was analyzed. Surface temperature data were extracted using the Brightness Temperature Transformation method. The CA−ANN model, implemented via the MOLUSCE platform in QGIS, incorporated additional environmental variables, such as rainfall distribution, vegetation density, and drought indices, to simulate future climate scenarios. Model validation yielded a Kappa accuracy coefficient of 0.72 for the 2029 projection, demonstrating reliable performance in capturing complex climate–environment interactions. The projection results indicate a continued upward trend in surface temperatures, emphasizing the urgent need for effective mitigation strategies. The findings highlight the essential role of remote sensing and spatial modeling in climate monitoring and policy formulation, especially for small island regions susceptible to microclimatic changes. Despite the strengths of the CA−ANN modeling framework, several inherent limitations constrain its application, particularly in the complex and heterogeneous context of tropical island environments. Notably, the accuracy of model predictions can be limited by the spatial resolution of satellite imagery and the quality of auxiliary environmental data, which may not fully capture fine-scale microclimatic variations.
1. Introduction
Tropical island regions are among the most climate-vulnerable areas on the earth due to their geographic exposure and dependence on climate-sensitive sectors such as agriculture, fisheries, and tourism [1,2]. These territories, often fragmented and ecologically fragile, are facing intensifying climate pressures from rising temperatures and erratic rainfall [2]. Indonesia, an archipelagic nation strategically located between two oceans and two continents, has undergone notable temperature increases over the past three decades [1]. Long-term climatological observations conducted at decadal intervals reveal a persistent upward trend in surface temperatures across most regions of the archipelago [2,3]. This phenomenon is largely driven by global climate change, particularly the intensification of global warming, as well as regional climatic anomalies that amplify thermal variability in tropical zones such as Indonesia [4,5]. These shifts have profound ecological and socioeconomic implications: fisheries and agriculture—highly sensitive to temperature changes—face increasing stress, while the degradation of coastal ecosystems and coral reefs further undermines environmental resilience [6,7].
The observed temperature changes in Indonesia are not merely abstract statistical trends; they are closely linked to shifts in regional climatic systems, including alterations in rainfall distribution [8,9], disruption of marine ecosystem stability, and the accelerated degradation of coral reef habitats [10,11]. In particular, tropical island provinces such as the Riau Islands face compounded risks due to their coastal geography, high population density, and urban-industrial growth [12,13]. However, the vast and dispersed geography of Indonesia, comprising thousands of small and often remote islands, presents substantial challenges to conventional climate monitoring systems [14,15]. These limitations necessitate the adoption of scalable, technology-driven approaches, particularly satellite-based remote sensing, to detect temperature variability at appropriate spatial and temporal scales [14,16].
In this context, the Riau Islands represent a critical case study of climate vulnerability [17,18]. The province is strategically located between the South China Sea, the Malacca Strait, and the Karimata Strait, and adjacent to Singapore and Malaysia, making it both ecologically sensitive and economically significant [19,20]. Historical records indicate that average temperatures in the region have increased by approximately 0.2 °C to 0.3 °C per decade since the 1980s [21]. These changes have affected seasonal rhythms: dry seasons have lengthened, rainy seasons shortened, while total rainfall has remained stable [22,23]. The effects on agricultural productivity, coastal ecosystems, and water availability, which collectively constitute key pillars of the regional economy, are significant [24]. Moreover, fluctuations in precipitation, often exceeding 2000 mm annually, have shifted toward intense short-duration events, leading to flooding, erosion, and hydrometeorological disasters [9,25]. To address these risks, remote sensing data such as Landsat 8 have been widely adopted to monitor changes in land surface temperature (LST) [26,27]. Remote sensing data, imagery, allows for extensive and multitemporal monitoring of LST [26,28] Using thermal channels (band 10 and band 11), the LST can be estimated through algorithms [29,30], such as the Split Window Algorithm (SWA) [31,32], which uses emissivity values, vegetation index (Normalized Difference Vegetation Index or NDVI), and satellite brightness temperature to provide accurate LST information [33]. However, while valuable, conventional remote sensing models alone often lack the predictive capacity needed to simulate future temperature dynamics in complex geographies like tropical islands. The use of Landsat-based temperature estimates still requires integration with data-driven models capable of capturing the non-linear interactions between land cover change, development intensity, and climate variables [16,34]. Robust computational methods, including machine learning, spatial statistics, and time-series analysis, are essential to decipher the underlying temperature patterns and to generate accurate and timely predictions. The integration of these tools with remote sensing technologies offers a promising avenue for enhancing climate monitoring capabilities [35]
One methodological advancement designed to address the complexity of temperature data analysis is the hybrid Cellular Automata—Artificial Neural Networks (CA-ANN) model, which integrates spatial-temporal dynamics with analysis of the complexity of anthropogenic and natural factors [36,37]. This approach is well-suited for processing large-scale remote sensing datasets and can adaptively learn from historical climatic patterns, thereby enabling more accurate and responsive predictions of temperature trends in the face of ongoing environmental change [38,39]. CA-ANN excels at capturing non-linear relationships and can incorporate multiple input variables—such as sea surface temperature, cloud cover, and various atmospheric parameters—which are essential for reliable temperature forecasting, particularly in island regions characterized by distinct microclimatic conditions [40]. In the Riau Islands, particularly in Batam City and Bintan Regency, urban growth is uneven, forest conversion is accelerating, and temperature fluctuations have intensified. In such a setting, the CA–ANN approach offers a flexible framework to simulate how temperature responds to rapid anthropogenic change [41].
The need for integrated modeling is supported by data from the Meteorology, Climatology, and Geophysics Agency, which shows that Urban LSTs in Batam have reached between 30.6 °C and 34.8 °C, due to loss of vegetation and urban heat island effects [42,43]. Moreover, Batam City and Bintan Regency face unique climatic pressures due to industrial growth of 12.3 percent per year (2015−2019) [44], accompanied by deforestation, triggering an average temperature increase of 0.15 °C/year at the coast. Climatological data for 2023−2024 show extreme temperature fluctuations of (21.0 to 34.8) °C with (78 to 86.8) percent humidity, indicating destabilization of the micro-climatic system. This phenomenon is exacerbated by urban sprawl, which reduces vegetation cover from 68.2 to 41.7 percent between 1990 and 2020 [19], increasing the temperature of urban built-up areas. Such rapid transitions underscore the inadequacy of single-model predictive tools and justify the adoption of hybrid CA–ANN approaches that consider spatial heterogeneity and complex feedback loops [36,45,46].
Research on the impact of urbanization on air temperature changes in Southeast Asian countries has consistently shown that urbanization significantly contributes to rising air temperatures, particularly through the phenomenon of the Urban Heat Island (UHI). A study by Doan Quang-Van et al. (2016) [47] in tropical megacities such as Ho Chi Minh City, Vietnam, revealed that rapid urban expansion has led to increased surface temperatures and a decline in thermal comfort levels, making urban populations more vulnerable to heatwaves. Similar findings have been reported in major Indonesian cities, where changes in land use and the intensification of urban development have contributed to an increase in average daily temperatures by more than 1 °C in urban areas compared to surrounding rural regions. In the Philippines, Manalo et al. (2022) [48] analyzed trends in extreme temperature events using data from 34 meteorological stations, comparing urban and rural areas from 1951 to 2018. The results indicated a more pronounced increase in minimum temperatures at urban stations compared to rural ones, with an approximate rise of 0.25 °C per decade in urban areas. The impact of urbanization was most evident in daily minimum temperature indices, contributing to more frequent warm nights and a reduced occurrence of cool nights in Philippine cities. Studies conducted in Thailand have further affirmed the role of urbanization in the rising trend of average air temperatures. Research by Pimonsree Sittichai et al. (2022) [49] demonstrated that urban-induced warming accounts for approximately 0.15 °C per decade—equivalent to about 40% of the country’s total warming between 1970 and 2019. This increase in temperature not only escalates the frequency of heatwaves in the Bangkok metropolitan area but also intensifies and expands the spatial extent of UHI effects, thereby heightening the risk of heat stress and placing additional burdens on urban energy systems and public health infrastructures.
In-depth understanding of temperature distribution patterns over a significant temporal period is important to face the increasingly complex challenges of climate change and weather variability [50,51]. Therefore, the creation of a five-year temperature model [52] from 2014 to 2024 is critical as a baseline for predictive analysis. This ten-year time span is sufficiently representative to capture temperature trends and fluctuations influenced by various local and global climate factors [53]. Grouping the temperature data in five-year intervals allows a more stable and informative dataset structure to be obtained, enabling more effective detection of spatial and temporal patterns [53,54]. These data provide an essential foundation to build predictive models that can accurately capture past trends, while also being reliable in projecting future conditions [55]. Temperature change patterns due to climate change are predicted by processing Landsat satellite imagery data every 5 years, where the period of the data can show significant change patterns [15,56]. Although the CA−ANN modeling framework offers considerable advantages, its application faces intrinsic constraints, especially within the diverse and intricate settings of tropical island landscapes. In particular, the precision of model forecasts is often hindered by limitations in the spatial resolution of satellite data and the reliability of supplementary environmental inputs, which may fall short in representing detailed microclimatic variations [14,16]. Additionally, single-model approaches often struggle to generalize across unevenly developed landscapes with diverse land use patterns, leading to potential biases in temperature projections. This study seeks to mitigate these challenges by integrating multi-temporal Landsat datasets and incorporating a broader range of environmental variables, such as rainfall distribution and drought indices, enhancing the model’s responsiveness to localized climatic drivers. The use of the MOLUSCE platform within QGIS further facilitates a flexible and robust simulation environment capable of addressing spatial heterogeneity. Ultimately, this study advances the applicability of hybrid remote sensing and spatial modeling by offering a tailored CA–ANN framework for temperature forecasting in tropical island territories facing intensifying development pressures and climatic stress.
2. Materials and Methods
This research is conducted within the territorial scope of the Riau Islands Province, specifically encompassing the administrative domain of Batam Municipality and the geographic region of Bintan Island. Administratively, the Riau province consists of multiple regencies and cities spread across several islands. Among these, Batam Island contains Batam City, the largest industrial and population center, while Bintan Island hosts both Bintan Regency and the provincial capital, Tanjung Pinang City. The selection of these areas is predicated on their strategic locational attributes and their critical alignment with the central research objectives and hypotheses formulated in this study. Figure 1 illustrates the geographic relationship between the province, the islands, and their administrative divisions:
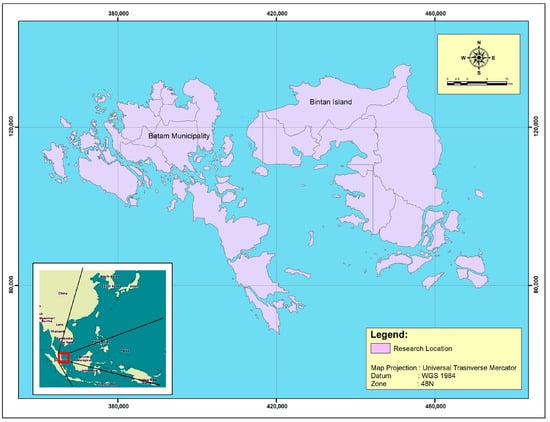
Figure 1.
Location of the Riau Islands Province, Indonesia, showing the main islands (Batam and Bintan) and their corresponding administrative units—Batam City on Batam Island, and Bintan Regency and Tanjung Pinang City on Bintan Island. The map outlines the geographical extent within which all data processing, analysis, and model prediction using the CA−ANN method were conducted. The map was self-produced using GIS software based on the administrative boundary.
This is because the Riau Islands area is an archipelagic province, and the Riau Islands lie in a tropical region with a warm and humid climate throughout the year. Climate change in such tropical areas can significantly impact the environment and local communities, such as changes in rainfall patterns, temperature, drought, and vegetation density [36,57]. Climate change can lead to droughts, floods, and other disruptions that directly affect the well-being of communities [37,46]. Places that are vulnerable to climate change, such as the Riau Islands, can provide useful insights into how communities can adapt to and cope with these challenges [18].
2.1. Data Acquisition
Landsat 8 imagery published through USGS EarthExplorer is remote sensing satellite data that is used for a variety of scientific and practical applications. The satellite is equipped with two main sensors, the Operational Land Imager (OLI) and the Thermal Infrared Sensor (TIRS), providing 11 spectral bands with a spatial resolution of up to 30 m for the multispectral band, and 15 m for the panchromatic band. Its temporal resolution allows data to be acquired every 16 days, providing consistent global coverage. Landsat 8 data are particularly useful in that they cover a wide range of wavelengths, including thermal infrared (bands 10 and 11), which allows analysis of the Earth’s LST. In addition, geometric and radiometric corrections have been applied to this image to improve the accuracy of the data. This image can be used for various applications in different scientific fields related to objects on the Earth’s surface [58,59].
2.2. Data Processing
Data processing was initiated by downloading Landsat 8 Level 1 imagery for the years 2014, 2019, and 2024 from the USGS, as well as rainfall data from the official website of the relevant government agency in 2024. The acquired Landsat imagery and rainfall data were subsequently corrected. Once the correction process was completed, the imagery was clipped according to the boundaries of the research area. Subsequently, various thematic maps were generated, including temperature, rainfall, vegetation density, and drought maps. The LST map was derived using the LST formula; rainfall was mapped using the Thiessen Polygon method; vegetation density was calculated using the NDVI method; and drought conditions were assessed using the Temperature Vegetation Dryness Index (TVDI) method. All these parameters were used as inputs to predict the LST in 2029, which was conducted using the CA−ANN method implemented in QGIS through the MOLUSCE plugin. The prediction results obtained from the CA−ANN model were then validated using the 2024 Landsat imagery through a Kappa accuracy assessment. Following confirmation that the Kappa value fell within the acceptable range, the prediction of temperature change patterns for 2029 was considered successful.
2.3. Parameter Mapping
2.3.1. Land Surface Temperature (LST) Extraction
LST can be estimated by extracting the thermal information from Landsat 8 satellite imagery using the thermal infrared band 10. The process begins by converting the pixel’s digital number (DN) into spectral radiance using the equation Lλ = ML × Qcal + AL [60], then converting the radiance into brightness temperature. Band 10 is used exclusively, as recommended by the USGS, due to calibration issues identified in band 11. This brightness temperature serves as a basis to then derive LST values after applying appropriate corrections, with the following equation [61]:
where
T = K2/(In (K1/Lλ + 1))
T = temperature in Kelvin (K);
K1 Radian spectral calibration constant (607.76 W/sr·m2·µm);
K2 absolute temperature calibration constant (1260.56 K);
Lλ = image radian value (W/sr·m2·µm);
The obtained temperature (Tk) is then converted to Celsius scale units (°C) using the conversion formula: °C = K − 273.15.
2.3.2. Normalized Difference Vegetation Index (NDVI)
The NDVI is an algorithm used on image data to identify vegetation density. The vegetation index serves as a parameter in assessing the vegetation condition in an area. This spectral index is used to measure and monitor plant growth, vegetation cover, and biomass production using data from multispectral satellites. The vegetation index converts image-based spectral data to monitor and analyze vegetation. NDVI values are calculated based on the ratio between reflectance in the red channels and the Near-Infrared channels [60]:
where
NDVI = (NIR − RED)/(NIR + RED)
NIR = Near–Infrared Bands;
RED = Red Bands.
2.3.3. Temperature Vegetation Dryness Index (TVDI)
This study uses the TVDI as a drought index model. TVDI is based on the relationship between the vegetation index and the LST [62]:
where
TVDI = (Ts − Tsmin)/((a + b) NDVI) − Tsmin
Ts = LST observed at a pixel;
Tsmin = Minimum LST, defining the wet boundary;
a & b = Intercept and slope values of the linear line reflecting the dry boundary using regression and correlation between the NDVI and LST.
2.3.4. Rainfall (Thiessen Polygon)
The Thiessen Polygon method is a spatial interpolation technique that is used to estimate the distribution of rainfall by considering the influence of the area represented by each observation station. This method is suitable for areas with uneven distribution of rainfall stations, where each polygon formed from the perpendicular bisectors of the lines connecting stations becomes the representation area of the nearest station’s rainfall data. The polygon creation process involves dividing the area based on the closest distance to the observation station, so that each area is weighted according to its polygonal area. The implementation of this method in making rainfall maps requires systematic steps using software. Rain station coordinate data are processed to produce Thiessen polygons through an algorithm, then cut according to the boundaries of the research area. Polygon results that already have rainfall attribute data are then classified using color gradation symbology for spatial visualization [63]. The rainfall map that was generated through the Thiessen Polygon method served a crucial role in the prediction process. Specifically, the spatial distribution of rainfall was used as one of the hidden layers within the CA−ANN model. In this context, the rainfall data did not function merely as an independent variable, but was integrated into the model’s architecture to indirectly influence the learning process. By serving as a hidden layer, the rainfall input contributed to the identification of complex patterns and relationships between precipitation levels and surface temperature variations. This integration enhanced the model’s capacity to more accurately simulate the spatial dynamics of LST changes, especially for the year 2029.
2.4. Modeling Temperature and Validation (Kappa Coefficient Accuracy Test)
The CA−ANN modeling and prediction stages are carried out with QGIS using the MOLUSCE plugin. The hidden layer parameter in an ANN plays a critical role in processing the non-linear relationship between input variables (such as rainfall) and the predicted temperature pattern output. In the CA−ANN model in the MOLUSCE plugin, the hidden layer is responsible for extracting complex patterns from historical weather data, including the relationship between rainfall distribution and local temperature changes. Without an optimal hidden layer configuration, the model is unable to capture spatiotemporal dynamics, such as the influence of evaporation due to rainfall on temperature fluctuations. The integration of rainfall parameters into the hidden layer allows the model to represent hydrometeorological mechanisms, such as the cooling effect after rainfall of the land surface, or the increase in air humidity that affects temperature fluctuations [64].
The accuracy test was conducted to assess the extent of the accuracy of the prediction of land temperature changes resulting from the modeling that has been performed. The Kappa statistical method is applied with a confusion matrix. This matrix is square (Table 1), and serves to detect classification errors, both in the form of excess pixels in a particular class, and the lack of pixels in each category [38].

Table 1.
Kappa coefficient score.
3. Results
3.1. Land Surface Temperature Extraction
The LST was obtained by processing Landsat 8 image data, especially Band 10, which was chosen because it has a lower atmospheric absorption rate than Band 11. The radiometric correction of Band 10 was performed by converting the digital number (DN) value into radiance. In LST processing, the cloud temperature data are removed because this research is focused on land, so a cloud removal step is required. In the LST calculation, the radiance value is also used to determine the brightness temperature. The LST in Batam City and Bintan Island in 2014, 2019, and 2024 displayed different dynamics of change. The LST has increased with the passage of time (Figure 2), where in 2014, the temperature in Batam City and Bintan Island ranged (20 to 31) °C, which was influenced by the high density of vegetation, while in 2019, the LST in Batam City and Bintan Island ranged (20 to 34)°C, which was influenced by the decrease in the amount of vegetation and the increase in infrastructure development that caused an increase in LST. In 2024, the LST of Batam City and Bintan Island also increased, ranging from 20 to 34.81 °C. In this paper, the 2014 and 2019 LST data are used as a model to predict the temperature in 2029, while the 2024 temperature data are used as accuracy test data.
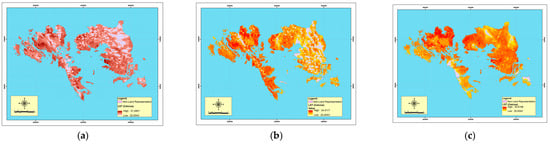
Figure 2.
A series of maps, derived from Landsat data, depicts the spatial distribution of LST in the 5-year span across the research area in (a) 2014, (b) 2019, and (c) 2024.
3.2. Vegetation Density
Vegetation density was processed using the NDVI method. In this research, the Normalized Difference Vegetation Index (NDVI) was used as the fundamental basis for the land use change approach in this study, enabling the assessment of vegetation density dynamics and spatial transformations over time. In 2014, vegetation distribution across the region was observed to be in relatively good condition, with the highest NDVI value reaching 0.842. This indicated that a majority of the area was still dominated by dense green cover. Such conditions suggested that land use during this period was primarily governed by natural ecological functions, with forested and vegetated areas largely undisturbed by anthropogenic activities. The presence of extensive vegetation was considered crucial for maintaining ecological balance, regulating the local microclimate, and ensuring the sustainability of natural resources.
By 2019, although the maximum NDVI value slightly increased to 0.851, a noticeable shift in the spatial distribution of vegetation was identified, particularly in areas adjacent to residential development. The intensification of land conversion for urban expansion and infrastructure projects was associated with a reduction in vegetative cover, as evidenced by declining NDVI values in these zones, including instances of complete vegetation loss. Conversely, in remote areas such as small islands and conservation zones, an increase in NDVI values was recorded, suggesting ongoing natural regeneration or effective land protection efforts. These patterns indicated an uneven transformation of land use, with urban zones experiencing greater developmental pressure compared to more isolated regions.
By 2024, the decline in vegetation density around settlement areas had become more evident, with the highest NDVI value decreasing to 0.783. NDVI-based observations from all three time points were subsequently integrated as key parameters in surface temperature prediction models, allowing the linkage between land cover change and thermal dynamics to be systematically examined (Figure 3).
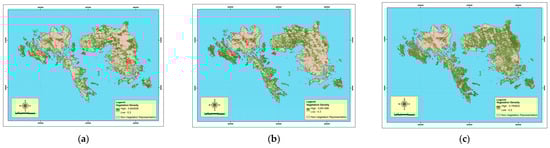
Figure 3.
The spatial distribution of vegetation density within the study area, derived from satellite imagery analysis, for (a) 2014, (b) 2019, and (c) 2024.
3.3. Dryness Index
Dryness index processing uses the TVDI method. The TVDI value is calculated based on two main parameters in determining the dryness index, which are NDVI as vegetation representation, and LST as LST. These two parameters were obtained through spectral data extraction from the 2024 Landsat 8 imagery (Figure 4). In this research, it is found that the dryness index in Batam City and Bintan Island tends to be normal and slightly wet, but in the dryness index, some areas of densely populated areas are indexed as rather dry, and dry. The dryness index is also used as an additional variable (hidden layer) in predicting the pattern of temperature change in 2029 using CA−AAN, where the dryness data aims to describe the current dryness state.
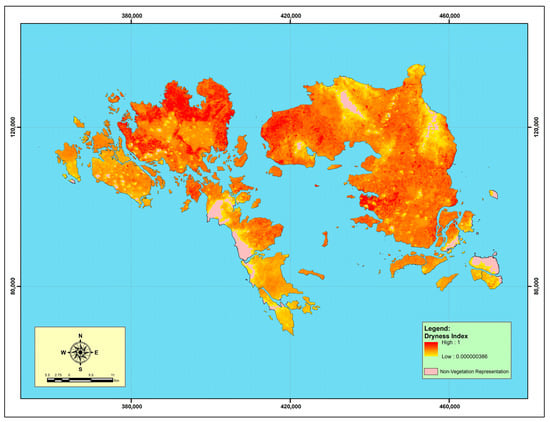
Figure 4.
The spatial distribution of surface dryness based on the Temperature Vegetation Dryness Index (TVDI), derived from satellite data.
3.4. Rainfall (Precipitation)
In this research, the Meteorological stations used are Hang Nadim Meteorological Station (Batam Municipality, Riau Islands Province) and Raja Haji Fisabilillah Meteorological Station (Bintan Island, Riau Islands Province), with data for 2024, where rainfall data are corrected using the Inverse-Square Distance method, which aims to find missing rainfall data. The method is used as a precipitation observer from stations that are located close to each other. From the processing results obtained, the rainfall data in Batam City and Bintan Island in 2024 are (2636.6 and 3968.5) mm/year, respectively (Figure 5). The rainfall map itself is used as an additional variable (hidden layer) in predicting the temperature change pattern in 2029, and is also used as a description of the current rainfall situation.
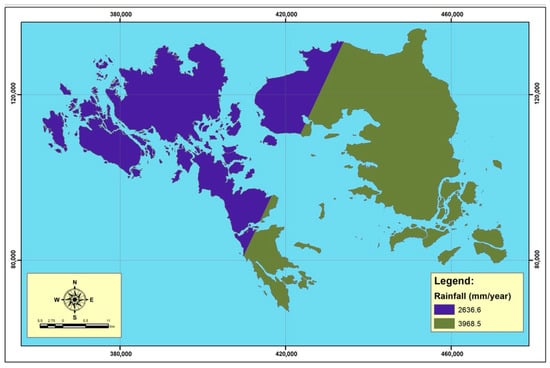
Figure 5.
The spatial distribution of rainfall across the study area, generated using the Thiessen polygon method.
The relationship between rainfall and surface temperature in Batam and Bintan is clearly demonstrated through spatial analysis, as illustrated by the corresponding maps. These maps divide the islands into two main zones based on annual rainfall—areas with lower precipitation (approximately 2636.6 mm/year) and those with higher precipitation (around 3968.5 mm/year)—providing a framework for understanding the influence of rainfall patterns on surface thermal conditions. A consistent spatial trend emerges, where regions with higher rainfall tend to exhibit lower land surface temperatures, as depicted by a color gradient ranging from yellow (cooler temperatures) to red (warmer temperatures). This inverse relationship is largely attributed to environmental processes such as increased soil moisture and denser vegetation cover in high-rainfall areas, which enhance evapotranspiration and contribute to surface cooling. Conversely, areas receiving less rainfall typically experience reduced vegetation and drier soils, leading to greater heat absorption and retention, thereby elevating land surface temperatures. This observed negative correlation underscores the critical role of precipitation in moderating surface thermal dynamics across the region.
3.5. Temperature Prediction Using Cellular Automata–Artificial Neural Network (CA−ANN)
The CA−ANN algorithm demonstrates robust capability in modeling LST dynamics through spatiotemporal data integration. This analytical framework operates on a 5-year temporal baseline (2014−2019), leveraging Python 3.9-based geospatial processing within QGIS 3.40 Bratislava to generate temperature pattern simulations. The activation functions of the hidden layers optimize feature extraction from covariate matrices, mirroring ANN architectures used in Japan’s seasonal temperature forecasting. This approach allows the CA−ANN to resolve microclimatic variations at 30 m resolution, which is critical for urban temperature-vulnerable mitigation planning. The morphological characteristics of the learning curve in the CA−ANN algorithm serve as a critical determinant of predictive accuracy for temperature phenomena. This research demonstrates that optimal curve geometry is necessary to ensure robust model performance. Empirical analysis reveals a root mean square error (RMSE) range of (0.030 to 0.55) across training epochs, with ideal curve profiles exhibiting three key properties, which are the monotonic decreasing trend that indicates systematic parameter optimization, the low-variance plateau phase that reflects model stability in later training stages, and the smooth gradient transition that suggests an absence of overfitting or underfitting artifacts. These morphological features correlate strongly with prediction fidelity, providing quantitative validation that curve shape optimization directly enhances the ability of the algorithm to capture thermal dynamics (Figure 6).
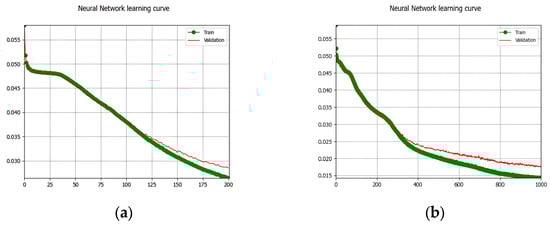
Figure 6.
Neural network learning curve showing the training and validation loss over (a) 200 epochs and over (b) 1000 epochs during the LST prediction model training. The x-axis represents the number of epochs, while the y-axis represents the loss value. The decreasing trend of both training (green line) and validation (red line) losses indicates effective model learning and generalization, with no signs of overfitting.
The CA−ANN algorithm demonstrates statistically significant predictive capability for LST modeling, as evidenced by rigorous geostatistical validation. The framework achieves substantial agreement (κ = 0.72) between the projected and observed thermal patterns, indicating robust performance in raster-based spatial predictions. The CA−ANN algorithm integrates these multivariate inputs to simulate future temperature patterns with high accuracy, capturing 72 percent of the determinate factors. The model effectively accounts for non-linear interactions between external drivers (e.g., temperature data derived from satellite) and internal urban dynamics (the hidden layers). It demonstrates reliability in predicting spatially distributed thermal anomalies across diverse landscapes. The LST predictions generated by the CA−ANN algorithm reveal a spatial distribution pattern that closely resembles the actual LST observed for the year 2024. The model effectively identifies a notable increase in temperature in both Batam City and the Bintan Islands, which can be attributed to ongoing development activities and the equitable distribution of these developments across the region. The predictive analysis (Figure 7) indicates that the lowest temperature recorded within the study area is below 22 °C, while the highest temperature exceeds 34 °C. These temperature extremes are derived from a set of supporting variables that include Rainfall, Vegetation Density, and the Dryness Index, which collectively enhance the accuracy and reliability of the model in capturing the complex interactions influencing LST dynamics.
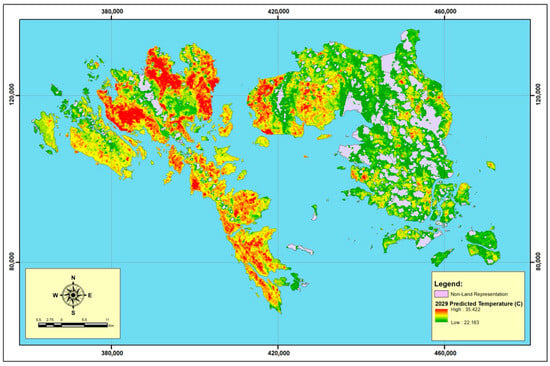
Figure 7.
Predicted LST for 2029 across the study area. The temperature ranges (22.163 to 35.422) °C (green to red), with higher values typically observed in urbanized or less vegetated regions. The prediction was generated using a neural network model based on historical LST data.
4. Discussion
4.1. Spatial Condition of Related Parameters
Significant dynamics in LST changes have been observed over the past decade in the regions of Batam City and Bintan Island. These changes have been analyzed using Landsat 8 satellite imagery, particularly Band 10, which enables the retrieval of surface temperature data with a high degree of accuracy due to its lower atmospheric absorption compared to Band 11. Radiometric correction processes—converting digital numbers (DN) into radiance and subsequently calculating brightness temperature—have been applied as critical steps in generating valid LST data. The LST data derived for the years 2014, 2019, and 2024 indicate a consistent upward trend in surface temperatures, largely influenced by land use changes, especially the reduction in vegetation cover and expansion of built-up infrastructure. This phenomenon illustrates the direct impact of anthropogenic activities on surface thermal conditions, which are considered key indicators in studies of local climate change and the urban heat island effect.
Changes in vegetation cover, reflected by the NDVI, have also been identified as playing a vital role in influencing surface temperature dynamics in the region. In 2014, high NDVI values indicated a well-distributed green cover across the study area. However, a significant decline in NDVI values was observed in 2019 and 2024, particularly in areas adjacent to residential developments, suggesting ongoing conversion of vegetated land into built environments. This decline has not only disrupted ecosystem balance but has also contributed to the intensification of LST due to the reduced capacity of vegetation to absorb heat and facilitate evapotranspiration. Conversely, remote areas located further from settlements have shown increased vegetation density, indicating a heterogeneous and complex pattern of land use change. These variations underscore the importance of continuous vegetation monitoring as a key variable in understanding the interactions between land cover and surface temperature.
Soil moisture conditions have been further assessed using the TVDI, which integrates NDVI and LST data to provide insights into regional drought levels. The results suggest that, while much of the study area remains in normal to slightly wet conditions, moderate to high dryness levels have been detected in densely populated zones. These conditions serve as important indicators of the combined effects of climate variability and human activity on water availability and ecosystem health. Moreover, TVDI-based drought data have been incorporated as an additional variable within surface temperature prediction models, thereby enhancing the precision and relevance of the research findings in the context of climate adaptation planning.
Rainfall, as a principal meteorological variable, has also been examined to better understand regional climate dynamics in Batam and Bintan. Rainfall data from 2024, obtained from the Hang Nadim and Raja Haji Fisabilillah meteorological stations, revealed relatively high annual totals, recorded at 2636.6 mm in Batam and 3968.5 mm in Bintan. The Inverse-Square Distance method has been applied to interpolate missing rainfall values, ensuring spatially accurate representations of precipitation distribution across the study area. Although high rainfall plays a crucial role in maintaining soil moisture and supporting vegetation, irregular distribution and seasonal fluctuations have been linked to heightened risks of localized drought and flooding. Therefore, a nuanced understanding of rainfall patterns is essential for disaster risk mitigation and sustainable water resource management.
The interplay of the analyzed climatic variables—LST, NDVI, TVDI, and rainfall—has provided a comprehensive depiction of the environmental and climatic conditions across the study region. The interconnections between surface warming, vegetation decline, drought severity, and fluctuating rainfall patterns highlight the complexity of local climate change, which is shaped by both natural and anthropogenic factors. In addition to presenting historical trends and current conditions, this study has developed a predictive model of surface temperature extending to the year 2029. This model offers a valuable foundation for sustainable development planning and climate adaptation strategies in the Riau Islands. Consequently, the findings of this research are of critical importance for supporting climate change mitigation efforts, ecosystem balance, and the well-being of communities in coastal and small island environments.
4.2. Land Surface Temperature Forecasting Pattern
Analysis of LST prediction using the CA−ANN algorithm in Batam City and Bintan Islands shows effective integration between the spatial–dynamic modeling and artificial intelligence. The model successfully reproduces the LST distribution pattern in 2024 with high accuracy, where the temperature range of (22.163 to 35.422) °C reflects micro-climatological variations due to environmental factors. The use of hidden layers based on rainfall, vegetation density, and drought index allows the algorithm to capture the complex interactions between land cover change and temperature dynamics, especially in the context of massive urbanization in both regions.
Spatial increases in LST were strongly correlated with the expansion of built-up areas for settlements and industry. The 23% reduction in vegetation area over the last decade has weakened the natural capacity of heat absorption, triggering the urban heat island phenomenon with (2−4) °C higher intensity than peri-urban areas. BMKG data on the +0.8 °C temperature anomaly in 2024 strengthens the model validation, while confirming the cumulative impact between anthropogenic activities and climatological variables, such as seasonal rainfall decline.
CA−ANN simulations reveal a feedback loop mechanism between the drought index and LST increase, where a (15 to 20)% decrease in soil moisture accelerates the release of stored heat from the terrestrial surface. The highest temperature distribution pattern is concentrated in the Batam Center industrial corridor and the Nongsa reclamation area, indicating the sensitivity of the model to local-scale land use change. Furthermore, the CA−ANN model demonstrates a strong sensitivity to the interaction between surface dryness, temperature, and rainfall variability. Areas with high dryness index values consistently coincide with zones of elevated LST, suggesting a reinforcing feedback mechanism between land surface desiccation and heat accumulation. The reduction in rainfall, particularly during the dry season, exacerbates this relationship by limiting soil moisture replenishment, thereby intensifying surface heating processes. This dynamic is especially evident in the southern and central parts of Batam, where historical rainfall decline correlates with persistent LST elevation above 33 °C. These findings confirm that LST is not merely a function of land cover but is heavily modulated by hydrological inputs and surface moisture availability. Hence, climate-responsive spatial policies should prioritize water retention strategies, such as green infiltration zones and urban wetlands, to counteract surface dryness and stabilize local microclimates. The integration of rainfall and dryness parameters into predictive urban planning frameworks is essential to minimize the long-term thermal burden in rapidly growing coastal cities like Batam and Bintan.
The implications of this study emphasize the urgency of spatial policies based on microclimate change mitigation, especially through green infrastructure optimization and sustainable development regulations. In addition to the spatial dynamics of temperature distribution, the CA−ANN model also revealed non-linear temporal behavior in LST increase, especially in regions undergoing rapid land cover transition. Sensitivity analysis within the model showed that even minor fluctuations in vegetation indices could cause localized LST increases, especially in densely urbanized subdistricts. This indicates a threshold effect, where vegetation loss beyond a certain point triggers disproportionately higher thermal responses, emphasizing the importance of maintaining green thresholds in urban planning. The CA−ANN model proved effective as a predictive tool for low-emission urban planning, although it requires periodic calibration against macro climate data and economic growth projections. Periodic calibration is necessary for the CA−ANN model because both climate conditions and economic factors are dynamic and constantly changing. If the model is not updated to reflect these changes, its predictions can become inaccurate or outdated. Climate variables, including temperature and precipitation, evolve due to natural and human-driven processes. Aligned with this, cities grow, populations increase, industries expand, and energy consumption patterns shift. These changes influence emissions and land use patterns, so to make realistic forecasts, the model must account for them. If the model relies on old climate data, it may underestimate or overestimate future environmental impacts. This finding suggests similar models could be applied in tropical islands with similar geography.
4.3. Implementation of Sustainable Development Goal
Monitoring the spatial distribution of LST and predicting its distribution patterns play crucial roles in improving the resilience of communities to the impacts of climate change. Spatial analysis of LST helps identify areas with high thermal anomalies, which are often indicators of vulnerability to hydrometeorological disasters, such as floods, droughts, or heat waves. This technique is aligned with Sustainable Development Goal (SDG) 13.1 [65], which emphasizes strengthening climate change adaptation and mitigation capacity. The region with the highest LST in the spatial distribution map serves as a natural early warning system for climate disasters. Increases in LST detected through the monitoring system can be the basis for setting an early alert status, enabling preventive interventions, such as preparing emergency water sources, or adjusting cropping patterns in the agricultural sector. This approach supports the implementation of SDG 13.1 through science-based disaster risk reduction. Integrating temperature distribution pattern prediction systems with spatial planning policies strengthens ecosystem adaptation. Spatially mapped LST data guides the planning of thermal protected areas [66], planting of urban cooling vegetation, and watershed management. Prediction models based on environmental parameters, such as drought index and land cover, ensure the match between scientific analysis and the practical needs of sustainable development. The synergy between LST monitoring technologies and the implementation of SDG 13.1 creates a comprehensive climate adaptation framework. The predictive capacity of spatial distribution models enables targeted resource allocation for greenhouse gas emission reduction programs and critical land rehabilitation [67]. Accurate monitoring results become the basis for climate policy evaluation, as well as a verification tool to achieve sustainable development targets at the local and global levels.
The integration of climate change policies (as stated in SDG 13.2 [65]) through the expansion of Green Open Space is a strategic solution to reduce extreme temperatures in urban areas, as seen in the CA−ANN study in Batam and Bintan. Predictive data showing a temperature range of (22.163 to 35.422) °C reinforces the urgency of converting open land into green roofs as part of climate adaptation policies. This step is in line with SDGs 13.1, which emphasizes the integration of climate action in national planning, particularly through spatial interventions based on scientific data. The high LST in urban areas (35.422 °C) indicates that urban architecture needs to act to mitigate the increase in temperature. The CA−ANN model reveals a direct correlation between reduced vegetation cover and micro-heating. CA−ANN spatial prediction is the basis for prioritizing the location of green spaces through heat cluster analysis in Batam and Bintan. Zones with temperatures above 32 °C require intensive intervention from the responsible stakeholder, while areas with temperatures ranging from 22 to 28 °C can be maintained as natural infiltration areas. This differential approach ensures that resource allocation is well-targeted, while meeting the urban Environmental Quality Index target, as per the Ministry of Environment and Forestry Regulation. The results of this research with the CA−ANN method provide a quantitative basis for the regulation of the Regional Spatial Plan, while also allowing the monitoring of the effectiveness of open green space policies through a thermal mapping system according to the needs of the community.
In monitoring the spatial distribution of LST and predicting the temperature patterns in 2029 using the CA−ANN method in Batam and Bintan, the implementation of SDG 13, especially target 13.3 [65], emphasizes the importance of education, awareness, and capacity building of institutions and individuals in mitigation, adaptation, impact reduction, and early warning related to climate change, where the results of this research can be an important foundation to strengthen public understanding of the dynamics of LST change, and its potential impacts in the future. The spatial distribution map of LST produced from this research can be used as an informative learning medium for the community. Through easy-to-understand data visualization, it can be used to directly see temperature changes in their area, thus increasing awareness of the urgency of climate change and the need for adaptation measures. Further, the prediction of temperature patterns until 2029 provides an overview of projections that can be used to plan more effective mitigation and adaptation measures at the local level. Improving the community’s capacity to deal with climate change depends on the availability of data and on the ability to understand and utilize it in daily decision-making. Therefore, the results of this research are expected to be integrated into education curricula, community training, and public awareness campaigns, as mandated in SDG 13.3. Thus, the community will be both the recipients of information and active actors in climate change mitigation and adaptation efforts. Several recent studies have demonstrated the effectiveness of CA–ANN and ANN-based approaches in predicting LST dynamics across urban and tropical contexts. In Lahore, Pakistan, a CA–ANN model was applied to simulate future LST patterns for the years 2030 and 2040, achieving an overall Kappa accuracy of 0.82 and 86.2% correctness. The model predicted a mean LST increase from 40.1 °C to 42.3 °C by 2040, illustrating the strong linkage between land use transformation and surface temperature rise [39]. In Vancouver, Canada, an ANN-based model was developed to predict hourly urban canopy temperature, demonstrating that urban heat island (UHI) effects can elevate cooling energy demand by 23% and reduce heating energy use by 29%, thereby reinforcing the relevance of thermal prediction models in energy planning [68]. Additionally, a study in Beijing examined the influence of urban green space (UGS) on LST, showing that both the composition (e.g., percentage of landscape, PLAND) and configuration (e.g., edge density) of green areas serve as localized “cold islands” that significantly lower surface temperatures [69]. Collectively, these technical comparisons underscore the value of CA–ANN integration—especially when augmented with green space and landscape metric analyses—in refining LST modeling frameworks in tropical and urbanized island settings such as Batam and Bintan.
5. Conclusions
Monitoring the spatial distribution of LST in 2015, 2019, and 2024 and predicting the distribution pattern in 2029 using the CA−ANN method revealed a consistent trend of temperature increase. Temporal analysis shows an average LST increase of 0.28 °C/year, with the highest temperature distribution pattern concentrated in urban areas, due to land conversion of vegetation into impermeable surfaces. The integration of hidden variables, such as drought, rainfall, and vegetation density (through NDVI transformation) in the CA−ANN model allows the identification of complex relationships between land cover change and temperature dynamics. The 2029 prediction results predict a temperature range of (22.163 to 35.422) °C, reflecting a significant expansion of the urban temperature area. The CA−ANN model showed reliable performance with a 72% coefficient of determination in the 2029 LST prediction, supported by validation using the Kappa coefficient and root mean square error (RMSE) analysis. This high accuracy was influenced by the ability of the model to project the impact of climatic (rainfall, drought) and anthropogenic (NDVI change) factors on heat distribution. This finding confirms that urbanization and decreased vegetation cover are the main drivers of LST increase, and confirms the need for integration of climate mitigation-based spatial policies to reduce the impact of temperature increase on urban areas.
Author Contributions
Conceptualization, W.A., W.J.P. and A.P.A.T.; methodology, W.A. and W.J.P.; software, A.P.A.T. and D.S.; validation, W.A., W.J.P. and A.P.A.T.; formal analysis, W.A.; investigation, W.A., L.d.S.C. and J.W.; data resources, W.J.P.; data curation and visualization, W.A. and E.G.; writing—original draft preparation, W.A., J.W. and L.d.S.C.; writing—review and editing, T.S., B.M., E.G. and A.S.A.; funding publication acquisition, T.S., B.M. and A.S.A. All authors have read and agreed to the published version of the manuscript.
Funding
This work was supported by the National Research Foundation of Korea (NRF), funded by the Korean government, Ministry of Science and ICT (MSIT) (RS-2024-00346177). This work was also financially supported by Korea Ministry of Land, Infrastructure and Transport (MOLIT) as “Innovative Talent Education Program for Smart City” and by BK21 FOUR Project.
Data Availability Statement
This research used Landsat 8 imagery published through USGS EarthExplorer. Rainfall data were obtained from the Riau Islands Meteorology, Climatology, and Geophysics Agency.
Acknowledgments
This research was supported by Politeknik Negeri Batam.
Conflicts of Interest
The authors declare no conflicts of interest.
Abbreviations
The following acronyms are used in this manuscript:
| CA−ANN | Cellular Automata–Artificial Neural Network |
| NDVI | Normalized Difference Vegetation Index |
| TVDI | Temperature Vegetation Dryness Index |
| LST | Land surface temperature |
| NIR | Near-Infrared |
References
- Johnson, J.E.; Welch, D.J.; van Hooidonk, R.; Tracey, D.; Chandrasa, G.; Molinari, B.; Triani, D.; Tania, C.; Susanto, H. Climate change implications for the Arafura and Timor Seas region: Assessing vulnerability of marine systems to inform management and conservation. Clim. Change 2023, 176, 88. [Google Scholar] [CrossRef]
- Tresnawati, R.; Wirasatriya, A.; Wibowo, A.; Susanto, R.D.; Widiaratih, R.; Setiawan, J.D.; Maro, J.F.; Dollu, E.A.; Fitria, S.; Kurang, R.Y. Long term of sea surface temperature prediction for Indonesia seas using multi time-series satellite data for upwelling dynamics projection. Remote Sens. Appl. 2024, 33, 101117. [Google Scholar] [CrossRef]
- Feng, M.; Zhang, N.; Liu, Q.; Wijffels, S. The Indonesian throughflow, its variability and centennial change. Geosci. Lett. 2018, 5, 3. [Google Scholar] [CrossRef]
- Zhu, S.; Ge, F.; Fan, Y.; Zhang, L.; Sielmann, F.; Fraedrich, K.; Zhi, X. Conspicuous temperature extremes over Southeast Asia: Seasonal variations under 1.5 C and 2 C global warming. Clim. Change 2020, 160, 343–360. [Google Scholar] [CrossRef]
- Jimenez, J.C.; Barichivich, J.; Mattar, C.; Takahashi, K.; Santamaría-Artigas, A.; Sobrino, J.A.; Malhi, Y. Spatio-temporal patterns of thermal anomalies and drought over tropical forests driven by recent extreme climatic anomalies. Philos. Trans. R. Soc. B Biol. Sci. 2018, 373, 20170300. [Google Scholar] [CrossRef] [PubMed]
- Lam, V.W.Y.; Allison, E.H.; Bell, J.D.; Blythe, J.; Cheung, W.W.L.; Frölicher, T.L.; Gasalla, M.A.; Sumaila, U.R. Climate change, tropical fisheries and prospects for sustainable development. Nat. Rev. Earth Environ. 2020, 1, 440–454. [Google Scholar] [CrossRef]
- Naylor, R.L.; Battisti, D.S.; Vimont, D.J.; Falcon, W.P.; Burke, M.B. Assessing Risks of Climate Variability and Climate Change for Indonesian Rice Agriculture. Proc. Natl. Acad. Sci. USA 2007, 104, 7752–7757. [Google Scholar] [CrossRef]
- Supari; Tangang, F.; Salimun, E.; Aldrian, E.; Sopaheluwakan, A.; Juneng, L. ENSO Modulation of Seasonal Rainfall and Extremes in Indonesia. Clim. Dyn. 2018, 51, 2559–2580. [Google Scholar] [CrossRef]
- Supari; Tangang, F.; Juneng, L.; Aldrian, E. Observed Changes in Extreme Temperature and Precipitation over Indonesia. Int. J. Climatol. 2017, 37, 1979–1997. [Google Scholar] [CrossRef]
- Thirukanthan, C.S.; Azra, M.N.; Lananan, F.; Sara’, G.; Grinfelde, I.; Rudovica, V.; Vincevica-Gaile, Z.; Burlakovs, J. The evolution of coral reef under changing climate: A scientometric review. Animals 2023, 13, 949. [Google Scholar] [CrossRef]
- Nurdjaman, S.; Nasution, M.I.; Johan, O.; Napitupulu, G.; Saleh, E. Impact of climate change on coral reefs degradation at West Lombok, Indonesia. J. Kelaut. Trop. 2023, 26, 451–463. [Google Scholar] [CrossRef]
- Kurniawan, T.A.; Pasaribu, B.; Kusworo, T.D.; Wibisono, Y.; Goh, H.H.; Zhang, D.; Ali, I.; Aziz, F.; Anouzla, A.; Sarangi, P.K.; et al. Building disaster resilience in thousand islands (Indonesia): Unlocking climate adaptation strategies to navigate sea level rise in coastal regions while safeguarding crop productivity and local biodiversity. ACS ES&T Water 2024, 4, 3213–3224. [Google Scholar] [CrossRef]
- Goltenboth, F.; Timotius, K.H.; Milan, P.; Margraf, J. Ecology of Insular Southeast Asia: The Indonesian Archipelago; Elsevier: Amsterdam, The Netherlands, 2006. [Google Scholar]
- Henri, H.; Retnaningdyah, C.; Rahardi, B.; Hakim, L. Exploring environmental vulnerabilities of small islands through a bibliometric analysis: Threats and adaptation strategies. In IOP Conference Series: Earth and Environmental Science; IOP Publishing: Bristol, UK, 2024; p. 012018. [Google Scholar]
- Fu, Y.; Zhu, Z.; Liu, L.; Zhan, W.; He, T.; Shen, H.; Zhao, J.; Liu, Y.; Zhang, H.; Liu, Z.; et al. Remote sensing time series analysis: A review of data and applications. J. Remote Sens. 2024, 4, 285. [Google Scholar] [CrossRef]
- Mao, Q.; Peng, J.; Wang, Y. Resolution enhancement of remotely sensed land surface temperature: Current status and perspectives. Remote Sens. 2021, 13, 1306. [Google Scholar] [CrossRef]
- Hutchinson, F.E.; Negara, S.D. Situating the Riau Island. In The Riau Islands Setting Sail; Iseas-Yusof Ishak Institute: Singapore, 2021; p. 6. [Google Scholar]
- Liana, M.; Rahmi, A.A.; Azmi, R.D.; Sarkity, D. Climate Change: Riau Archipelago Pre-service Teachers’ Perspective. BIO Web Conf. 2023, 70, 3012. [Google Scholar] [CrossRef]
- Hutasoit, I. Population growth in Batam Municipality as the frontier and outermost region at the border between Indonesia-Singapore-Malaysia. J. Biom. Dan. Kependud. 2023, 12, 165–176. [Google Scholar] [CrossRef]
- Ayuningtyas, D.; Hapsari, D.; Rachmalina, R.; Amir, V.; Rachmawati, R.; Kusuma, D. Geographic and Socioeconomic Disparity in Child Undernutrition across 514 Districts in Indonesia. Nutrients 2022, 14, 843. [Google Scholar] [CrossRef]
- Wibowo, A.; Satria, A. Fisher’s Adaptation Strategiesinsmall islandsto the Impactsof Climate Change (A case study in Pulau Panjang Village, Subi District, Natuna Regency, Riau Island). Sodality 2015, 3, 107–124. [Google Scholar]
- Tarumingkeng, R.C. Pengaruh Perubahan Iklim; RUDYCT e-PRESS: Bogor, Indonesia, 2024. [Google Scholar]
- Setiani, P. Bumi Aksara. Sains Perubahan Iklim; Bumi Aksara: Jakarta, Indonesia, 2020. [Google Scholar]
- Matheus, R. Skenario Pengelolaan Sumber Daya Lahan Kering: Menuju Pertanian Berkelanjutan; Deepublish: Java, Indonesia, 2020. [Google Scholar]
- Niraula, D. Impact-based risk forecasting and hydro-meteorological disasters. In Handbook on Climate Change and Disasters; Edward Elgar Publishing: Cheltenham, UK, 2022; pp. 525–536. [Google Scholar]
- Maulana, J.; Bioresita, F. Monitoring of Land Surface Temperature in Surabaya, Indonesia from 2013–2021 Using Landsat-8 Imagery and Google Earth Engine. In IOP Conference Series: Earth and Environmental Science; Institute of Physics: London, UK, 2023; Volume 1127. [Google Scholar]
- Jiang, Y.; Lin, W. A comparative analysis of retrieval algorithms of land surface temperature from Landsat-8 data: A case study of Shanghai, China. Int. J. Environ. Res. Public Health 2021, 18, 5659. [Google Scholar] [CrossRef]
- Choi, S.; Li, K.-S.; Seo, M.; Seong, N.-H.; Jin, D.; Jung, D.; Sim, S.; Jung, I.G.; Han, K.-S. Comparison of Land Surface temperature algorithm using Landsat-8 data for South Korea. Korean J. Remote Sens. 2021, 37, 153–160. [Google Scholar]
- Pontoh, R.S.; Yang, V.V.; Laura, G.Y.; Riantika, R.A.; Arisanti, R.; Winarni, S.; Gumelar, F. Assessing Sustainable Development in Community Welfare and Economic Resilience to Extreme Weather in Indonesia. Sustainability 2024, 16, 6693. [Google Scholar] [CrossRef]
- Sari, R.; Anurogo, W.; Lubis, M.Z. Pemetaan Sebaran Suhu Penggunaan Lahan Menggunakan Citra Landsat 8 Di Pulau Batam. J. Integr. 2018, 10, 32–39. [Google Scholar]
- Ali, S.A.; Parvin, F.; Ahmad, A. Retrieval of Land Surface Temperature from Landsat 8 OLI and TIRS: A Comparative Analysis between Radiative Transfer Equation-Based Method and Split-Window Algorithm. Remote Sens. Earth Syst. Sci. 2023, 6, 1–21. [Google Scholar] [CrossRef]
- Rhziel, F.Z.; Lahraoua, M.; Raissouni, N. Split-Window Algorithm for Land Surface Temperature Retrieval from Joint Polar-Orbiting Satellite System JPSS-2/NOAA-21. Environ. Sci. Proc. 2023, 29, 23. [Google Scholar]
- Sekertekin, A.; Bonafoni, S. Land Surface Temperature Retrieval from Landsat 5, 7, and 8 over Rural Areas: Assessment of Different Retrieval Algorithms and Emissivity Models and Toolbox Implementation. Remote Sens. 2020, 12, 294. [Google Scholar] [CrossRef]
- Balsamo, G.; Agusti-Panareda, A.; Albergel, C.; Arduini, G.; Beljaars, A.; Bidlot, J.; Blyth, E.; Bousserez, N.; Boussetta, S.; Brown, A.; et al. Satellite and in situ observations for advancing global Earth surface modelling: A review. Remote Sens. 2018, 10, 2038. [Google Scholar] [CrossRef]
- Li, F.; Yigitcanlar, T.; Nepal, M.; Thanh, K.N.; Dur, F. A Novel Urban Heat Vulnerability Analysis: Integrating Machine Learning and Remote Sensing for Enhanced Insights. Remote Sens. 2024, 16, 3032. [Google Scholar] [CrossRef]
- Baig, M.F.; Mustafa, M.R.U.; Baig, I.; Takaijudin, H.B.; Zeshan, M.T. Assessment of land use land cover changes and future predictions using CA-ANN simulation for Selangor, Malaysia. Water 2022, 14, 402. [Google Scholar] [CrossRef]
- Khan, D.; Khan, N. Modelling Urban Future: Integrating CA-ANN Model for Comprehensive Understanding of Land Use, Land Cover Changes, and Temperature Dynamics in Lucknow City, India. Geol. Ecol. Landsc. 2025, 1–26. [Google Scholar] [CrossRef]
- Wang, A.; Zhang, M.; Kafy, A.-A.; Tong, B.; Hao, D.; Feng, Y. Predicting the Impacts of Urban Land Change on LST and Carbon Storage Using InVEST, CA-ANN and WOA-LSTM Models in Guangzhou, China. Earth Sci. Inform. 2023, 16, 437–454. [Google Scholar] [CrossRef]
- Ahmad, M.N.; Zhengfeng, S.; Yaseen, A.; Khalid, M.N.; Javed, A. The Simulation and Prediction of Land Surface Temperature Based on SCP and CA-ANN Models Using Remote Sensing Data: A Case Study of Lahore. Photogramm. Eng. Remote Sens. 2022, 88, 783–790. [Google Scholar] [CrossRef]
- Bhattacharyya, S.; Sinha, S.; Kumari, M.; Mishra, V.N.; Ben Hasher, F.F.; Szostak, M.; Zhran, M. Spatio-Temporal Influences of Urban Land Cover Changes on Thermal-Based Environmental Criticality and Its Prediction Using CA-ANN Model over Kolkata (India). Remote Sens. 2025, 17, 1082. [Google Scholar] [CrossRef]
- Pramitha, A.F.; Andri, A.N.A.; Bahar, S. Analisis hubungan perubahan penggunaan lahan (land use) terhadap perubahan land surface temperature (LST) di Kota Tangerang Selatan tahun 2011–2021. Bul. Meteorol. Klimatol. Dan. Geofis. 2023, 3, 10–21. [Google Scholar]
- Cung, R.; Rosetia, A. Identifying Thermal Comfort of Tropical Architectural Concept Building: A Case Study of Expandable House. J. Archit. Res. Educ. 2023, 5, 61–72. [Google Scholar] [CrossRef]
- Marhan, S.P. Cendikia Mulia Mandiri. In Ilmu Lingkungan Dan Konservasi; Cendikia Mulia Mandiri: Batam, Indonesia, 2025. [Google Scholar]
- Rijal, S.; Saleh, M.B.; Jaya, I.N.S.; Tiryana, T. Deforestation Profile of Regency Level in Sumatra. Int. J. Sci. 2016, 25, 385–402. [Google Scholar]
- Hussain, K.; Mehmood, K.; Yujun, S.; Badshah, T.; Anees, S.A.; Shahzad, F.; Nooruddin; Ali, J.; Bilal, M. Analysing LULC transformations using remote sensing data: Insights from a multilayer perceptron neural network approach. Ann. GIS 2024, 1–28. [Google Scholar] [CrossRef]
- Lousada, S.; Gómez, J.M.N.; Jankauskienė, D.; Pukite, V. Land-Use Changes in an Island Urban Setting: A Retrospective Study of Funchal, Madeira (1990–2018). J. Sustain. Res. 2025, 7, e250029. [Google Scholar]
- Doan, Q.-V.; Kusaka, H.; Ho, Q.-B. Impact of Future Urbanization on Temperature and Thermal Comfort Index in a Developing Tropical City: Ho Chi Minh City. Urban Clim. 2016, 17, 20–31. [Google Scholar] [CrossRef]
- Manalo, J.A.; Matsumoto, J.; Takahashi, H.G.; Villafuerte, M.Q.; Olaguera, L.M.P.; Ren, G.; Cinco, T.A. The effect of urbanization on temperature indices in the Philippines. Int. J. Climatol. 2022, 42, 850–867. [Google Scholar] [CrossRef]
- Pimonsree, S.; Limsakul, A.; Kammuang, A.; Kachenchart, B.; Kamlangkla, C. Urbanization-Induced Changes in Extreme Climate Indices in Thailand during 1970–2019. Atmos. Res. 2022, 265, 105882. [Google Scholar] [CrossRef]
- Sayed, E.T.; Wilberforce, T.; Elsaid, K.; Rabaia, M.K.H.; Abdelkareem, M.A.; Chae, K.-J.; Olabi, A. A critical review on environmental impacts of renewable energy systems and mitigation strategies: Wind, hydro, biomass and geothermal. Sci. Total Environ. 2021, 766, 144505. [Google Scholar] [CrossRef]
- Lim, C.H.; Jung, S.H.; Kim, A.R.; Kim, N.S.; Lee, C.S. Monitoring for Changes in Spring Phenology at Both Temporal and Spatial Scales Based on MODIS LST Data in South Korea. Remote Sens. 2020, 12, 3282. [Google Scholar] [CrossRef]
- Tian, L.; Tao, Y.; Li, M.; Qian, C.; Li, T.; Wu, Y.; Ren, F. Prediction of land surface temperature considering future land use change effects under climate change scenarios in Nanjing City, China. Remote Sens. 2023, 15, 2914. [Google Scholar] [CrossRef]
- Hemati, M.; Hasanlou, M.; Mahdianpari, M.; Mohammadimanesh, F. A Systematic Review of Landsat Data for Change Detection Applications: 50 Years of Monitoring the Earth. Remote Sens. 2021, 13, 2869. [Google Scholar] [CrossRef]
- Chong, K. Spatiotemporal Influence Analysis Through Traffic Speed Pattern Analysis Using Spatial Classification. Appl. Sci. 2024, 15, 196. [Google Scholar] [CrossRef]
- Amrulloh, I.; Fikriyah, V.N. Time series analysis of landsat data for urban heat island monitoring in Semarang City. In IOP Conference Series: Earth and Environmental Science; IOP Publishing: Bristol, UK, 2024; p. 12086. [Google Scholar]
- Lee, Y.; Lee, K.; Park, S. Analysis of Hotspot Changes in Daegu Metropolitan City in Summer Using Landsat 8 Satellite Images. Korean J. Remote Sens. 2024, 40, 1379–1389. [Google Scholar] [CrossRef]
- Ouma, Y.O.; Nkwae, B.; Odirile, P.; Moalafhi, D.B.; Anderson, G.; Parida, B.; Qi, J. Land-use change prediction in dam catchment using logistic regression-CA, ANN-CA and random forest regression and implications for sustainable land–water nexus. Sustainability 2024, 16, 1699. [Google Scholar] [CrossRef]
- de Moraes, O.L.L. An Impact-Based Forecast System Developed for Hydrometeorological Hazards. Int. J. Disaster Risk Reduct. 2023, 93, 103803. [Google Scholar] [CrossRef]
- Pande, C.B.; Egbueri, J.C.; Costache, R.; Sidek, L.M.; Wang, Q.; Alshehri, F.; Din, N.M.; Gautam, V.K.; Pal, S.C. Predictive modeling of land surface temperature (LST) based on Landsat-8 satellite data and machine learning models for sustainable development. J. Clean. Prod. 2024, 444, 141035. [Google Scholar] [CrossRef]
- Anurogo, W.; Sidabutar, R.T.C.; Lubis, M.Z.; Panuntun, H.; Nugroho, C.B.; Sufwandika, M. Estimation of land surface temperature-assessment with remote sensing data for urban heat island in Batam Municipality. GeoEco 2022, 9, 1–11. [Google Scholar] [CrossRef]
- Zhao, H.; Li, Y.; Chen, X.; Wang, H.; Yao, N.; Liu, F. Monitoring Monthly Soil Moisture Conditions in China with Temperature Vegetation Dryness Indexes Based on an Enhanced Vegetation Index and Normalized Difference Vegetation Index. Theor. Appl. Climatol. 2021, 143, 159–176. [Google Scholar] [CrossRef]
- Li, Y.; Wang, X.; Wang, F.; Feng, K.; Li, H.; Han, Y.; Chen, S. Temporal and Spatial Characteristics of Agricultural Drought Based on the TVDI in Henan Province, China. Water 2024, 16, 1010. [Google Scholar] [CrossRef]
- Hamidi, M.R.; Mukhaiyar, U.; Rezeki, E.S.; Dianti, N.R.; Rohat, A.M. The Linear Combination of ARIMA Models in Constructing the Areal Rainfall Using Thiessen Polygon Weighted Method. In Proceedings of the ITM Web of Conferences, Nanjing, China, 29–30 June 2025; Volume 75, p. 4004. [Google Scholar]
- Wang, R.; Gentine, P.; Yin, J.; Chen, L.; Chen, J.; Li, L. Long-Term Relative Decline in Evapotranspiration with Increasing Runoff on Fractional Land Surfaces. Hydrol. Earth Syst. Sci. 2021, 25, 3805–3818. [Google Scholar] [CrossRef]
- Arora, N.K.; Mishra, I. Sustainable Development Goal 13: Recent Progress and Challenges to Climate Action. Environ. Sustain. 2023, 6, 297–301. [Google Scholar] [CrossRef]
- Zhang, T.; Lin, Z.; Wang, L.; Zhang, W.; Zhang, Y.; Hu, Y. The Heterogeneous Effects of Microscale-Built Environments on Land Surface Temperature Based on Machine Learning and Street View Images. Atmosphere 2024, 15, 549. [Google Scholar] [CrossRef]
- Cutler, J.; Li, B.; Alhnaity, B.; Partridge, T.; Thompson, M.; Meng, Q. AI for sustainable land management and greenhouse gas emission forecasting: Advancing climate action. In Proceedings of the 2025 4th Asia Conference on Algorithms, Computing and Machine Learning (CACML), Guangzhou, China, 28–30 March 2025. [Google Scholar]
- Tariku, F.; Gharib Mombeni, A. ANN-Based Method for Urban Canopy Temperature Prediction and Building Energy Simulation with Urban Heat Island Effect in Consideration. Energies 2023, 16, 5335. [Google Scholar] [CrossRef]
- Pan, T.; He, S.; Liu, Z.; Jiang, L.; Zhao, Q.; Hamdi, R. Analyzing Changes in Urban Green Spaces and Their Effect on Land Temperature from the Perspective of Surface Radiation Energy Balance in Rizhao City, the Central Coast of China. Remote Sens. 2023, 15, 4785. [Google Scholar] [CrossRef]


Disclaimer/Publisher’s Note: The statements, opinions and data contained in all publications are solely those of the individual author(s) and contributor(s) and not of MDPI and/or the editor(s). MDPI and/or the editor(s) disclaim responsibility for any injury to people or property resulting from any ideas, methods, instructions or products referred to in the content. |
© 2025 by the authors. Licensee MDPI, Basel, Switzerland. This article is an open access article distributed under the terms and conditions of the Creative Commons Attribution (CC BY) license (https://creativecommons.org/licenses/by/4.0/).