Article

Impacts of Spatial Expansion of Urban and Rural Construction on Typhoon-Directed Economic Losses: Should Land Use Data Be Included in the Assessment?

by
Siyi Zhou
1,2,†,
Zikai Zhao
1,2,
Jiayue Hu
3,
Fengbao Liu
4,*,† and
Kunyuan Zheng
5
1
School of Automation, Nanjing University of Information Science and Technology, Nanjing 210044, China
2
Department of Computer Science, University of Reading, Reading RG6 6DH, UK
3
Department of Economic, University of Reading, Reading RG6 6DH, UK
4
School of Art, Nanjing University of Information Science and Technology, Nanjing 210044, China
5
Computer and Information Engineering College, Tianjin Normal University, Tianjin 300387, China
*
Author to whom correspondence should be addressed.
These authors contributed equally to this work.
Land 2025, 14(5), 924; https://doi.org/10.3390/land14050924
Submission received: 27 February 2025 / Revised: 18 April 2025 / Accepted: 21 April 2025 / Published: 24 April 2025

Abstract

:
With the intensification of global climate change, the frequent occurrence of typhoon disaster events has become a great challenge to the sustainable development of cities around the world; thus, it is of great significance to carry out the assessment of typhoon-directed economic losses. Typhoon disaster loss assessment faces key challenges, including complex regional environments, scarce historical data, difficulties in multi-source heterogeneous data fusion, and challenges in quantifying assessment uncertainties. Meanwhile, existing studies often overlook the complex relationship between the spatial expansion of urban and rural construction (SEURC) and typhoon disaster losses, particularly their differential manifestations across different regions and disaster intensities. To address these issues, this study proposes CLPFT (Comprehensive Uncertainty Assessment Framework for Typhoon), an innovative assessment framework integrating prototype learning and uncertainty quantification through a UProtoMLP neural network. Results demonstrate three key findings: (1) By introducing prototype learning, a meta-learning approach, to guide model updates, we achieved precise assessments with small training samples, attaining an MAE of 1.02, representing 58.5–76.1% error reduction compared to conventional machine learning algorithms. This reveals that implicitly classifying typhoon disaster loss types through prototype learning can significantly improve assessment accuracy in data-scarce scenarios. (2) By designing a dual-path uncertainty quantification mechanism, we realized high-reliability risk assessment, with 95.45% of actual loss values falling within predicted confidence intervals (theoretical expectation: 95%). This demonstrates that the dual-path uncertainty quantification mechanism can provide statistically credible risk boundaries for disaster prevention decisions, significantly enhancing the practical utility of assessment results. (3) Further investigation through controlling dynamic assessment factors revealed significant regional heterogeneity in the relationship between SEURC and directed economic losses. Furthermore, the study found that when typhoon intensity reaches a critical value, the relationship shifts from negative to positive correlation. This indicates that typhoon disaster loss assessment should consider the interaction between urban resilience and typhoon intensity, providing important implications for disaster prevention and mitigation decisions. This paper provides a more comprehensive and accurate assessment method for evaluating typhoon disaster-directed economic losses and offers a scientific reference for determining the influencing factors of typhoon-directed economic loss assessments.

1. Introduction

Typhoons are powerful natural disasters that can cause enormous economic losses in a short period. China, with its extensive coastline, is one of the countries most frequently affected by extreme weather events [1]. According to meteorological department statistics, natural disasters caused approximately 626,000 deaths and affected over 2 billion people in China during the decade from 1992 to 2001 [2]. Among various meteorological disasters, typhoons cause the most severe losses [3].
In recent years, global climate change and human-induced land use changes have made ecosystems more vulnerable to meteorological disasters [4]. The frequent occurrence and severe impact of typhoon disasters, coupled with rapid SEURC, have intensified the conflicts between human activities, land use, and disasters. In the face of severe disaster situations, building resilient cities has become a global urban strategy. Additionally, the phenomenon of climate gentrification has emerged as a critical issue [5], where socio-economically disadvantaged populations are disproportionately displaced from resilient urban areas, further exacerbating the socio-economic vulnerabilities in typhoon-prone regions [6]. This situation has prompted both developing and developed countries to pay attention to natural disaster assessment issues associated with land use changes and the spatial expansion of urban and rural construction (SEURC) [7]. Accurate assessment of directed economic losses caused by typhoons and revealing their relationship with SEURC are crucial for disaster risk management and resilient spatial planning. However, due to numerous influencing factors and complex non-linear relationships among them, typhoon economic loss assessment remains a challenging topic. Against the backdrop of intensifying global climate change and China’s rapid urbanization, frequent typhoon disasters pose serious challenges to China’s territorial security and development. Consequently, the relationship between typhoon economic losses and SEURC has become a hot topic in environmental science, urban planning, geography, and disaster management fields. Typhoon economic loss assessment methods can be broadly classified into five categories: physics-based assessment methods, statistics-based assessment methods, expert experience-based methods, economic model methods, and modern artificial intelligence methods. (1) Physics-based methods simulate loss processes by constructing typhoon hazard chains and vulnerability curves, such as the HAZUS model [8] and Florida Public Hurricane Loss Model (FPHLM) [9]. While these methods have good physical interpretability, they often require extensive detailed building information and hazard parameters, limiting their practical application. (2) Statistics-based methods mainly employ multivariate regression analysis, Generalized Linear Models (GLM), and other techniques to establish relationships between losses and impact factors. For example, Huang et al. [10] proposed a study that developed a typhoon disaster loss assessment model for Taiwan using exponential regression analysis, analyzing meteorological and disaster indicator data from 1965–2004, and validated with typhoon cases from 2005–2013, which demonstrated relatively accurate assessment of typhoon disaster losses within certain parameters. While these methods are computationally simple, they struggle to capture complex non-linear relationships. (3) Expert experience-based methods rely on expert knowledge bases and scoring systems, which are highly subjective and struggle to adapt to rapidly changing urban environments. (4) Economic model methods include input-output models [11], Computable General Equilibrium (CGE) models [12,13], and EC-IO joint models [3]. While these methods excel at evaluating in direct economic losses and industrial linkage impacts, they often involve idealized model assumptions and have high data requirements. (5) In recent years, with the rapid development of artificial intelligence technology, data-driven machine learning methods have shown enormous potential in typhoon loss assessment. Early research mainly employed traditional machine learning algorithms such as Support Vector Machine (SVM), Random Forest (RF), and simple BP (Back Propagation) neural networks. For instance, Lou et al. (2012) [14] used PCA analysis to process disaster assessment factors, environmental factors, and disaster-affected body characteristics, using the extracted principal components as inputs for a BP neural network model to evaluate tropical cyclone economic losses. This method not only considered multiple influencing factors but also effectively handled non-linear relationships, showing good assessment results through practical validation.
Yang et al. [15] utilized tree-based machine learning models (Random Forest, XGBoost, LightGBM, and CatBoost), combining flood sensitivity, marine meteorological, and vulnerability data to predict directed economic losses from tropical cyclones at the county level in Guangdong Province. They verified the advantages of flood sensitivity in the model and conducted relevant factor analysis and loss prediction for Typhoon “Mangkhut”. With the maturation of deep learning technology, neural-network-based methods have begun to emerge. Kim et al. [16] developed a typhoon damage prediction model using Deep Neural Network (DNN) algorithms based on damage data from Typhoon “Lusha” through adjustment and learning of network structure and hyperparameters, and comparison with multivariate regression models. The results showed that the DNN model demonstrated lower Mean Absolute Error (MAE) and Root Mean Square Error (RMSE) in predicting building losses caused by typhoons, exhibiting higher reliability and adaptability, thus providing effective assistance for reducing typhoon damage and related risk management. Yu et al. [17] conducted a storm surge risk assessment in China’s Shuangyue Bay undeveloped coastal areas based on deep learning and GIS technology, using an improved Transformer model to extract building outlines combined with drone measurements for building heights. This effectively identified high-risk areas and provided quantitative economic loss assessments and zoning maps, helping governments formulate disaster prevention measures and optimize land use planning. These advanced machine learning and deep learning models, with their powerful non-linear fitting capabilities and automatic feature extraction abilities, can better mine complex patterns contained in multi-source heterogeneous data, opening new paths for improving the accuracy of typhoon economic loss assessment. However, most existing studies focus on point predictions of typhoon disaster losses, while in practical applications, the uncertainty of prediction results is equally important [18], as this uncertainty guides emergency response decisions. Meanwhile, data scarcity severely limits the development of artificial intelligence technology in the field of typhoon damage assessment [19]. Typhoons are natural disasters with a relatively low frequency of occurrence. Compared to other common meteorological phenomena such as rainfall and temperature changes, historical observational records of typhoon events are quite limited. Taking China as an example, the average number of typhoons making landfall each year is about 7–8, and typhoons with complete disaster statistics data are even rarer. This data scarcity results in small sample sizes for typhoon disaster datasets, making them typical small-sample datasets [20]. The lack of training samples poses a significant challenge to traditional data-driven models, as these models struggle to learn sufficiently generalizable prediction patterns from limited data. Therefore, how to achieve an accurate assessment of typhoon disasters based on small-sample datasets is a key issue that needs to be urgently addressed in this research. On one hand, assessment models specifically designed for small-sample data should be constructed. On the other hand, as many relevant data as possible should be utilized as predictive factors to enhance the model’s assessment capabilities. For loss assessment of natural disasters like typhoons, it is natural to consider incorporating factors such as the destructive power of the typhoon event itself, the environmental vulnerability of the affected areas, and economic vulnerability into the assessment model. This approach aligns with intuitive thinking, and some studies have confirmed this [11].
As global urbanization progresses, the SEURC has become increasingly intertwined with the frequent occurrence of natural disasters. On the one hand, this is particularly evident in high-risk areas such as coastal regions, where the SEURC often directly or indirectly influences the consequences of natural disasters, including typhoons [21]. On the other hand, climate change and natural disasters have a significant impact on land use in China [22]; natural disasters, such as floods, droughts, and typhoons, can lead to the destruction of agricultural land, changes in soil quality, and disruptions to irrigation systems. For example, typhoons may cause severe flooding, which can erode topsoil, contaminate farmland with saltwater, and damage agricultural infrastructure. These impacts can reduce the productivity of agricultural land and even render some areas unsuitable for farming. Regarding the mechanism of how SEURC affects natural disasters, several key manifestations include environmental degradation caused by SEURC, resource and environmental pressures exceeding carrying capacity, infrastructure vulnerability due to the absence of resilience planning, and high exposure of population and economic assets due to concentrated population density and economic activity [23,24,25,26,27]. Furthermore, research indicates that the close relationship between SEURC and natural disasters is manifested not only in the former’s impact on the latter but also in the latter’s reverse impact on the former. For example, natural disasters can restrict the direction and cost of SEURC [28,29]. However, empirical evidence suggests that the impact of climate change and natural disasters on urban land use patterns is negligible [30]. It should be noted that the strength of the correlation between these two factors varies across different regions.
In summary, existing research provides a solid foundation for this study, but several challenges remain: (1) Due to the limited historical statistical data on typhoon disasters, the scarcity of available training samples, and the complexity of regional environments, current research faces significant challenges in constructing small-sample multi-source datasets. Additionally, existing studies have not been able to develop deep learning models that can accurately evaluate small-sample datasets. (2) Furthermore, existing evaluation methods generally lack the capability to quantify uncertainty. In practical applications, they only provide a single evaluation value without offering a confidence estimate, which significantly limits the practical application value of the evaluation results in disaster prevention and mitigation decision-making. (3) Although previous studies suggest that SEURC can affect natural disasters, few studies have incorporated factors related to SEURC into assessment models. Existing studies have primarily relied on comparative analysis methods and comprehensive inductive approaches to reveal their correlation [28], focusing on phenomenological description and empirical judgment while lacking exploration of quantitative characterization of their correlation. Therefore, existing research provides insufficient explanations when addressing questions such as why factors related to SEURC have not been incorporated into disaster loss assessment models, how to quantitatively characterize regional differences in their correlation, and whether their relationship is limited to simple linear relationships or completely positive correlations. Therefore, the paper raises the research questions as follows: 1. How can we construct an assessment method for typhoon-directed economic losses that can handle small-sample datasets and quantify uncertainty? 2. How can we reveal the correlation between urban and rural construction spatial expansion and typhoon-directed economic losses through quantitative analysis, and how does this correlation vary across different regions and typhoon intensities? 3. Why has existing research not incorporated land use data into provincial-level typhoon disaster assessment models? Based on this, this study proposes a research hypothesis regarding the correlation between SEURC and typhoon disasters, suggesting that, for provincial panel data, land use data should be incorporated into typhoon disaster assessment models.
To address the challenges of assessing directed economic losses caused by typhoons, as discussed above, and to provide a reasonable explanation for why land use data is rarely incorporated as a factor in typhoon-directed economic loss assessments at the provincial scale, this paper first establishes an assessment framework for Typhoon and proposes a research hypothesis that, in the provincial panel, land use data should be incorporated into the typhoon disaster assessment system. Secondly, the dataset collected and compiled for this study further presents the experimental results based on these data, specifically analyzing the impact of land use factors in the assessment of directed economic losses caused by typhoons. Additionally, it delves deeper into the complex relationship between land use data and typhoon-directed economic losses. Through experiments comparing the results of loss assessments with and without the inclusion of land use data, an empirical analysis is conducted based on the outcomes, leading to the final conclusions.

2. Research Methodology and Data Sources

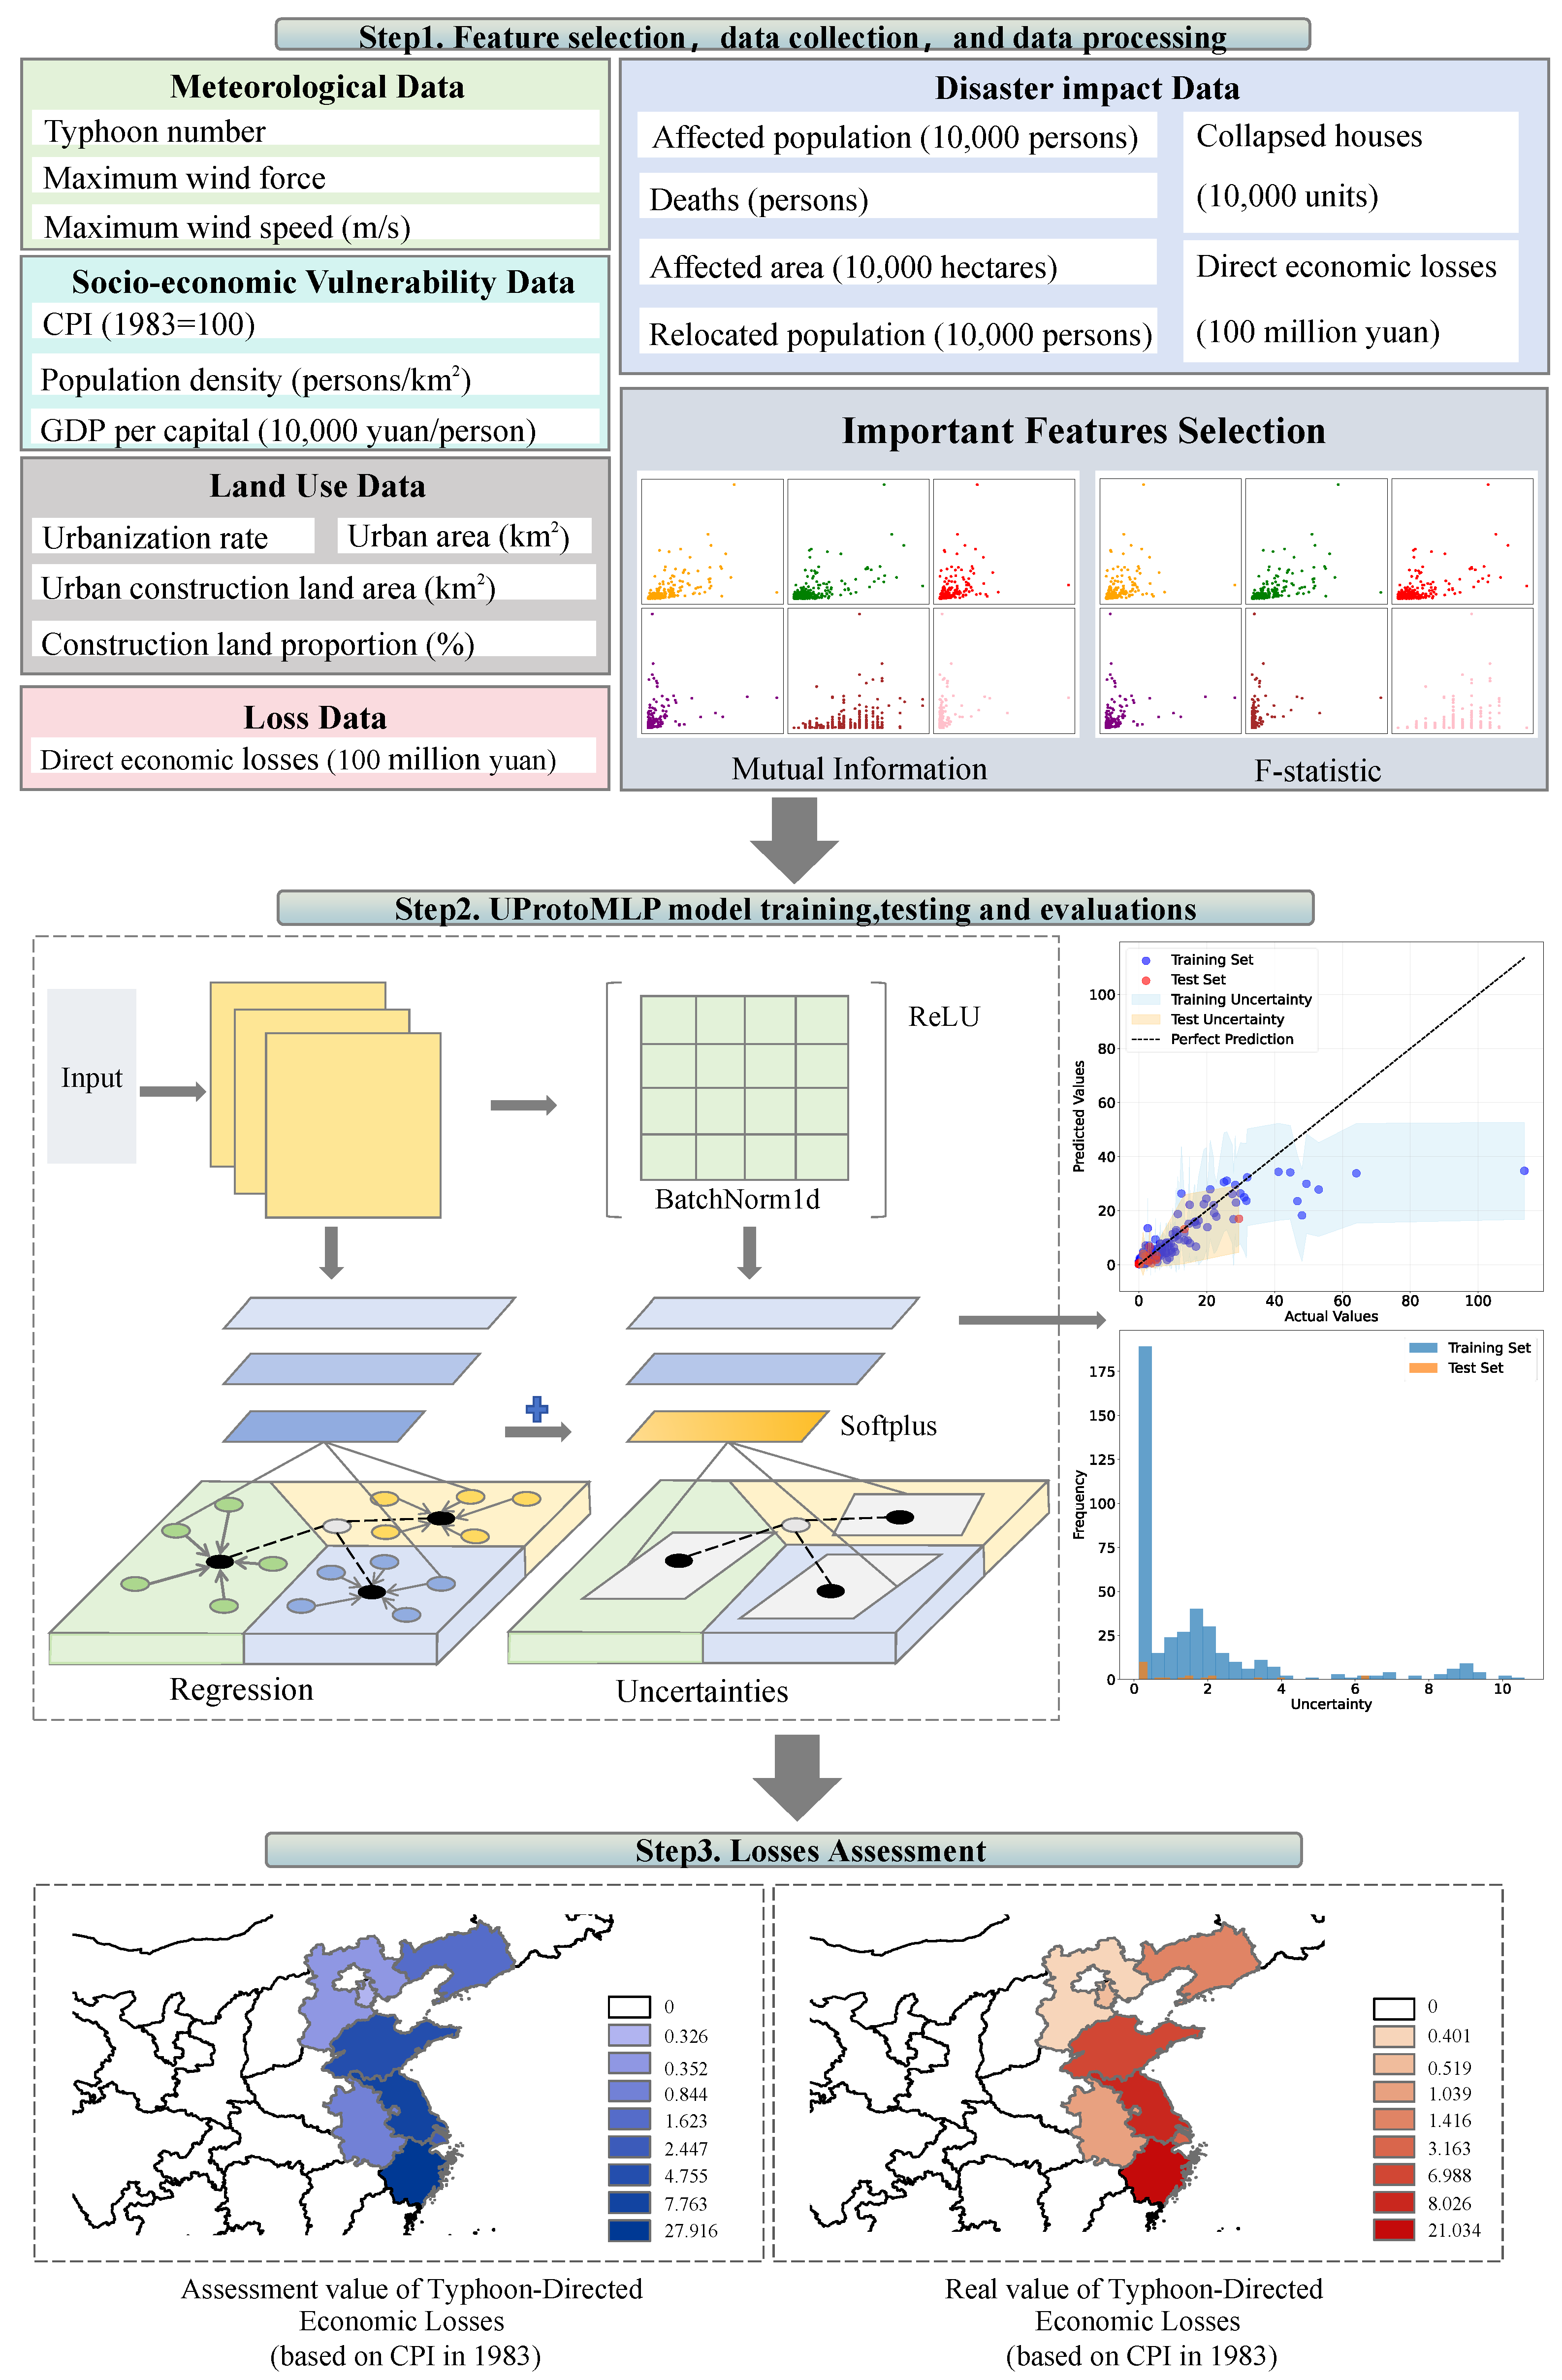
2.1. Reserch Framework

This paper proposes a framework for assessing directed economic losses from typhoons: CLPFT. As shown in Figure 1:
Step 1: Similar to other loss assessment frameworks, it collects data that may influence assessment results and performs classification processing. The paper assumes that land use data will have an impact on typhoon damage assessment and screening evaluation on the data. The collected data encompass four major categories: meteorological data, disaster impact data, socio-economic vulnerability data, and land use data. Using the Pearson correlation coefficient, Mutual Information, and F-statistic, the relationships between all assessment factors and the assessment outcome—direct economic losses—were analyzed. Seven features from the dataset were selected as fixed assessment factors, including meteorological data (‘maximum wind force’, ‘maximum wind speed’) representing the typhoon event characteristics, and disaster impact data: ‘affected population (10,000 persons)’, ‘relocated population (10,000 persons)’, ‘deaths (persons)’, ‘affected area (10,000 hectares)’, and ‘collapsed houses (10,000 units)’. It is worth mentioning that to explore the complex impact relationship between land use data and typhoon disasters, this study introduced variable predictors, selecting “proportion of construction land use” as a variable assessment factor. Analysis and discussion were conducted on the model assessment changes caused by this factor through comparative experiments.
Step 2: The UProtoMLP model within CLPFT performs the loss assessment task. Direct economic loss serves as the model’s primary output while providing confidence levels and intervals based on dual uncertainties from both data and the model. To accurately assess typhoon-directed economic losses using selected assessment factors and provide confidence levels for assessing assessment accuracy, this paper proposes a prototype learning-based (Section 2.2.1) deep learning model called UProtoMLP. The model consists of an input layer, feature extractor, prototype learning layer, regression head, and uncertainty estimation head. Specifically, original typhoon-related feature inputs undergo feature extraction through multiple fully connected networks, then compare with learned data distribution prototypes. Finally, the regression head outputs the assessments of typhoon-directed economic losses. Concurrently, the uncertainty estimation head offers reliability evaluations for these assessments by considering both data-related and model-related uncertainties. His dual-path structure not only accurately assesses economic losses but also provides assessment confidence levels, offering comprehensive information support for subsequent decision-making.
Step 3: Finally, the trained model was used to assess and test selected typhoon events, with test results demonstrating the model’s ultimate performance.

2.2. Research Methodology

2.2.1. Prototype-Based Learning

Prototype learning is a machine learning method that represents the entire data distribution by learning typical samples (prototypes) from the dataset [31]. For historical typhoons, they can be easily classified according to their inherent attributes [32], such as by wind force levels or by the direct economic losses they caused. In this paper, we choose to use unsupervised clustering to classify all typhoons in the dataset based on different levels of losses they caused. Through the elbow method [33] and K-means clustering analysis [34], four different typhoon categories were identified, which will serve as prior knowledge for UprotoMLP. Different categories of typhoon events indicate different types of direct economic losses. Therefore, this paper introduces prototype learning into the model to perform implicit classification within the model for assessing typhoon-directed economic losses. Based on prior knowledge from the preliminary analysis, we set the number of prototypes to 4 [35]. Specifically, the regression head of the model provides an initial assessment based on the typhoon’s feature representation, followed by calculating the distance between the extracted features and the stored prototypes.
d ( f ( x ) , p k ) = | | f ( x ) p k | | 2
In the formula, · 2 denotes the Euclidean distance, and f ( x ) is the normalized feature representation. p k represents the kth stored prototype among the 4 prototypes set based on prior knowledge from the preliminary analysis and is used to calculate the distance with the extracted feature f ( x ) for the implicit classification within the model in assessing typhoon-directed economic losses.
This distance calculation occurs in the feature space, rather than directly comparing the assessed values with the prototypes. The final assessment is the average of the regression head output and the output based on prototype distances:
y p = α · d ( f ( x ) , P )
In the formula, α is a learnable scaling factor, d(x) is the distance metric function, f(x) is the feature representation of the input sample, and P is the set of prototypes. The final fusion output:
y f = y r + 1 K k = 1 K y p , k 2
In the formula, y r is the output of the regression head, y p , k is the output of the kth prototype contribution, k is the total number of prototypes.
After each training batch, the model updates the prototype with the features of the current batch and the corresponding labels (actual economic loss values):
p k = 1 | C k | x i C k f ( x i )
In the formula, C k is the set of samples of the kth class, f ( x i ) is the feature representation of the samples after the feature extractor, | C k | is the number of samples of the kth class.
This updating process is based on the distribution of label values, ensuring that the prototypes can represent different categories of economic loss levels. The typhoon dataset is inherently a few-shot dataset, which means that deep learning models must represent complex data patterns with extremely limited data. The introduction of prototype learning brings prior knowledge to the model—typhoon event loss classification. Prototype learning bridges the assessment error through the distance between prototype centers and assessed results. According to the ablation study results, this significantly improves the model’s assessment accuracy on the few-shot dataset by approximately 20%.

2.2.2. Uncertainty Assessment

In typhoon disaster management, accurate assessment of direct economic losses is crucial for resource allocation and emergency response. However, due to the complexity and interactions of influencing factors, such assessments inherently involve uncertainties. To provide more comprehensive decision support, a single point estimate is insufficient. Simply put, assessment models should provide both direct economic loss forecasts and corresponding confidence assessments of these assessments, offering decision-makers richer information to develop more robust strategies for different scenarios. For instance, when assessed losses are both 5, decision outcomes should clearly differ between cases with confidence levels above 99% versus below 68%. Therefore, this paper categorizes uncertainty into epistemic uncertainty and aleatoric uncertainty based on real-world conditions and utilizes uncertainty assessment to provide confidence levels for point assessments.
Epistemic uncertainty reflects the model’s assessment limitations for unusual typhoon types or special cases when training is insufficient. For instance, when the model encounters super typhoons that are rare in historical data, it may exhibit high epistemic uncertainty. While this uncertainty can be reduced by increasing the diversity and quantity of training data, it is often difficult to eliminate completely in practical applications. Aleatoric uncertainty, on the other hand, reflects the inherent randomness and unpredictability in typhoon loss assessment. Even with a perfect assessment model, there will still be a certain degree of uncertainty due to inherent variability in economic loss assessment, measurement errors in data collection, dynamic changes in the socio-economic conditions of typhoon-affected areas, and regional environmental complexity. This type of uncertainty is an inherent characteristic of the data itself and cannot be completely eliminated simply by increasing data volume or improving the model. For epistemic uncertainty: The model is set to training mode with dropout layers remaining active, performing multiple forward passes on the same input data and collecting the results. The standard deviation of these multiple assessments represents the epistemic uncertainty. Using Monte Carlo Dropout effectively approximates posterior inference in Bayesian neural networks through sampling [36], where each forward pass with dropout is equivalent to sampling a set of weights from an approximate posterior weight distribution. This method simulates parameter uncertainty in Bayesian inference:
u e = 1 T t = 1 T ( y ^ t y ¯ ) 2
In the formula, T is the number of Monte Carlo samples, y ^ t is the assessed value of the tth sampling, y ¯ is the mean of all sampled assessed values.
For aleatoric uncertainty: The uncertainty head of the model predicts an uncertainty value for each input sample. During multiple Monte Carlo sampling iterations, an uncertainty prediction is obtained each time. Finally, the average of these multiple uncertainty predictions is considered as the aleatoric uncertainty. In this process, the model directly learns to predict the inherent noise level of the data, and multiple sampling is primarily used to obtain stable estimates of aleatoric uncertainty [37]:
u a = 1 T t = 1 T s t
s t represents the uncertainty prediction obtained by the uncertainty head of the model for each input sample during the tth Monte Carlo sampling iteration. Meanwhile, to quantify the reliability of assessment results, this paper constructs confidence intervals based on uncertainty estimation. Assuming the assessment errors follow a Gaussian distribution, the formula for calculating the 95% confidence interval is:
C I 95 % = [ y ^ 1.96 u t , y ^ + 1.96 u t ]
in the formula, u t is the total uncertainty, including both epistemic and aleatoric uncertainties.
The coefficient 1.96 corresponds to the 97.5th percentile of the standard normal distribution, meaning that approximately 95% of the true values should fall within this interval. This confidence interval provides a practical metric for assessment reliability: a narrower interval indicates more reliable assessment results, while a wider interval suggests greater uncertainty in the assessments. For a constructed dataset and model, their uncertainty is fixed.
In this study, the software used for machine learning modeling was Scikit-learn (version 1.3.2), Python (version 3.8) and PyCharm (version 2024.1.1). The computational experiments were conducted using hardware equipped with an “Nvidia RTX 4080 graphics card”, manufactured by “NVIDIA Corporation” in Santa Clara, CA, USA, and an “Intel Core i5-13600KF processor”, manufactured by “Intel Corporation”, also located in Santa Clara, CA, USA.

2.3. Data Sources

The dataset collected in this paper comes from the China Meteorological Disaster Yearbook (2003–2020) and the China Statistical Yearbook (2003–2020), with the latest data available up to 2020. Following the tripartite framework of natural disaster analysis (“hazard factor—exposed elements—vulnerability”) [38,39] the dataset contains 438 detailed records of typhoon disasters in China (the same typhoon is counted as distinct events for different affected provinces). As shown in Table 1, the 14 variables are structured as follows: (1) Hazard factor (Meteorological data): Typhoon number, Maximum wind force, Maximum wind speed (m/s); (2) Exposed elements (Disaster impact data): Affected area (provincial administrative region), Affected population (10,000 persons), Deaths (persons), Relocated population (10,000 persons), Collapsed houses (10,000 units), Affected area (10,000 hectares), Direct economic losses (100 million yuan); (3) Vulnerability (Socio-economic vulnerability): CPI Consumer Price Index (base year 1983 = 100), Population density (persons/km2), GDP per capita (10,000 yuan/person); (4) Land use data: Urbanization rate, Urban construction land area (km2), Urban area (km2), and Construction land proportion. Among these, the land use data are an assumption in this paper. The specific formula for calculating the direct economic loss (based on the Consumer Price Index (CPI) in 1983) is as follows:
L a = L n C P I t × C P I 1983
In the formula, L a represents the CPI-adjusted direct economic losses (with 1983 as the base year), referred to simply as direct economic losses in the following text. L n represents the nominal direct economic losses, which are the actual monetary values of the losses caused by typhoons as recorded in the year of occurrence without any adjustment for inflation. C P I t represents the Consumer Price Index for the current year, and C P I 1983 represents the Consumer Price Index in 1983. Through this conversion, this paper can eliminate the impact of inflation, making economic losses from different years comparable. The research in this paper is carried out on this dataset, of which 22 are randomly selected as test cases and the remaining 416 are used for model training.

3. Results Analysis

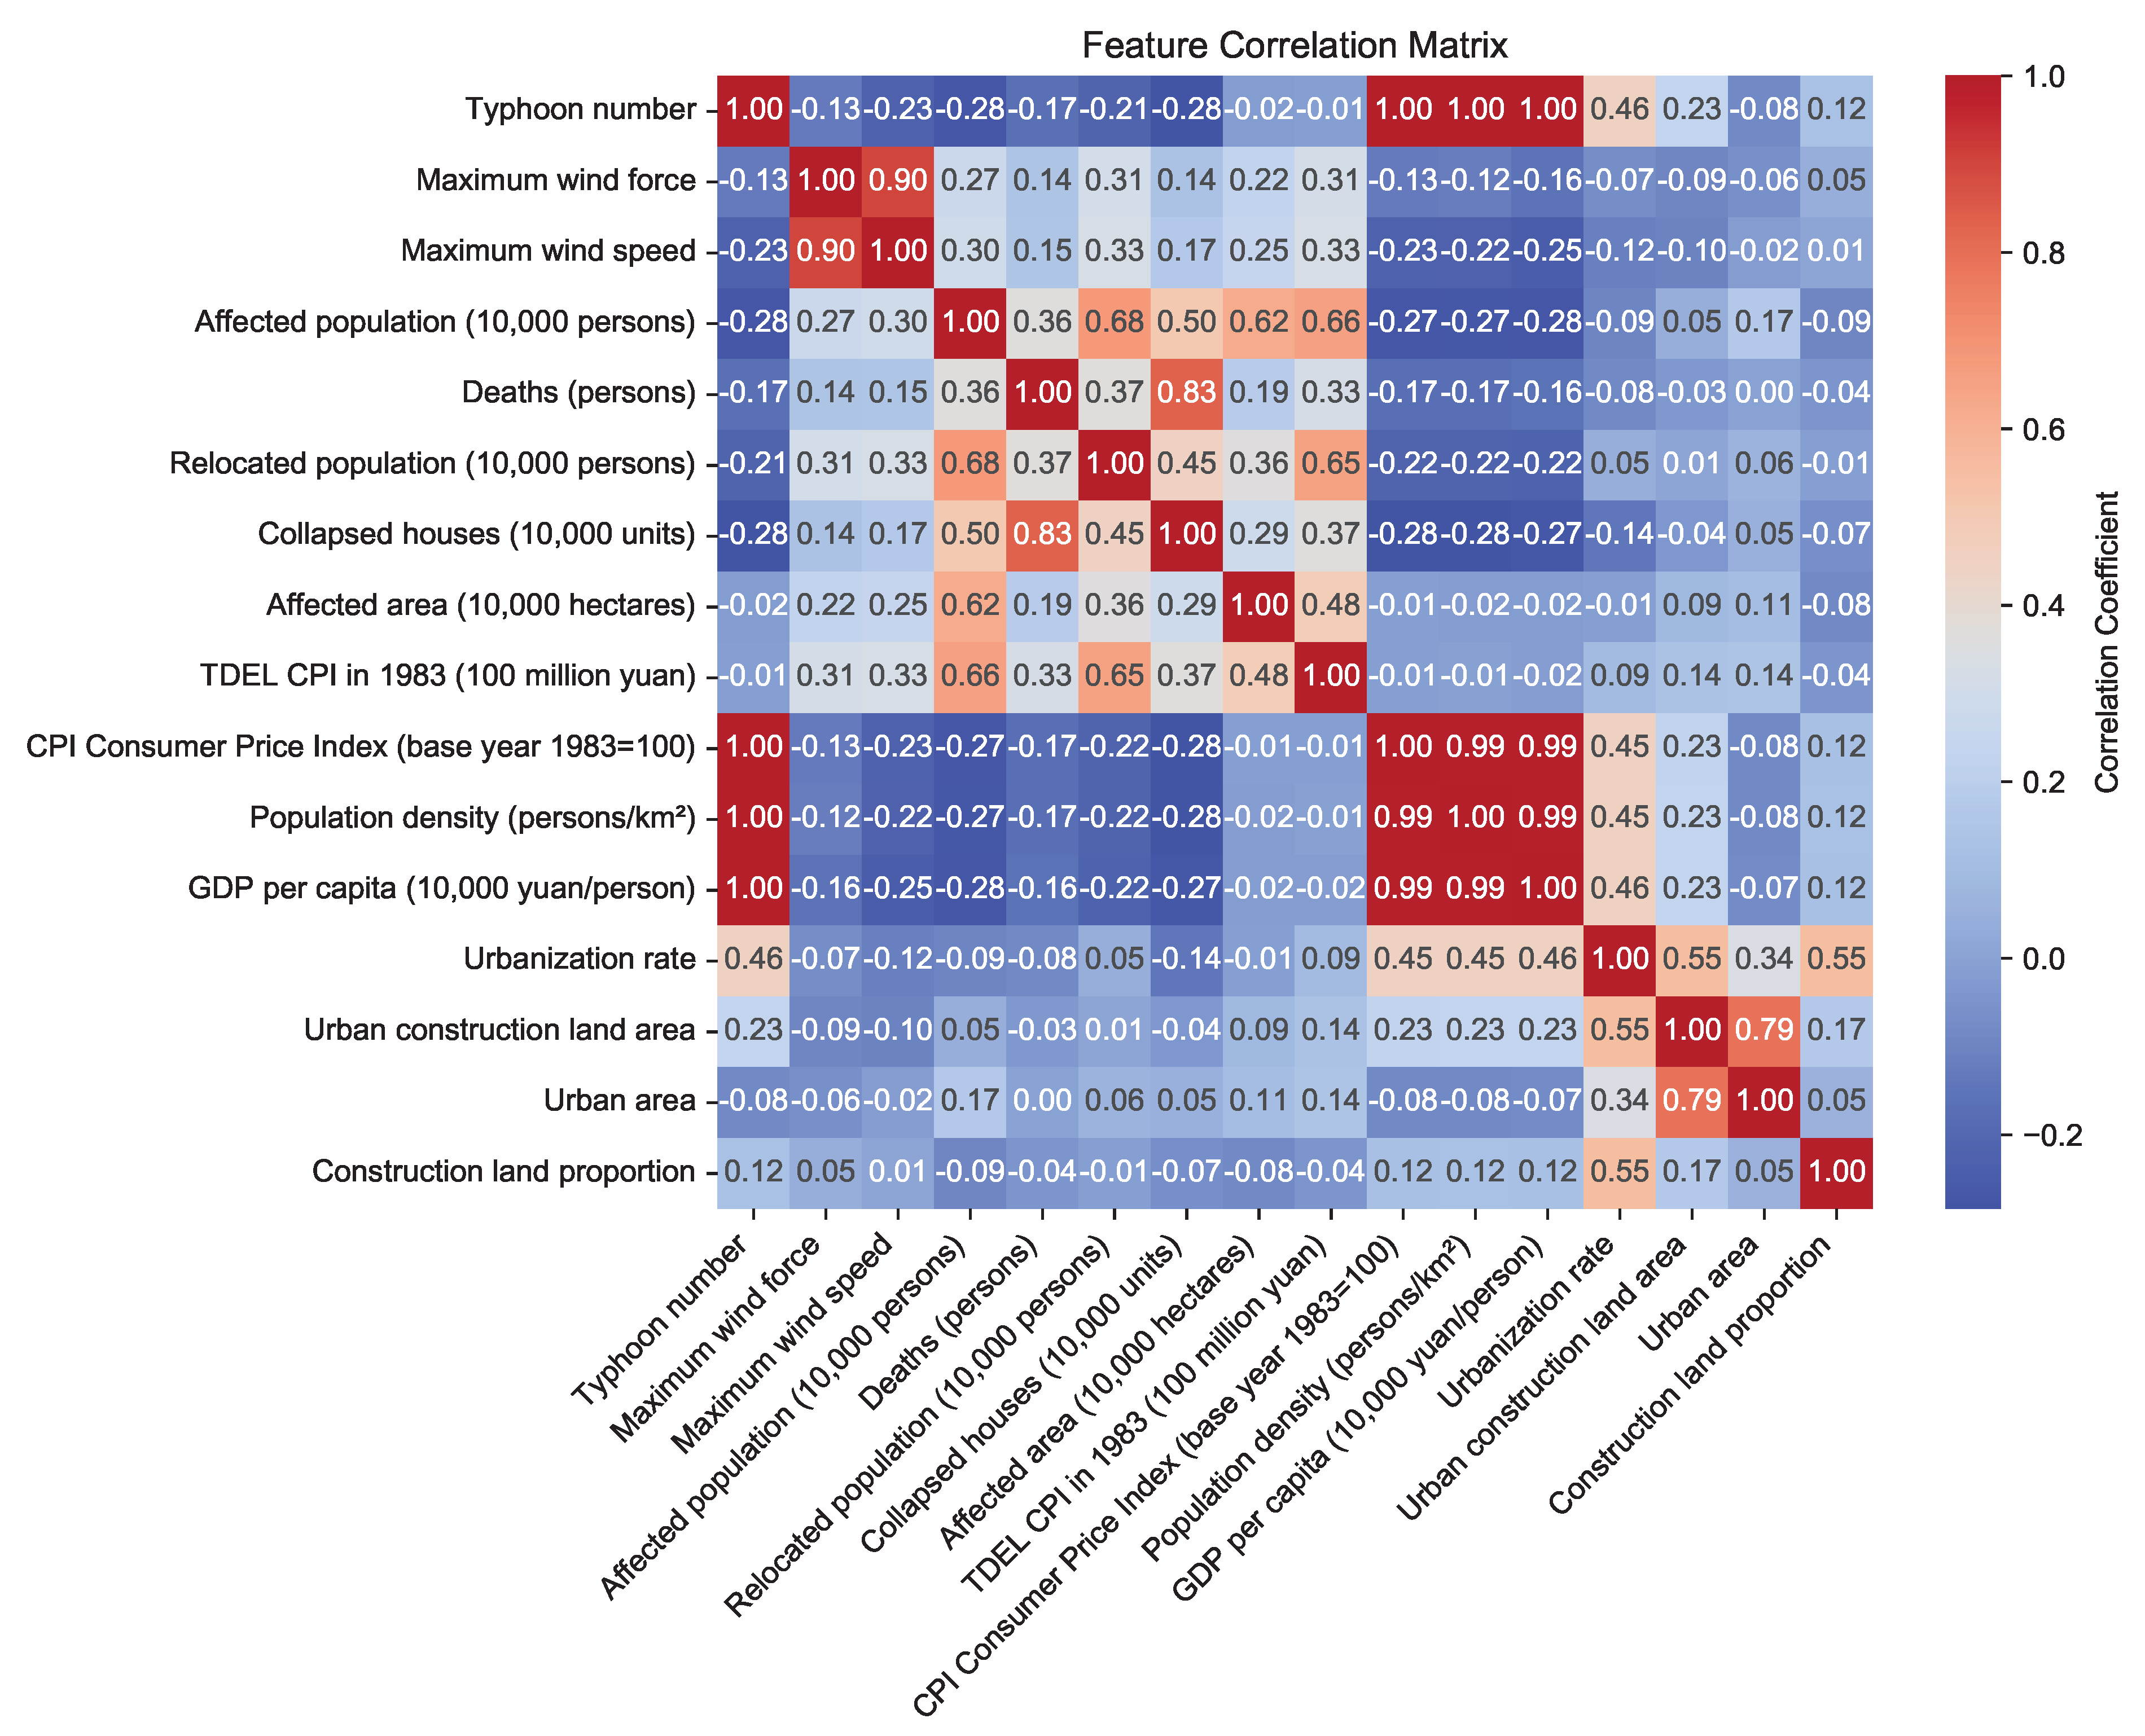
3.1. Impact Factors Analysis

To ensure the stability of the model and the reliability of the results, we first performed a Variance Inflation Factor (VIF) check on the features before using the Pearson correlation coefficient for feature selection. VIF is used to assess the multicollinearity issue among features by evaluating the correlation between each feature and the others. When the VIF value of a feature exceeds 10, it typically indicates a strong correlation with other features, which may lead to model instability and estimation errors in regression analysis. Therefore, the VIF check helps us identify and remove potentially redundant features before performing the Pearson correlation analysis, thereby mitigating the impact of multicollinearity on the analysis results. As shown in Table 2, there is severe multicollinearity with the features “Typhoon number”, “Direct economic losses (CPI in 1983)”, “CPI Consumer Price Index”, “Population density (persons/km2)”, and “GDP per capita (10,000 yuan/person)”. Therefore, these features should be excluded when considering feature selection.
To identify the factors that impact the assessment of the directed economic losses caused by typhoons, this paper conducts a comprehensive correlation analysis of all the potential factors hypothesized in previous studies. The correlation between all potential assessment factors and outcomes in the dataset was analyzed using the Pearson correlation coefficient [40], which is given by:
r x y = i = 1 n ( x i x ¯ ) ( y i y ¯ ) i = 1 n ( x i x ¯ ) 2 i = 1 n ( y i y ¯ ) 2
In the formula, r x y denotes the correlation coefficient between variables x and y, x i and y i denote the ith observation of the two variables, respectively, x ¯ and y ¯ denote the mean of the two variables, respectively, and n is the sample size. The correlation coefficient takes the range of [ 1 , 1 ] , where 1 means perfect positive correlation, −1 means perfect negative correlation, and 0 means no correlation.
Through this analysis, this paper can quantify the degree of influence of different assessment factors on the target variables and provide a basis for feature selection.
The correlation analysis results reveal the strength of associations between typhoon-directed economic losses and various influencing factors, providing clear direction for feature selection in loss assessment modeling. Shown as the Figure 2, the affected population (r = 0.6579) and relocated population (r = 0.6505) show the strongest positive correlations, followed by the affected area (r = 0.4807); meteorological factors, including maximum wind speed (r = 0.3286) and maximum wind force (r = 0.3138), as well as disaster indicators such as collapsed buildings (r = 0.3655) and death toll (r = 0.3261), demonstrate moderate to weak positive correlations. However, surprisingly, socio-economic indicators such as population density (r = −0.0065) and GDP per capita (r = −0.0198) show almost no correlation with economic losses. It is worth noting that indicators such as “proportion of construction land”, “urban construction land area”, “urban area”, and “urbanization rate” demonstrated low correlation with direct economic losses in the full sample analysis, a phenomenon that appears to contradict conventional wisdom.
In order to verify this situation several times, this study also employed two statistical methods—Mutual Information (MI) [41] and F-statistic [42]—to analyze the key factors affecting typhoon disaster economic losses. As shown in Figure 3, both methods pointed to six similar major features: the affected population ranked first with a mutual information score of 0.705, demonstrating its strongest statistical association with economic losses. From the F-statistic perspective, the affected population led with a significant statistical value of 332.67, followed closely by the number of relocated people (319.83). These two methods not only corroborate each other but also reveal a clear fact: the scale of disaster impact (area and population) represents the core factors influencing economic losses. Additionally, collapsed houses, deaths, and meteorological factors (maximum wind force/speed) also showed significant influence. Notably, indicators such as GDP per capita, population density, and land use were again confirmed to be lower. The possible reason for this phenomenon is that population density data and economic data are at the provincial scale; due to the complex regional heterogeneity, the provincial scale data exhibit lower correlations across the entire sample.
These findings suggest that when constructing typhoon economic loss assessment models, disaster severity indicators and meteorological factors should be considered core feature variables, while the weights of socio-economic indicators and land use data can be appropriately reduced. This may be a key reason why few academic studies have incorporated factors related to SEURC into their assessment models.

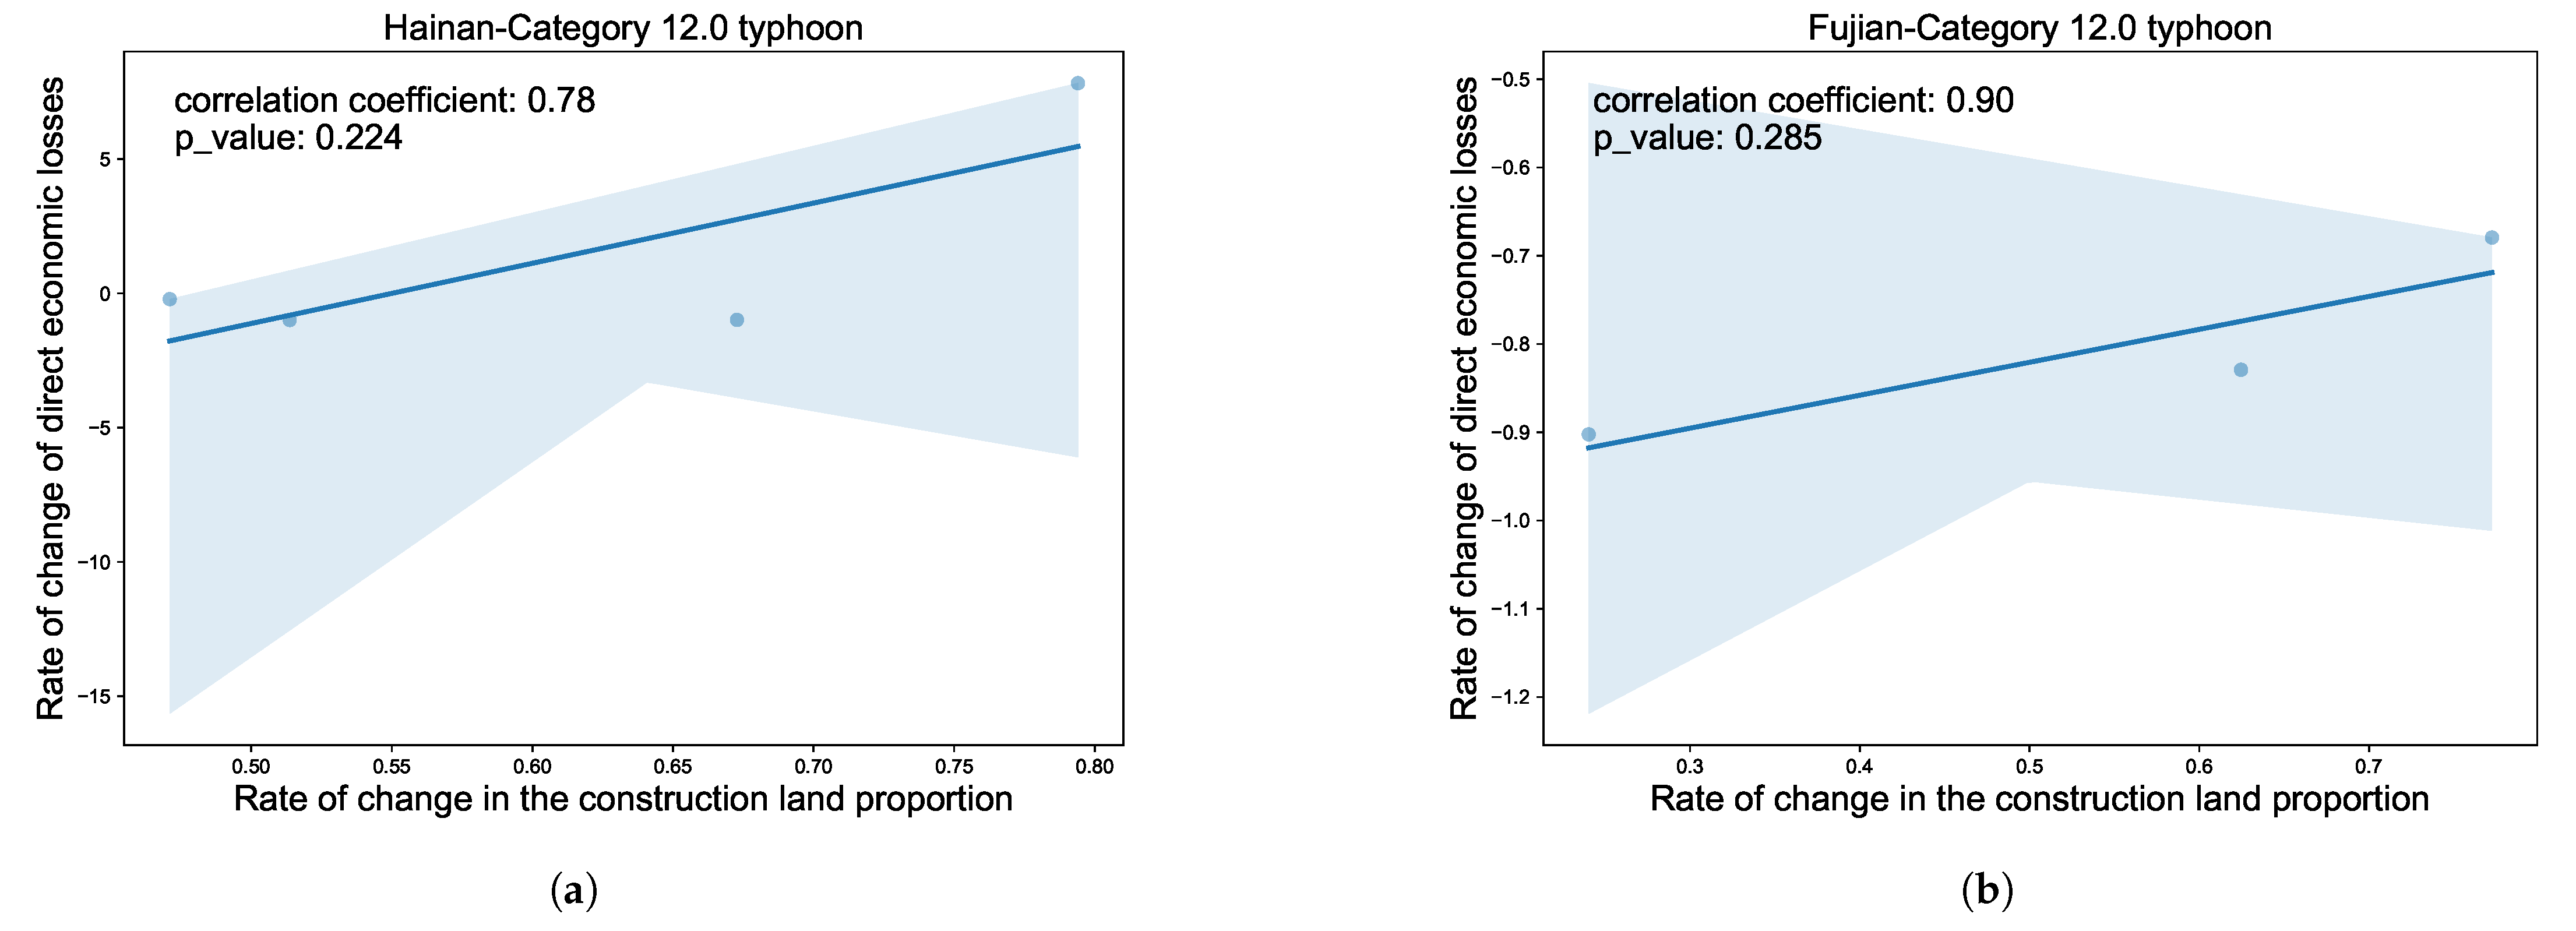
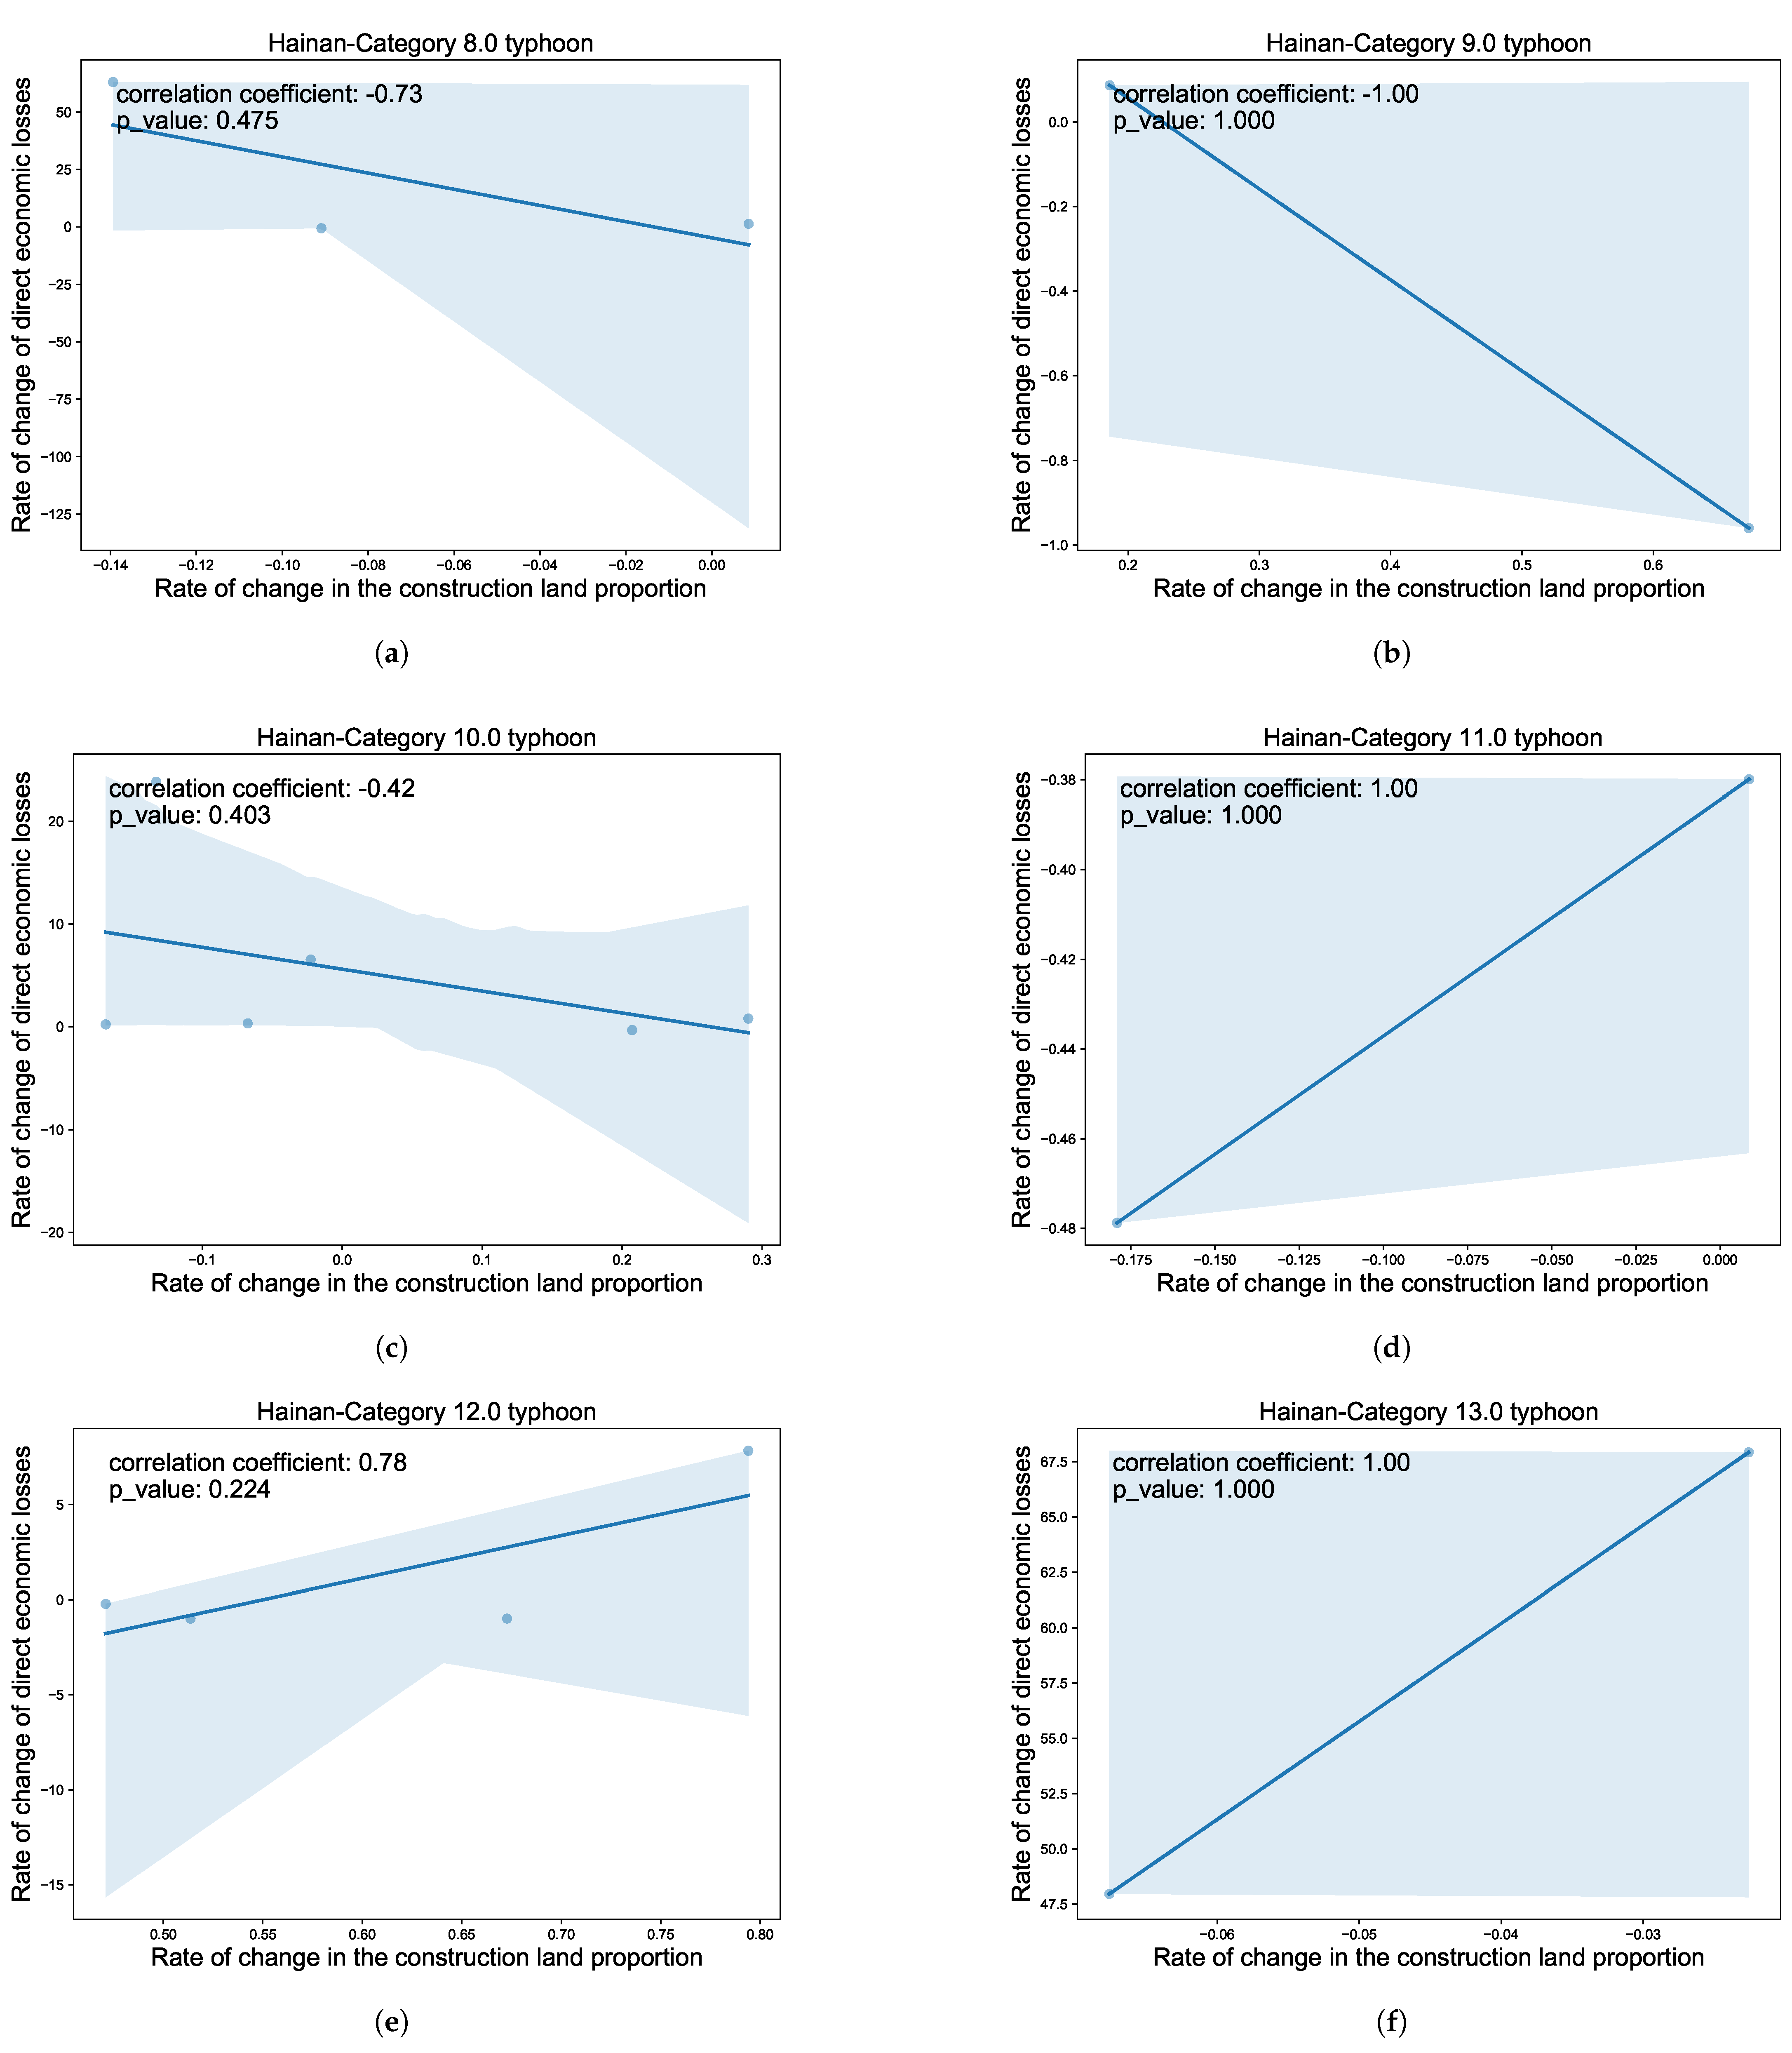
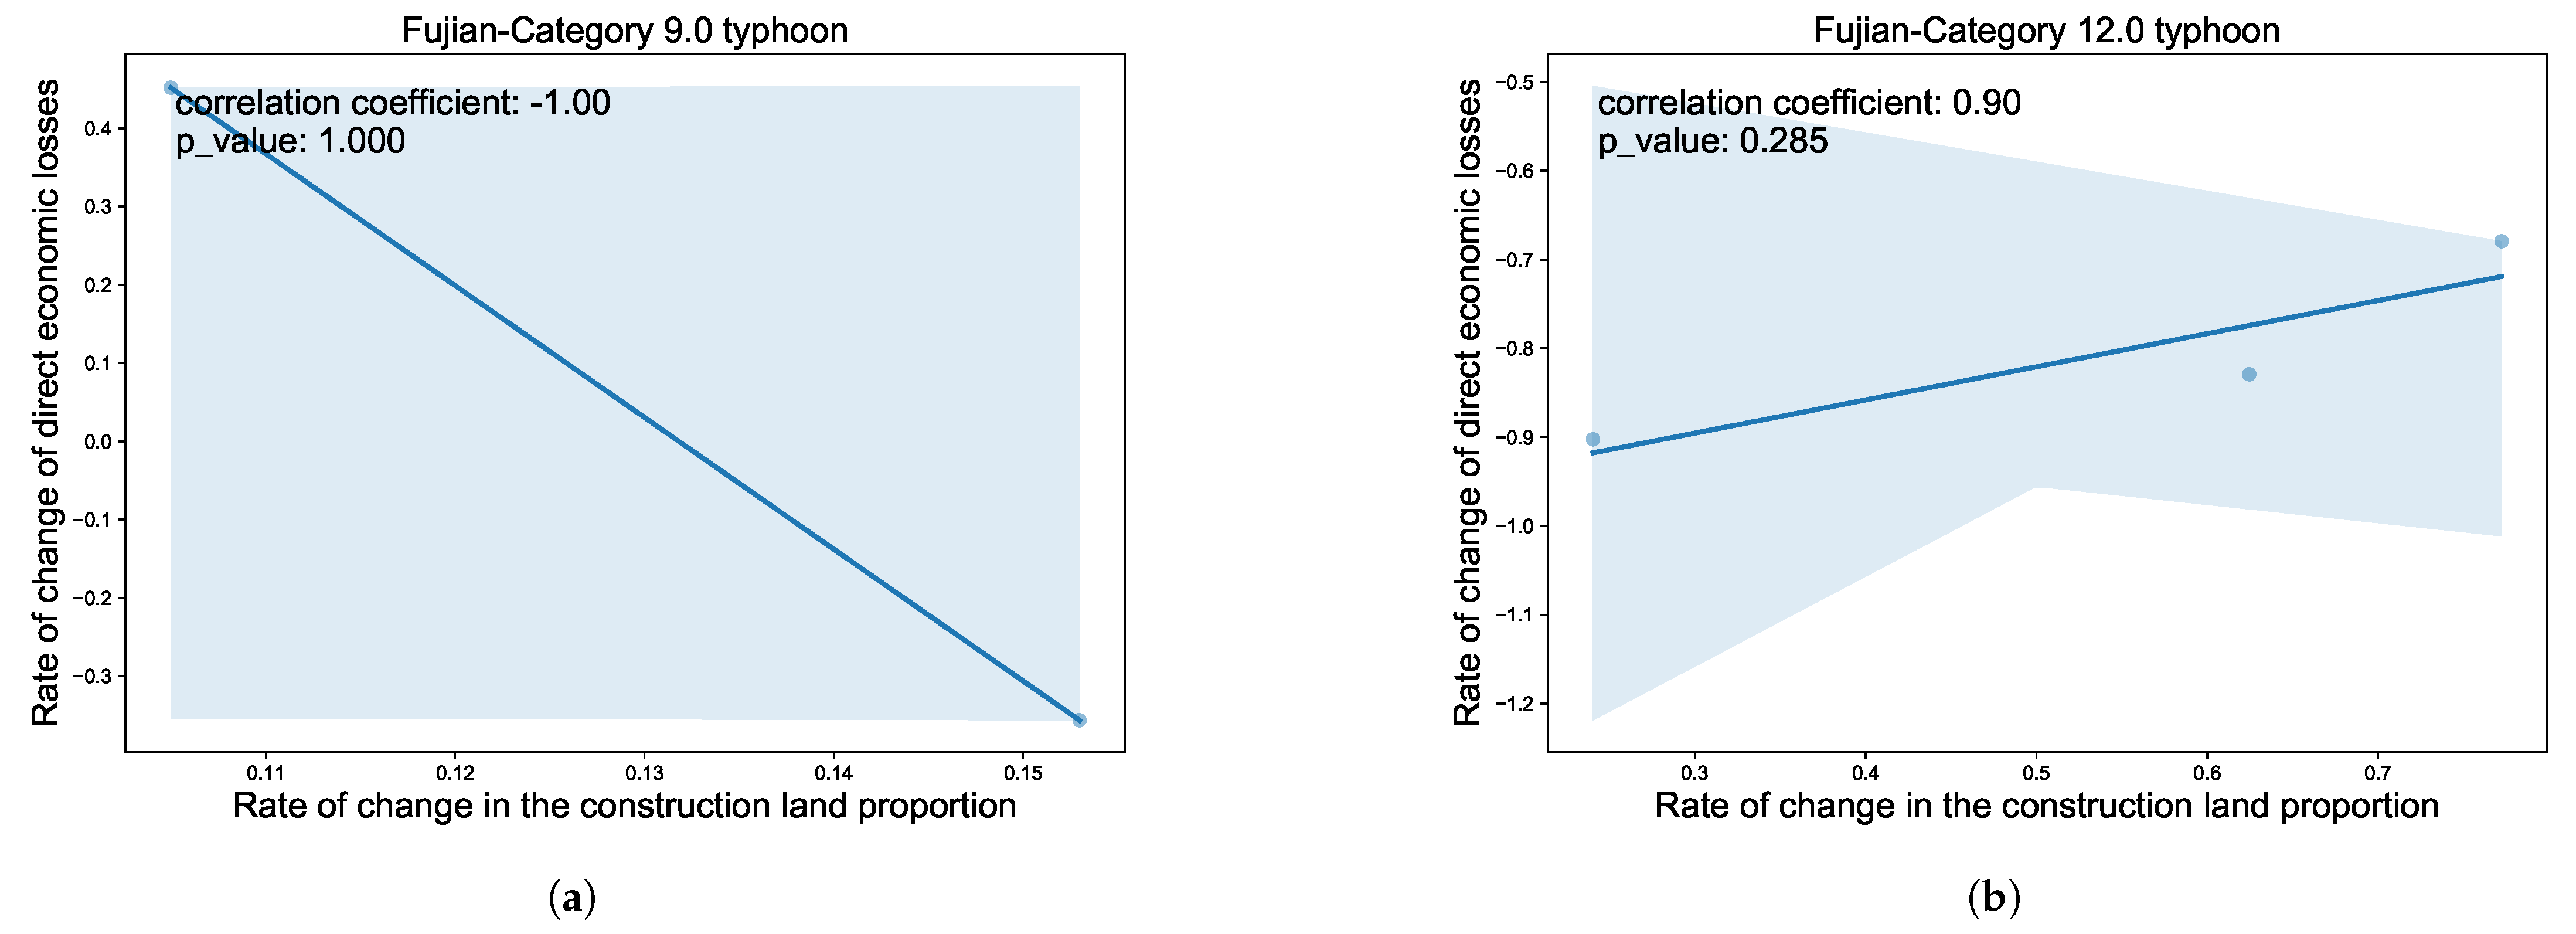
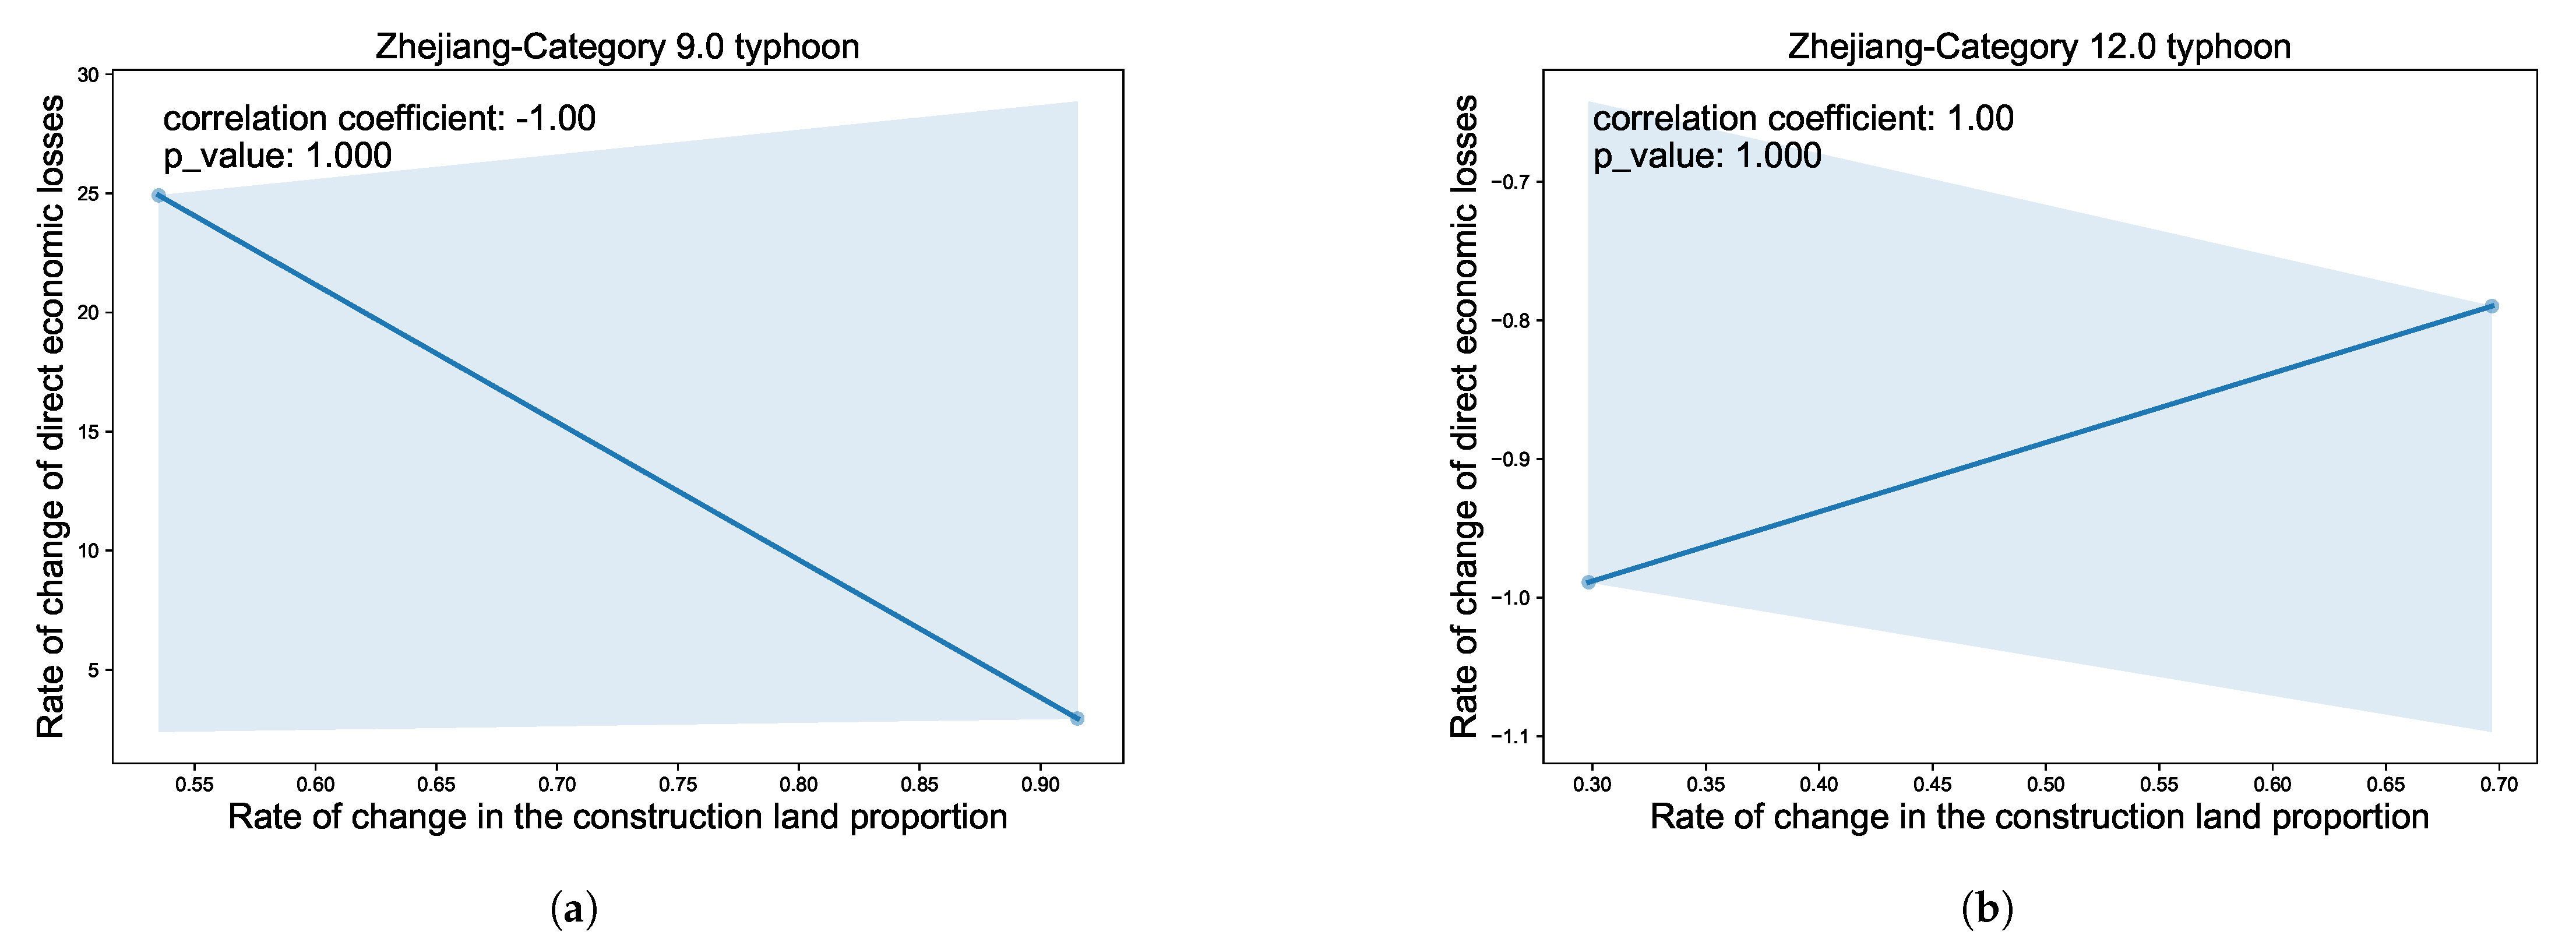
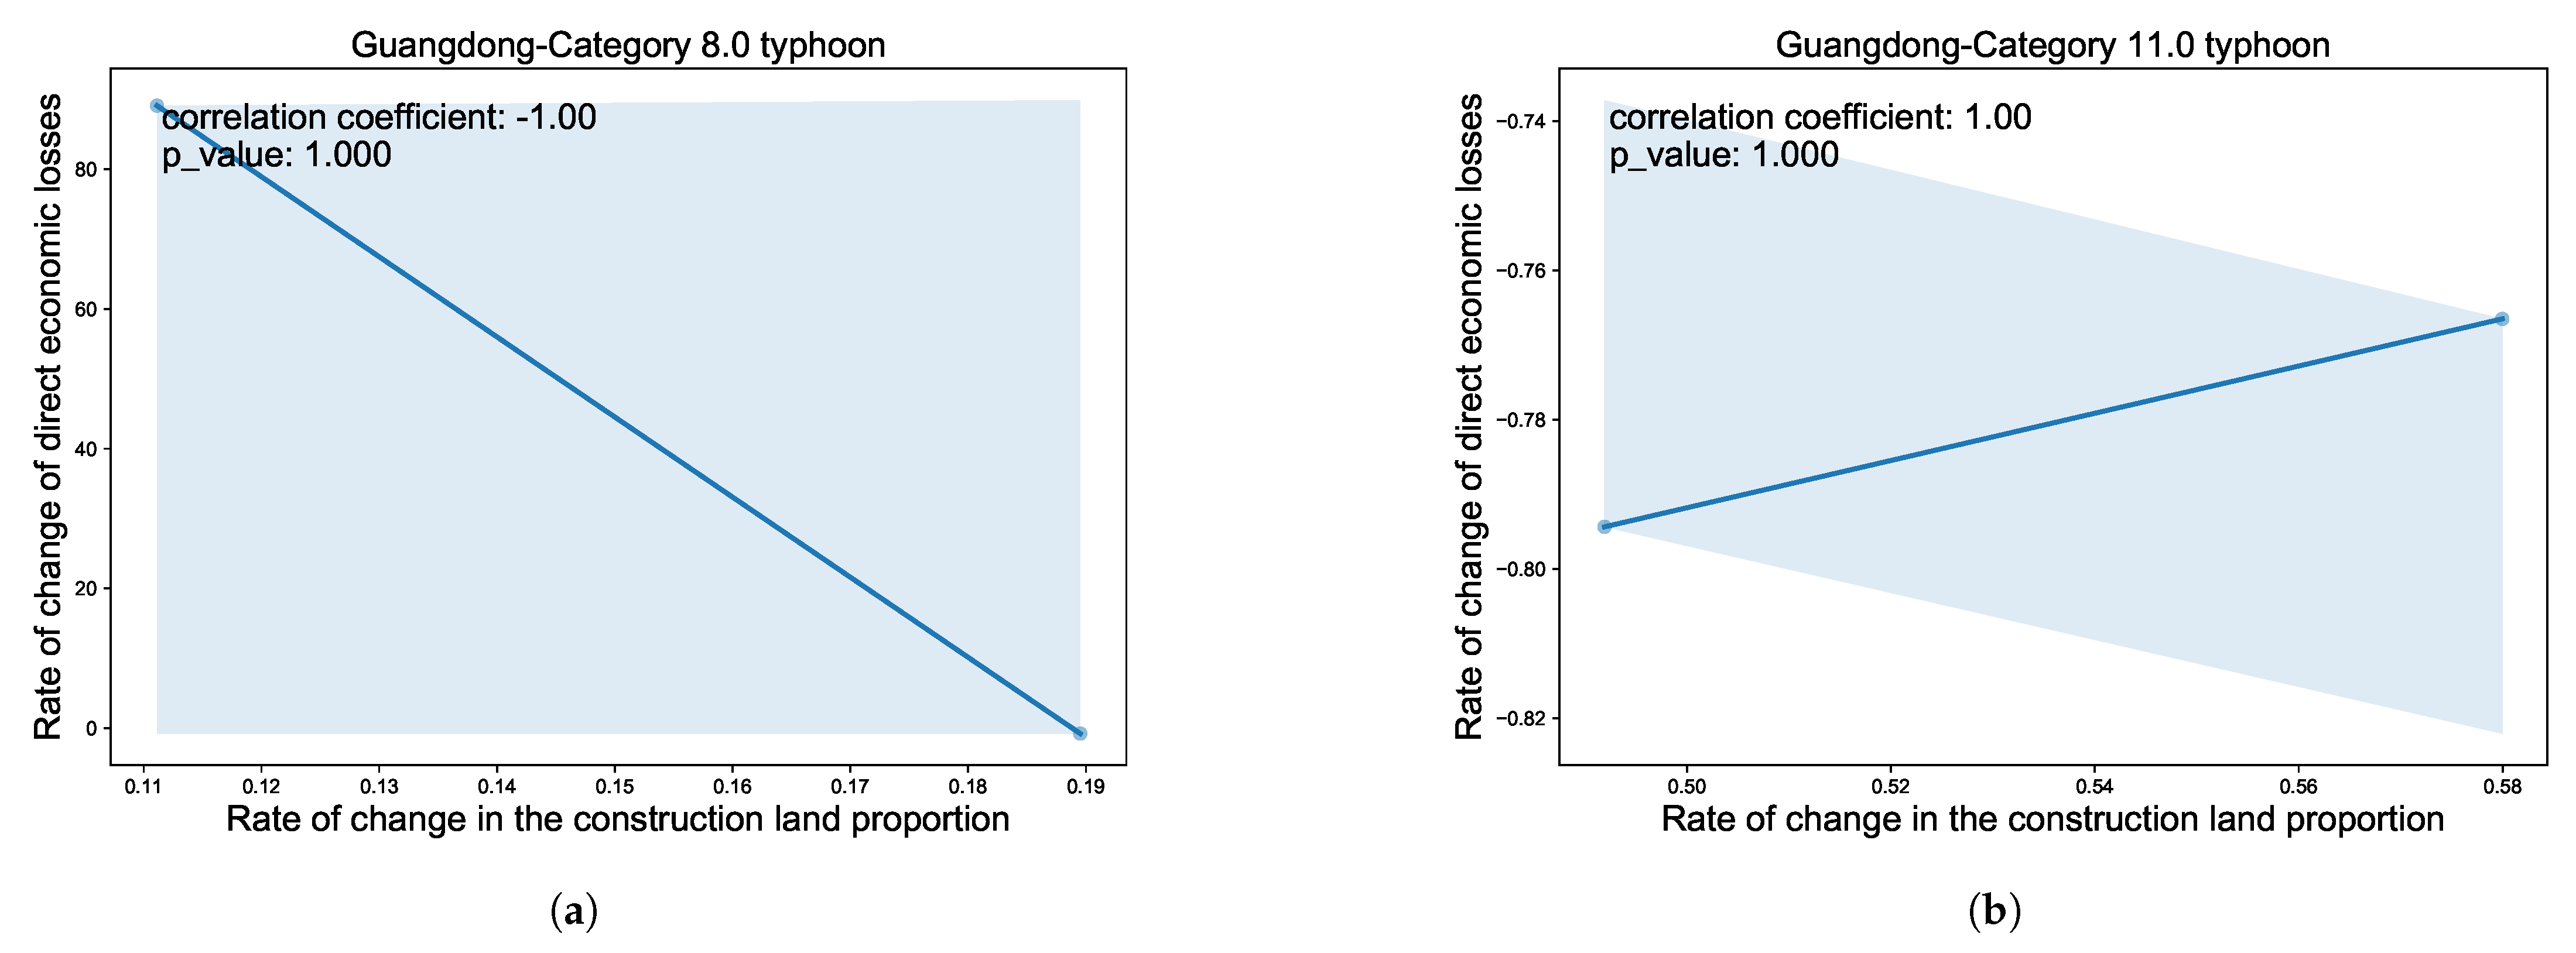
3.2. Analysis of the Impact of SEURC on Meteorological Disasters

The factors analysis yielded results showing a low correlation between direct economic losses and land use data. This finding contradicts our hypothesis. On this basis, this section further analyzes the impact of SEURC on typhoon disaster losses by using the proportion of construction land. This study performed comparative analyses by: (1) controlling for maximum wind force across different affected regions, and (2) analyzing typhoon events of varying wind force intensities within the same affected areas.
In this study, we base our typhoon-related analyses on the “National Standard for Tropical Cyclone Grades” (GB/T 19201-2006) [43].
This standard categorizes tropical cyclones into six distinct levels according to the maximum surface wind speed near their bottom centers. A Tropical Depression (TD) has a maximum average wind speed in the range of 10.8–17.1 m/s, corresponding to wind force levels 6–7. A Tropical Storm (TS) has a wind speed of 17.2–24.4 m/s, equivalent to wind force levels 8–9. A Severe Tropical Storm (STS) has a wind speed of 24.5–32.6 m/s, matching wind force levels 10–11. A Typhoon (TY) has a wind speed of 32.7–41.4 m/s, falling within wind force levels 12–13. A Severe Typhoon (STY) has a wind speed of 41.5–50.9 m/s, corresponding to wind force levels 14–15. And a Super Typhoon (Super TY) has a maximum average wind speed of 51.0 m/s or higher, which is wind force level 16 or above.
As shown in Figure 4, by comparing the data from Fujian Province (correlation of 0.90) and Hainan Province (correlation of 0.78), both of which experienced Category 12 typhoon landfalls, we found significant regional differences in the correlation between SEURC and typhoon damage losses. This analytical study quantitatively characterizes the regional differences in their correlation, addressing the limitations of existing research in terms of traditional singular methodologies and insufficient explanatory power. This regional heterogeneity is reflected not only in geographical location differences but is also closely related to urban resilience and typhoon intensity [44]. In other words, the significant regional differences in the correlation are primarily a result of disparities in urban and regional resilience among different provinces.
These differences in urban and regional resilience among provinces are mainly affected by factors such as infrastructure investment, land use layout planning, and emergency response mechanisms. Regarding infrastructure investment, economically developed provinces can enhance urban and regional resilience and reduce economic loss rates per unit of built-up land through high-density investment in critical urban infrastructure lifeline projects. In these regions, economic development and infrastructure investment mitigate the impacts of disasters. In contrast, economically underdeveloped provinces, with lagging economies and weaker fiscal capacity, often face delays in infrastructure investment. This results in limited urban and regional resilience, where disaster impacts further suppress economic development and infrastructure investment [45]. In terms of land use planning, optimizing land use and functional layouts can significantly enhance urban and regional resilience. For instance, establishing green spaces and water bodies as ecological barriers between urban built-up areas and coastlines has become a strategy for governments to improve resilience against typhoon disasters [46]. For example, provinces such as Guangdong and Fujian in China have successively issued master plans for the protection and restoration of major ecosystems, systematically planning key coastal projects and creating ecological barriers between urban areas and coastlines to mitigate typhoon impacts [47]. Conversely, some rapidly expanding cities have undertaken land reclamation projects directly exposed to storm surge paths, resulting in severe direct economic losses from typhoon disasters. Thus, the relationship between SEURC and typhoon losses varies significantly among different provinces due to differences in the level of resilient urban planning. Regarding emergency response, pre-disaster emergency response capacity is not only a critical measure for effectively reducing disaster impact, but also a key component of building resilient cities [48,49]. For example, in recent years, Shanghai has focused on developing a resilient city. Its resilience derives from both hardware—long-term infrastructure investments—and software, such as the digital management platform “One Network Management”. Relying on this platform, Shanghai has transitioned from passive response to proactive defense, enabling all-weather, refined early warning of typhoon paths, preemptive population evacuations, and reduced disaster losses. In contrast, some provinces suffer from large blind spots in early warning coverage, leading to significant losses. For instance, during the 2012 “Bravan” typhoon, Liaoning Province experienced inadequate early warning coverage, resulting in the failure to evacuate ships at Yingkou Port in time. This led to substantial single-point losses when the ships sank. Notably, in the cross-provincial full sample analysis, land use data showed a low correlation with typhoon economic losses. This phenomenon largely stems from significant heterogeneity effects between different regions: some areas show negative correlations, while others demonstrate strong positive correlations. These regional differential effects cancel each other out, ultimately leading to a weak correlation at the full sample level.
To better understand these heterogeneous characteristics, this study conducted comparative analyses of cases where the same affected areas, as shown in Figure 5, Figure 6, Figure 7 and Figure 8, (Hainan province, Fujian province, Zhejiang province and Guangdong province) experienced typhoons of different intensities. The research found that disaster prevention and mitigation projects implemented during urban development resulted in differentiated loss characteristics when responding to typhoons of varying intensities [50]. As shown in the Figure 5, Figure 6, Figure 7 and Figure 8, in most affected areas within the dataset, when facing typhoons with wind forces below a certain threshold, land use data showed negative correlations with typhoon economic losses, indicating that urban disaster prevention and mitigation capabilities played a positive role in responding to low and medium-intensity typhoons. However, when typhoon wind forces exceeded this threshold, this relationship often shifted to a positive correlation, suggesting that under extreme-intensity typhoons, the higher exposure value of urbanized areas may exceed the capacity of their disaster prevention capabilities. This finding indicates that when assessing typhoon-induced economic losses, we cannot simply assume that SEURC necessarily exacerbates disaster losses; instead, we should comprehensively consider the interaction between urban resilience and typhoon intensity. The discovery of this non-linear relationship provides a new research perspective for more accurate understanding and assessment of typhoon disaster losses.
In summary, urban resilience in typhoon disaster loss assessment is a complex and dynamic factor. It not only affects the economic losses caused by typhoons of varying intensities differently but also has a nonlinear interactive relationship with SEURC. This implies that enhancing urban disaster resilience should be a multifaceted strategy. For low to medium intensity typhoons, improving disaster prevention and mitigation capabilities can effectively reduce losses. However, for extremely intense typhoons, we need to consider the overall layout of urban and rural development, control the exposure level of urban areas, and continuously enhance the overall disaster resilience of cities. By doing so, we can better manage typhoon-related risks and make more scientifically sound and reasonable disaster prevention and mitigation decisions.

4. Results Validation

4.1. Controlled Variable Experiment

Previous analysis in this paper indicates that the impact of construction land proportion on typhoon disaster losses exhibits significant regional variations. Therefore, land use data at the provincial level should not be included in the assessment system. To verify this finding, the proportion of built-up land, which shows the highest correlation among land use data, was selected as a dynamic assessment factor. Two experimental groups were established with fixed feature inputs, with the key difference being whether the dynamic assessment factor (construction land proportion) was included as input. Two UProtoMLP models were trained with different input configurations and model weights, and were tested separately. Combined with uncertainty analysis, this approach was used to investigate how the proportion of built-up land influences the model’s assessment mechanism. The experiment results of this investigation are as follows: Based on the experimental results analysis, as shown in Table 3 and Table 4, the incorporation of construction land proportion significantly increased the model’s assessment uncertainty, and this increase exhibited distinct regional differences. Specifically, the assessment intervals generally widened, but the extent of expansion varies across different regions. Meanwhile, in extreme cases, both the assessed values and confidence intervals showed significant changes after incorporating construction land proportion, reflecting the differential responses of various regions to major disasters. These findings not only support the research hypothesis regarding the regional heterogeneity of construction land proportion’s impact but also provide new empirical evidence for understanding the complex relationship between construction land proportion and typhoon disaster losses, which is crucial for improving typhoon damage models. This suggests that regional heterogeneity must be fully considered when assessing typhoon disaster losses, offering new perspectives and directions for future research. From this, we can conclude that land use data should not be included as an assessment factor when evaluating directed economic losses caused by typhoons at the provincial scale. This is because the regional heterogeneity of land use data exacerbates the uncertainty of the data and the model, leading to a decline in assessment accuracy and an expansion of the uncertainty region.

4.2. Comparison Experiment

Based on the above conclusion, this paper will no longer include land use factors in the assessment model and will only utilize various assessment factors related to the typhoon itself for the evaluation. In this section, we aim to determine the optimal model for typhoon-directed economic loss assessment. To this end, we conduct a comprehensive comparison of the UProtoMLP model with a range of other well-established models. The primary objective is to identify whether UProtoMLP outperforms these alternatives in terms of accuracy capabilities. We selected a diverse set of models, including widely used machine learning models like XGBoost, GBDT, RF, LightGBM, and AdaBoost. Additionally, we incorporated classic time-series deep-learning models such as ILSTM and GRU, along with state-of-the-art few-shot learning models like MetaNet+, TADAM, and DN4++. To evaluate the performance of these models, we utilized several key metrics: Mean Absolute Error (MAE), Mean Squared Error (MSE), and R2 Score. MAE was specifically used as the loss function during the training process. By comparing the performance of UProtoMLP with these other models, we can comprehensively demonstrate its superiority in typhoon-directed economic loss assessment. Specifically, the entire dataset is divided into training and test sets with a ratio of 95%:5% to train and test the proposed UProtoMLP. AdamW is used as the training optimizer [51]. Mean Absolute Error (MAE) is used as the loss function, while MSE and R2 Score are used as evaluation metrics. The assessment indicators are as follows:
M A E = 1 n i = 1 n | y i y ^ i |
M S E = 1 n i = 1 n ( y i y ^ i ) 2
R 2 = 1 i = 1 n ( y i y ^ i ) 2 i = 1 n ( y i y ¯ ) 2
In the formula, y i is the actual value and y ^ i is the assessed value.
As shown in Table 5, the proposed UprotoMLP achieved the best MAE accuracy of 1.0176, significantly outperforming other models. The paper first selected several commonly used models in other typhoon damage assessment works, such as XGBoost, GBDT, RF, LightGBM, and AdaBoost, which are all mature and widely used machine learning models. Ensemble learning models like AdaBoost (MAE = 2.1768) and XGBoost (MAE = 2.4501), although not performing as well as deep learning models, still have certain application value in some cases.
GBDT performed the worst, with a high MAE of 4.2499 and an R2 value of only 0.2442, indicating its low suitability for this task. The results show that its accuracy is insufficient for the task at hand. LSTM (MAE = 1.6484) and GRU (MAE = 1.3331), as classic time-series deep learning models, also demonstrated good assessment capabilities. This indicates they effectively captured the temporal features of typhoon data, suggesting further potential for mining temporal aspects of the dataset. The paper also selected some commonly used models in few-shot learning, among which DN4++ (MAE = 1.466, R2 = 0.8782) from prototypical learning models showed outstanding performance, demonstrating the advantages of prototypical learning methods in few-shot tasks. Meta-learning models like MetaNet+ (MAE = 1.9628) and TADAM (MAE = 1.8886) showed moderate performance, not as good as prototypical learning models but still better than traditional methods. In ablation experiments, comparing with using only the MLP model, the accuracy was far inferior to the proposed UProtoMLP, further verifying the superior accuracy of the proposed model.
Additionally, in experimental validation, 95.45% of actual observations fell within the assessed confidence intervals, as shown in Figure 9. This result is very close to the theoretical expectation of 95%, fully validating the accuracy and reliability of the uncertainty estimation method proposed in this paper.
As shown in Figure 10, the output results of the proposed assessment framework clearly demonstrate the comparison between assessed and actual economic losses in disaster-affected areas. The red-marked areas represent the framework’s assessed disaster-affected regions, showing higher estimated economic losses. The blue areas indicate the actual direct economic losses in these regions. Darker colors represent more severe losses. From the figure, the overlap between red and blue areas of varying intensities is clearly visible, indicating the model’s high accuracy in assessing economic losses from disasters. Particularly in the southern coastal regions, there is a high degree of correspondence between the model’s assessments and actual losses, demonstrating the framework’s effectiveness in dealing with natural disasters like typhoons. This result not only validates the model’s accuracy but also provides important reference data for future post-disaster assessments and policy-making.

5. Conclusions

The proposed CUMP framework demonstrates good assessment performance and reliable uncertainty estimation capabilities. In terms of assessment accuracy, the model achieved a Mean Absolute Error (MAE) of approximately 1.0 on the test set. More importantly, the 95% confidence intervals constructed by considering both cognitive uncertainty and data uncertainty achieved an actual coverage rate of 95.45%, almost perfectly matching theoretical expectations. This indicates that the model can not only accurately assess directed economic losses caused by typhoons but also reliably quantify the uncertainty of assessment results, providing more comprehensive reference information for disaster prevention and mitigation decisions. This study reveals regional heterogeneity in the correlation between construction land proportion change rates and directed economic loss change rates caused by typhoons. While the full-sample correlation analysis showed low correlation, the relationship strengthened when examined within fixed regions. Further experiments confirmed that incorporating construction land proportion from different regions led to increased data uncertainty, resulting in larger model errors, reduced accuracy, and wider assessment uncertainty intervals.
Consider this in terms of SEURC: We found that the relationship between SEURC and typhoon economic losses is non-linear. At lower typhoon intensities, urban disaster prevention and mitigation capabilities can lead to a negative correlation, meaning SEURC may help reduce losses. However, when typhoon intensities exceed a certain threshold, this relationship turns positive, as the high exposure of urban areas overrides their disaster prevention capacity. This discovery emphasizes that when evaluating typhoon-induced economic losses and planning urban-rural construction, we must consider the interaction between urban resilience and typhoon intensity. Therefore, the hypothesis of this paper should not hold. In the provincial panel data, the assessment model for directed economic losses caused by typhoons should not incorporate land use data. It suggests that traditional approaches relying solely on land use data for such assessments need to be re-evaluated. Instead, a more comprehensive and multi-faceted approach is required. For urban planning and disaster prevention management, this means that the government should shift its focus from simply considering the scale of urban expansion (which is related to land use data) to a more holistic approach. This includes improving disaster-resilient infrastructure, such as building typhoon-resistant buildings and enhancing flood-control facilities. At the same time, optimizing land use in a more sophisticated way, taking into account factors like the vulnerability of different land uses to typhoon disasters, is also crucial. This way, cities can better withstand typhoon-related risks and reduce potential losses. In the future, we plan to carry out a dedicated study that specifically focuses on “the patterns of SEURC impact in different regions”. This will involve a more in-depth exploration of the SEURC impact across various regions through refined classification methods.

Author Contributions

Conceptualization, Z.Z.; Writing—original draft, S.Z.; Writing—review & editing, F.L.; Visualization, J.H.; Supervision, K.Z. All authors have read and agreed to the published version of the manuscript.

Funding

This study was supported by the General Program of Philosophy and Social Sciences Foundation in Universities of Jiangsu Province (No. 2024SJYB0160), High-level Innovation and Entrepreneurship Talents Program of Jiangsu Province (No. JSSCBS20220570).

Data Availability Statement

These data were derived from the following resources available in the public domain: China Meteorological Disaster Yearbook: http://60.16.24.131/CSYDMirror/Trade/yearbook/single/N2023020114?z=Z008, accessed on 20 November 2024; China Statistical Yearbook: https://www.stats.gov.cn/sj/ndsj/, accessed on 20 November 2024.

Conflicts of Interest

The authors declare no conflicts of interest.

References

  1. Qin, D.; Zhang, J.; Shan, C.; Song, L. China National Assessment Report on Risk Management and Adaptation of Climate Extremes and Disasters; Science Press: Beijing, China, 2015. (In Chinese) [Google Scholar]
  2. Emanuel, K.; Sundararajan, R.; Williams, J. Hurricanes and global warming: Results from downscaling IPCC AR4 simulations. Bull. Am. Meteorol. Soc. 2008, 89, 347–368. [Google Scholar] [CrossRef]
  3. Wang, G.; Chen, R.; Chen, J. Direct and indirect economic loss assessment of typhoon disasters based on EC and IO joint model. Nat. Hazards 2017, 87, 1751–1764. [Google Scholar] [CrossRef]
  4. Cheng, Y.; Zhang, X.; Song, W. Ecological Risk Assessment of Land Use Change in the Tarim River Basin, Xinjiang, China. Land 2024, 13, 561. [Google Scholar] [CrossRef]
  5. Liu, F.; Yu, S.; Li, J.; Cao, X. The International Practice of Gentrification, and Its Research Process, Characteristics and Prospects. Mod. Urban Res. 2024, 38, 124–132. (In Chinese) [Google Scholar] [CrossRef]
  6. Keenan, J.M.; Hill, T.; Gumber, A. Climate gentrification: From theory to empiricism in Miami-Dade County, Florida. Environ. Res. Lett. 2018, 13, 054001. [Google Scholar] [CrossRef]
  7. Omar, H.; Cabral, P. Ecological risk assessment based on land cover changes: A case of Zanzibar (Tanzania). Remote Sens. 2020, 12, 3114. [Google Scholar] [CrossRef]
  8. Vickery, P.J.; Lin, J.; Skerlj, P.F.; Twisdale, L.A., Jr.; Huang, K. HAZUS-MH hurricane model methodology. I: Hurricane hazard, terrain, and wind load modeling. Nat. Hazards Rev. 2006, 7, 82–93. [Google Scholar] [CrossRef]
  9. Tao, Y.; Wang, T.; Sun, A.; Hamid, S.S.; Chen, S.C.; Shyu, M.L. Florida public hurricane loss model: Software system for insurance loss projection. Softw. Pract. Exp. 2022, 52, 1736–1755. [Google Scholar] [CrossRef]
  10. Huang, W.K.; Wang, J.J. Typhoon damage assessment model and analysis in Taiwan. Nat. Hazards 2015, 79, 497–510. [Google Scholar] [CrossRef]
  11. Gao, Z.; Geddes, R.R.; Ma, T. Direct and indirect economic losses using typhoon-flood disaster analysis: An application to Guangdong province, China. Sustainability 2020, 12, 8980. [Google Scholar] [CrossRef]
  12. Li, H.; Xu, E.; Zhang, H.; Zhong, S. A dynamic disastrous CGE model to optimize resource allocation in post-disaster economic recovery: Post-typhoon in an urban agglomeration area, China. Environ. Res. Lett. 2022, 17, 074027. [Google Scholar] [CrossRef]
  13. Sun, H.; Wang, J.; Ye, W. A data augmentation-based evaluation system for regional direct economic losses of storm surge disasters. Int. J. Environ. Res. Public Health 2021, 18, 2918. [Google Scholar] [CrossRef] [PubMed]
  14. Lou, W.-P.; Chen, H.-Y.; Qiu, X.-F.; Tang, Q.-Y.; Zheng, F. Assessment of economic losses from tropical cyclone disasters based on PCA-BP. Nat. Hazards 2012, 60, 819–829. [Google Scholar] [CrossRef]
  15. Yang, J.; Chen, S.; Tang, Y.; Lu, P.; Lin, S.; Duan, Z.; Ou, J. A tropical cyclone risk prediction framework using flood susceptibility and tree-based machine learning models: County-level direct economic loss prediction in Guangdong Province. Int. J. Disaster Risk Reduct. 2024, 114, 104955. [Google Scholar] [CrossRef]
  16. Kim, J.; Bae, J.; Adhikari, M.; Yum, S. Building loss assessment using deep learning algorithm from typhoon Rusa. Int. J. Heliyon 2024, 10, 1. [Google Scholar] [CrossRef]
  17. Yu, L.; Qin, H.; Huang, S.; Wei, W.; Jiang, H.; Mu, L. Quantitative study of storm surge risk assessment in an undeveloped coastal area of China based on deep learning and geographic information system techniques: A case study of Double Moon Bay. Nat. Hazards Earth Syst. Sci. 2024, 24, 2003–2024. [Google Scholar] [CrossRef]
  18. Liu, F.; Xu, E.; Zhang, H. Assessing typhoon disaster mitigation capacity and its uncertainty analysis in Hainan, China. Nat. Hazards 2024, 120, 9401–9420. [Google Scholar] [CrossRef]
  19. Tian, Z.; Zhang, Y.; Udo, K.; Lu, X. Regional economic losses of China’s coastline due to typhoon-induced port disruptions. Ocean Coast. Manag. 2023, 237, 106533. [Google Scholar] [CrossRef]
  20. Du, X.; Li, X.; Zhang, S.; Zhao, T.; Hou, Q.; Jin, X.; Zhang, J. High-accuracy estimation method of typhoon storm surge disaster loss under small sample conditions by information diffusion model coupled with machine learning models. Int. J. Disaster Risk Reduct. 2022, 82, 103307. [Google Scholar] [CrossRef]
  21. Wang, J.; Tan, J. Understanding the climate change and disaster risks in coastal areas of China to develop coping strategies. Prog. Geogr. 2021, 40, 870–882. (In Chinese) [Google Scholar] [CrossRef]
  22. Pan, Y.; Lin, Y.; Yang, R. Agricultural production space suitability in China: Spatial pattern, influencing factors and optimization strategies. Int. J. Environ. Res. Public Health 2022, 19, 13812. [Google Scholar] [CrossRef] [PubMed]
  23. Tang, Y.; Yuan, Y.; Tian, B. Analysis of the Driving Mechanism of Land Comprehensive Carrying Capacity from the Perspective of Urban Renewal. Land 2023, 12, 1377. [Google Scholar] [CrossRef]
  24. Yang, X.; Li, Y.; Jiang, W.; Ji, P.; Yang, Y. Study on Remote Sensing Dynamic Change of Ecological Environment Quality in Fugong County. J. Southwest For. Univ. 2023, 43, 99–108. (In Chinese) [Google Scholar] [CrossRef]
  25. Yang, Y.; Guo, F.; Han, G. Dynamic evolution and driving factors of tourism ecological security in the region of major function restricted development: A case study of Zhangjiajie. Acta Ecol. Sin. 2023, 43, 8404–8416. (In Chinese) [Google Scholar] [CrossRef]
  26. Ding, Y.; Dong, D. Study on comprehensive risk assessment of storm surges for Fujian Province from the perspective of resilience. J. Trop. Oceanogr. 2024, 43, 126–136. (In Chinese) [Google Scholar] [CrossRef]
  27. Yan, Y.; Gao, L.; Chen, R.; Zhang, C.; Ren, L.; Zhang, X.; Chen, C. Analysis of Disaster and Damage Process Caused by No. 2305 “Doksuri” Typhoon Disaster Chain in Fuzhou City. J. Catastrophol. 2024, 39, 228–234. (In Chinese) [Google Scholar] [CrossRef]
  28. Wang, J.; Liu, W.; Zhao, M.; Gou, A. Characteristics and Interaction of Spatial Expansion and Natural Disasters in the Guangdong-Hong Kong-Macao Greater Bay Area. Sci. Technol. Eng. 2023, 23, 11027–11040. (In Chinese) [Google Scholar] [CrossRef]
  29. Zhang, Y.; Lin, T.; Zhang, J.; Lin, M.; Chen, Y.; Zheng, Y.; Wang, X.; Liu, Y.; Ye, H.; Zhang, G. Potential and Influencing Factors of Urban Spatial Development under Natural Constraints: A Case Study of the Guangdong-Hong Kong-Macao Greater Bay Area. Land 2024, 13, 783. [Google Scholar] [CrossRef]
  30. Xue, L.; Sun, X.; Zhao, W. The Impact of Climate Change and Economic Agglomeration on Agricultural Sustainability: A Case Study of Yunnan Province. Urban Environ. Stud. 2023, 3, 98–118. (In Chinese) [Google Scholar]
  31. Li, G.; Jampani, V.; Sevilla-Lara, L.; Sun, D.; Kim, J.; Kim, J. Adaptive prototype learning and allocation for few-shot segmentation. In Proceedings of the 2021 IEEE/CVF Conference on Computer Vision and Pattern Recognition (CVPR), Nashville, TN, USA, 20–25 June 2021; pp. 8334–8343. [Google Scholar] [CrossRef]
  32. Kim, H.S.; Kim, J.H.; Ho, C.H.; Chu, P.S. Pattern classification of typhoon tracks using the fuzzy c-means clustering method. J. Clim. 2011, 24, 488–508. [Google Scholar] [CrossRef]
  33. Bholowalia, P.; Kumar, A. EBK-means: A clustering technique based on elbow method and k-means in WSN. Int. J. Comput. Appl. 2014, 105, 17–24. [Google Scholar]
  34. Likas, A.; Vlassis, N.; Verbeek, J.J. The global k-means clustering algorithm. Pattern Recognit. 2003, 36, 451–461. [Google Scholar] [CrossRef]
  35. Teh, D.; Khan, T. Types, Definitions, Classifications, and Threat Levels of Natural Disasters. In Handbook for Reducing Disaster Risk and Enhancing Resilience: A New Framework for Building Disaster Resilience; Springer: Cham, Switzerland, 2021; pp. 27–56. [Google Scholar] [CrossRef]
  36. Seoh, R. Qualitative analysis of monte carlo dropout. arXiv 2020, arXiv:2007.01720. [Google Scholar] [CrossRef]
  37. Padarian, J.; Minasny, B.; McBratney, A. Assessing the uncertainty of deep learning soil spectral models using Monte Carlo dropout. Geoderma 2022, 425, 116063. [Google Scholar] [CrossRef]
  38. Bin, L.; Xu, K.; Pan, H.; Zhuang, Y.; Shen, R. Urban flood risk assessment characterizing the relationship among hazard, exposure, and vulnerability. Environ. Sci. Pollut. Res. 2023, 30, 86463–86477. [Google Scholar] [CrossRef]
  39. Pagliacci, F.; Russo, M. Be (and have) good neighbours! Factors of vulnerability in the case of multiple hazards. Ecol. Indic. 2020, 111, 105969. [Google Scholar] [CrossRef]
  40. Cohen, I.; Huang, Y.; Chen, J.; Benesty, J.; Benesty, J.; Chen, J.; Huang, Y.; Cohen, I. Pearson correlation coefficient. In Noise Reduction in Speech Processing; Springer: Berlin/Heidelberg, Germany, 2009; pp. 1–4. [Google Scholar] [CrossRef]
  41. Duncan, T.E. On the calculation of mutual information. SIAM J. Appl. Math. 1970, 19, 215–220. [Google Scholar] [CrossRef]
  42. Song, W.C.; Xie, J. Group feature screening via the F statistic. Commun. Stat.-Simul. Comput. 2022, 51, 1921–1931. [Google Scholar] [CrossRef]
  43. GB/T 19201-2006; National Standard for Tropical Cyclone Grades. Standardization Administration of China: Beijing, China, 2006.
  44. Zhang, B.; Liu, Y.; Liu, Y.; Lyu, S. Spatiotemporal Evolution and Influencing Factors for Urban Resilience in China: A Provincial Analysis. Buildings 2024, 14, 502. [Google Scholar] [CrossRef]
  45. Zhang, P.; Zhang, Y.; Wang, Y.; Ding, Y.; Yin, Y.; Dong, Z.; Wu, X. Analysis of temporal-spatial patterns and impact factors of typhoon disaster losses in China from 1978 to 2020. Trop. Geogr. 2024, 44, 1047–1063. (In Chinese) [Google Scholar] [CrossRef]
  46. Xu, M.; Lin, X.; Wen, C.; Xi, L. Research on Land Use Suitability Evaluation and Layout Optimization in Coastal Zones: Vulnerability Assessment Based on the Nature-social Economy. South Archit. 2024, 106–115. (In Chinese) [Google Scholar] [CrossRef]
  47. Yuan, H.; Hao, T.; Xu, Z.; Zhang, D. Path and Practice of Territorial Space Ecological Restoration in Coastal Areas from the Perspective of Land-Sea Integration. Planners 2024, 40, 89–97. (In Chinese) [Google Scholar]
  48. Li, J. Disaster emergency management in United States and its inspiration to China’s relevant management. J. Nat. Disasters 2006, 15, 6. (In Chinese) [Google Scholar]
  49. Miu, H.; Wang, N. An urban resilience measurement system based on decomposing post-disaster recovery process. J. Nat. Disasters 2021, 30, 10–27. (In Chinese) [Google Scholar] [CrossRef]
  50. Zhao, R.; Fang, C.; Liu, H. Progress and prospect of urban resilience research. Prog. Geogr. 2020, 39, 1717–1731. [Google Scholar] [CrossRef]
  51. Kingma, D.P. Adam: A method for stochastic optimization. arXiv 2014, arXiv:1412.6980. [Google Scholar] [CrossRef]
Figure 1. Framework of research. The arrows within and between each step indicate the sequence of operations. In Step 2, the dashed line represents the Euclidean distance, while the solid lines indicate data flow. Solid arrows denote computational relationships between components. Different colors are used to distinguish different types of data or processes for improved visual clarity.
Land 14 00924 g001
Figure 2. The Pearson correlation coefficient matrix. Note: In the figure, for the sake of clear picture presentation, Typhoon-directed economic losses are abbreviated to TDEL.
Land 14 00924 g002
Figure 3. (a) shows the mutual information (MI) results, while (b) displays the F-statistic results.
Land 14 00924 g003aLand 14 00924 g003b
Figure 4. Comparative analysis of typhoon-directed economic losses and construction land proportion changes for Category 12.0 typhoon: (a) Hainan province; (b) Fujian province. The XXX-Category represents the region, the x.0 represents the wind force levels, and all typhoon events are represented by typhoon.
Land 14 00924 g004
Figure 5. Correlation plot of variation rates in typhoon-directed economic losses and changes in construction land proportion across different typhoon categories for documented events in Hainan Province: (a) Category 8 typhoon; (b) Category 9 typhoon; (c) Category 10 typhoon; (d) Category 11 typhoon; (e) Category 12 typhoon; (f) Category 13 typhoon.
Land 14 00924 g005
Figure 6. Correlation plot of variations in typhoon-directed economic losses and construction land proportion in Fujian province: (a) Category 9 typhoon; (b) Category 12 typhoon.
Land 14 00924 g006
Figure 7. Correlation plot of variations in typhoon-directed economic losses and construction land proportion in Zhejiang Province: (a) Category 9 typhoon; (b) Category 12 typhoon.
Land 14 00924 g007
Figure 8. Correlation plot of variations in typhoon-directed economic losses and construction land proportion in Guangdong Province: (a) Category 8 typhoon; (b) Category 11 typhoon.
Land 14 00924 g008
Figure 9. Distribution of Uncertainty Assessment Results.
Land 14 00924 g009
Figure 10. Schematic diagram of the framework’s final assessment results. The red shading represents the actual loss distribution across provincial administrative regions, while the blue shading indicates the assessed loss distribution. The color intensity reflects the severity of losses, with darker shades corresponding to higher loss levels (Note: This map is based on the standard map No. GS (2024) 0650 downloaded from the Standard Map Service website of the Ministry of Natural Resources. The base map boundary is not modified).
Land 14 00924 g010
Table 1. Description of the dataset.
CategoryVariableDescriptionUnit
Meteorological dataTyphoon numberIdentifier number of the typhoon-
Maximum wind forceMaximum wind force of the typhoon-
Maximum wind speedMaximum wind speed of the typhoonm/s
Disaster impact dataAffected populationNumber of affected people10,000 persons
DeathsNumber of deathspersons
Relocated populationNumber of relocated people10,000 persons
Collapsed housesNumber of collapsed houses10,000 units
Affected areaTotal affected area10,000 hectares
Direct economic lossesDirect economic losses (CPI in 1983)100 million yuan
Socio–economic vulnerabilityCPIConsumer price Index(1983 = 100)
Population densityPopulation densitypersons/km2
GDP per capitaGDP per capita10,000 yuan/person
Land use dataUrbanization rateRate of urbanization-
Urban construction land areaArea of urban construction landkm2
Urban areaTotal urban areakm2
Construction land proportionProportion of construction land%
Note: All monetary values are adjusted using CPI in 1983.
Table 2. Variance Inflation Factors (VIF) for the Features.
FeatureVIF
Typhoon number523.9495
Maximum wind force5.9174
Maximum wind speed5.9636
Affected population (10,000 persons)3.6049
Deaths (persons)3.4113
Relocated population (10,000 persons)2.5887
Collapsed houses (10,000 units)4.0190
Affected area (10,000 hectares)1.8646
Typhoon Directed-economic losses (CPI in 1983) (100 million yuan)2.3933
CPI Consumer Price Index (base year 1983 = 100)134.1705
Population density (persons/km2)196.2581
GDP per capita (10,000 yuan/person)170.6575
Urbanization rate2.7689
Urban construction land area4.1197
Urban area3.6804
Construction land proportion1.6218
Table 3. Construction land proportion.
Actual ValueAssess ValueConfidenceAssess IntervalAffected Area
0.0859990.238724Above 99%[−0.95, 1.42]Neimenggu
1.2755102.872671Below 68%[−7.71, 13.45]Jiangxi
0.0547550.215413Above 99%[−0.94, 1.37]Anhui
2.6831781.130554Above 95%[−1.15, 3.41]Jilin
0.0016210.231469Above 99%[−0.96, 1.43]Yunnan
3.2305167.081117Below 68%[−0.98, 15.15]Zhejiang
2.0087173.412394Above 95%[−0.13, 6.95]Guangdong
5.1185153.766929Above 95%[−0.10, 7.63]Guangdong
0.0486300.217954Above 99%[−0.95, 1.38]Guangxi
0.0332670.243804Above 99%[−1.00, 1.49]Jilin
2.1354260.238536Above 99%[−0.93, 1.41]Hainan
0.0695730.437523Above 99%[−1.27, 2.15]Guangxi
3.7521321.117743Above 95%[−1.36, 3.60]Fujian
0.0831670.233785Above 99%[−0.95, 1.41]Hainan
5.1875134.994113Above 68%[0.36, 9.63]Guangdong
29.52226320.399832Below 68%[7.19, 33.61]Zhejiang
0.2917810.427232Above 99%[−1.15, 2.00]Liaoning
0.0194250.221588Above 99%[−0.93, 1.37]Fujian
13.45779213.363873Below 68%[2.17, 24.55]Guangdong
0.0411880.220396Above 99%[−0.94, 1.38]Guangdong
2.9850753.290345Above 95%[−0.10, 6.68]Guangxi
0.0998400.256749Above 99%[−0.93, 1.45]Zhejiang
Table 4. Non-construction land proportion.
Actual ValueAssess ValueConfidenceAssess IntervalAffected Area
0.0859990.279334Above 99%[−0.41, 0.96]Neimenggu
1.2755102.363345Above 68%[−2.30, 7.03]Jiangxi
0.0547550.286070Above 99%[−0.61, 1.18]Anhui
2.6831781.257801Above 95%[−0.88, 3.39]Jilin
0.0016210.225547Above 99%[−0.34, 0.79]Yunnan
3.2305167.365206Below 68%[−1.45, 16.18]Zhejiang
2.0087173.489299Above 95%[−0.41, 7.39]Guangdong
5.1185152.759948Above 95%[−1.10, 6.62]Guangdong
0.0486300.229537Above 99%[−0.33, 0.79]Guangxi
0.0332670.208982Above 99%[−0.30, 0.72]Jilin
2.1354261.514349Above 95%[−1.15, 4.18]Hainan
0.0695730.683942Above 99%[−0.92, 2.29]Guangxi
3.7521320.758362Above 99%[−1.17, 2.69]Fujian
0.0831670.214693Above 99%[−0.31, 0.74]Hainan
5.1875134.237987Above 68%[−0.37, 8.84]Guangdong
29.52226325.395420Below 68%[10.55, 40.24]Zhejiang
0.2917810.383230Above 99%[−0.64, 1.40]Liaoning
0.0194250.279708Above 99%[−0.60, 1.16]Fujian
13.45779213.664005Below 68%[−0.16, 27.49]Guangdong
0.0411880.217184Above 99%[−0.30, 0.73]Guangdong
2.9850753.599780Above 95%[−0.23, 7.43]Guangxi
0.0998400.209457Above 99%[−0.31, 0.73]Zhejiang
Table 5. Comparison of model performance.
ModelMAEMSER2 Score
XGBoost2.450119.06420.5441
GBDT4.2499156.63070.2442
RF2.467822.22790.4684
LightGBM3.120525.55310.3889
AdaBoost2.17688.80890.7893
MLP1.31945.03960.8795
LSTM1.64845.83410.8126
GRU1.33315.87680.8818
MetaNet+1.962815.06080.6398
TADAM1.888611.74890.7191
DN4++1.46602.25650.8782
UProtoMLP1.01763.42060.9182
Disclaimer/Publisher’s Note: The statements, opinions and data contained in all publications are solely those of the individual author(s) and contributor(s) and not of MDPI and/or the editor(s). MDPI and/or the editor(s) disclaim responsibility for any injury to people or property resulting from any ideas, methods, instructions or products referred to in the content.

