Abstract
Rapid urbanization in semi-arid heritage cities is accelerating land use/land cover (LULC) transitions, with critical implications for local climate regulation, surface energy balance, and environmental sustainability. This study investigates Jaipur, Jodhpur, and Udaipur (Rajasthan, India) between 2018 and 2024 to assess the influence of spatio-temporal dynamics of LULC on urban surface metrics. Multi-temporal satellite datasets were used to derive the index-based built-up index (IBI), surface urban heat island intensity (SUHI), Albedo, urban thermal field variance index (UTFVI), and bare soil index (BSI). The results reveal substantial built-up expansion—most pronounced in Udaipur (+26.7%)—coupled with vegetation loss (up to −23.8% in Jaipur) and progressive albedo decline (Sen’s slope ≈ −0.002 yr−1). These transformations highlight suppressed surface reflectivity and enhanced heat absorption. A key and novel finding is the emergence of a counter-intuitive surface urban cool island (SUCI) effect, whereby urban cores exhibited daytime cooling and nighttime warming relative to rural surroundings. This anomaly is attributed to the rapid heating and poor nocturnal heat retention of bare, sparsely vegetated rural soils, contrasted with the thermal inertia and shading of urban surfaces. By documenting negative SUHI patterns and explicitly linking them to LULC trajectories, this study advances the understanding of urban climate dynamics in semi-arid contexts. The findings underscore the need for climate-sensitive planning—strengthening peri-urban green belts, regulating impervious expansion, and adopting albedo-enhancing construction materials—while safeguarding cultural heritage. More broadly, the study contributes empirical evidence from climatically vulnerable yet culturally significant cities, offering insights relevant to global SUHI research and sustainable urban development.
1. Introduction
Urbanization is transforming landscapes worldwide, often at the cost of vegetation loss, rising surface temperatures, and declining ecosystem services. In rapidly growing cities, the replacement of natural land cover with impervious surfaces alters local energy balances, intensifies land surface temperature (LST), and exacerbates the surface urban heat island (SUHI) effect. For instance, Gogoi et al. (2019) showed that vegetation decline accounted for up to 50% of surface temperature increases in eastern India [1], while Son et al. (2020) demonstrated that urban expansion in San Salvador sharply increased the frequency of areas with LST exceeding 36 °C [2]. Similar concerns have been reported in Accra, Ghana, where urban growth has reduced green spaces and ecosystem services [3] and in Riyadh, where built-up expansion worsened air quality and thermal conditions [4]. These findings affirm that land use/land cover (LULC) transitions are central drivers of local climate stress.
In India, urban expansion is occurring at unprecedented rates, with semi-arid regions facing distinct challenges due to water scarcity, fragile ecosystems, and socio-economic dependence on climate-sensitive sectors [5]. Rajasthan’s heritage-rich cities—Jaipur, Jodhpur, and Udaipur—are unique cases where rapid urbanization intersects with semi-arid climatic stress and cultural conservation needs. These cities experience average annual rainfall of 300–700 mm [6], high summer temperatures often exceeding 45 °C [7], and populations that have grown by more than 20% over the last decade [8]. Their historic cores, dominated by centuries-old built heritage, are particularly vulnerable to air pollution, heat stress, and land conversion. Urban heat dynamics in semi-arid cities exhibit atypical patterns compared to temperate environments. While daytime SUHI often shows warming in urban cores, nighttime SUHI may become negative, with urban areas cooler than surrounding rural zones. Possible drivers include bare soil dominance in rural landscapes, faster radiative cooling of sparsely vegetated surfaces, and irrigation-induced microclimatic effects. However, systematic investigation of such phenomena in semi-arid heritage cities remains limited. Comparative studies, such as Zhou et al. (2021), have demonstrated that SUHI behavior is strongly climate-dependent, underscoring the need for targeted regional analyses [9]. Derdouri et al. (2021) highlighted that SUHI intensity is strongly linked to the rapid expansion of impervious surfaces and vegetation loss, with consistent evidence across global case studies from 2001 to 2020. It further emphasized that integrating spatiotemporal LULC analysis with SUHI quantification provides critical insights for mitigation strategies and urban sustainability planning [10].
Despite extensive work on LULC–SUHI interactions in humid and temperate cities, semi-arid heritage cities remain underexplored. Specifically, (i) integrated assessments linking built-up expansion, bare soil exposure, albedo, and SUHI are scarce; (ii) the drivers of negative SUHI in semi-arid regions remain poorly understood; and (iii) little is known about how these environmental shifts intersect with heritage conservation and urban planning challenges.
To address these gaps, the present study investigates the influence of spatio-temporal dynamics of LULC on urban surface metrics across three semi-arid heritage cities of Rajasthan—Jaipur, Jodhpur, and Udaipur—over the period 2018–2024. Using multi-temporal satellite datasets and remote sensing indices such as the index-based built-up index (IBI), bare soil index (BSI), and albedo, we examine how urban growth and surface modifications influence urban metrics. We hypothesize that (i) built-up expansion is steadily increasing in all three cities, leading to rising imperviousness as reflected in IBI trends; (ii) high bare soil exposure in semi-arid rural surroundings enhances daytime urban warming but accelerates nighttime rural cooling, thereby producing negative SUHI; and (iii) the combined impacts of LULC dynamics and SUHI patterns have significant implications for both environmental sustainability and cultural heritage preservation. Accordingly, the study pursues four interlinked objectives: (1) mapping and validating LULC transitions from 2018 to 2024; (2) quantifying urban growth and surface condition changes using IBI, BSI, and albedo; (3) assessing daytime and nighttime SUHI behavior, with explicit attention to the novel negative nighttime SUHI phenomenon; and (4) interpreting the implications of these dynamics for climate-sensitive urban planning and heritage management in semi-arid cities.
By pursuing these objectives, this study contributes threefold: first, it provides one of the few integrated analyses of LULC, albedo, and SUHI dynamics in semi-arid heritage cities; second, it documents a novel finding of negative nighttime SUHI, revealing unique climate–land interactions in semi-arid settings; and third, it highlights the dual challenge of environmental stress and heritage conservation, offering insights directly relevant to sustainable urban planning and cultural preservation in rapidly expanding cities.
2. Materials and Methods
2.1. Study Area and Data Sources
This study examines Jaipur, Jodhpur, and Udaipur—three semi-arid heritage cities in Rajasthan that represent diverse urban forms and environmental settings (Figure 1). These cities have been selected for their historical significance, ongoing urban expansion, and vulnerability to climatic stress.
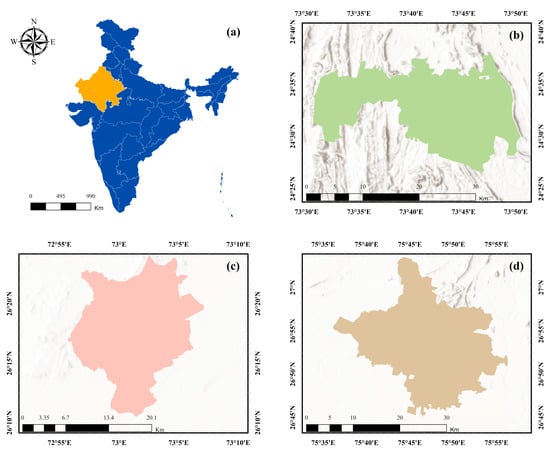
Figure 1.
Location of the study area and spatial extent of the selected semi-arid heritage cities in Rajasthan, India: (a) India map highlighting the state of Rajasthan; (b) administrative boundary of Udaipur city; (c) administrative boundary of Jaipur city; and (d) administrative boundary of Jodhpur city.
Rajasthan largely experiences hot semi-arid to arid climates characterized by hot summers exceeding 40–45 °C, mild winters, and highly variable rainfall [11]. Long-term records (1991–2020) report average annual precipitation of approximately 637 mm in Jaipur and 636 mm in Udaipur, while Jodhpur receives significantly lower rainfall (~323 mm) [12,13]. Between 2011 and 2025, Jaipur’s metropolitan population grew markedly—reaching an estimated 4.4 million in 2025 [14,15]. Similarly, Udaipur’s urban population increased to approximately 630,000 by 2025 [14]. Jodhpur also expanded, with recent estimates projecting a metro population of around 2.33 million [14]. These figures reflect rapid urbanization and growing environmental pressures.
All three cities contain protected heritage precincts: Jaipur’s Walled City and Jantar Mantar (UNESCO) [16], Jodhpur’s Mehrangarh Fort, and Udaipur’s City Palace complex [17]. These zones cover approximately 10–15% of their urban cores and impose constraints on land use and conservation-sensitive development.
To comprehensively capture the spatio-temporal dynamics of land use and environmental change within these heritage cities, the study leveraged a suite of multi-source earth observation datasets and advanced geospatial processing techniques (Table 1). LULC mapping for the years 2018 and 2024 was performed using the Dynamic World v1 dataset, which provides a per-pixel probability-based LULC label at 10 m spatial resolution [18]. IBI were computed using atmospherically corrected Sentinel-2 MSI reflectance data and Landsat Collection 2 Level 2 products, enabling detailed characterization of impervious surfaces and bare soil exposure across urban and peri-urban landscapes. Urban thermal characteristics, including LST, SUH, and the urban thermal field variance index (UTFVI), were estimated using thermal bands from Landsat 8 and Landsat 9 sensors. The overall research methodology is summarized in Figure 2.

Table 1.
Earth observation datasets and sensors used for spatio-temporal land use/land cover (LULC) and urban environmental analysis in Jaipur, Jodhpur, and Udaipur.
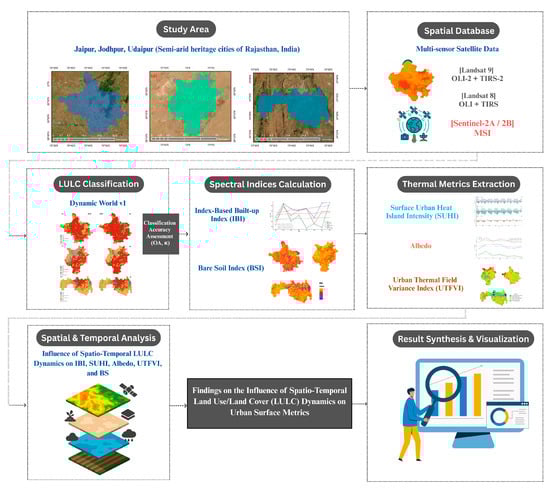
Figure 2.
Flowchart showing the methodological framework adopted to evaluate land use/land cover (LULC) dynamics and their influence on urban thermal and environmental parameters in semi-arid heritage cities.
2.2. Land Use/Land Cover (LULC) Mapping
LULC mapping for the years 2018 and 2024 was performed using the Dynamic World v1 product, which provides a per-pixel probability-based LULC label at 10 m spatial resolution [18]. For each city, the most probable LULC class was assigned to each pixel using the statistical mode, following established best practices (Equation (1)):
Subsequently, the total area of each LULC class was computed by aggregating the surface area of all pixels classified as class i (Equation (2)):
where is the LULC class and is the pixel.
Classification Accuracy and Validation
To validate the Dynamic World v1 classifications, we conducted an independent supervised validation using a stratified random sampling approach, consistent with established practices in LULC accuracy assessment [19,20]. For each city and year, 300 validation points per class (water, trees, grass, shrub/scrub, built-up, and bare land) were randomly generated to ensure balanced representation. Reference labels for these points were assigned through visual interpretation of high-resolution Google Earth imagery (≤1 m) and Sentinel-2 true-color composites, following approaches widely used in recent LULC studies [18]. The samples were independently cross-checked by two interpreters, and disagreements (<5% of points) were resolved through consensus. These reference datasets were then used to construct confusion matrices, from which overall accuracy (OA), producer’s/user’s accuracy, and Cohen’s κ were derived. We quantified map accuracy using overall accuracy, OA—see Equation (1) below—which is the proportion of correctly classified pixels in the confusion matrix:
Class-specific agreement was summarized by producer’s accuracy (recall) and user’s accuracy (precision); both are defined in Equation (4):
Chance-corrected agreement was measured with Cohen’s kappa, introduced in Equation (3), where p0 = OA and pe is the chance agreement from row/column marginals:
Uncertainty on OA was reported as a Wilson 95% binomial confidence interval, given in Equation (4) with z = 1.96:
Annual trends of OA with its 95% CI (Equation (4)) and κ (Equation (3)) are shown in Figure 3, while the 2024 row-normalized confusion matrix with class-wise recall (Equation (2)) is presented in Figure 4.
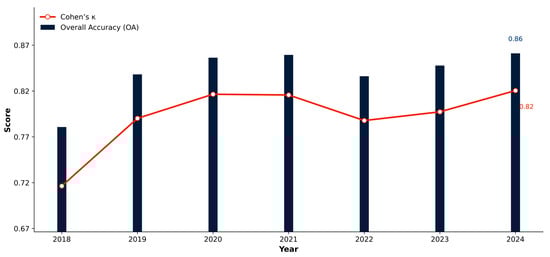
Figure 3.
Annual LULC classification accuracy (2018–2024).
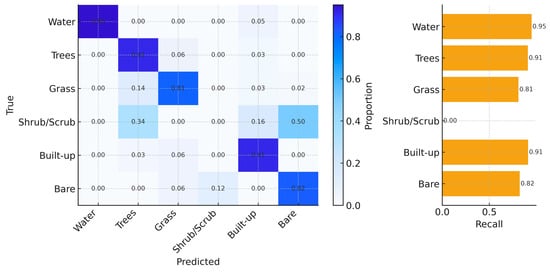
Figure 4.
Confusion matrix of LULC classification showing class-wise accuracy for water, trees, grass, shrub/scrub, built-up, and bare land.
Across all cities combined, OA increased from ~0.78 in 2018 to ~0.86 in 2024, while κ rose from ~0.72 to ~0.82 (Figure 3). Confidence bands around OA are narrow, indicating stable year-to-year performance. Class-wise results for 2024 (Figure 4) show high separability for Water, Built, and Trees (recall ≈ 0.95, 0.94, and 0.91, respectively), moderate performance for Grass (≈0.81), and lower recall for Bare (≈0.84). Shrub/Scrub exhibits the weakest producer’s accuracy (near 0 in 2024), reflecting spectral confusion with Grass and Bare in semi-arid settings and limited reference support. Off-diagonal concentrations in Figure 4 are primarily along the Grass-Bare and Grass-Trees pairs, consistent with seasonal phenology and soil exposure.
2.3. Calculation of Spectral Indices
2.3.1. Bare Soil Index
The detection of bare soil was operationalized through the BSI, utilizing the reflectance values from Sentinel-2’s Blue, Red, Near-Infrared (NIR), and Shortwave-Infrared 1 (SWIR1) bands. The BSI was calculated as described in [21] (Equation (7)):
2.3.2. Index-Based Built-Up Index
Urban built-up intensity was quantified using the IBI, integrating normalized difference and vegetation/water indices as follows (Equation (8)) [3]:
where:
2.4. LST, SUHI, and UTFVI
LST was retrieved from Landsat Collection 2 Level 2 products, using the radiometric scaling specified in the product documentation (Equation (12)):
Surface urban heat island intensity (SUHI)
Rural reference zones were defined as annular buffers extending 10–60 km beyond each city’s administrative boundary, excluding built-up and peri-urban areas to minimize contamination. The 60 km threshold was selected to ensure that rural references remain within the same semi-arid climatic setting of Rajasthan while being sufficiently distant to avoid transitional landscapes. This choice aligns with established SUHI research, where buffers in the range of 50–70 km are commonly applied to balance climatic representativeness and minimize urban influence [22,23,24].
UTFVI was used to quantify intra-urban heat stress (Equation (14)):
3. Results
3.1. Spatio-Temporal Patterns of Land Use and Land Cover Transformation in Jaipur, Jodhpur, and Udaipur
Urbanization in the semi-arid heritage cities of Jaipur, Jodhpur, and Udaipur has markedly transformed their spatial and ecological landscapes over the past decade. LULC transitions, derived from Google’s Dynamic World dataset (2018–2024), demonstrate pronounced conversions from cropland, bare land, and vegetated surfaces into built-up areas (Figure 5). These changes are not merely spatial reallocations of land cover classes but represent deeper alterations in ecological functioning—manifested in modified surface thermal regimes, declining soil quality, and reduced green infrastructure. The systematic expansion of built-up land at the expense of agricultural and natural covers underscores the accelerating pace of urban sprawl in these heritage cities, with significant implications for ecosystem stability, local climate regulation, and the long-term sustainability of urban development.
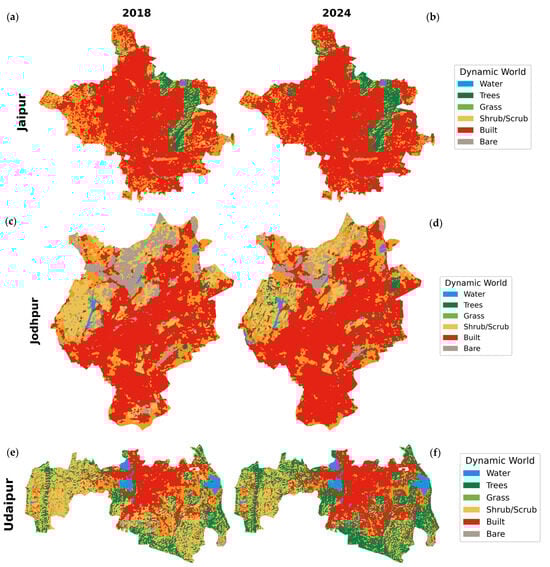
Figure 5.
Land use/land cover (LULC) maps of Jaipur ((a) 2018, (b) 2024), Jodhpur ((c) 2018, (d) 2024), and Udaipur ((e) 2018, (f) 2024).
Quantitatively, the detailed area statistics presented in Table 2 reveal a consistent and substantial increase in built-up area across all three cities over the study period (2018–2024). Jaipur’s built-up area expanded by ~27%, Jodhpur by ~27.6%, and Udaipur by ~26.6%, reflecting a clear trajectory of urban growth. This expansion is mirrored by pronounced reductions in cropland and bare land. For instance, Jaipur’s cropland declined by −48.5% and bare land by −39.7%, while Jodhpur recorded decreases of −48.8% in cropland and −22.5% in bare land. In Udaipur, cropland decreased by −49.6%, bare land by −37.1%, and shrubland by −38.6%, underscoring the scale of land conversion driven by urbanization. Notably, tree cover and water bodies exhibited localized gains (up to +142% and +52.8%, respectively), indicating small-scale ecological recovery or conservation interventions, though insufficient to offset the extensive loss of agricultural and open lands.
Table 2.
Pre- and post-change areas (km2) in land use/land cover (LULC) classes for Jaipur, Jodhpur, and Udaipur between 2018 and 2024.
Table 3 highlights the percentage changes in key LULC categories across the three cities. Built-up areas registered the most striking increases, with Jodhpur expanding by 142.17%, followed by Udaipur (52.78%) and Jaipur (27.15%), underscoring the rapid pace of urban sprawl in semi-arid heritage cities. In contrast, vegetated land categories such as cropland and shrubland exhibited sharp contractions. Jaipur’s cropland and shrubland declined by −39.7% and −35.67%, respectively, while Udaipur showed comparable reductions of −37.09% (cropland) and −38.6% (shrubland). Jodhpur, although experiencing less drastic cropland loss (−3.98%) and shrubland decline (−22.5%), still reflected a significant conversion of natural and semi-natural landscapes. Grassland areas consistently decreased in all three cities (Jaipur: −48.47%, Jodhpur: −48.81%, Udaipur: −49.56%). Meanwhile, water bodies exhibited modest gains, with Udaipur recording the highest increase (26.58%), compared to Jaipur (10.96%) and Jodhpur (13.23%). These trends collectively demonstrate that the expansion of urban surfaces came predominantly at the cost of ecologically supportive land classes, accelerating land transformation and environmental pressures.
Table 3.
Percentage change in major land use/land cover (LULC) classes in Udaipur, Jaipur, and Jodhpur from 2018 to 2024.
Table 4 presents the dynamics of green areas (tree cover, grassland, and shrubland combined) from 2018 to 2024. The results confirm a substantial contraction in overall green cover across all three cities. Jaipur experienced the largest absolute loss, with green areas shrinking from 153.14 km2 in 2018 to 116.75 km2 in 2024 (−36.39 km2; −23.76%). Udaipur recorded a relatively modest decline of −1.73 km2 (−1.94%), indicating comparatively stable green cover despite urban expansion. Jodhpur also witnessed a notable reduction, losing 23.44 km2 (−9.03%) of its green area during the study period. These patterns reveal that while built-up growth was most prominent in Jodhpur, Jaipur faced the sharpest decline in ecological green assets, raising concerns for urban sustainability and resilience.
Table 4.
Changes in total green area (km2) in Jaipur, Jodhpur, and Udaipur from 2018 to 2024.
3.2. Influence of Land Use/Land Cover Dynamics on Urban Build Dynamics
The regression statistics of the IBI provide critical insights into the patterns of urban build dynamics across Jaipur, Jodhpur, and Udaipur (Table 5). Jaipur shows a positive slope (0.000592), indicating a gradual intensification of built-up surfaces. However, the very low R2 value (0.0123) suggests that this trend is weakly explained, implying spatial heterogeneity in the distribution of impervious areas.
Table 5.
Regression parameters of IBI trends for Jaipur, Jodhpur, and Udaipur.
In contrast, Jodhpur exhibits an almost negligible slope (0.000058) with an extremely low R2 (0.0001), suggesting that impervious surface expansion has remained largely static over the study period. This stability indicates limited urban transformation and a slower pace of land-use conversion compared to Jaipur.
Udaipur presents a markedly different scenario, with a negative slope (−0.004243) and the highest explanatory power among the three cities (R2 = 0.2655). This suggests a declining trend in built-up intensity, which may reflect localized re-greening, peri-urban landscape management, or constraints on uncontrolled urban sprawl.
The temporal trajectories of IBI further support these interpretations (Figure 6). Jaipur demonstrates a fluctuating but overall upward trend, consistent with gradual impervious intensification. Jodhpur maintains relative stability, reinforcing its limited urban dynamics. Udaipur, however, shows a consistent downward trend, highlighting a unique pattern where urban expansion pressures are potentially counterbalanced by ecological recovery processes or land-use planning measures.
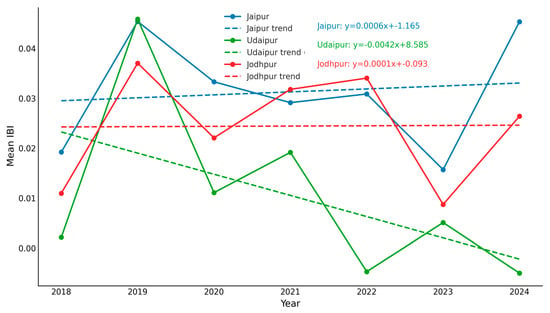
Figure 6.
Temporal trends in Mean IBI for Jaipur, Udaipur, and Jodhpur (2018–2025).
Collectively, the evidence from IBI regression and temporal trends illustrates distinct urban build dynamics: Jaipur is undergoing a dispersed but continuous growth in impervious surfaces, specifically, the built-up area in Jaipur surged, some studies citing an increase from approximately 13.5% to 57.3% between 1993 and 2015 [25]. Jodhpur remains relatively unchanged, and Udaipur reflects a declining built-up intensity, pointing to differentiated urbanization pathways among the three cities.
3.3. Land Use/Land Cover Dynamics and Their Influence on Urban Thermal Regimes
3.3.1. SHUI Dynamics in Semi-Arid Heritage Cities
The LULC transitions between 2018 and 2024 demonstrate that urban expansion has fundamentally altered the thermal environment of semi-arid heritage cities. The replacement of cropland, bare land, and natural vegetation with built-up surfaces reduces evapotranspiration capacity and increases surface heat storage. This shift in land cover composition results in a systematic modification of surface temperature regimes and a clear intensification of the urban–rural thermal gradient (Table 6).
Table 6.
Statistical trend analysis of SUHI intensity for Jaipur, Jodhpur, and Udaipur under day and night conditions.
Figure 7 demonstrates the nonlinear and seasonally dependent nature of SUHI in semi-arid environments, where rural zones frequently exhibit higher daytime surface temperatures than urban cores. This inversion, often referred to as the surface urban cool island (SUCI) effect, arises because rural areas—typically dominated by bare sandy soils and croplands with low moisture retention—heat up rapidly under strong solar insolation. These surfaces have reduced evapotranspiration and limited canopy cover, thereby enhancing sensible heat flux. In contrast, urban areas, despite their impervious surfaces, often display slightly lower daytime LSTs due to factors such as higher thermal inertia, localized shading from buildings and vegetation, and anthropogenic irrigation in certain districts.
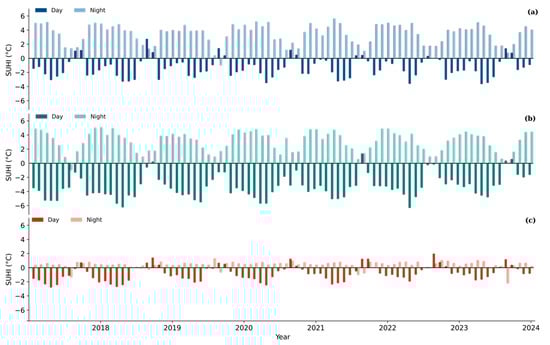
Figure 7.
Day-wise Surface Urban Heat Island intensity (SUHI, °C) trends (2018–2024) for (a) Jaipur, (b) Jodhpur, and (c) Udaipur, showing contrasting daytime and nighttime behavior.
Evidence from multiple arid and semi-arid urban systems confirms this phenomenon. For instance, Zhou et al. (2019) found that nearly 50% of arid cities exhibited daytime SUHI sign reversals, with rural zones warmer than urban cores [22].
Similarly, an investigation in Tehran—a representative semi-arid metropolis—reported maximum daytime urban–rural LST differences of −4 K, which inverted to a positive nighttime SUHI exceeding +3.9 K [26]. These findings validate that in semi-arid landscapes, daytime urban cooling and nighttime heat retention coexist, reflecting the strong influence of land surface characteristics, soil moisture deficits, and vegetation dynamics. Such diurnal asymmetry challenges the conventional SUHI paradigm, underscoring the necessity of accounting for climate zone and land cover context when assessing urban thermal environments.
3.3.2. Albedo Dynamics in Semi-Arid Heritage Cities
The albedo trends derived from Table 7 indicate a consistent declining trajectory across all three heritage cities between 2018 and 2024. Jaipur exhibits only a marginal decrease (Sen’s slope = −0.00053), Jodhpur shows a slightly stronger negative slope (−0.00162), while Udaipur records the most pronounced decline (−0.00199), further supported by a relatively stronger Mann–Kendall statistic (τ = −0.524). Although none of the observed trends are statistically significant (p > 0.05), the directionality suggests a gradual reduction in surface reflectivity, with Udaipur undergoing comparatively more systematic changes, plausibly linked to increasing impervious surfaces and declining vegetative cover.
Table 7.
Trends in mean albedo (2018–2024) across Jaipur, Jodhpur, and Udaipur, showing Sen’s slope, OLS slope, Mann–Kendall (MK) statistics (τ, Z), and p-values.
The temporal dynamics illustrated in Figure 8 reinforce these findings. Udaipur demonstrates a relatively steady and progressive decline in albedo (OLS slope ≈ −0.0025; R2 = 0.35), consistent with urban surface transformation. Jaipur displays interannual variability with a weak negative slope (R2 = 0.03), while Jodhpur maintains near-stable values with minor fluctuations (R2 = 0.07). These contrasting patterns underscore heterogeneity in the pace and intensity of urban landscape changes, with implications for surface energy balance and localized thermal regimes.
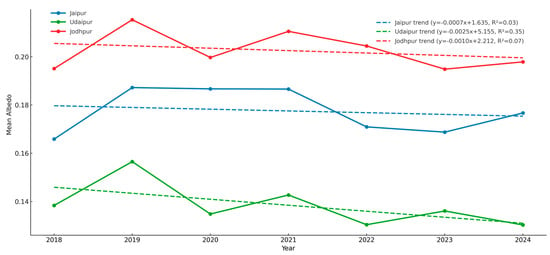
Figure 8.
Temporal trends in mean albedo (2018–2024) for Jaipur, Jodhpur, and Udaipur.
The observed decline in albedo, particularly in Udaipur, aligns with earlier studies that link urbanization and vegetation loss to reduced surface reflectivity and enhanced heat absorption [27]. Previous findings suggest that even modest decreases in albedo can significantly amplify urban heat island intensity, whereas enhancing reflective surfaces may mitigate ambient temperatures by up to 2–2.5 °C [28]. These comparisons validate the present results and highlight the need for albedo-centric interventions in heritage cities facing rapid urban expansion.
3.3.3. Urban Thermal Field Variance Index (UTFVI) Patterns
The UTFVI maps reveal distinct intra-city variability in thermal stress across Jaipur, Jodhpur, and Udaipur (Figure 9). Areas with dense built-up cover register high to extreme thermal stress (UTFVI > 0.400), underscoring how increasing impervious surfaces elevate surface heat—a finding corroborated in studies of rapidly urbanizing cities where UTFVI reflects worsening thermal conditions tied to LULC change [29]. In contrast, peripheral zones with more vegetation or water features exhibit lower stress (UTFVI 0.200–0.400), with green-blue clusters (<0.200) around parks and lakes serving as effective thermal refuges—an established cooling mechanism substantiated in global research on urban heat dynamics [30].
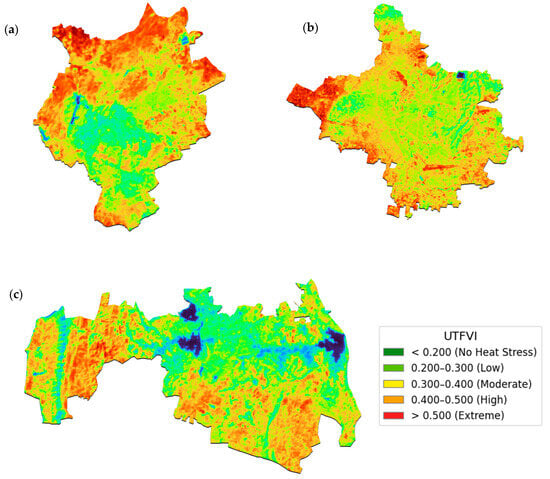
Figure 9.
Spatial distribution of the UTFVI for: (a) Jaipur, (b) Jodhpur, and (c) Udaipur in 2025.
3.4. Influence of Land Use/Land Cover Dynamics on Bare Soil Exposure and Urban Growth
The spatio-temporal dynamics of bare soil exposure, as revealed through the bare soil index (BSI), demonstrate substantial urban-induced surface transformations across Jaipur, Udaipur, and Jodhpur. Figure 10 shows the spatial distribution of BSI, where higher positive values correspond to exposed soil and impervious surfaces, while negative values represent vegetated and moisture-rich areas. The maps highlight a progressive spread of bare and impervious surfaces in the urban cores of all three cities, with more pronounced intensification in Udaipur and Jodhpur compared to Jaipur.
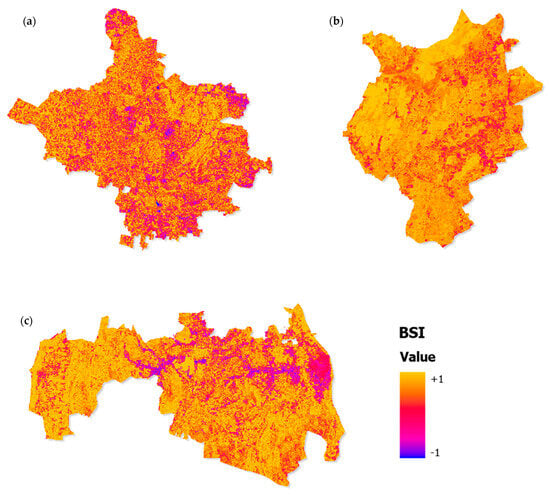
Figure 10.
Spatial distribution of the BSI in Jaipur: (a), Jodhpur (b), and Udaipur (c) for the study period.
The temporal trends presented in Table 8 further confirm these patterns. Udaipur (Sen’s slope = 0.003996; MK τ = 0.714, p = 0.0355) and Jodhpur (Sen’s slope = 0.004148; MK τ = 0.809, p = 0.0163) exhibit statistically significant upward trends in BSI, indicating systematic increases in bare soil exposure and impervious surface expansion. Jaipur, in contrast, shows a weaker and non-significant trend (Sen’s slope = 0.001885; p = 0.2296), reflecting relatively slower transformation of its urban surface composition. The line graph in Figure 10 reinforces these findings, with Jodhpur displaying the steepest positive trajectory (OLS slope = 0.0051, R2 = 0.76) followed by Udaipur (OLS slope = 0.0039, R2 = 0.59), while Jaipur exhibits a modest slope (OLS slope = 0.0017, R2 = 0.51).
Table 8.
Trends in BSI (2018–2024) across Jaipur, Jodhpur, and Udaipur, showing Sen’s slope, OLS slope, Mann–Kendall (MK) statistics (τ, Z), and p-values.
The temporal assessments indicate that Udaipur and Jodhpur are undergoing more rapid surface transformation than Jaipur, driven by accelerated urbanization, infrastructure expansion, and declining vegetative cover (Figure 11). These trends are consistent with LULC dynamics observed in semi-arid heritage cities, where the expansion of built-up areas often occurs at the expense of agricultural and vegetated lands, thereby intensifying surface imperviousness and altering local land–atmosphere interactions.
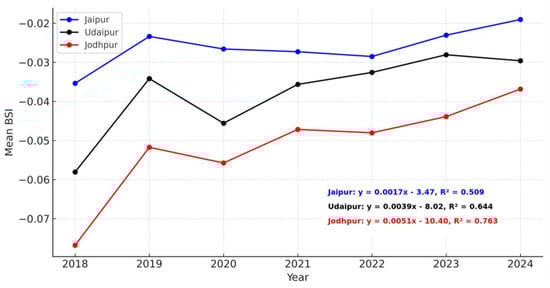
Figure 11.
Temporal trends in BSI for Jaipur, Udaipur, and Jodhpur from 2018 to 2024.
These patterns align with broader findings that the Bare Soil Index effectively captures urban expansion in semi-arid environments. For example, in India’s Raipur city, a strong positive correlation (R2 = 0.64) was observed between land surface temperature and BSI—indicating that increases in bare soil reliably reflect ongoing urban and surface changes [31]. Likewise, spectral studies in arid and semi-arid zones affirm that BSI and related indices are well-suited for detecting built-up and bare land transitions [32]. Consequently, our results mirror established regional trends, underscoring how accelerated urbanization and vegetation loss in Udaipur and Jodhpur are driving more rapid surface transformation than in Jaipur.
4. Discussion
The comprehensive examination of LULC changes between 2018 and 2024 in Jaipur, Jodhpur, and Udaipur reveals a coherent environmental story: urban expansion, as captured by rising IBI, came at the expense of cropland, open land, and vegetation, intensifying imperviousness across these semi-arid heritage cities. This pattern aligns with recent findings by Elgendy et al. (2025), who show that increasing albedo-reducing surfaces—such as paved roads—can significantly elevate surface and ambient temperatures in newly developed regions [33]. However, our study adds nuance by demonstrating several atypical thermal outcomes rooted in rural land degradation.
First, our SUHI analysis reveals counterintuitive daytime cooling and nighttime warming dynamics in urban cores compared to surrounding rural zones. This SUCI effect occurs because bare, dry, and sparsely vegetated semi-arid rural lands heat up more rapidly during the day and lose heat more quickly at night than urban areas, which benefit from higher thermal inertia and localized shading. Similar SUCI responses have been documented in semi-arid cities, where rural surfaces outpace urban warmth during the day [34].
Second, a decline in surface albedo—especially marked in Udaipur—highlights an important thermal dynamic: as vegetative or reflective land covers are replaced by darker built-up surfaces, the land’s ability to reflect solar energy diminishes. This decrease in reflectivity contributes to stronger heat absorption and elevated surface temperatures. Indeed, global-scale research has found that urban expansion between 2001 and 2018 significantly reduced Earth’s albedo, generating a small but measurable warming effect; projections indicate this trend will intensify without mitigation [35]. On a local scale, similar studies emphasize how urbanization drastically impacts regional albedo, particularly in arid and semi-arid regions where built materials typically replace lighter, vegetation-rich surfaces [36,37,38].
Third, rising values of the UTFVI across these cities reflect broader thermal stress, particularly in urban fringes devoid of protective greenery—contrasting sharply with low-stress zones near Udaipur’s lakes and forested buffers. This spatial heterogeneity speaks to the powerful oasis effect, wherein natural water and vegetative systems provide localized cooling in semi-arid environments [30], reinforcing the importance of preserving blue-green infrastructure.
Finally, the significant increases in the BSI, particularly in Jodhpur and Udaipur, further signal increasing land exposure and sealing. Such transformation exacerbates rural heat retention and likely intensifies SUCI behavior, highlighting soil exposure as a pivotal mediator in urban–rural thermal exchanges.
Taken together, these findings paint a complex but internally consistent picture: LULC changes in these heritage cities serve as a primary driver of thermal and environmental dynamics—manifesting through decreased reflectivity, increased imperviousness, rural overheating, and elevated thermal stress. These patterns both align with and expand upon established knowledge in urban climatology and remote sensing in semi-arid contexts.
For practical urban and heritage management, our results suggest a blended strategy. Enhancing albedo via reflective pavements and cool roofs, increasing vegetative cover, and preserving water bodies can help restore energy balance. Field studies suggest such interventions can produce local cooling of up to 1 °C per 0.6 albedo increase [34,35]; recent urban modeling further demonstrates that combining green infrastructure with reflective surfaces can reduce ambient temperatures by 0.17–0.33 °C, offering cost-effective mitigation in rapidly developing cities like Ahmedabad [39].
In line with European frameworks that integrate ecosystem services into spatial planning, such as the MAES-based methodology applied in Madrid, our results highlight the value of indices like BSI and SUHI as operational tools for embedding ecological information directly into municipal planning processes. By correlating LULC-driven thermal stress with ecological capacity, the study reinforces the need for regional and local planning instruments in semi-arid heritage cities that balance urban growth with resilience-building measures [40].
5. Conclusions
This study demonstrates that land use/land cover (LULC) dynamics are central to shaping the environmental challenges of semi-arid heritage cities. Between 2018 and 2024, Jaipur, Jodhpur, and Udaipur experienced substantial built-up expansion—up to ~27%—accompanied by sharp declines in cropland and bare land, leading to fragmentation of peri-urban ecosystems and growing ecological stress. These transitions altered the surface energy balance, reduced reflectivity, and contributed to the emergence of atypical thermal responses. Contrary to the conventional urban heat island paradigm, all three cities exhibited predominantly negative SUHI values, where degraded rural zones warmed more than urban cores. This finding underscores the importance of considering rural land degradation alongside urban expansion when assessing thermal environments.
The BSI proved particularly valuable, identifying exposed soils as reliable early indicators of imminent impervious surface expansion and associated thermal stress. This highlights the potential of BSI as a monitoring tool that can support proactive interventions by municipal authorities.
From an applied perspective, the findings point to several operational recommendations. Establishing peri-urban green belts can help restore ecological buffers and regulate heat exchange. Expanding urban tree cover and reforestation programs within city cores and surrounding areas would counteract vegetation loss and provide long-term cooling benefits. Incorporating reflective and albedo-enhancing materials in urban construction can mitigate local warming, while annual BSI monitoring within city planning frameworks can act as an early-warning mechanism for uncontrolled urban sprawl. Embedding such measures in municipal policies, land-use regulations, and master plans would ensure that heritage conservation and environmental sustainability are addressed together.
At the same time, the study has several limitations. The analysis relies on medium-resolution satellite imagery (10–30 m), which may miss fine-scale urban heterogeneity such as narrow streets, small courtyards, or fragmented vegetation patches. Future research could address this by incorporating very high-resolution satellite data (e.g., WorldView, PlanetScope, Gaofen), unmanned aerial vehicle (UAV) imagery, or LiDAR-based datasets, which are better suited to capturing micro-scale urban features. Seasonal variability was not fully captured, potentially influencing SUHI interpretation, and classification uncertainties—particularly confusion between shrub/scrub and bare land—remain a challenge. These limitations suggest the need for future work that combines higher-resolution datasets with medium-resolution time series, integrates seasonal analyses, and includes field-based validation to enhance robustness and policy relevance.
In conclusion, the study emphasizes that LULC monitoring, when combined with operational planning measures such as peri-urban green belt protection, targeted reforestation, and systematic BSI tracking, can provide actionable strategies to manage urban growth and safeguard the cultural and environmental resilience of semi-arid heritage cities.
Author Contributions
Conceptualization, S.S. and R.A.; methodology, S.S. and R.A.; software, S.S.; validation, S.S., R.A. and A.K.J.; formal analysis, S.S.; investigation, S.S. and M.Z.; resources, R.A., W.S.A. and M.Z.; data curation, S.S.; writing—original draft preparation, S.S.; writing—review and editing, R.A., A.K.J., W.S.A. and M.Z.; visualization, S.S. and A.K.J.; supervision, R.A.; project administration, R.A. and M.Z.; funding acquisition, R.A. All authors have read and agreed to the published version of the manuscript.
Funding
This research was funded by Princess Nourah bint Abdulrahman University Researchers Supporting Project number (PNURSP2025R680), Princess Nourah bint Abdulrahman University, Riyadh, Saudi Arabia.
Data Availability Statement
The data used for this research are included in tables and charts within the manuscript. More detailed data will be available on reasonable request from the corresponding author.
Acknowledgments
The authors extend their appreciation to Princess Nourah bint Abdulrahman University Researchers Supporting Project number (PNURSP2025R680), Princess Nourah bint Abdulrahman University, Riyadh, Saudi Arabia. The authors gratefully acknowledge the financial support provided by Poornima University, Jaipur, through the Seed Money Grant for Research (Sanction Letter No. PU/SMP/2024-25/10). The seed funding for the project titled “Strategic Mapping and Enhancement of Air Quality in Jaipur through Targeted Urban Plantation for Effective Carbon Sequestration” enabled the advancement of data collection, analysis, and overall research activities presented in this study. The authors also thank the Seed Money Project Evaluation Committee for their positive feedback and support. The authors would also like to acknowledge Zoe Kanetaki for the proofreading of this manuscript.
Conflicts of Interest
The authors declare no conflicts of interest.
Abbreviations
| LULC | Urban Land Use and Land Cover Dynamics |
| IBI | Index-Based Built-up Index |
| SUHI | Surface Urban Heat Island Intensity |
| UTFVI | Urban Thermal Field Variance Index |
| UNESCO | United Nations Educational, Scientific and Cultural Organization |
| LST | Land Surface Temperature |
| NCR | National Capital Region |
| SUH | Surface Urban Heat |
References
- Gogoi, P.P.; Vinoj, V.; Swain, D.; Roberts, G.; Dash, J.; Tripathy, S. Land use and land cover change effect on surface temperature over Eastern India. Sci. Rep. 2019, 9, 8859. [Google Scholar] [CrossRef]
- Son, N.; Chen, C. Urban expansion and its impacts on local temperature in San Salvador, El Salvador. Urban Clim. 2020, 32, 100617. [Google Scholar] [CrossRef]
- Puplampu, D.A.; Boafo, Y.A. Exploring the impacts of urban expansion on green spaces availability and delivery of ecosystem services in the Accra metropolis. Environ. Chall. 2021, 5, 100283. [Google Scholar] [CrossRef]
- Alajizah, S.M.; Altuwaijri, H.A. Assessing the Impact of Urban Expansion on the Urban Environment in Riyadh City (2000–2022) Using Geospatial Techniques. Sustainability 2024, 16, 4799. [Google Scholar] [CrossRef]
- Elsaidy, A.; Yimer, E.A.; Mogheir, Y.; Huysmans, M.; Villani, L.; van Griensven, A. Groundwater drought and anthropogenic amplifiers: A review of assessment and response strategies in arid and semi-arid areas. Sci. Total Environ. 2025, 978, 179406. [Google Scholar] [CrossRef] [PubMed]
- Sharma, S.K.; Sharma, D.P.; Sharma, M.K.; Gaur, K.; Manohar, P.; Malinowski, M.T. Trend Analysis of Temperature and Rainfall of Rajasthan, India. J. Probab. Stat. 2021, 2021, 6296709. [Google Scholar] [CrossRef]
- Sharma, A.; Sharma, D.; Panda, S.; Dubey, S.K.; Pradhan, R.K. Investigation of temperature and its indices under climate change scenarios over different regions of Rajasthan state in India. Glob. Planet. Chang. 2018, 161, 82–96. [Google Scholar] [CrossRef]
- Pareek, D.K. Population Structural Changes and It’s Impact on Economic Growth in Rajasthan. Int. J. Multidiscip. Res. Sci. Eng. Technol. Manag. 2022, 9, 6. [Google Scholar]
- Zhou, Z.; Majeed, Y.; Naranjo, G.D.; Gambacorta, E.M. Assessment for crop water stress with infrared thermal imagery in precision agriculture: A review and future prospects for deep learning applications. Comput. Electron. Agric. 2021, 182, 106019. [Google Scholar] [CrossRef]
- Derdouri, A.; Wang, R.; Murayama, Y.; Osaragi, T. Understanding the Links between LULC Changes and SUHI in Cities: Insights from Two-Decadal Studies (2001–2020). Remote Sens. 2021, 13, 3654. [Google Scholar] [CrossRef]
- Chauhan, S.; Jethoo, A.S.; Varshney, V. Comprehensive diurnal thermal characterization of agro-climatic zones in Rajasthan using remote sensing techniques and time-specific observations. Remote Sens. Lett. 2025, 16, 842–855. [Google Scholar] [CrossRef]
- Climate Rajasthan: Temperature, Climate Graph, Climate Table for Rajasthan. Available online: https://en.climate-data.org/asia/india/rajasthan-739/ (accessed on 21 August 2025).
- Sharma, R. Meteorological Centre Jaipur. Available online: https://epubs.icar.org.in/index.php/JISSS/article/view/128133 (accessed on 6 September 2025).
- Jaipur, India Metro Area Population (1950–2025)|MacroTrends’. Available online: https://www.macrotrends.net/global-metrics/cities/21280/jaipur/population?utm_source=chatgpt.com (accessed on 21 August 2025).
- Maurya, N.K.; Rafi, S.; Shamoo, S. Land use/land cover dynamics study and prediction in jaipur city using CA markov model integrated with road network. GeoJournal 2022, 88, 137–160. [Google Scholar] [CrossRef]
- UNESCO World Heritage Centre. The Jantar Mantar, Jaipur. UNESCO World Heritage Centre. Available online: https://whc.unesco.org/en/list/1338/ (accessed on 21 August 2025).
- UNESCO World Heritage Centre. Hill Forts of Rajasthan. UNESCO World Heritage Centre. Available online: https://whc.unesco.org/en/list/247/ (accessed on 21 August 2025).
- Brown, C.F.; Brumby, S.P.; Guzder-Williams, B.; Birch, T.; Hyde, S.B.; Mazzariello, J.; Czerwinski, W.; Pasquarella, V.J.; Haertel, R.; Ilyushchenko, S.; et al. Dynamic World, Near real-time global 10 m land use land cover mapping. Sci. Data 2022, 9, 251. [Google Scholar] [CrossRef]
- Congalton, R.G.; Green, K. Assessing the Accuracy of Remotely Sensed Data, 3rd ed.; Taylor & Francis Group, CRC Press: Boca Raton, FL, USA, 2019. [Google Scholar]
- Olofsson, P.; Foody, G.M.; Stehman, S.V.; Woodcock, C.E. Making better use of accuracy data in land change studies: Estimating accuracy and area and quantifying uncertainty using stratified estimation. Remote Sens. Environ. 2013, 129, 122–131. [Google Scholar] [CrossRef]
- Nguyen, C.T.; Chidthaisong, A.; Diem, P.K.; Huo, L.-Z. A Modified Bare Soil Index to Identify Bare Land Features during Agricultural Fallow-Period in Southeast Asia Using Landsat 8. Land 2021, 10, 231. [Google Scholar] [CrossRef]
- Liu, Z.; Ye, R.; Yang, Q.; Hu, T.; Liu, Y.; Chakraborty, T.; Liao, Z. Identification of surface urban heat versus cool islands for arid cities depends on the choice of urban and rural definitions. Sci. Total Environ. 2024, 951, 175631. [Google Scholar] [CrossRef]
- Peng, S.; Piao, S.; Ciais, P.; Friedlingstein, P.; Ottle, C.; Bréon, F.-M.; Nan, H.; Zhou, L.; Myneni, R.B. Surface Urban Heat Island Across 419 Global Big Cities. Environ. Sci. Technol. 2011, 46, 696–703. [Google Scholar] [CrossRef]
- Zhou, D.; Zhao, S.; Zhang, L.; Sun, G.; Liu, Y. The footprint of urban heat island effect in China. Sci. Rep. 2015, 5, 11160. [Google Scholar] [CrossRef]
- Jalan, S.; Sharma, K. Spatio-temporal Assessment of Land Use/Land Cover Dynamics and Urban Heat Island of Jaipur City using Satellite Data. ISPRS-Int. Arch. Photogramm. Remote Sens. Spat. Inf. Sci. 2014, XL-8, 767–772. [Google Scholar] [CrossRef]
- Han, L.; Lu, L.; Fu, P.; Ren, C.; Cai, M.; Li, Q. Exploring the seasonality of surface urban heat islands using enhanced land surface temperature in a semi-arid city. Urban Clim. 2023, 49, 101455. [Google Scholar] [CrossRef]
- Morini, E.; Touchaei, A.G.; Castellani, B.; Rossi, F.; Cotana, F. The Impact of Albedo Increase to Mitigate the Urban Heat Island in Terni (Italy) Using the WRF Model. Sustainability 2016, 8, 999. [Google Scholar] [CrossRef]
- Macintyre, H.; Heaviside, C. Potential benefits of cool roofs in reducing heat-related mortality during heatwaves in a European city. Environ. Int. 2019, 127, 430–441. [Google Scholar] [CrossRef] [PubMed]
- Article-5-vol-34-2-2024-GEOREVIEW. Available online: https://georeview.usv.ro/article-05-vol-34-2-2024/ (accessed on 23 August 2025).
- Moisa, M.B.; Gemeda, D.O. Assessment of urban thermal field variance index and thermal comfort level of Addis Ababa metropolitan city, Ethiopia. Heliyon 2022, 8, e10185. [Google Scholar] [CrossRef] [PubMed]
- Guha, S.; Govil, H.; Mukherjee, S. Long-Term Evaluation of Land Surface Temperature with Bare Surface Index and Surface Vegetation Index: A Case Study of a Central Indian City. Pap. Appl. Geogr. 2023, 9, 425–441. [Google Scholar] [CrossRef]
- Rasul, A.; Balzter, H.; Ibrahim, G.R.F.; Hameed, H.M.; Wheeler, J.; Adamu, B.; Ibrahim, S.; Najmaddin, P.M. Applying Built-Up and Bare-Soil Indices from Landsat 8 to Cities in Dry Climates. Land 2018, 7, 81. [Google Scholar] [CrossRef]
- Elgendy, D.; Tolba, O.; Kamel, T. The impact of increasing urban surface albedo on outdoor air and surface temperatures during summer in newly developed areas. Sci. Rep. 2025, 15, 25165. [Google Scholar] [CrossRef]
- Haashemi, S.; Weng, Q.; Darvishi, A.; Alavipanah, S.K. Seasonal Variations of the Surface Urban Heat Island in a Semi-Arid City. Remote Sens. 2016, 8, 352. [Google Scholar] [CrossRef]
- Ouyang, Z.; Sciusco, P.; Jiao, T.; Feron, S.; Lei, C.; Li, F.; John, R.; Fan, P.; Li, X.; Williams, C.A.; et al. Albedo changes caused by future urbanization contribute to global warming. Nat. Commun. 2022, 13, 3800. [Google Scholar] [CrossRef]
- Tang, R.; Zhao, X.; Zhou, T.; Jiang, B.; Wu, D.; Tang, B. Assessing the Impacts of Urbanization on Albedo in Jing-Jin-Ji Region of China. Remote Sens. 2018, 10, 1096. [Google Scholar] [CrossRef]
- Shahfahad; Talukdar, S.; Naikoo, M.W.; Rihan, M.; Mohammad, P.; Rahman, A. Seasonal dynamics of land surface temperature and urban thermal comfort with land use land cover pattern in semi-arid Indian cities: Insights for sustainable Urban Management. Urban Clim. 2024, 57, 102105. [Google Scholar] [CrossRef]
- Krayenhoff, E.S.; Voogt, J.A. Impacts of Urban Albedo Increase on Local Air Temperature at Daily–Annual Time Scales: Model Results and Synthesis of Previous Work. J. Appl. Meteorol. Clim. 2010, 49, 1634–1648. [Google Scholar] [CrossRef]
- Large Parks, Reflective Spaces Can Beat Urban Heat: Study|Ahmedabad News-Times of India’. Available online: https://timesofindia.indiatimes.com/city/ahmedabad/large-parks-reflective-spaces-can-beat-urban-heat-study/articleshow/123173409.cms (accessed on 22 August 2025).
- Hernández, R.C.; Camerin, F. Assessment of ecological capacity for urban planning and improving resilience in the European framework. Cuad. Investig. Geogr. 2023, 49, 119–142. [Google Scholar] [CrossRef]


Disclaimer/Publisher’s Note: The statements, opinions and data contained in all publications are solely those of the individual author(s) and contributor(s) and not of MDPI and/or the editor(s). MDPI and/or the editor(s) disclaim responsibility for any injury to people or property resulting from any ideas, methods, instructions or products referred to in the content. |
© 2025 by the authors. Licensee MDPI, Basel, Switzerland. This article is an open access article distributed under the terms and conditions of the Creative Commons Attribution (CC BY) license (https://creativecommons.org/licenses/by/4.0/).