Article

Landcover Change in Tigray’s Semi-Arid Highlands (1935–2020): Implications for Runoff and Channel Morphology

1
Department of Geography, Ghent University, 9000 Gent, Belgium
2
College of Earth, Ocean and Atmospheric Sciences, Oregon State University, Corvallis, OR 97331, USA
3
Department of Geography and Environmental Studies, Mekelle University, Mekelle P.O. Box 231, Ethiopia
4
Water and Climate Research Group, Vrije Universiteit Brussel, 1050 Brussels, Belgium
5
Gembloux Agro-Bio Tech, Université de Liège, 5030 Gembloux, Belgium
6
Department of Soil Science and Land Resources, Universitas Padjadjaran, Bandung 45363, Indonesia
*
Author to whom correspondence should be addressed.
Land 2025, 14(9), 1897; https://doi.org/10.3390/land14091897
Submission received: 29 July 2025 / Revised: 10 September 2025 / Accepted: 16 September 2025 / Published: 17 September 2025

Abstract

This study investigates how landcover change between 1935 and 2020 have shaped hydrological responses in the semi-arid highlands of Tigray, Ethiopia. Focusing on the Tsili catchment (27.5 km2), it examines links between landcover change, drainage network evolution, and river channel width under conditions of population growth and climate variability. Landcover and drainage maps were derived from historical aerial photographs and satellite imagery for four time steps, and surface runoff was simulated using the SWAT model with uniform meteorological forcing to isolate landcover effects. Results show a 37.6% increase in cropland and substantial declines in shrubland (−29.3%) and forest (−10.1%). River channel width at the outlet widened from 7.5 to 10.5 m, while drainage density increased 1.5-fold. These physical changes aligned with modelled increases in surface runoff. Strong correlations were found between runoff, channel width, drainage density, and landcover types. The findings highlight that cropland expansion—at the expense of natural vegetated land—has intensified runoff and erosion risks. As climate change is expected to bring more intense rainfall to East Africa, this underscores the need for land management strategies that reduce hydrological connectivity and support sustainable agriculture in data-scarce regions.

1. Introduction

Throughout history, agricultural expansions have often occurred at the expense of forests, grasslands, steppes and savannas [1]. At the core of these changes lies the high and growing demand for food and natural resources driven by increasing human populations and consumption rates per capita [2,3]. Agricultural expansion is recognized as one of the main drivers of landcover change [4]. Landcover refers to the observed physical and biological surface features of the earth, such as vegetation or human-made structures [5]. Of course, other causes for landcover changes can arise from a complex interplay of social, political, economic, cultural and biophysical factors.
Tigray, the northernmost regional state of Ethiopia, is characterized by highlands and a semi-arid climate with a highly seasonal rainfall pattern. Cropland, villages, grassland and shrubland are the common landcover types in the northern Ethiopian Highlands [6]. However, gradual human population growth has forced people to expand their cropland area at the expense of shrubland [7,8]. In Tigray, these landcover changes, combined with steep slopes and intense rainfall events, have led to high runoff responses, triggering severe soil erosion and land degradation [9,10]. Tigray has also been affected by desertification due to the combination of anthropogenic activities, climate factors and unsustainable use of natural resources [11].
Landcover change affects runoff response and other hydrological processes, ultimately influencing the hydrological connectivity of the landscape, i.e., the physical transfer of water from headwaters to downstream areas, generating runoff response [12,13] and subsurface flows [14]. Hydrological connectivity has become a widely used conceptual framework in geomorphology to better understand the movement of water and sediment within landscapes [15], since the hydrological response of a catchment is highly dependent on its complex, structural and topological characteristics of a landscape [16]. Landcover changes impact the structural connectivity in catchments [15], changing their structural configuration and spatial distribution of vegetation and other landcover types [14]. Through the reshaping of this structural configuration, landcover changes influence and regulate key hydrological processes like infiltration, surface and subsurface flows and evapotranspiration. The presence or absence of vegetation plays a major role in this [11]. Runoff response is usually limited in vegetated areas as plant roots enhance water infiltration in the soil, and canopies intercept rainfall, making it available for evaporation [17,18,19,20,21].
In semi-arid montane regions, the combined effects of climate change and landcover changes are particularly acute. These areas, like Tigray, face severe consequences from climate variability, including erratic rainfall and more intense droughts and floods [7,10,22,23,24,25]. Understanding hydrological processes is crucial to safeguard overall human well-being, food and water security, and other vital ecosystem services [26]. Such hydrological insights are essential for the effective development of regional and local climate adaptation strategies, as well as for promoting sustainable agricultural practices.
Despite its importance, the interplay between landcover change and rainfall variability on semi-arid hydrologic regimes remains under-researched, especially over longer timeframes. Most studies focusing on landcover change driven by agricultural expansion, urbanization, and deforestation in Africa’s semi-arid and arid regions have shown significant impacts on surface runoff and river channel morphology [27,28]. However, due to data scarcity, many of these studies examine only the past 40 years, as they rely primarily on satellite imagery [3,4,24,25]. Data scarcity remains a major challenge in hydrological research in these regions, largely due to remoteness and limited accessibility [29,30]. Furthermore, the available data often lack sufficient spatial and temporal resolution [31], hampering accurate analysis and modelling of complex hydrological responses in vulnerable semi-arid montane areas, where hydrological connectivity is high.
This study had three main objectives: (i) To assess long-term changes in landcover and drainage network configuration in the Tsili catchment from 1935 to 2020; (ii) To evaluate the influence of landcover change on hydrological processes, particularly surface runoff and gully development, under consistent rainfall conditions; (iii) To examine whether observed changes in river channel width can serve as a proxy for hydrological responses in data-scarce, semi-arid environments.
These objectives lead to the following key research questions:
  • What are the magnitude and spatial patterns of changes in landcover and drainage network characteristics in the Tsili catchment over the past 85 years?
  • What is the relationship between landcover change and hydrological response, including surface runoff, gully formation, and drainage network expansion?
  • Can spatial variations in river channel width reflect broader hydrological changes, and thus support runoff modelling and interpretation in regions with limited field data?

2. Materials and Methods

2.1. The Tsili Catchment

Located in the northern Ethiopian Highlands in the Tigray region, the study area includes the Tsili Escarpment and the lowland valley northwest of it, all situated along the Tembien-Gheralta mountain range (Figure 1a). The catchment covers an area of 27.5 km2 and is part of the Weri’i Basin that drains to the Tekeze River. Elevation ranges from 1630 to 2676 m above sea level (a.s.l.). Slope gradients vary from 0 to 13° in the valley and on the pediplains, and from 37 to 68° on the escarpment (Figure 1b,c).
In the valley, the geological unit is the Adigrat Sandstone (Table 1). The escarpment is principal formed by the Antalo Limestone, with the Amba Aradam Formation occurring at the top of the ridge [32]. The highest parts are formed by flood basalts of Mesozoic age [33,34,35]. Different lithologies and their corresponding geomorphologic units are linked to distinct soil units. The soil map of the nearby Geba catchment, prepared by Nyssen et al. [8], was used to infer soil units based on similarities in elevation, land systems, and geological structure (Table 1).
The regional climate is classified as a complex tropical montane climate [8]. Intra-annual rainfall variability is marked by a single dominant rainy season from June to September, known locally as kiremt, with rainfall peaking in July and August. A minor rainfall period in April and May, referred to as belg, is less pronounced and highly variable. While earlier explanations attributed the seasonal rainfall pattern to the northward migration of the Intertropical Convergence Zone (ITCZ), this paradigm cannot be substantiated in the context of East Africa’s equatorial regions [37,38]. Instead, the highlands of East Africa generate mesoscale convective systems that move westward across the equator. Additionally, large-scale phenomena like the Madden-Julian Oscillation and vertical circulation cells over the Indian Ocean influence the timing and intensity of seasonal rainfall [37,38]. In Hagere Selam, located approximately 8 km south of the Tsili catchment, the average annual precipitation is 778 mm, with a mean annual temperature of 13.3 °C, including an average daily minimum of 10.9 °C and maximum of 22.0 °C [39].

2.2. Landcover and Drainage Network Mapping

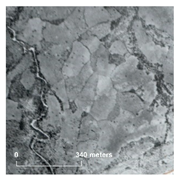
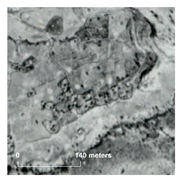
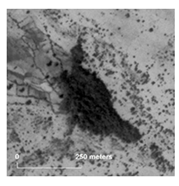
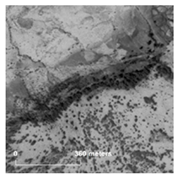
Landcover units and the drainage network of the Tsili catchment were digitized on-screen using aerial photographs from 1935, 1964, and 1967 (approx. scale 1:12,000–1:20,000) and satellite images available through Google Earth [40] (Table 2). Sample sections of the photographs and their visual interpretation in terms of landcover classes are presented in Appendix A.
The 1930s aerial photographs are part of a large historical archive [41]. The 1930s photographs were scanned at 600 dpi, producing ortho-mosaics with the highest spatial resolution of 0.9 m; aerial photographs from the 1960s and 1994 were scanned at 400 dpi, yielding a spatial resolution of 1.6 m [42]. All aerial photographs were georeferenced based on a georeferenced 1994 orthophotomosaic [42] using QGIS Desktop version 3.18.2 [43] with the Thin Plate Spline method. Ground control points (GCPs) were selected from recognizable relief features and stable anthropogenic landmarks, pathways, and hydrological features. Due to the high number of GCPs (n = 210 ± 91), the RMSE for the georeferenced images was consistently less than 0.2 m.
Table 2. Summary of aerial and satellite imagery used in the study, including time periods, image types, acquisition dates, and data sources.
SourceDate of AcquisitionTypePeriod
Nyssen et al. [44];2 November 1935Aerial1930s
Ethiopian Mapping Authority31 January 1964
16 December 1967
Aerial1960s
Ethiopian Mapping Authority1994Aerial1990s
Google Earth [40]25 September 2020Satellite2020s
Landcover classes were classified as forest, shrubland, grassland, cropland, or village. Forests were identified as any dense agglomerations of trees. Fields with predominantly shrubs were classified as shrubland, even though patches of grass and trees could still occur within. Grasslands predominantly consisted of grass cover. Areas with clear plot structures and/or boundaries, such as stone bunds, were mapped as cropland. Villages were low-density populated areas where houses formed an agglomeration, together with some small private areas and common grounds. When two landcover classes occurred intermixed—for example, some trees in a grassland area—the area was classified according to the dominant landcover class forming the matrix. The drainage network was mapped based on visible seasonal rivers and gully patterns. A persistence analysis was conducted following the methodology described by Pontius et al. [45], and the results were used to create a Sankey diagram.

2.3. River Channel Width Measurement

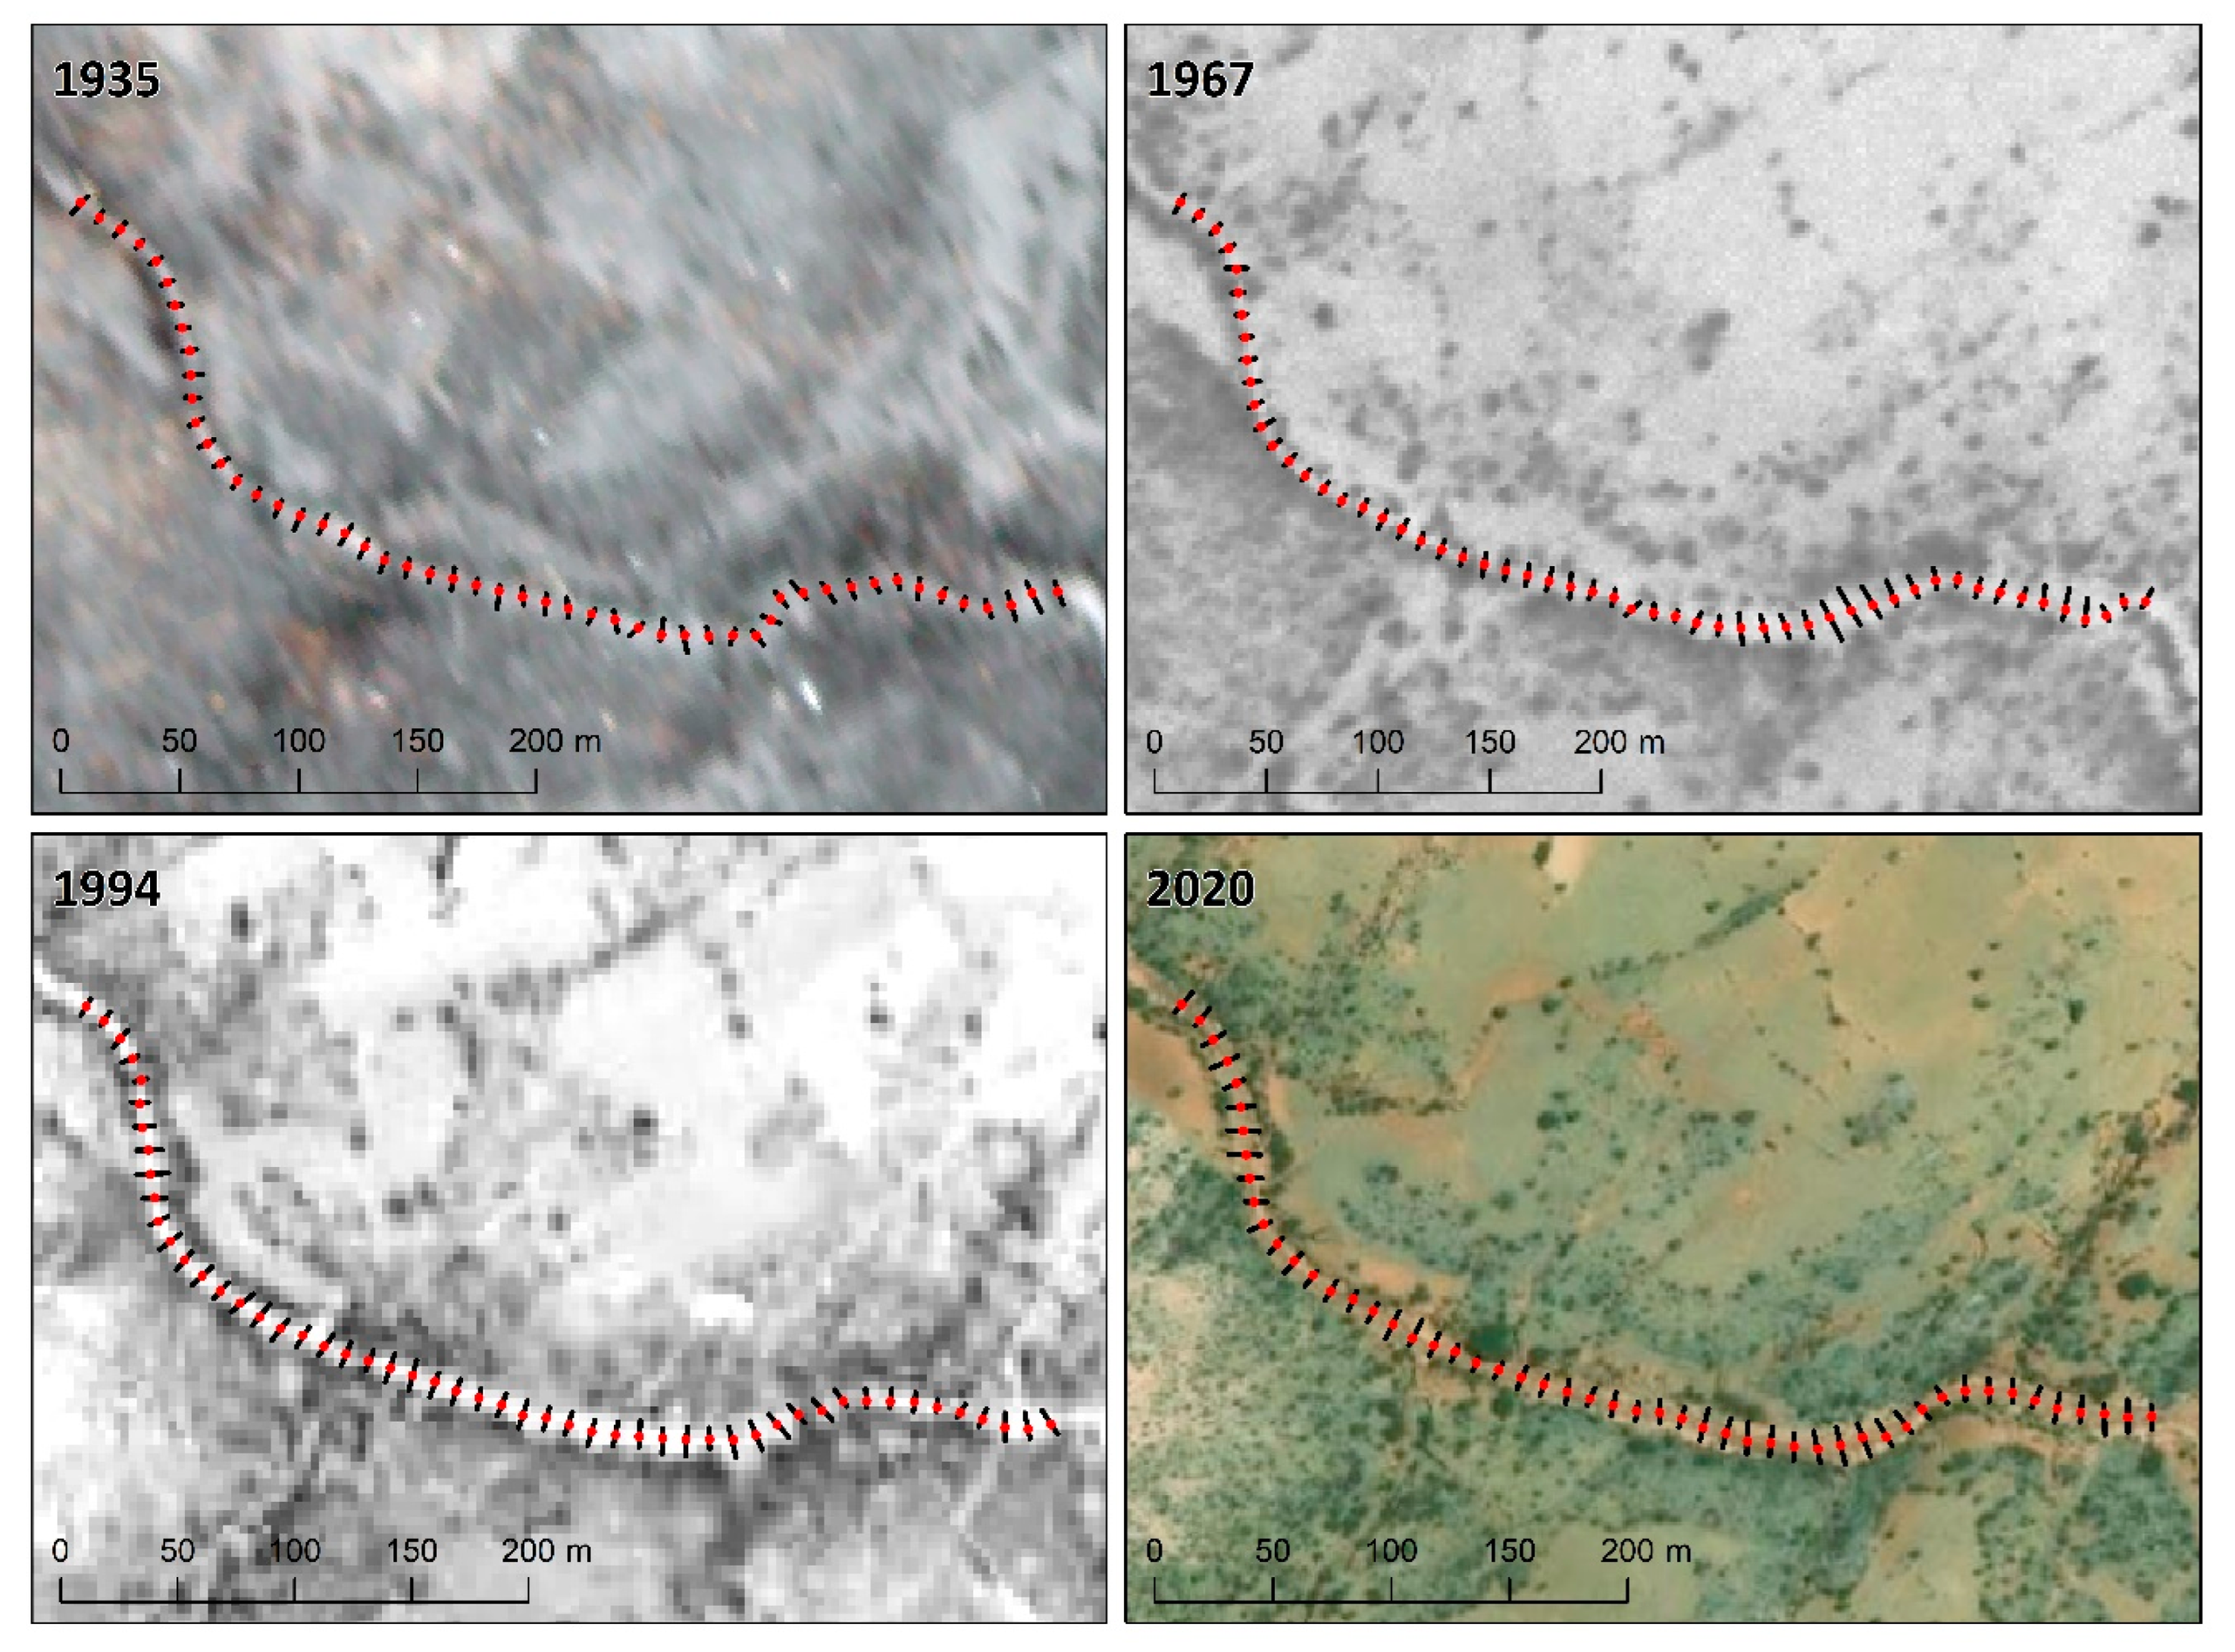
The river channel width was measured at various locations near the predetermined outlet of the catchment using orthophotos. Measurements were taken from riverbank edge to riverbank edge, which represents the physical channel width rather than the instantaneous water surface width or the bankfull width. Over a 540 m stretch upstream from the basin’s outlet, measurements were taken every 10 m in ArcMap [46]. After measuring the river width at these 54 points for four time steps, the mean channel width and standard deviation were calculated for each time step.

2.4. Runoff Response Modelling

Hydrological modelling was performed using the Soil and Water Assessment Tool (SWAT), a physically based, semi-distributed catchment-scale model. SWAT discretizes the catchment into hydrological response units (HRUs), each defined by a unique combination of landcover classes, soil units, and slope gradient classes [47,48]. Input data included a digital elevation model (DEM) derived from Shuttle Radar Topography Mission (SRTM) data with a resolution of approximately 30 × 30 m (USGS, 2018). The DEM, together with the burned-in digitized streamflow path and the selected outlet, was used to delineate the catchment and classify slopes into five gradient classes: 0–5%, 5–10%, 10–20%, 20–35%, and >35%. Digitized landcover maps for each time step and a soil map were also incorporated.
Meteorological forcing was based on Climate Forecast System Reanalysis data, which provides precipitation, temperature, wind speed, relative humidity, and solar radiation [49]. SWAT used these data to generate synthetic weather through its internal weather generator. For each landcover time step, the same 10-year meteorological time series was applied to isolate the impact of landcover change on surface runoff.
The catchment was subdivided into three subcatchments by SWAT. Surface runoff simulations were conducted separately for each landcover time step using the corresponding landcover map. For each simulation, a 100-year period was run, from which a 10-year span with the lowest average annual precipitation (years 55–64) was selected. Simulated precipitation and surface runoff were then averaged over this 10-year period. Results were analyzed both for the entire catchment and for each subcatchment individually.

2.5. Data Analysis

Runoff coefficients were calculated as the ratio of surface runoff to precipitation for each subcatchment. Total drainage length was determined by summing the lengths of all mapped river and drainage line segments. Drainage density was then computed by dividing the total drainage length by the catchment area. To assess whether differences in median modelled surface runoff between periods were statistically significant, the non-parametric Friedman test was applied, followed by Wilcoxon signed-rank tests with Bonferroni corrections for pairwise comparisons [50].

3. Results

3.1. Landcover and Drainage Network

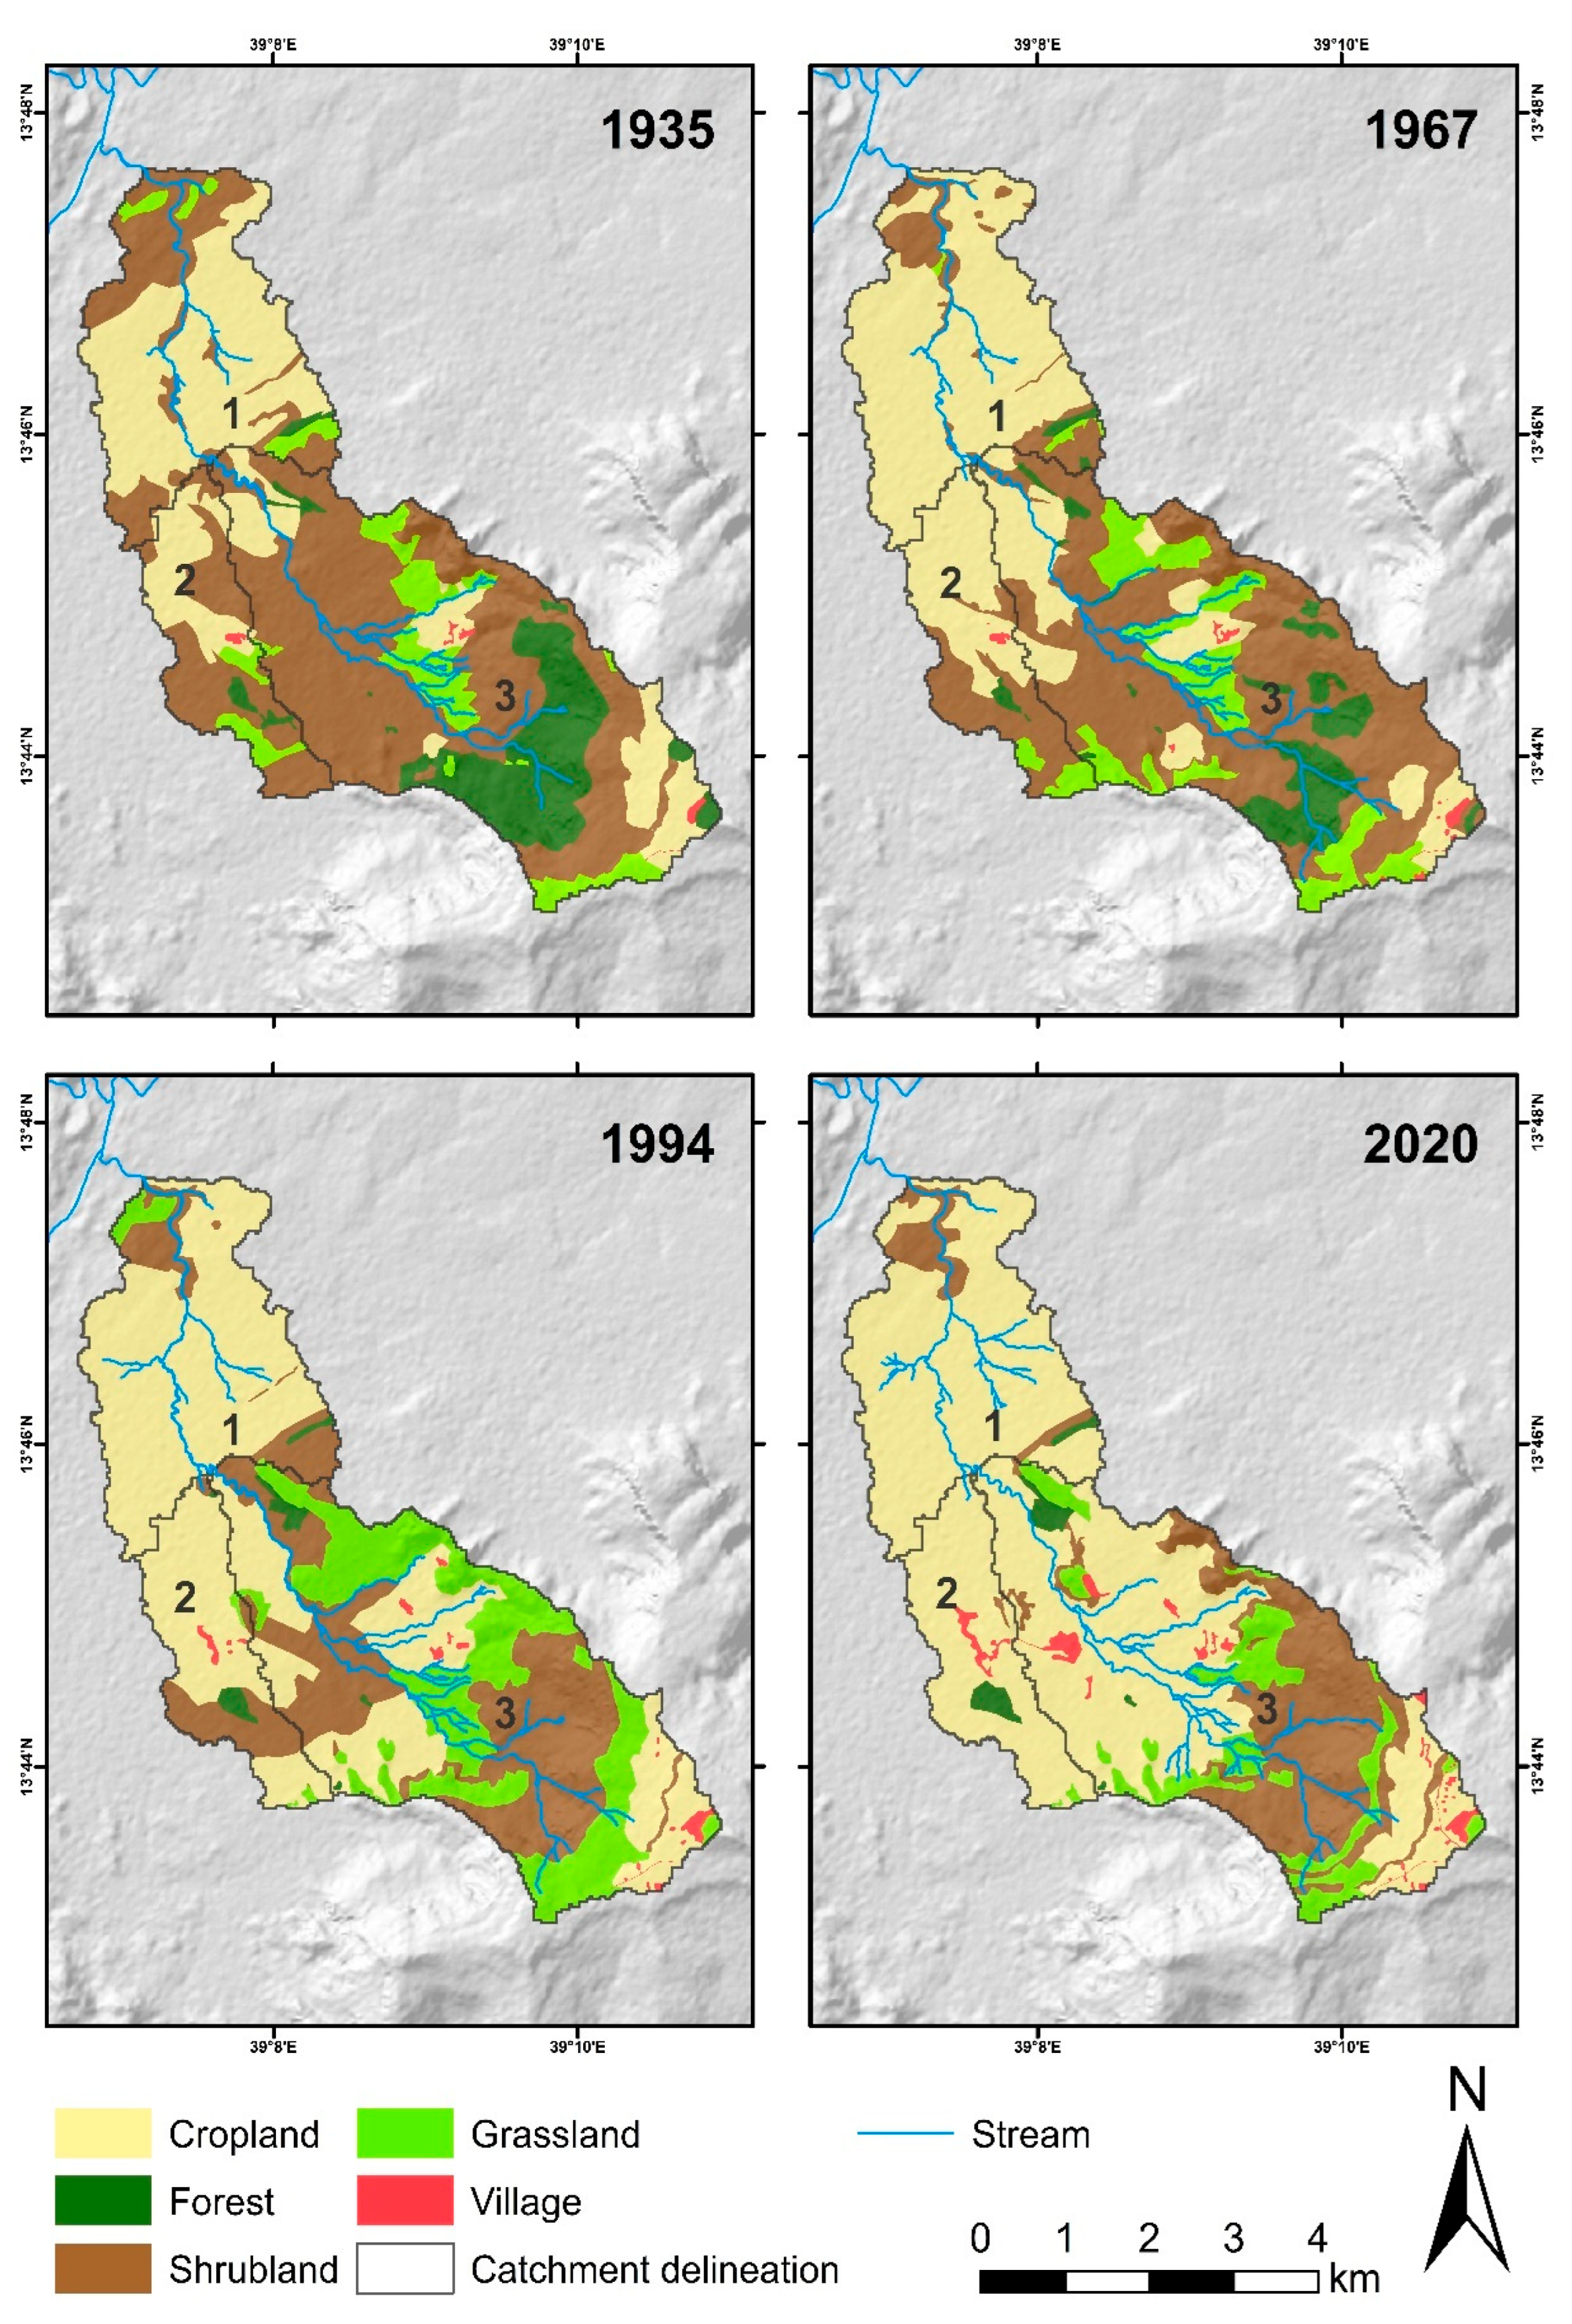
The landcover maps (Figure 2) illustrate the spatial distribution and temporal dynamics of landcover in the Tsili catchment across the years 1935, 1967, 1994, and 2020. In 1935, shrubland dominated the landscape, covering approximately 50% of the catchment, followed by cropland at 30% and forest at 12%. Shrubland was primarily distributed across the escarpment and the hillslopes. Cropland was concentrated in the lower northwestern pediplains near the catchment outlet and on the plateau top. The forest patches were mostly located along the escarpment and in select lower-elevation zones, often near churches, while grassland—covering 8% of the area—appeared in scattered patches. Settlements were minimal, limited to three distinct locations. By 1967, cropland had expanded toward the escarpment, replacing shrubland, particularly in the lower and mid-elevation zones. Forest cover was fragmented, reduced by about half compared to 1935, particularly along the escarpment. Shrubland declined to around 40%, as it was both lost to cropland and grassland, and partially gained through conversion from forest. Grasslands expanded slightly, though some patches were also converted to cropland, and village areas increased marginally. These spatial shifts continued in later years, with cropland progressively extending into previously natural or semi-natural areas, particularly on the plateau and escarpment edges. By 2020, cropland dominated most of the catchment, shrubland had become confined to less accessible terrain, forests were nearly eradicated, and settlements had expanded along streams and accessible routes.
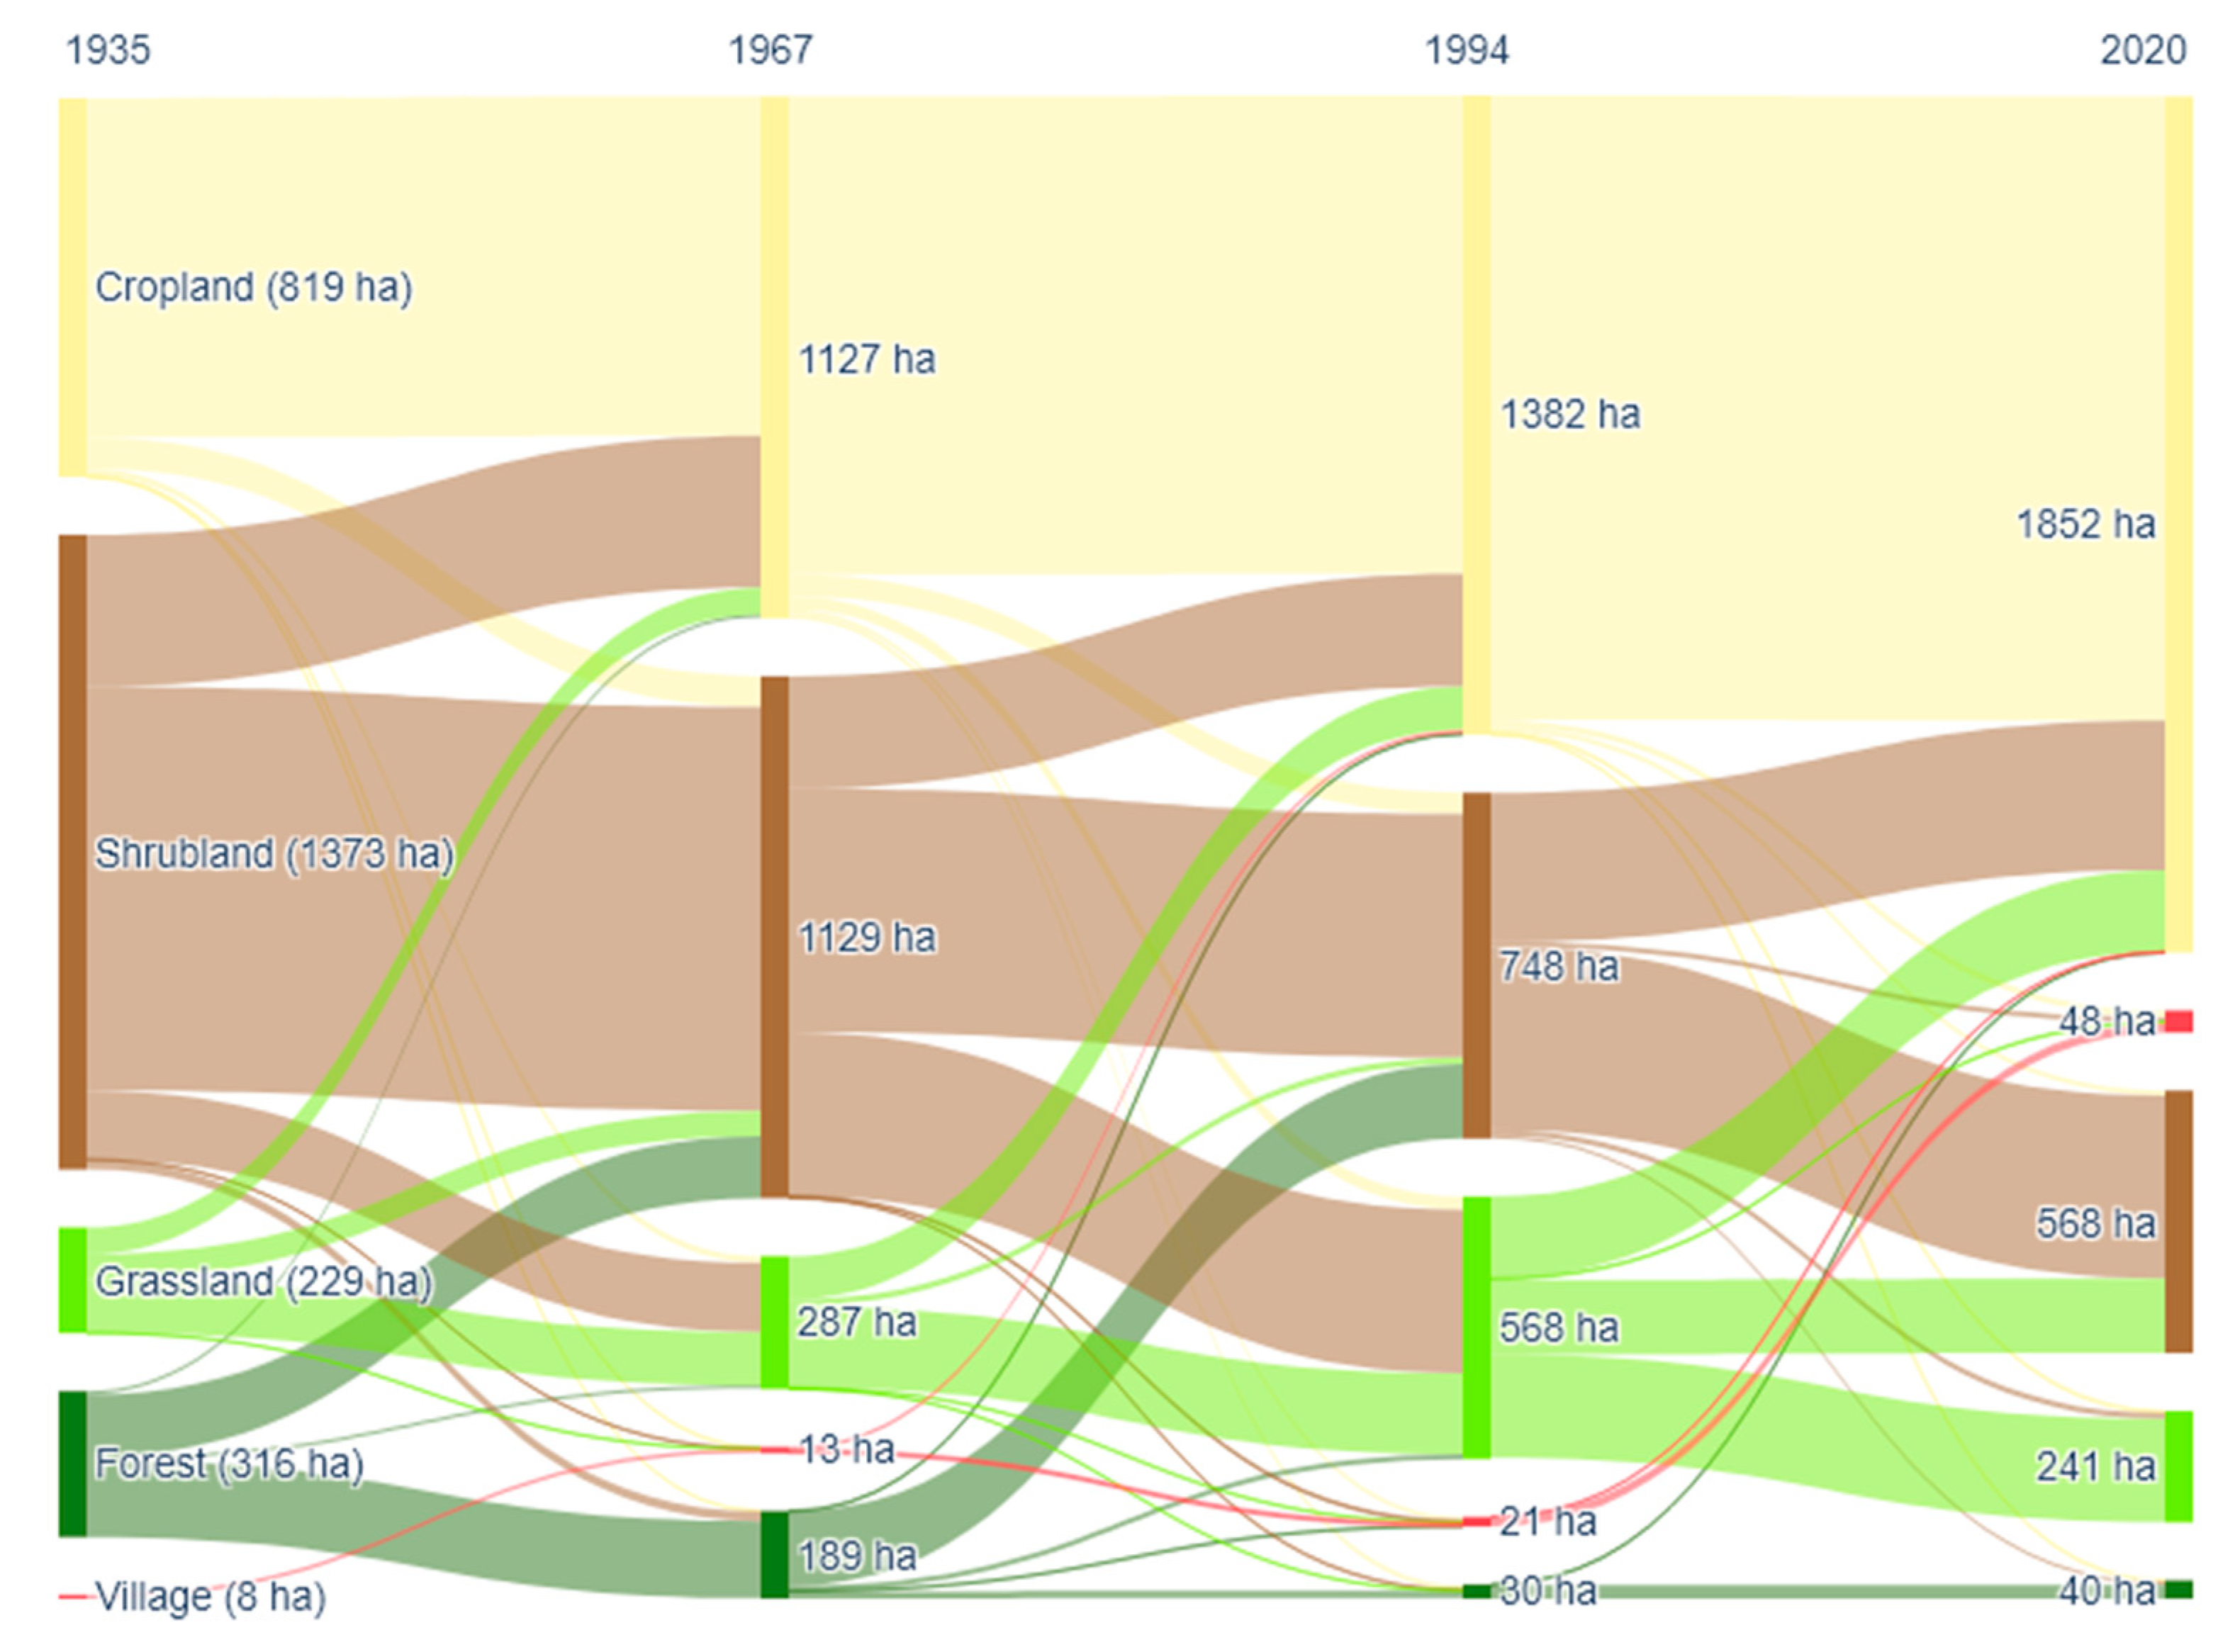
The Sankey diagram (Figure 3) gives more insights into the landcover change dynamics. While shrubland was the dominant landcover in 1935 and remained the most extensive class by 1967, parts of it had been converted to cropland, while shrubland also expanded into former grassland and forest areas. Between 1967 and 1994, shrubland area began to decline, and this trend intensified after 1994, with large parts being converted to cropland and, to a lesser extent, grassland.
Cropland consistently expanded throughout the period. Initially limited in extent, cropland increased notably by 1967, largely at the expense of shrubland and forest. After a period of moderate change between 1967 and 1994, cropland saw its most significant expansion between 1994 and 2020, becoming the dominant landcover by the end of the period.
Grassland remained relatively stable between 1935 and 1967 but expanded substantially by 1994, primarily due to conversions from shrubland. In the final period (1994–2020), some grassland was converted back to shrubland, while a sizable portion was converted to cropland.
Forest showed a continuous and marked decline over the entire study period. Starting as a minor class in 1935, forest cover decreased steadily, with much of it being converted to shrubland and cropland. By 2020, forest had nearly disappeared from the landscape.
Village areas were minimal in 1935 but gradually expanded across all periods, particularly between 1994 and 2020. This reflects increasing settlement density and land allocation to built-up areas and associated uses.
Over time, the drainage network of the ephemeral rivers expanded with the increase in tributary gullies, especially at the foot of the escarpments in subcatchment 3, as well as in the pediplains of subcatchment 1 where Planosols occur. The total length of the drainage network in the catchment increased from 31.3 km in 1935 to 49.2 km in 2020 (Table 3). The drainage length in subcatchment 2 tripled between 1935 and 2020 and almost doubled in subcatchment 1. In subcatchment 3, the drainage length increased from 22.5 km to 32.4 km. The corresponding drainage density in the catchment rose from 1.1 km−2 to 1.8 km−2 between 1935 and 2020, representing a 1.5-fold increase. The drainage density gradually increased in subcatchments 1 and 3 over time. Subcatchment 2 had a much lower drainage density in general, but it tripled, going from 0.07 km−2 in 1935 to 0.25 km−2 in 2020.

3.2. River Channel Width

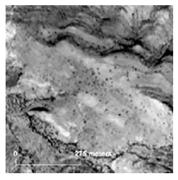
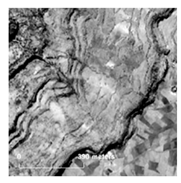
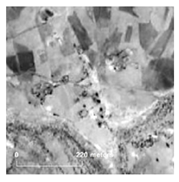
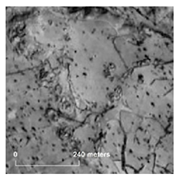
The river channel width (Figure 4) increased from 7.5 ± 1.9 m in 1935 to 10.5 ± 2.2 m in 2020. The most rapid increase occurred between 1935 and 1967, during which the width expanded from 7.5 to 9.4 ± 3.5 m. By 1994, the river channel width had reached 10.1 ± 2.0 m.

3.3. Impact of Landcover and Drainage Network Change on Modelled Runoff Response

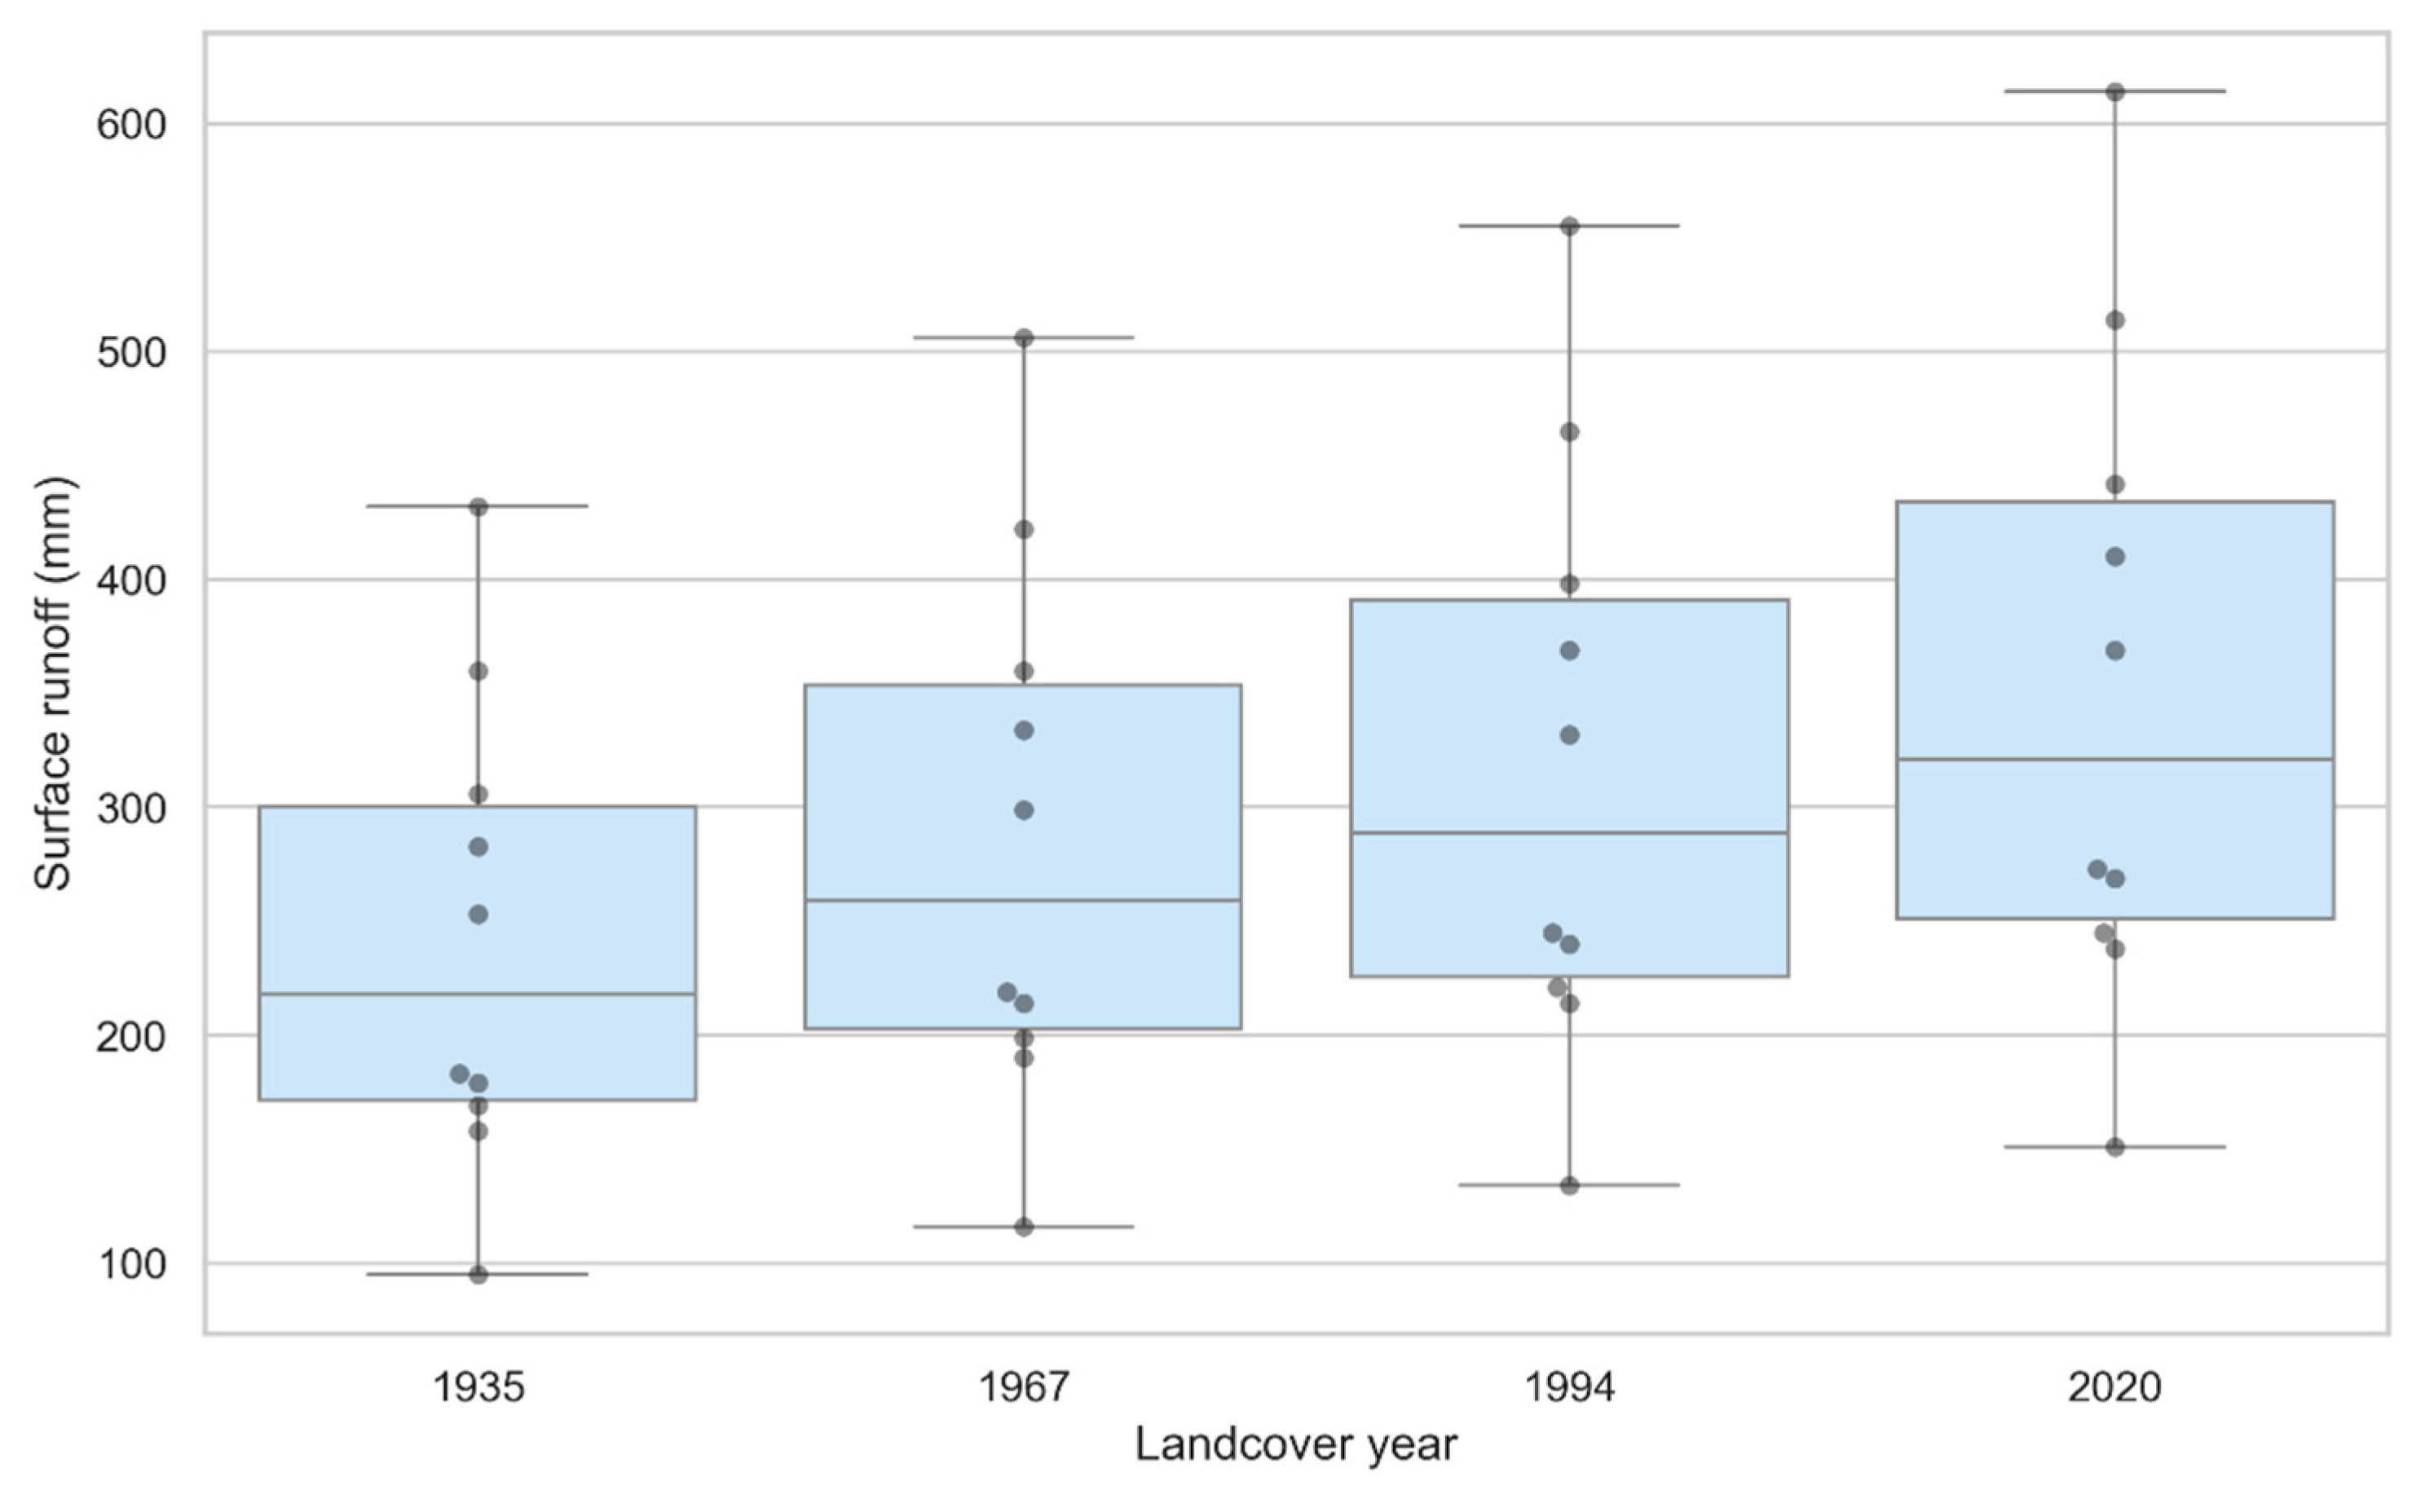
According to the SWAT simulations, surface runoff increased progressively under changing landcover conditions (Figure 5). The simulated annual runoff was significantly different between all time periods based on the Friedman test and post hoc analysis (p ≤ 0.05). The boxplots illustrate both an upward trend in median runoff and a widening range of runoff values from 1935 to 2020, highlighting the intensifying hydrological response of the catchment.
With an average annual precipitation of 844 mm, the corresponding runoff coefficients (RCs) also increased from 28.6% to 41.8% for the whole catchment (Table 4). On the subcatchment scale, the RCs increased with varying trends. In subcatchment 1, the smallest increase occurred (from 9.8% to 12.4%), whereas in subcatchment 2 the RC nearly doubled, from 6.6% to 12.7%. Subcatchment 3 showed generally higher RCs, increasing from 13.8% to 18.4%.

3.4. Impact of Landcover and Drainage Network Change on Surface Runoff and River Channel Width

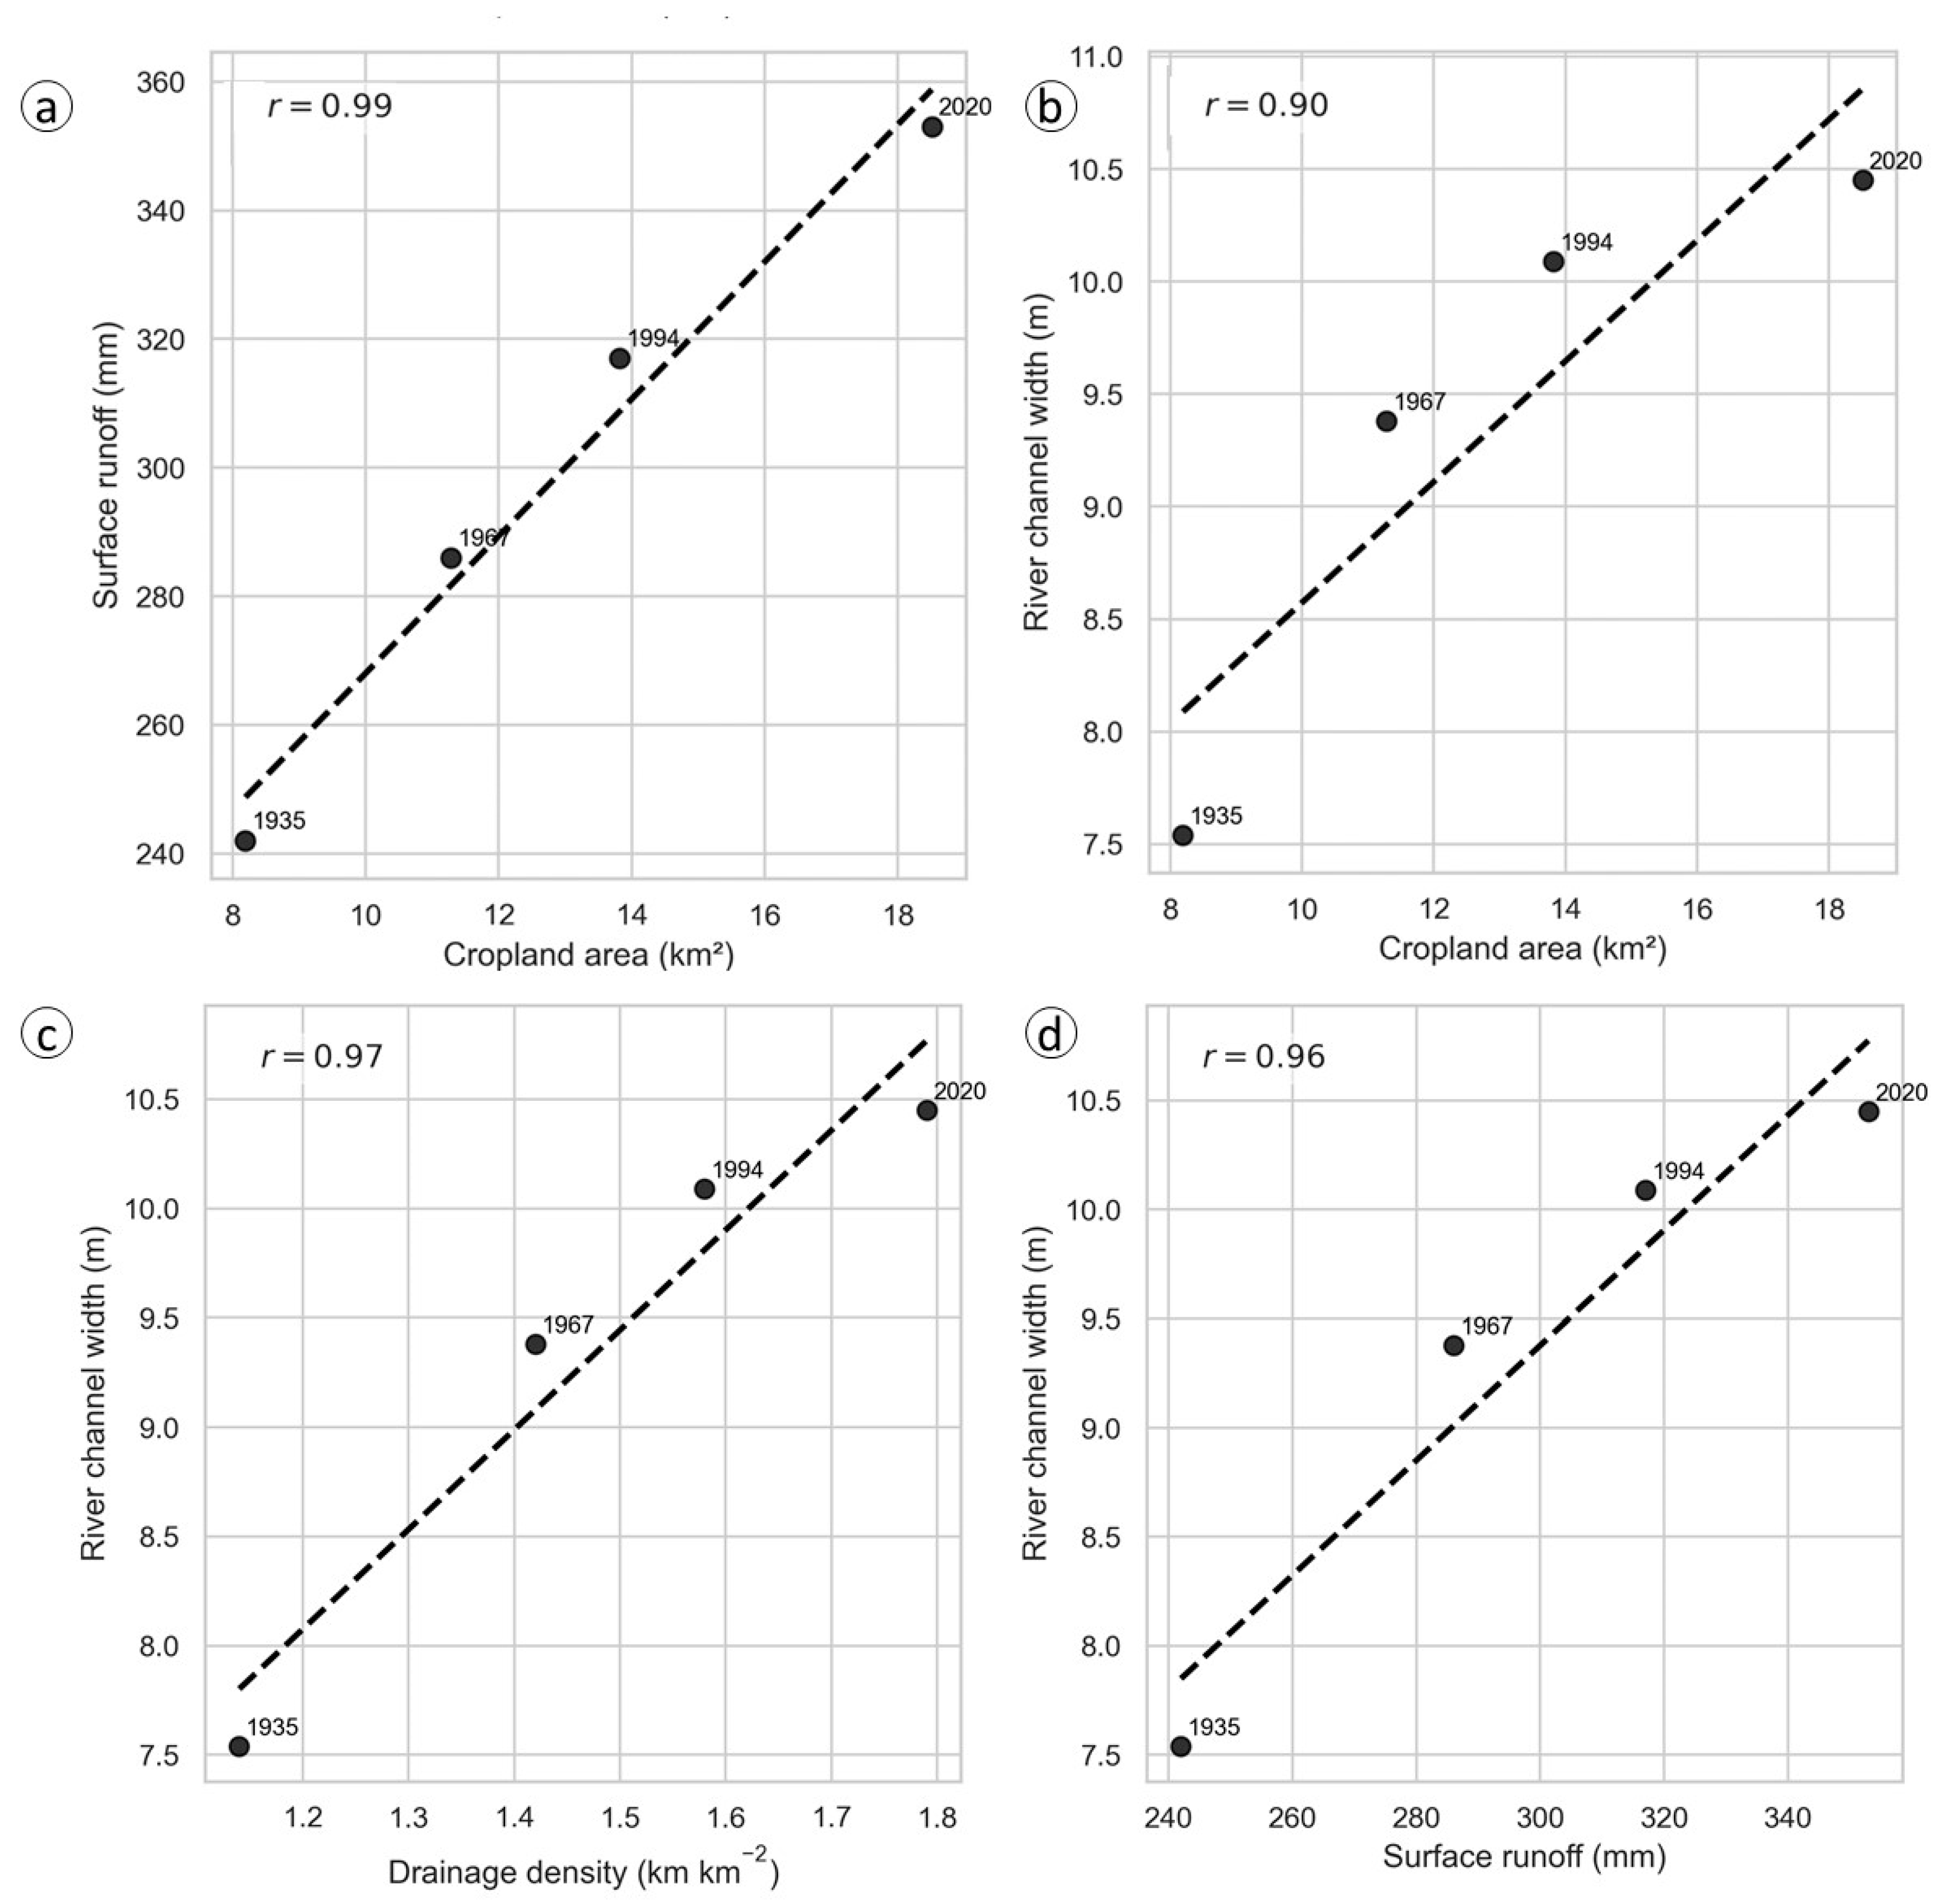
The strong correlation between cropland expansion and the increase in surface water runoff (Figure 6a) as well as increase in river channel width (Figure 6b) indicates that landcover change is a key driver of shifts in both surface hydrology and river morphology. These results suggest that cropland expansion is a major driver of increased surface runoff and river channel enlargement. Furthermore, river channel width is strongly correlated with drainage density (Figure 6c) and surface runoff (Figure 6d), reinforcing the idea that hydrological intensification, driven by landcover changes over the past 85 years, has played a central role in reshaping fluvial processes. Collectively, these relationships illustrate how human-driven landscape transformation has amplified surface flow, accelerated erosion, and produced significant morphological adjustments within the river network.

4. Discussion

4.1. Long Term Landcover Changes in the Tsili Catchment

Studying the impacts of land-cover change on hydrology in semi-arid regions of Africa is critical, as these environments are highly vulnerable to water scarcity and hydrological variability, making sustainable water management a pressing challenge [51]. Long-term observations in the West African Sahel have shown that the replacement of natural vegetation with crops or bare soil has reduced infiltration capacity and increased runoff coefficients since the 1970s [52,53]. In contrast, a review of catchment studies in East Africa found that trends in discharge and flow regimes were not consistently negative or positive, suggesting an absence of common patterns [54]. These mixed findings highlight the complex interactions among climate variability, catchment characteristics, and land-cover change that can obscure clear hydrological responses.
In our case study, between 1935 and 2020, the catchment transitioned from a shrubland dominated landscape to a cropland dominated landscape. This transition from natural, woody vegetation to agricultural land is a well-known process in Africa south of the Sahara [55,56,57]. Rising populations have increased land demands, leading to shifts from natural forests and vegetation to human settlements, urban areas, farmland, and grazing lands in East Africa [54]. The increase in population, clearly reflected in the expansion of settlements, went along with an accelerated decline in woody vegetation. As the population grew, so did the demand for timber and firewood [7,58], contributing to the loss of forest along the escarpments. Additionally, pressure on the land may have grown due to increases in livestock traditionally allowed to graze freely, causing degradation of grasslands and further loss of shrubs and trees [59,60].
Similarly, during the same period (1935–2020), the Tsili catchment experienced a transition from shrubland to grassland and later to predominantly cropland. After 1994, some grassland areas reverted to shrubland, likely due to government-promoted “exclosures”—former communal pastures closed to encourage vegetation restoration [10]—while other shrubland areas were converted to cropland. These dynamics are consistent with findings from nearby areas such as the Aynalem catchment, where cropland and urban areas expanded at the expense of forest and shrubland [61]. In the Geba catchment, located just 10 km south of Tsili, similar long-term shifts were documented [7], although cropland expansion there was more modest compared to Tsili. This pattern suggests that Tsili’s relative remoteness may have delayed large-scale deforestation, thereby concentrating land-cover change in the more recent decades of the study period [62].

4.2. Landcover Change and Its Hydrological Response

Rainfall intensity, variability, and seasonal concentration are widely recognized as primary drivers of surface runoff and gully formation in Northern Ethiopia [63,64]. In this study, we applied a consistent 10-year meteorological forcing across all four landcover scenarios to isolate the effects of landcover change while maintaining realistic climatic and hydrological conditions.
Research across Northern Ethiopia has shown that the loss of natural woody vegetation and increasing overgrazing on steep slopes make landscapes more vulnerable to soil erosion and gully development [63]. Our observations from the Tsili catchment confirm this pattern. Landcover changes have coincided with an expansion of the drainage network (Table 3) and widening of riverbanks (Figure 6), particularly in the lower catchment areas dominated by cropland and degraded vegetation cover (“subcatchment 1” and “subcatchment 2”). The absence of permanent vegetation—likely linked to overgrazing and agricultural pressure—has driven a two- to three-fold increase in drainage density, signalling heightened erosion processes. These changes reflect a cascade of mechanisms: removal of protective woody cover and intensive grazing reduce infiltration capacity, resulting in higher surface runoff and peak discharges that accelerate riverbank erosion and reshape channel morphology.
SWAT model simulations reinforce these field observations. The transition from predominantly natural vegetation to cropland has generally increased surface runoff, with runoff coefficients (RCs) varying by subcatchment. In “subcatchment 2,” where cropland expanded at the expense of shrubland near the settlement area, RCs showed the steepest increase. By contrast, “subcatchment 1,” already dominated by cropland in 1935 (63%), exhibited only modest RC increases despite notable drainage expansion. Here, the increase in drainage density likely reflects soil degradation rather than new landcover conversion, making the land more susceptible to gully incision. The steep escarpment zone (“subcatchment 3”) displayed high runoff potential due to slope but relatively smaller RC increases, probably buffered by the continued presence of shrub cover. This highlights the regulatory role of vegetation, showing that slope exerts a dominant influence only when protective cover is sparse [11].
Comparable dynamics have been documented elsewhere in Africa. In South-Western Niger, land clearance and woody vegetation loss produced a 2.5-fold increase in drainage density, intensifying hydrological connectivity and surface runoff [65]. Similar responses to cropland expansion and vegetation loss have been observed in Ethiopia’s Andassa watershed [66], South Africa’s Olifants Basin [67], and Kenya’s Rift Valley [68], as well as in other Ethiopian catchments where agricultural expansion has intensified erosion through increased runoff [69].
The expansion of cropland at the expense of natural vegetation has not only altered drainage density but also removed important sinks that previously regulated water and sediment flows. Vegetation plays a critical role in enhancing infiltration, maintaining soil health, and reducing erosion [70]. In a steep catchment such as Tsili, the loss of these regulating functions poses both current and future risks, particularly under changing climatic conditions [11,71,72]. The Intergovernmental Panel on Climate Change projects intensified droughts alongside more frequent heavy rainfall events in East Africa [73]. Such extremes can produce high runoff responses and flooding in catchments with strong hydrologic connectivity, while simultaneously reducing groundwater recharge and dry-season baseflow, thereby aggravating unsustainable water use. Land degradation amplifies these dynamics by lowering infiltration capacity and accelerating water and sediment transfer to streams.
Addressing these challenges requires land management practices that effectively reducing hydrologic connectivity by restoring vegetation and healthy soil function. Riparian buffers, for example, stabilize banks, filter runoff, and reduce direct connectivity between uplands and streams [54,68]. Complementary approaches such as water harvesting and agroforestry improve soil–water interactions by capturing runoff, slowing its movement, and enhancing long-term agricultural productivity [74]. Together, these measures reduce surface runoff, improve infiltration, and build resilience against flooding, water scarcity, and degradation-driven feedbacks.

4.3. Interpreting Model Outputs Amid Data Scarcity

A key limitation of this study is the absence of local meteorological and discharge observations, which restricted the ability to directly calibrate and validate the SWAT model. While reanalysis data provided a consistent forcing for all scenarios, reliance on these gridded datasets introduces uncertainties compared to site-specific measurements. Applying the same 10-year meteorological sequence across landcover scenarios, although methodologically necessary to isolate landcover effects, may not fully capture interactions between climate variability and landcover dynamics.
The progressive widening of river channels alongside increases in simulated surface runoff suggests that river width can serve as a useful proxy for hydrological intensification in data-scarce, semi-arid environments. The agreement between modelled runoff increases and observed channel widening provides indirect validation of the model’s output. River morphology responds to multiple interacting drivers; for example, ongoing channel widening has been documented in the Raya graben despite conservation interventions, which has been attributed to higher-intensity rainfall [75]. Precipitation records from the nearest station at Hagere Selam (~8 km south of the catchment) show a slight but statistically insignificant decreasing trend in annual rainfall [23]. While these patterns may partly explain the modest widening observed in Tsili, strong spatial variability in this rugged terrain limits firm conclusions.
Conservation measures not represented in the model must also be considered. Stone bunds and other soil conservation practices introduced in the Tsili catchment during the 1990s are clearly visible in 2020 satellite imagery and may explain why channel widening remained relatively limited despite simulated increases in surface runoff.
Future studies could leverage time-specific meteorological data, for example, from standardized global datasets such as the Inter-Sectoral Impact Model Intercomparison Project (ISIMIP3a, www.isimip.org, accessed 1 September 2025), to disentangle the relative contributions of landcover and climate changes. Such analyses would complement the present study, which focuses primarily on isolating the effects of landcover change under a realistic but constant climate scenario.
At this point, it is unclear if the Tsili catchment has suffered from land degradation due to the heavy armed conflict between November 2020 and November 2022 in Tigray. Perhaps the area’s remoteness has protected it from active destruction caused by air strikes or trench diggings, which has been observed in regions south of Tsili [74]. Nevertheless, it is likely that pressure on the landscape and its natural resources increased during the conflict due to the absence of energy sources and possible food shortages [76]. The area’s proneness to land degradation, combined with historical and potential conflict-related land conversions and climate risks, underscores the importance of land management strategies that mitigate runoff and erosion to support sustainable agriculture and climate adaptation. Improved understanding of these land–hydrology interactions can inform watershed planning and policy, especially in data-scarce, climate-sensitive regions like Tigray.

5. Conclusions

This study offers a unique 85-year perspective on how landcover change has shaped hydrology and river morphology in a semi-arid catchment of Africa south of the Sahara. Using historical aerial photographs, recent satellite imagery, soil maps, a digital elevation model, and SWAT modelling, we isolated the effects of landcover dynamics on surface runoff under consistent climate forcing.
Over the study period, the catchment shifted from a landscape dominated by natural vegetation—shrubland and forest—to one increasingly characterized by cropland. This transition was accompanied by a 1.5-fold increase in drainage density, widening of river channels, and higher simulated runoff coefficients, particularly in subcatchments experiencing extensive landcover change. Although the SWAT model was not formally calibrated, the alignment between simulated runoff increases and observed morphological changes supports the robustness of the findings. These results underscore the growing hydrological sensitivity of the landscape and highlight the importance of implementing land management strategies—such as vegetation restoration, riparian buffers, and water harvesting—to reduce runoff, limit erosion, and enhance resilience.
Future research should build on this work by integrating time-specific climate data or local weather measurements to better disentangle the combined impacts of landcover and climate change on catchment hydrology. Overall, this study provides valuable insights for watershed planning and sustainable land management in data-scarce, climate-vulnerable regions of Africa south of the Sahara, demonstrating how historical landcover dynamics continue to shape hydrological responses.

Author Contributions

Conceptualization, K.H., H.M., J.N. and S.D.; methodology, K.H., E.N., J.N. and S.D.; software, K.H.; validation, E.N. and J.N.; formal analysis, K.H. and S.D.; investigation, K.H.; resources, J.N.; data curation, K.H.; writing—original draft preparation, K.H.; writing—review and editing, E.N., H.M., J.N. and S.D.; visualization, K.H.; supervision, H.M., J.N. and S.D.; project administration, J.N. All authors have read and agreed to the published version of the manuscript.

Funding

This research received no external funding.

Data Availability Statement

All analysis were performed using open access data.

Acknowledgments

During the preparation of this manuscript, the authors used ChatGPT (GPT-4-turbo) for language editing assistance. All outputs were reviewed and edited by the authors, who take full responsibility for the content of this publication.

Conflicts of Interest

The authors declare no conflicts of interest.

Abbreviations

The following abbreviations are used in this manuscript:
a.s.l.Above sea level
DEMDigital Elevation Model
dpiDots per inch
GCPsGround control points
HRUHydrological Response Unit
RCRunoff coefficient
SRTMShuttle Radar Topography Mission
SWATSoil and Water Assessment Tool

Appendix A. Illustrations of the Visual Interpretation of the Aerial Imagery

Table A1. Landcover Types Recognized Using Imagery of 1935.
Landcover ClassSample Image
Forest—Dense agglomerations of trees Land 14 01897 i001  Land 14 01897 i002
Shrubland—Alternation of grass, shrubs and trees, predominantly shrubs Land 14 01897 i003  Land 14 01897 i004
Grassland—Predominantly grass Land 14 01897 i005  Land 14 01897 i006
Cropland—Agricultural area (patchiness and plot boundaries) Land 14 01897 i007  Land 14 01897 i008
Village—Low density populated area Land 14 01897 i009  Land 14 01897 i010
Table A2. Landcover Types Recognized Using Imagery of 1967.
Landcover ClassSample Image
Forest—Dense agglomerations of trees Land 14 01897 i011  Land 14 01897 i012
Shrubland—Alternation of grass, shrubs and trees, predominantly shrubs Land 14 01897 i013  Land 14 01897 i014
Grassland—Predominantly grass Land 14 01897 i015  Land 14 01897 i016
Cropland—Agricultural area (patchiness and plot boundaries) Land 14 01897 i017  Land 14 01897 i018
Village—Low density populated area Land 14 01897 i019  Land 14 01897 i020
Table A3. Landcover Types Recognized Using Imagery of 1994.
Landcover ClassSample Image
Forest—Dense agglomerations of trees Land 14 01897 i021  Land 14 01897 i022
Shrubland—Alternation of grass, shrubs and trees, predominantly shrubs Land 14 01897 i023  Land 14 01897 i024
Grassland—Predominantly grass Land 14 01897 i025  Land 14 01897 i026
Cropland—Agricultural area (patchiness and plot boundaries) Land 14 01897 i027  Land 14 01897 i028
Village—Low density populated area Land 14 01897 i029  Land 14 01897 i030
Table A4. Landcover Types Recognized Using Imagery of 2020.
Landcover ClassSample Image
Forest—Dense agglomerations of trees Land 14 01897 i031  Land 14 01897 i032
Shrubland—Alternation of grass, shrubs and trees, predominantly shrubs Land 14 01897 i033  Land 14 01897 i034
Grassland—Predominantly grass Land 14 01897 i035  Land 14 01897 i036
Cropland—Agricultural area (patchiness and plot boundaries) Land 14 01897 i037  Land 14 01897 i038
Village—Low density populated area Land 14 01897 i039  Land 14 01897 i040

References

  1. Lambin, E.F.; Geist, H.J.; Lepers, E. Dynamics of Land-Use and Land-Cover Change in Tropical Regions. Annu. Rev. Environ. Resour. 2003, 28, 205–241. [Google Scholar] [CrossRef]
  2. Gibbs, H.K.; Ruesch, A.S.; Achard, F.; Clayton, M.K.; Holmgren, P.; Ramankutty, N.; Foley, J.A. Tropical Forests Were the Primary Sources of New Agricultural Land in the 1980s and 1990s. Proc. Natl. Acad. Sci. USA 2010, 107, 16732–16737. [Google Scholar] [CrossRef]
  3. Song, X.P.; Hansen, M.C.; Stehman, S.V.; Potapov, P.V.; Tyukavina, A.; Krylov, A.; Townshend, J.R. Global Land Change from 1982 to 2016. Nature 2018, 560, 639–643. [Google Scholar] [CrossRef] [PubMed]
  4. Sisay, G.; Gitima, G.; Mersha, M.; Alemu, W.G. Assessment of Land Use Land Cover Dynamics and Its Drivers in Bechet Watershed Upper Blue Nile Basin, Ethiopia. Remote Sens. Appl. Soc. Environ. 2021, 24, 100648. [Google Scholar] [CrossRef]
  5. FAO; UNEP. Land Cover Classification System: Based on the UN Land Cover Classification System (LCCS); Food and Agriculture Organization of the United Nations; United Nations Environment Programme: Rome, Italy, 1997. [Google Scholar]
  6. Meire, E.; Frankl, A.; De Wulf, A.; Haile, M.; Deckers, J.; Nyssen, J. Land Use and Cover Dynamics in Africa since the Nineteenth Century: Warped Terrestrial Photographs of North Ethiopia. Reg. Environ. Change 2013, 13, 717–737. [Google Scholar] [CrossRef]
  7. Etefa, G.; Frankl, A.; Lanckriet, S.; Biadgilgn, D.; Gebreyohannes, Z.; Amanuel, Z.; Poesen, J.; Nyssen, J. Changes in Land Use/Cover Mapped over 80 Years in the Highlands of Northern Ethiopia. J. Geogr. Sci. 2018, 28, 1538–1563. [Google Scholar] [CrossRef]
  8. Nyssen, J.; Tielens, S.; Gebreyohannes, T.; Araya, T.; Teka, K.; Van De Wauw, J.; Degeyndt, K.; Descheemaeker, K.; Amare, K.; Haile, M.; et al. Understanding Spatial Patterns of Soils for Sustainable Agriculture in Northern Ethiopia’s Tropical Mountains. PLoS ONE 2019, 14, e0224041. [Google Scholar] [CrossRef]
  9. Lanckriet, S.; Derudder, B.; Naudts, J.; Bauer, H.; Deckers, J.; Haile, M.; Nyssen, J. A Political Ecology Perspective of Land Degradation in the North Ethiopian Highlands. Land Degrad. Dev. 2014, 26, 521–530. [Google Scholar] [CrossRef]
  10. Nyssen, J.; Frankl, A.; Zenebe, A.; Deckers, J.; Poesen, J. Land Management in the Northern Ethiopian Highlands: Local and Global Perspectives; Past, Present and Future. Land Degrad. Dev. 2015, 26, 759–764. [Google Scholar] [CrossRef]
  11. Descheemaeker, K.; Nyssen, J.; Poesen, J.; Raes, D.; Haile, M.; Muys, B.; Deckers, S. Runoff on Slopes with Restoring Vegetation: A Case Study from the Tigray Highlands, Ethiopia. J. Hydrol. 2006, 331, 219–241. [Google Scholar] [CrossRef]
  12. Bracken, L.J.; Croke, J. The Concept of Hydrological Connectivity and Its Contribution to Understanding Runoff-Dominated Geomorphic Systems. Hydrol. Process. 2007, 21, 1749–1763. [Google Scholar] [CrossRef]
  13. Lexartza-Artza, I.; Wainwright, J. Hydrological Connectivity: Linking Concepts with Practical Implications. CATENA 2009, 79, 146–152. [Google Scholar] [CrossRef]
  14. Bracken, L.J.; Wainwright, J.; Ali, G.A.; Tetzlaff, D.; Smith, M.W.; Reaney, S.M.; Roy, A.G. Concepts of Hydrological Connectivity: Research Approaches, Pathways and Future Agendas. Earth-Sci. Rev. 2013, 119, 17–34. [Google Scholar] [CrossRef]
  15. Wohl, E.; Brierley, G.; Cadol, D.; Coulthard, T.J.; Covino, T.; Fryirs, K.A.; Grant, G.; Hilton, R.G.; Lane, S.N.; Magilligan, F.J.; et al. Connectivity as an Emergent Property of Geomorphic Systems: Geomorphic Connectivity. Earth Surf. Process. Landf. 2019, 44, 4–26. [Google Scholar] [CrossRef]
  16. McIntyre, N.; Ballard, C.; Bruen, M.; Bulygina, N.; Buytaert, W.; Cluckie, I.; Dunn, S.; Ehret, U.; Ewen, J.; Gelfan, A.; et al. Modelling the Hydrological Impacts of Rural Land Use Change. Hydrol. Res. 2014, 45, 737–754. [Google Scholar] [CrossRef]
  17. Rey, F. Effectiveness of Vegetation Barriers for Marly Sediment Trapping. Earth Surf. Process. Landf. 2004, 29, 1161–1169. [Google Scholar] [CrossRef]
  18. van Dijk, A.I.J.M.; Keenan, R.J. Planted Forests and Water in Perspective. For. Ecol. Manag. 2007, 251, 1–9. [Google Scholar] [CrossRef]
  19. Pan, C.; Ma, L.; Shangguan, Z.; Ding, A. Determining the Sediment Trapping Capacity of Grass Filter Strips. J. Hydrol. 2011, 405, 209–216. [Google Scholar] [CrossRef]
  20. Pan, D.; Gao, X.; Dyck, M.; Song, Y.; Wu, P.; Zhao, X. Dynamics of Runoff and Sediment Trapping Performance of Vegetative Filter Strips: Run-on Experiments and Modeling. Sci. Total Environ. 2017, 593–594, 54–64. [Google Scholar] [CrossRef] [PubMed]
  21. Liu, Y.-J.; Hu, J.-M.; Wang, T.-W.; Cai, C.-F.; Li, Z.-X.; Zhang, Y. Effects of Vegetation Cover and Road-Concentrated Flow on Hillslope Erosion in Rainfall and Scouring Simulation Tests in the Three Gorges Reservoir Area, China. CATENA 2016, 136, 108–117. [Google Scholar] [CrossRef]
  22. Brink, A.B.; Eva, H.D. Monitoring 25 Years of Land Cover Change Dynamics in Africa: A Sample Based Remote Sensing Approach. Appl. Geogr. 2009, 29, 501–512. [Google Scholar] [CrossRef]
  23. Gebremicael, T.G.; Mohamed, Y.A.; Hagos, E.Y. Temporal and Spatial Changes of Rainfall and Streamflow in the Upper Tekezē–Atbara River Basin, Ethiopia. Hydrol. Earth Syst. Sci. 2017, 21, 2127–2142. [Google Scholar] [CrossRef]
  24. Solomon, N.; Hishe, H.; Annang, T.; Pabi, O.; Asante, I.K.; Birhane, E. Forest Cover Change, Key Drivers and Community Perception in Wujig Mahgo Waren Forest of Northern Ethiopia. Land 2018, 7, 32. [Google Scholar] [CrossRef]
  25. Betru, T.; Tolera, M.; Sahle, K.; Kassa, H. Trends and Drivers of Land Use/Land Cover Change in Western Ethiopia. Appl. Geogr. 2019, 104, 83–93. [Google Scholar] [CrossRef]
  26. Intergovernmental Panel on Climate Change (IPCC). Climate Change and Land: IPCC Special Report on Climate Change, Desertification, Land Degradation, Sustainable Land Management, Food Security, and Greenhouse Gas Fluxes in Terrestrial Ecosystems, 1st ed.; Cambridge University Press: Cambridge, UK, 2022; ISBN 978-1-009-15798-8. [Google Scholar]
  27. Leta, M.K.; Demissie, T.A.; Tränckner, J. Hydrological Responses of Watershed to Historical and Future Land Use Land Cover Change Dynamics of Nashe Watershed, Ethiopia. Water 2021, 13, 2372. [Google Scholar] [CrossRef]
  28. Kayitesi, N.M.; Guzha, A.C.; Mariethoz, G. Impacts of Land Use Land Cover Change and Climate Change on River Hydro-Morphology: A Review of Research Studies in Tropical Regions. J. Hydrol. 2022, 615, 128702. [Google Scholar] [CrossRef]
  29. Conway, D.; Persechino, A.; Ardoin-Bardin, S.; Hamandawana, H.; Dieulin, C.; Mahé, G. Rainfall and Water Resources Variability in Sub-Saharan Africa during the Twentieth Century. J. Hydrometeorol. 2009, 10, 41–59. [Google Scholar] [CrossRef]
  30. Dile, Y.T.; Srinivasan, R. Evaluation of CFSR Climate Data for Hydrologic Prediction in Data-Scarce Watersheds: An Application in the Blue Nile River Basin. J. Am. Water Resour. Assoc. 2014, 50, 1226–1241. [Google Scholar] [CrossRef]
  31. Samimi, M.; Mirchi, A.; Moriasi, D.; Ahn, S.; Alian, S.; Taghvaeian, S.; Sheng, Z. Modeling Arid/Semi-Arid Irrigated Agricultural Watersheds with SWAT: Applications, Challenges, and Solution Strategies. J. Hydrol. 2020, 590, 125418. [Google Scholar] [CrossRef]
  32. Arkin, Y.; Beyth, M.; Dow, B.D.; Levitte, D.; Temesgen, H.; Tsegaye, H. Geological Map of Mekele Sheet Area ND 37-11; Ministry of Mines Geological Survey of Ethiopia: Addis Ababa, Ethiopia, 1971. [Google Scholar]
  33. Tefera, M.; Chernet, T.; Haro, W. Explanation of the Geological Map of Ethiopia (1:2,000,000); Ethiopian Institute of Geological Surveys: Addis Ababa, Ethiopia, 1996. [Google Scholar]
  34. Pik, R.; Deniel, C.; Coulon, C.; Yirgu, G.; Hofmann, C.; Ayalew, D. The Northwestern Ethiopian Plateau Flood Basalts: Classification and Spatial Distribution from the Simien to Tigray Plateaus. J. Volcanol. Geotherm. Res. 1998, 81, 91–111. [Google Scholar] [CrossRef]
  35. Wolfenden, E.; Ebinger, C.J.; Yirgu, G.; Deino, A.; Ayalew, D. Evolution of the Northern Main Ethiopian Rift: Birth of a Triple Junction. Earth Planet. Sci. Lett. 2004, 224, 213–228. [Google Scholar] [CrossRef]
  36. IUSS Working Group WRB. World Reference Base for Soil Resources; International Soil Classification System for Naming Soils and Creating Legends for Soil Maps, 4th ed.; Schad, P., Mantel, S., Anjos, L., Boixadera Llobet, J., Deckers, S., Dondeyne, S., Eberhardt, E., Gerasimova, M., Harms, B., Kabala, C., et al., Eds.; International Union of Soil Sciences (IUSS): Vienna, Austria, 2022; ISBN 979-8-9862451-1-9. [Google Scholar]
  37. Nicholson, S.E. Climate and Climatic Variability of Rainfall over Eastern Africa. Rev. Geophys. 2017, 55, 590–635. [Google Scholar] [CrossRef]
  38. Nicholson, S.E. The ITCZ and the Seasonal Cycle over Equatorial Africa. Bull. Am. Meteorol. Soc. 2018, 99, 337–348. [Google Scholar] [CrossRef]
  39. Nyssen, J.; Jacob, M.; Frankl, A. (Eds.) Geo-Trekking in Ethiopia’s Tropical Mountains: The Dogu’a Tembien District; GeoGuide; Springer: Cham, Switzerland, 2019; ISBN 978-3-030-04954-6. [Google Scholar]
  40. Google Earth. High-Resolution Satellite Imagery of Dogu’a Tembien, Ethiopia of 2020. Available online: https://earth.google.com (accessed on 19 September 2024).
  41. Nyssen, J.; Petrie, G. Historical Aerial Photography of Ethiopia Recovery & Organisation of Important Documentation from the 1930s. Geoinformatics 2013, 16, 32–36. [Google Scholar]
  42. Debever, M. Semi-Automated Land Use/Land Cover Extraction from Historical Aerial Photographs: A Case Study in Dogu’a Tembien (Ethiopia) over the Period 1935–1994. Master’s Thesis, University Ghent, Ghent, Belgium, 2019. [Google Scholar]
  43. QGIS Development Team. QGIS Geographic Information System 2021. Open Source Geospatial Foundation Project. Available online: https://qgis.org/download/ (accessed on 24 February 2022).
  44. Nyssen, J.; Petrie, G.; Mohamed, S.; Gebremeskel, G.; Seghers, V.; Debever, M.; Hadgu, K.M.; Stal, C.; Billi, P.; Demaeyer, P.; et al. Recovery of the Aerial Photographs of Ethiopia in the 1930s. J. Cult. Herit. 2016, 17, 170–178. [Google Scholar] [CrossRef]
  45. Pontius, R.G.; Shusas, E.; McEachern, M. Detecting Important Categorical Land Changes While Accounting for Persistence. Agric. Ecosyst. Environ. 2004, 101, 251–268. [Google Scholar] [CrossRef]
  46. Esri. ArcMap [GIS Software], Version 10.6.1; Esri: Redlands, CA, USA, 2018.
  47. Gassman, P.W.; Reyes, M.R.; Green, C.H.; Arnold, J.G. The Soil and Water Assessment Tool: Historical Development, Applications, and Future Research Directions. Trans. ASABE 2007, 50, 1211–1250. [Google Scholar] [CrossRef]
  48. Neitsch, S.L.; Arnold, J.G.; Kiniry, J.R.; Williams, J.R. Soil & Water Assessment Tool Theoretical Documentation Version 2009; Texas Water Resources Institute: College Station, TX, USA, 2009. [Google Scholar]
  49. Arnold, J.G.; Moriasi, D.N.; Gassman, P.W.; Abbaspour, K.C.; White, M.J.; Srinivasan, R.; Santhi, C.; Harmel, R.D.; Van Griensven, A.; Van Liew, M.W.; et al. SWAT: Model Use, Calibration, and Validation. Trans. ASABE 2012, 55, 1491–1508. [Google Scholar] [CrossRef]
  50. Pereira, D.; Afonso, A.; Medeiros, F. Overview of Friedman’s Test and Post-Hoc Analysis. Commun. Stat. Simul. Comput. 2015, 44, 2636–2653. [Google Scholar] [CrossRef]
  51. Govender, T.; Dube, T.; Shoko, C. Remote Sensing of Land Use-Land Cover Change and Climate Variability on Hydrological Processes in Sub-Saharan Africa: Key Scientific Strides and Challenges. Geocarto Int. 2022, 37, 10925–10949. [Google Scholar] [CrossRef]
  52. Mahé, G. The Impacts of Land-Use/Land-Cover Change and Climate Variability on the Hydrology of the Sahel. In Proceedings of the 5th FRIEND World Conference; IAHS Press: Havanna, Cuba, 2006; Volume 308, pp. 679–684. [Google Scholar]
  53. Ruelland, D.; Dezetter, A.; Puech, C.; Ardoin-Bardin, S. Long-term Monitoring of Land Cover Changes Based on Landsat Imagery to Improve Hydrological Modelling in West Africa. Int. J. Remote Sens. 2008, 29, 3533–3551. [Google Scholar] [CrossRef]
  54. Guzha, A.C.; Rufino, M.C.; Okoth, S.; Jacobs, S.; Nóbrega, R.L.B. Impacts of Land Use and Land Cover Change on Surface Runoff, Discharge and Low Flows: Evidence from East Africa. J. Hydrol. Reg. Stud. 2018, 15, 49–67. [Google Scholar] [CrossRef]
  55. Ordway, E.M.; Asner, G.P.; Lambin, E.F. Deforestation Risk Due to Commodity Crop Expansion in Sub-Saharan Africa. Environ. Res. Lett. 2017, 12, 044015. [Google Scholar] [CrossRef]
  56. Herrmann, S.M.; Brandt, M.; Rasmussen, K.; Fensholt, R. Accelerating Land Cover Change in West Africa over Four Decades as Population Pressure Increased. Commun. Earth Environ. 2020, 1, 53. [Google Scholar] [CrossRef]
  57. Assede, E.S.P.; Orou, H.; Biaou, S.S.H.; Geldenhuys, C.J.; Ahononga, F.C.; Chirwa, P.W. Understanding Drivers of Land Use and Land Cover Change in Africa: A Review. Curr. Landsc. Ecol. Rep. 2023, 8, 62–72. [Google Scholar] [CrossRef]
  58. Mariye, M.; Jianhua, L.; Maryo, M. Land Use and Land Cover Change, and Analysis of Its Drivers in Ojoje Watershed, Southern Ethiopia. Heliyon 2022, 8, e09267. [Google Scholar] [CrossRef]
  59. Nyssen, J.; Poesen, J.; Moeyersons, J.; Deckers, J.; Haile, M.; Lang, A. Human Impact on the Environment in the Ethiopian and Eritrean Highlands—A State of the Art. Earth-Sci. Rev. 2004, 64, 273–320. [Google Scholar] [CrossRef]
  60. Mekuria, W.; Yami, M.; Haile, M.; Gebrehiwot, K.; Birhane, E. Impact of Exclosures on Wood Biomass Production and Fuelwood Supply in Northern Ethiopia. J. For. Res. 2019, 30, 629–637. [Google Scholar] [CrossRef]
  61. Desta, Y.; Goitom, H.; Aregay, G. Investigation of Runoff Response to Land Use/Land Cover Change on the Case of Aynalem Catchment, North of Ethiopia. J. Afr. Earth Sci. 2019, 153, 130–143. [Google Scholar] [CrossRef]
  62. Nyssen, J. Erosion Processes and Soil Conservation in a Tropical Mountain Catchment Under Threat of Anthropogenic Desertification—A Case Study from Northern Ethiopia. Ph.D. Thesis, KU Leuven, Leuven, Belgium, 2001. [Google Scholar]
  63. Frankl, A.; Poesen, J.; Haile, M.; Deckers, J.; Nyssen, J. Quantifying Long-Term Changes in Gully Networks and Volumes in Dryland Environments: The Case of Northern Ethiopia. Geomorphology 2013, 201, 254–263. [Google Scholar] [CrossRef]
  64. Astuti, A.J.D.; Dondeyne, S.; Lemma, H.; Nyssen, J.; Annys, S.; Frankl, A. Recent Dynamics in Sediment Connectivity in the Ethiopian Highlands. Reg. Environ. Change 2024, 24, 109. [Google Scholar] [CrossRef]
  65. Leblanc, M.J.; Favreau, G.; Massuel, S.; Tweed, S.O.; Loireau, M.; Cappelaere, B. Land Clearance and Hydrological Change in the Sahel: SW Niger. Glob. Planet. Change 2008, 61, 135–150. [Google Scholar] [CrossRef]
  66. Gashaw, T.; Tulu, T.; Argaw, M.; Worqlul, A.W. Modeling the Hydrological Impacts of Land Use/Land Cover Changes in the Andassa Watershed, Blue Nile Basin, Ethiopia. Sci. Total Environ. 2018, 619–620, 1394–1408. [Google Scholar] [CrossRef]
  67. Gyamfi, C.; Ndambuki, J.; Salim, R. Simulation of Sediment Yield in a Semi-Arid River Basin under Changing Land Use: An Integrated Approach of Hydrologic Modelling and Principal Component Analysis. Sustainability 2016, 8, 1133. [Google Scholar] [CrossRef]
  68. Baker, T.J.; Miller, S.N. Using the Soil and Water Assessment Tool (SWAT) to Assess Land Use Impact on Water Resources in an East African Watershed. J. Hydrol. 2013, 486, 100–111. [Google Scholar] [CrossRef]
  69. Aneseyee, A.B.; Elias, E.; Soromessa, T.; Feyisa, G.L. Land Use/Land Cover Change Effect on Soil Erosion and Sediment Delivery in the Winike Watershed, Omo Gibe Basin, Ethiopia. Sci. Total Environ. 2020, 728, 138776. [Google Scholar] [CrossRef] [PubMed]
  70. Mekuria, W.; Veldkamp, E.; Haile, M.; Nyssen, J.; Muys, B.; Gebrehiwot, K. Effectiveness of Exclosures to Restore Degraded Soils as a Result of Overgrazing in Tigray, Ethiopia. J. Arid. Environ. 2007, 69, 270–284. [Google Scholar] [CrossRef]
  71. Descroix, L.; González Barrios, J.L.; Viramontes, D.; Poulenard, J.; Anaya, E.; Esteves, M.; Estrada, J. Gully and Sheet Erosion on Subtropical Mountain Slopes: Their Respective Roles and the Scale Effect. CATENA 2008, 72, 325–339. [Google Scholar] [CrossRef]
  72. Girmay, G.; Singh, B.R.; Nyssen, J.; Borrosen, T. Runoff and Sediment-Associated Nutrient Losses under Different Land Uses in Tigray, Northern Ethiopia. J. Hydrol. 2009, 376, 70–80. [Google Scholar] [CrossRef]
  73. Niang, I.; Ruppel, O.C.; Abdrabo, M.A.; Essel, A.; Lennard, C.; Padgham, J.; Urquhart, P. Africa. In Climate Change 2014: Impacts, Adaptation, and Vulnerability. Part B: Regional Aspects. Contribution of Working Group II to the Fifth Assessment Report of the Intergovernmental Panel on Climate Change; Barros, V.R., Field, C.B., Dokken, D.J., Mastrandrea, M.D., Mach, K.J., Bilir, T.E., Chatterjee, M., Ebi, K.L., Estrada, Y.O., Genova, R.C., et al., Eds.; Cambridge University Press: Cambridge, UK; New York, NY, USA, 2014; pp. 1199–1265. [Google Scholar]
  74. Meaza, H.; Ghebreyohannes, T.; Tesfamariam, Z.; Gebresamuel, G.; Demissie, B.; Gebregziabher, D.; Nyssen, J. The Effects of Armed Conflict on Natural Resources and Conservation Measures in Tigray, Northern Ethiopia. Int. Soil Water Conserv. Res. 2025, 13, 463–474. [Google Scholar] [CrossRef]
  75. Demissie, B.; Van Eetvelde, V.; Frankl, A.; Billi, P.; Asfaha, T.G.; Haile, M.; Nyssen, J. Dynamics of Ephemeral Streams at the Foot of Degraded Catchments in Northern Ethiopia. Land Degrad. Dev. 2020, 31, 591–606. [Google Scholar] [CrossRef]
  76. Negash, E.; Birhane, E.; Gebrekirstos, A.; Gebremedhin, M.A.; Annys, S.; Rannestad, M.M.; Berhe, D.H.; Sisay, A.; Alemayehu, T.; Berhane, T.; et al. Remote Sensing Reveals How Armed Conflict Regressed Woody Vegetation Cover and Ecosystem Restoration Efforts in Tigray (Ethiopia). Sci. Remote Sens. 2023, 8, 100108. [Google Scholar] [CrossRef]
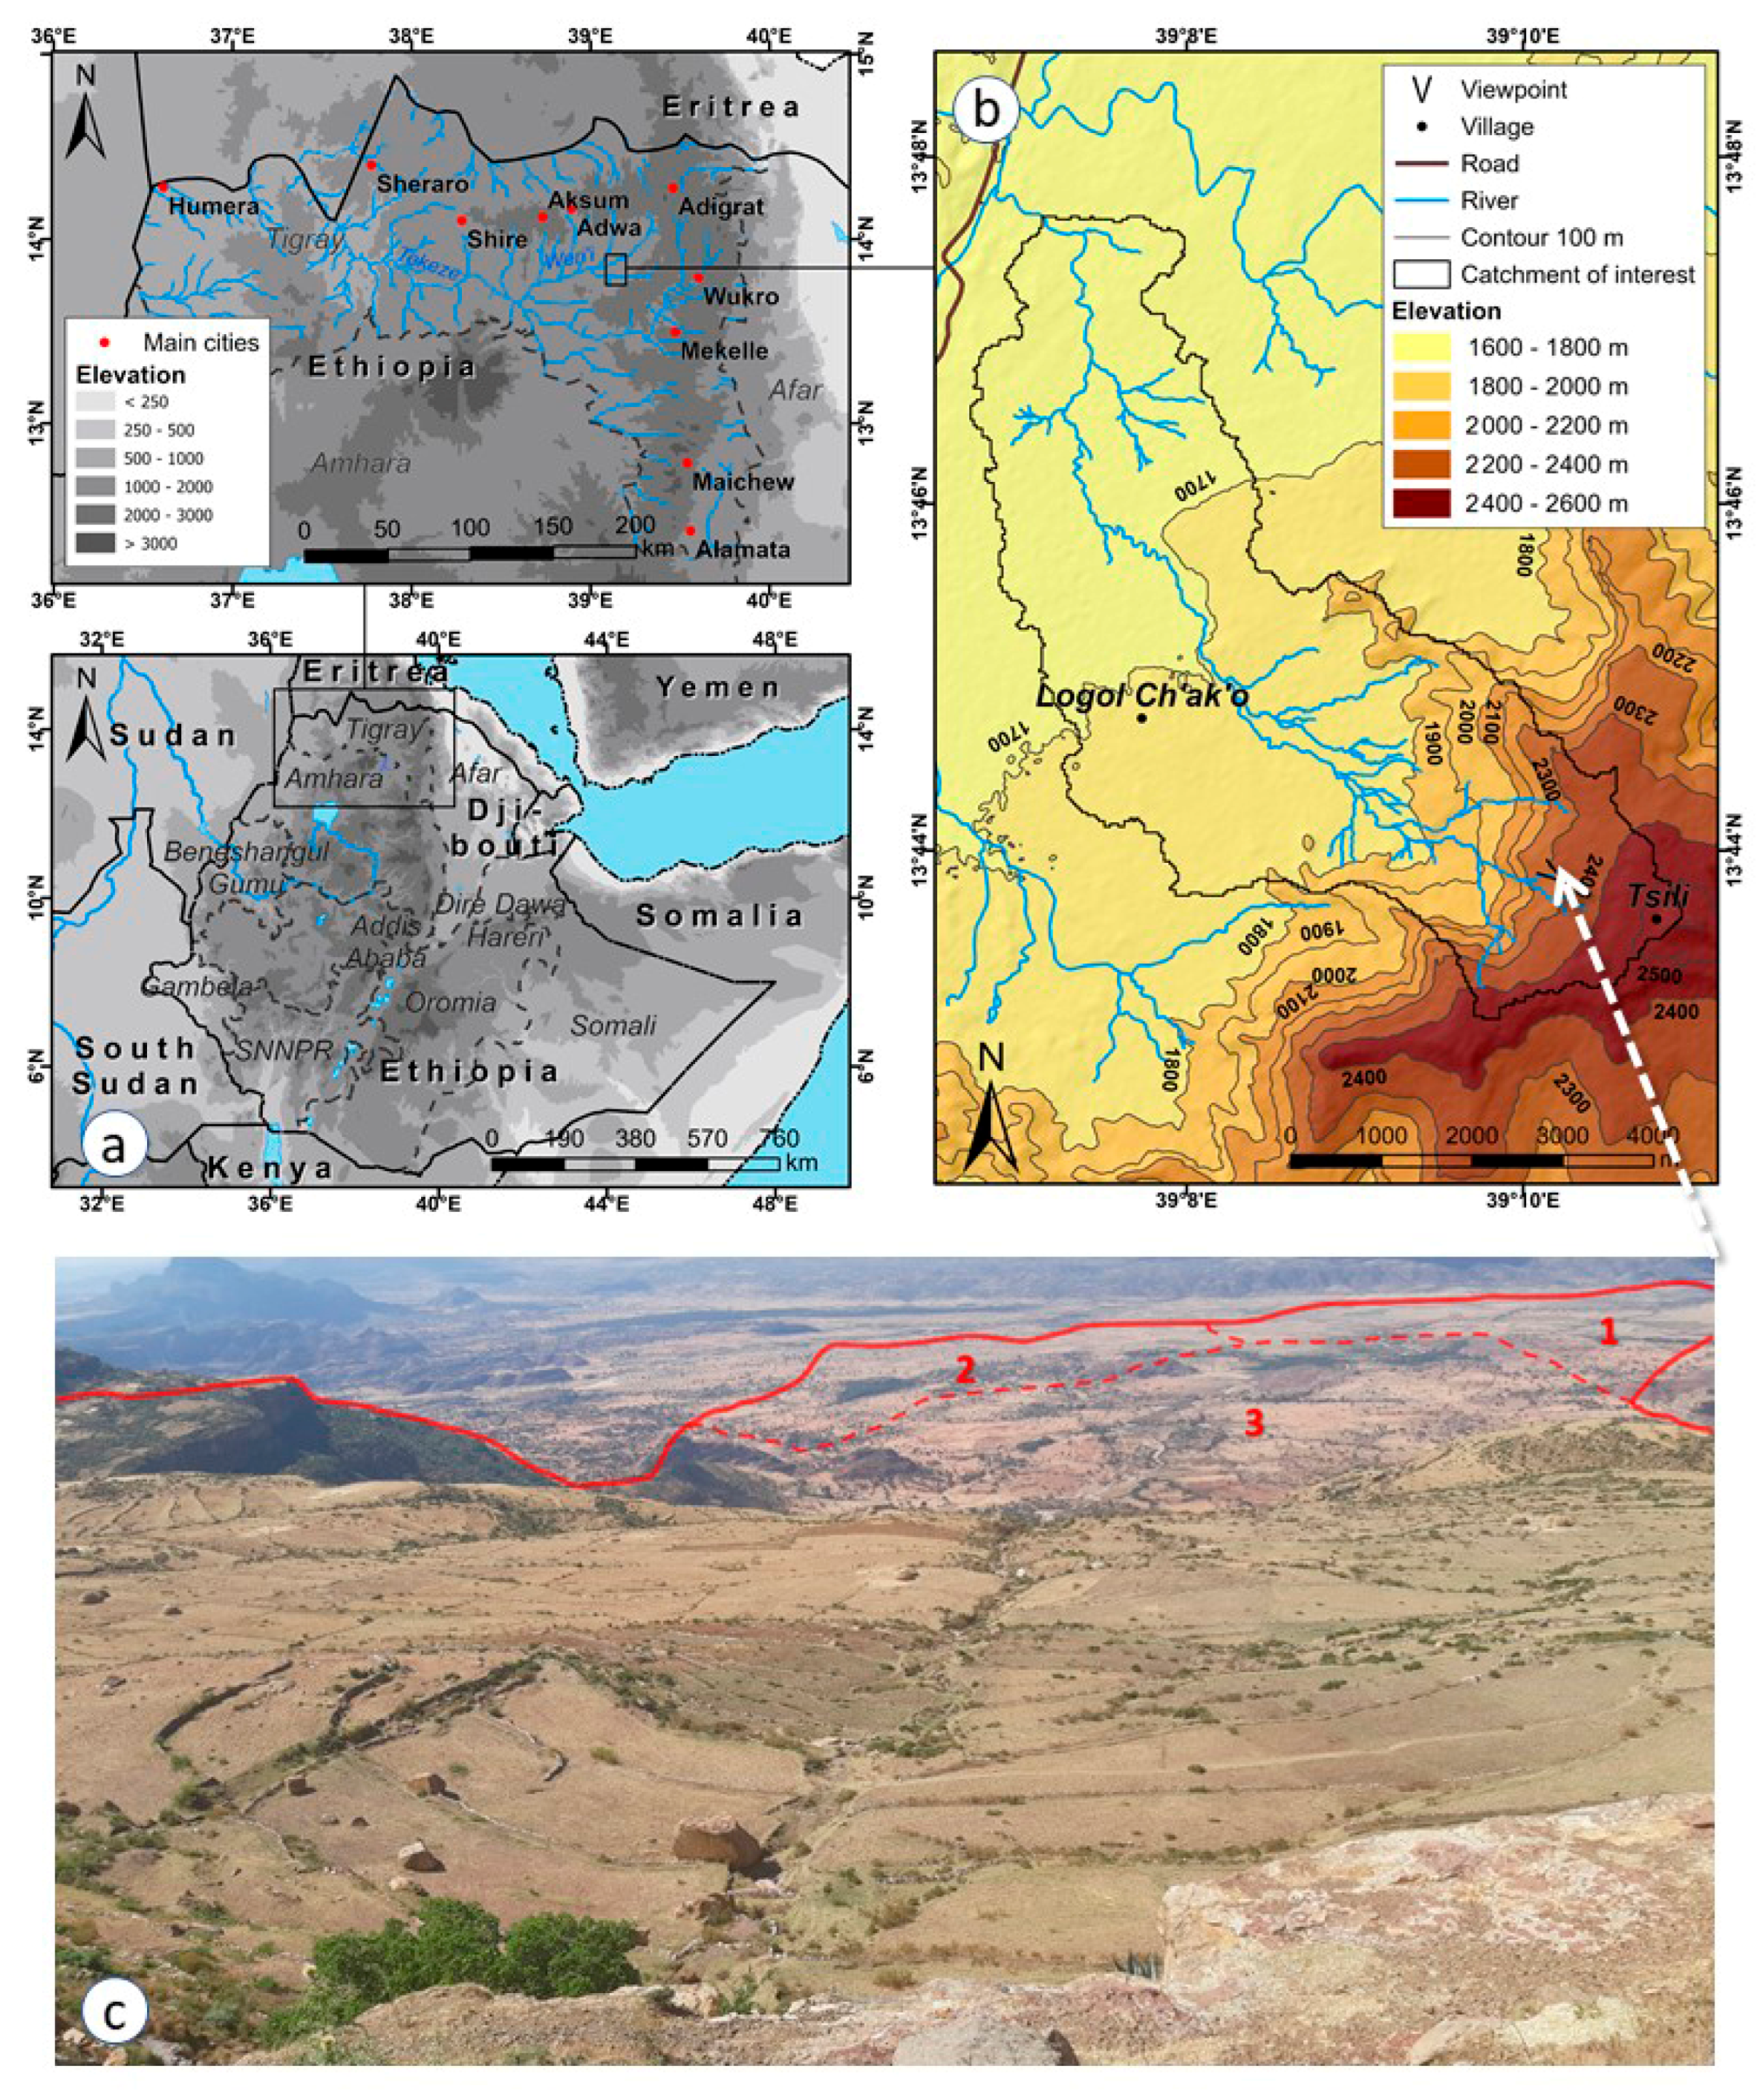
Figure 1. (a) Location of the study area in Tigray, Ethiopia; (b) Topography and boundary of the Tsili catchment; (c) View from the edge of the escarpment looking west-northwest over the lower plains. The solid line marks the boundary of the main catchment, while the dotted lines outline the subcatchments. Numbered labels correspond to the subcatchments referenced in the text. (Authors’ cartography; photo: Jan Nyssen, 2019).
Land 14 01897 g001
Figure 2. Landcover and drainage network in the four time periods based on visual interpretation of aerial photos (1935, 1964, 1967, 1994) and satellite images available through Google Earth [40] The numbers (1, 2 and 3) indicate the subcatchments.
Land 14 01897 g002
Figure 3. Sankey diagram of landcover changes for the Tsili catchment based on a persistence analysis for four reference years: 1935, 1967, 1994, 2020.
Land 14 01897 g003
Figure 4. Aerial images of the four time steps with the river channel width measurement points. Black bars stand for considered river channel widths; red dots the centre line of the riverbed.
Land 14 01897 g004
Figure 5. Boxplots of simulated annual surface runoff for each time period based on identical 10-year meteorological forcing but varying landcover conditions. The dots represent individual data points. The progressive landcover changes went along with an increase in surface runoff. All median values are significant different from each other (p ≤ 0.05).
Land 14 01897 g005
Figure 6. Relationships between landcover change, hydrological response, and channel morphology. (a) Expansion of cropland area led to higher surface runoff, and (b) is also associated with wider river channels. Increased (c) drainage density and (d) surface runoff is linked to wider channels. Regression lines (black dashed line) are included in each panel to indicate the trends.
Land 14 01897 g006
Table 1. Geomorphologic and geologic units, and associated soil units.
Dominant Soil UnitLithologyGeological UnitPhysiographic Unit
Eutric PlanosolsSiltstone and fine to coarse-grained sandstone, minor calcareous ferruginous silt and clayAdigrat and Enticho Sandstone outcrops surrounded by large alluvial-colluvial deposits (pediplain)Valley–Pediplain
(1600–1800 m a.s.l.)
Lithic LeptosolsSiltstone and fine to coarse-grained sandstone, minor calcareous ferruginous silt and clayAdigrat SandstoneLower half of the escarpment
(1800–2000 m a.s.l.)
Lithic Leptosols
Leptic/Skeletic Cambisols
Leptic/Skeletic Regosols
Finely crystalline sandy limestone and marl
Coquina, oolitic limestone and marl
Antalo LimestoneMiddle escarpment
(2000–2400 m a.s.l.)
Lithic Leptosols
Calcaric Regosols
Clay, silt, sandstone, pebble conglomerate and silty clayAmba Aradam FormationUpper part of the escarpment
(2400–2500 m a.s.l.)
Lithic Leptosols
Pellic Vertisols
Olivine basalt with minor interbedded lacustrine depositsTrap basaltsOn the plateau
(2500–2600 m a.s.l.)
Adapted from Arkin et al. [32] and Nyssen et al. [8]; Soil units, following the 4th edition of the World Reference Base for soil resources [36].
Table 3. Drainage length and drainage density across subcatchments and the overall catchment per time period.
Drainage Length (km)Drainage Density (km−2)
Subcatchment19351967199420201935196719942020
Sub-18.5511.8214.4315.811.081.491.821.99
Sub-20.270.320.540.920.070.090.150.25
Sub-322.5426.9928.5632.431.421.691.792.04
Overall31.3739.1343.5349.171.141.421.581.79
Table 4. Mean and standard deviation of runoff coefficients (%) based on simulated annual runoff for each time period, using identical 10-year meteorological forcing, with average rainfall: 844 ± 133 mm year−1, under varying landcover conditions.
Subcatchment1935196719942020
Sub-19.8 ± 4.311.7 ± 5.011.9 ± 5.012.4 ± 5.2
Sub-26.6 ± 3.19.0 ± 4.010.6 ± 4.612.7 ± 5.3
Sub-312.2 ± 4.913.1 ± 5.315.2 ± 5.816.7 ± 6.4
Overall28.6 ± 12.333.8 ± 14.337.7 ± 15.441.8 ± 17.0
Disclaimer/Publisher’s Note: The statements, opinions and data contained in all publications are solely those of the individual author(s) and contributor(s) and not of MDPI and/or the editor(s). MDPI and/or the editor(s) disclaim responsibility for any injury to people or property resulting from any ideas, methods, instructions or products referred to in the content.