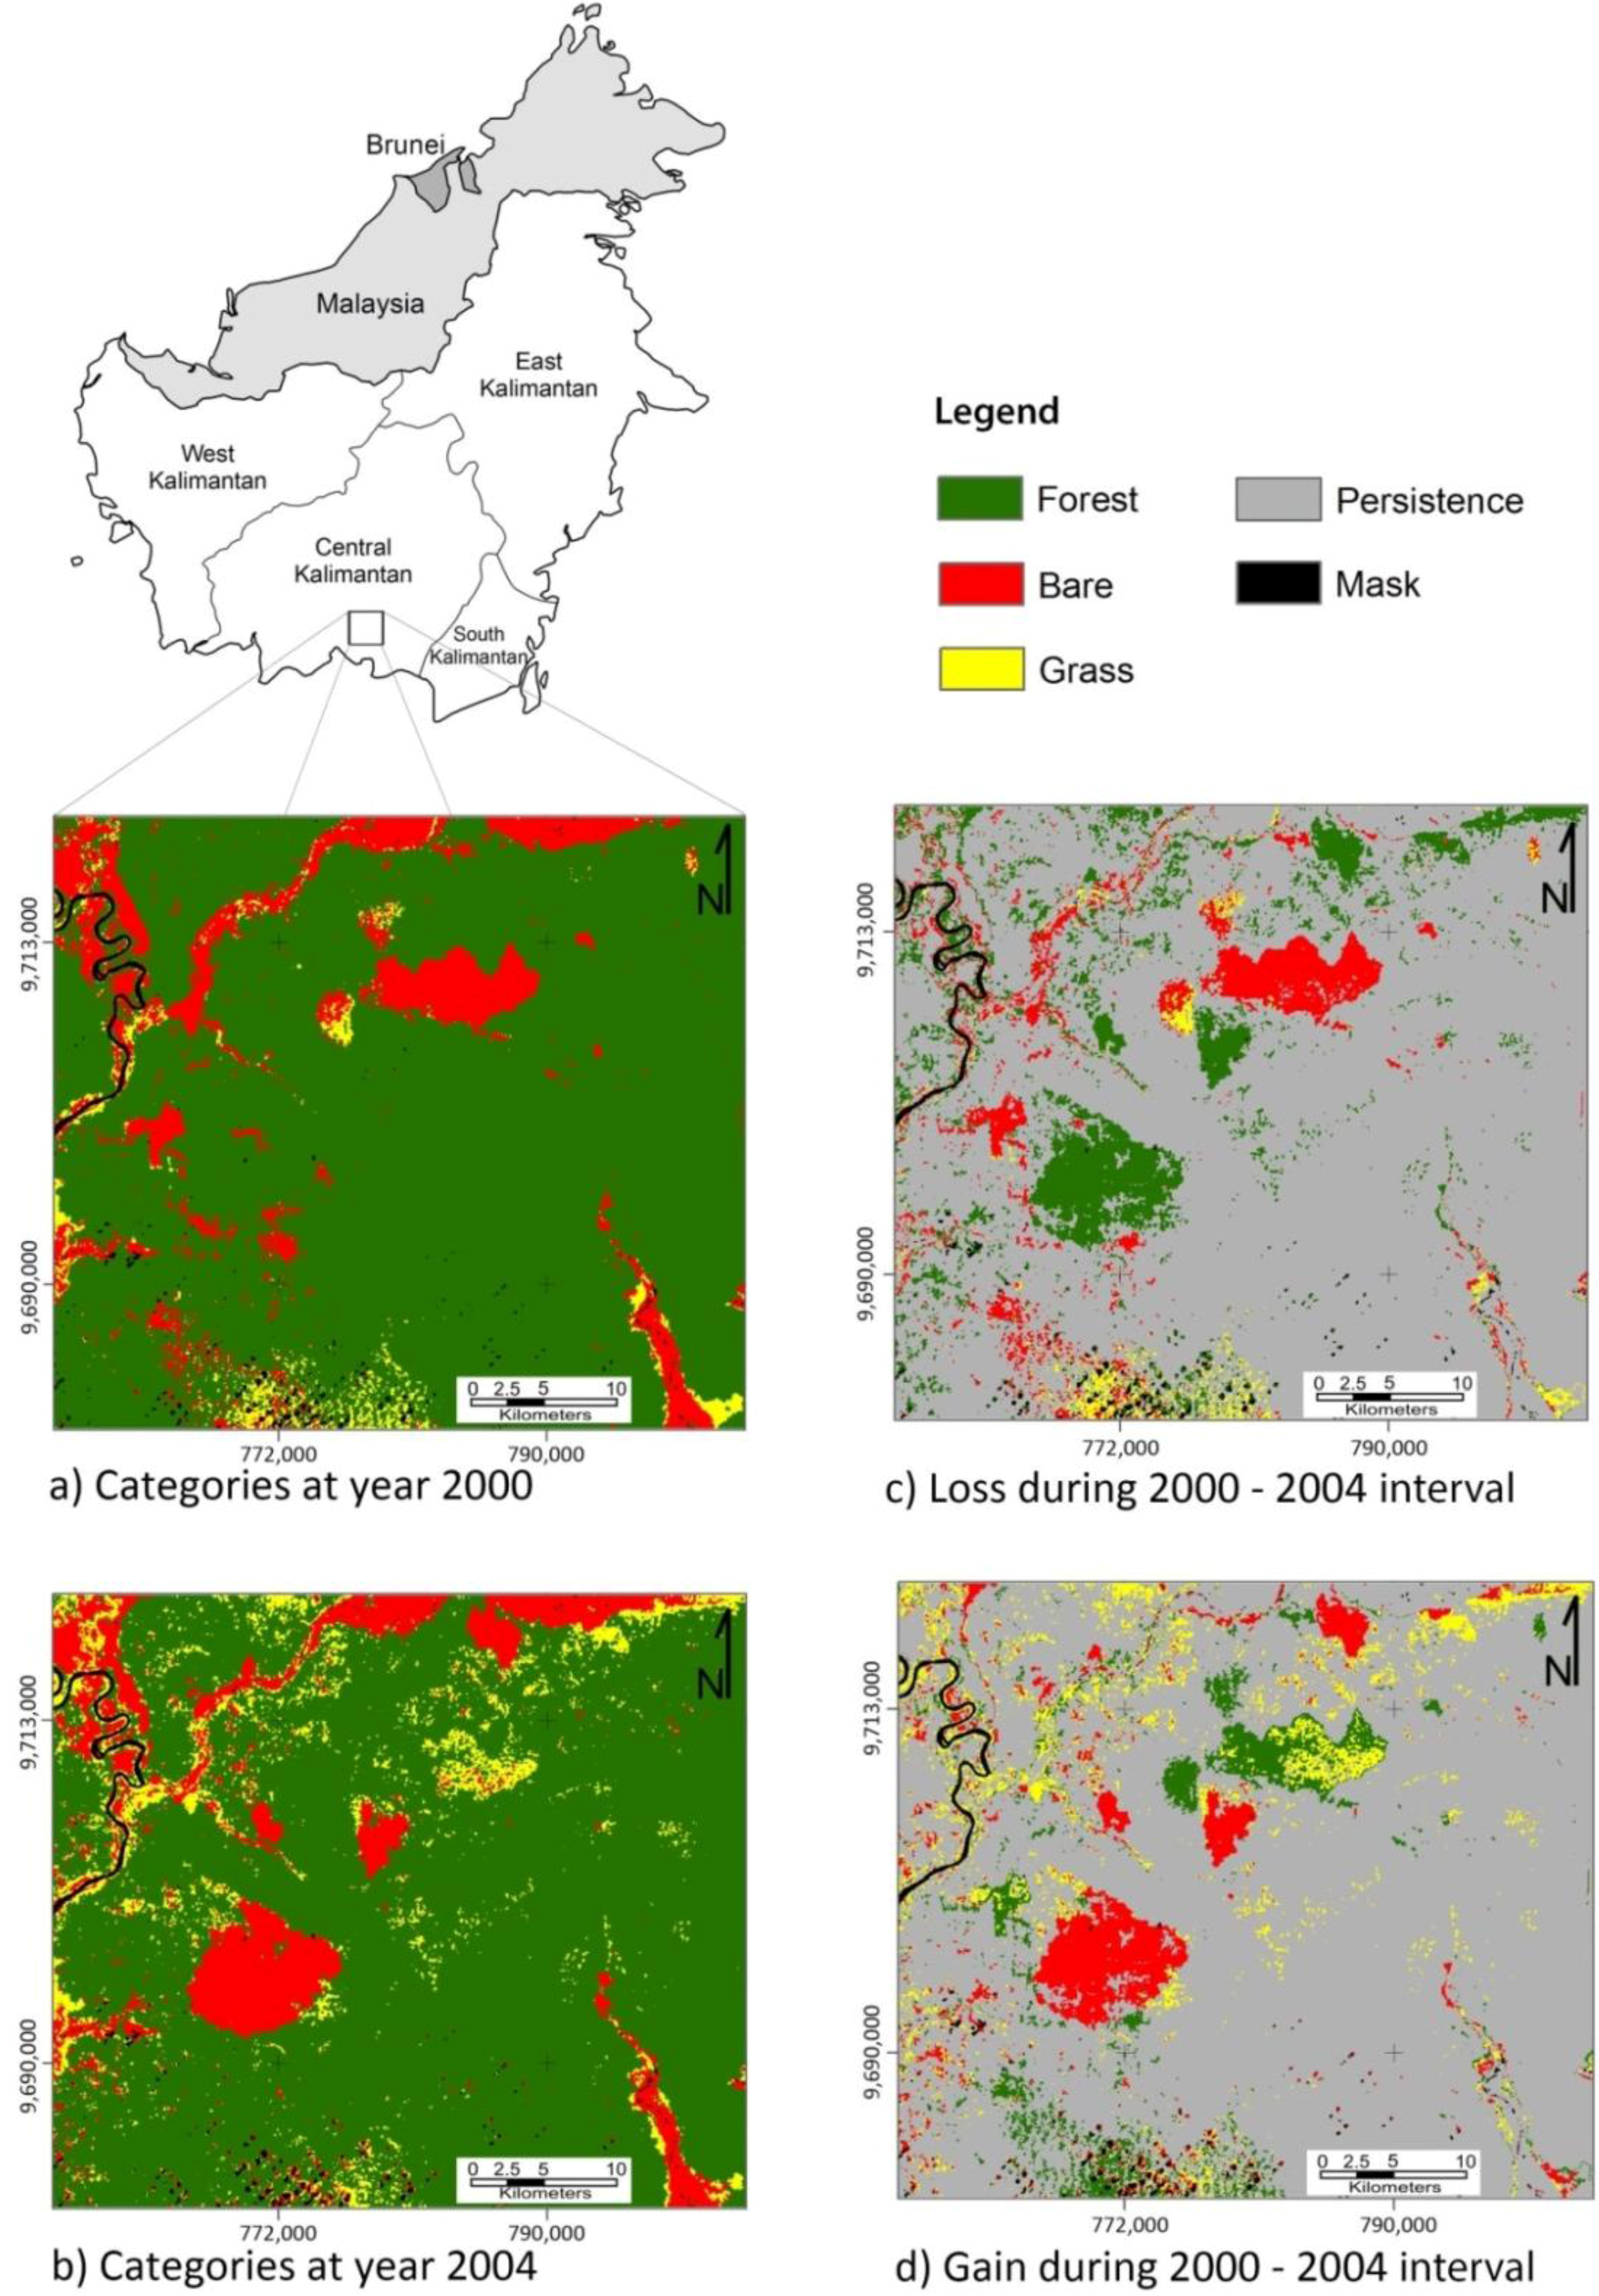
Design and Interpretation of Intensity Analysis Illustrated by Land Change in Central Kalimantan, Indonesia

 ,
, 
Abstract
Share and Cite
Pontius, R.G., Jr.; Gao, Y.; Giner, N.M.; Kohyama, T.; Osaki, M.; Hirose, K. Design and Interpretation of Intensity Analysis Illustrated by Land Change in Central Kalimantan, Indonesia. Land 2013, 2, 351-369. https://doi.org/10.3390/land2030351
Pontius RG Jr., Gao Y, Giner NM, Kohyama T, Osaki M, Hirose K. Design and Interpretation of Intensity Analysis Illustrated by Land Change in Central Kalimantan, Indonesia. Land. 2013; 2(3):351-369. https://doi.org/10.3390/land2030351
Chicago/Turabian StylePontius, Robert Gilmore, Jr., Yan Gao, Nicholas M. Giner, Takashi Kohyama, Mitsuru Osaki, and Kazuyo Hirose. 2013. "Design and Interpretation of Intensity Analysis Illustrated by Land Change in Central Kalimantan, Indonesia" Land 2, no. 3: 351-369. https://doi.org/10.3390/land2030351
APA StylePontius, R. G., Jr., Gao, Y., Giner, N. M., Kohyama, T., Osaki, M., & Hirose, K. (2013). Design and Interpretation of Intensity Analysis Illustrated by Land Change in Central Kalimantan, Indonesia. Land, 2(3), 351-369. https://doi.org/10.3390/land2030351