Article

Chassis Assembly Detection and Identification Based on Deep Learning Component Instance Segmentation

School of Mechanical and Automotive Engineering, South China University of Technology, Guangzhou 510641, China
*
Author to whom correspondence should be addressed.
Symmetry 2019, 11(8), 1001; https://doi.org/10.3390/sym11081001
Submission received: 4 June 2019 / Revised: 22 July 2019 / Accepted: 22 July 2019 / Published: 3 August 2019

Abstract

:
Chassis assembly quality is a necessary step to improve product quality and yield. In recent years, with the continuous expansion of deep learning method, its application in product quality detection is increasingly extensive. The current limitations and shortcomings of existing quality detection methods and the feasibility of improving the deep learning method in quality detection are presented and discussed in this paper. According to the characteristics of numerous parts and complex types of chassis assembly components, a method for chassis assembly detection and identification based on deep learning component segmentation is proposed. In the proposed method, assembly quality detection is first performed using the Mask regional convolutional neural network component instance segmentation method, which reduces the influence of complex illumination conditions and background detection. Next, a standard dictionary of chassis assembly is built, which is connected with Mask R-CNN in a cascading way. The component mask is obtained through the detection result, and the component category and assembly quality information is extracted to realize chassis assembly detection and identification. To evaluate the proposed method, an industrial assembly chassis was used to create datasets, and the method is effective in limited data sets of industrial assembly chassis. The experimental results indicate that the accuracy of the proposed method can reach 93.7%. Overall, the deep learning method realizes complete automation of chassis assembly detection.

1. Introduction

With the continuous development of the Internet and manufacturing industries, high-tech products, such as computers and smart electronic devices, are being used extensively in daily life and manufacturing research. The chassis is one of the key components of these mechanical and electronic devices. On the outside, assembled parts are fixed to the chassis by nuts, and they are connected to circuit wires on the inside. Figure 1 shows an image of a general-purpose computer chassis, which facilitates power-switching and signal input and output through various assembly components, thereby realizing communication and control functions.
The chassis is the key protection structure of electronic equipment, data communication equipment, and information technology equipment. Therefore, the quality of the chassis assembly directly affects the use of the product, and it is necessary to test and analyze its quality. Accordingly, it is necessary to identify the position of the actual assembly, obtain assembly position information, and analyze the quality according to the assembly standard. However, it is difficult to perform the inspection task efficiently and with high quality using the traditional manual detection method because the assembly parts of the chassis have many features and complicated configurations. It is thus essential to develop new detection methods. At present, various detection methods for assembly and electronic components have been proposed. These methods can be divided into two categories: reference image detection and non-reference image detection [1].
In reference image detection methods, the image to be detected is compared with a reference image. As such, it is necessary to specify a standard reference image, through which the degree of similarity between the detected object and the standard is obtained [2]. For this purpose, the histogram and template matching algorithms are mainly implemented. The former is used to calculate the image histogram and normalize it based on simple vector similarity versus an image similarity metric. Zeng et al. proposed a method based on a sector descriptor to effectively improve the accuracy of blasthole defect recognition by dividing the gradient histogram [3]. Tahir et al. extracted the directional gradient feature histogram from the University of Bremen to form a feature vector for solving the problem of unclear boundary of image noise area [4]. As the histogram is the probability distribution of the gray value of the reaction image and there is no image space position information, it is prone to large amounts of information loss. The template matching algorithm locates the position of a particular object in the image and then identifies the object. Kumar et al. [5] proposed a detection algorithm for image enhancement and standard template generation to automatically detect reference matching defects; the detection time of the algorithm is as short as 14 ms. Kim et al. used a feature matching defect detection method to determine the corresponding relationship between feature sets to detect faults [6]. Huang et al. proposed a standard machine assembly quality machine vision method based on One Versus Rest One Versus Rest (OVR-SVM) and realized the assembly quality evaluation of standard components based on the support vector machine by using the One Versus Rest (OVR) strategy [7]. Srisaila et al. proposed utilizing the connection component and template matching technology to solve the problems of image blur and uneven brightness, and complete image segmentation and matching tasks [8]. The template matching algorithm is simple, and highly effective detection can be achieved under ideal conditions, but it is difficult to obtain better detection effects using it in cases of rotation or size change of the matching target in the original image.
The non-reference image detection approach extracts image features and performs detection according to detection criteria or rules without reference images. Minaee S et al. realized image foreground and background separation through image signal decomposition and achieved good segmentation effect for some pictures with prominent foreground, with segmentation algorithm precision up to 95% [9,10]. However, it is suitable for image segmentation with a prominent foreground. Deep learning is a typical method for non-reference image detection, in which training is performed layer by layer through unsupervised learning methods and then optimization is performed using a supervised backpropagation algorithm [11,12]. Therefore, multiple model structures with deep learning have been widely used in image detection. Semantic segmentation network in deep learning has been widely used in image detection. Badrinarayanan V et al. designed a semantic segmentation network based on VGG to solve the problem of semantic segmentation of images recognized by autonomous driving or intelligent robots, but its classification effect still cannot be applied in practice [13]. Romera-paredes B et al. proposed a case segmentation model based on recursive neural network, which can realize the case segmentation of blocked images in sequence and solve the segmentation problem of blocked images [14]. Because the deep learning method exhibits strong data fitting ability and has the learning advantage of simulating the human brain structure, by applying the deep learning method to practical detection, such as automatic driving, better and rapid detection results can be obtained. However, errors may still occur owing to the low sample set limit of the specific test object [15,16,17].
In recent years, the cascade network of researchers has achieved better results [18]. For example, existing approaches [19,20,21,22,23,24,25,26,27,28] have been proposed to use the cascade network method. The method is easy to define and combined with the deep learning method, such as R-CNN. Aiming at the limitations of the neural network in the detection of a class of objects, expert prior knowledge [20] and information system [21] are added to solve the problem of small data set samples, and at the same time to improve the classification accuracy of detection objects under the condition of small training data set, so as to reduce the detection error rate caused by classification errors.
Deep learning can be used to extract multi-layer features of detected objects in an image, and adapt to the detection in different environments, such as diverse backgrounds and complex illumination. With these advantages, it is widely used in image recognition and detection. However, to the best of our knowledge, the application of deep learning to chassis assembly inspection has not yet been investigated. In order to find a simpler and more effective detection and identification method, this paper proposes the adoption of a non-reference method. By transforming the chassis image into a pixel prediction mask based on an example segmentation of deep learning, detection and identification of each component of the chassis are realized, in order to solve the detection problem caused by the limited sample set, we adopt cascade network and join the standard dictionary (SD) network pixel information divided and output according to the example is used for positioning, and the outer shape of the chassis and the size of the component are determined.
The main contributions of this paper are as follows:
(1) A (SD) Mask regional CNN (R-CNN) based component instance segmentation method is proposed to handle assembly quality inspection tasks. Compared with other methods, the detection results are obtained more quickly and accurately under complex illumination conditions and backgrounds.
(2) The proposed method solves the problem of chassis assembly parts being prone to misdetection due to the numerous parts and complex types. Furthermore, the component mask can be quickly and accurately acquired, and the component category and assembly quality information obtained. Next an SD is built according to the identification of the chassis model and the authentication SD selected to achieve chassis assembly detection and identification.
(3) Cascade architecture [18] was used to connect the SD with Mask R-CNN, achieving better detection results under the condition of limited sample sets.
The remainder of this paper is organized as follows: Section 2 introduces the Mask R-CNN component instance segmentation method, SD Mask R-CNN model, and Mask R-CNN based component instance segmentation and positioning. Section 3 describes the chassis detection method. Section 4 outlines the multiple sets of experiments conducted and analyzes the results obtained. Finally, Section 5 presents concluding remarks.

2. Background of the Proposed Method

In this study, Mask R-CNN was first introduced into the basic framework of Faster R-CNN to achieve pixel-level segmentation. Then, the SD corresponding to the chassis model was built, and the SD Mask R-CNN model established. Finally, the instance segmentation method was implemented. This method incorporates the full convolutional network (FCN) and region of interest align (ROIAlign) techniques to achieve accurate segmentation of the chassis image and processing of corresponding pixel values [29].

2.1. SD Mask R-CNN Model

Mask R-CNN, developed by Kaiming et al. [30], is an extension of Faster R-CNN. For each proposal box of Faster R-CNN, FCN is used for semantic segmentation, and the segmentation task is performed simultaneously with positioning and classification tasks [29,31,32]. Faster R-CNN is used to input an entire picture into CNN, and it performs detection by extracting the feature frame candidate frame convolution, classification, and regression adjustment position. Figure 2 shows a flowchart of Faster R-CNN. ResNet-101+FPN is used as the feature extraction network to achieve the highest state-of-the-art effect, and ROIAlign is used to solve the misalignment problem. A Mask R-CNN pre-training network is well adapted to multi-class object detection, converges to the ideal state faster, and achieves image instance segmentation. The special structure of CNN local weight sharing has unique advantages in image processing; in particular, images of multi-dimensional input vectors can be directly input into the network to avoid the complexity of data reconstruction in the feature extraction and classification process [33,34,35,36]. Therefore, Mask R-CNN is used to extract and classify the chassis components to implement instance segmentation. More details on Mask R-CNN can be found in [30].
Mask R-CNN is a general framework for object instance segmentation that accurately detects objects in an image while generating a segmentation mask for each instance. It consists mainly of two modules: a convolution backbone architecture for feature extraction on the entire image and an upper layer network for border recognition (classification and regression) and mask prediction, which is applied to each region of interest (ROI). Because Mask R-CNN can complete image instance segmentation and find and classify objects, each type of component can be re-identified and the spatial position information of each object can be obtained. However, only identification of the detection object is realized, and the detection and identification cannot be directly completed according to the instance division information. There are many types of chassis components, and the same type of components have the same shape. According to the characteristics of the assembly standard of each model, we can judge the information by constructing the SD corresponding to the chassis model.
After the image of the chassis to be detected is input, the CNN is first used for feature extraction. For each anchor point, nine bounding boxes are generated according to different sizes (128, 256, 512 pixels) and different aspect ratios (1:1, 0.5:1, 1:0.5). Simultaneously, a full CNN is used to distinguish and initially locate multiple ROIs. Then, through size transformation, it enters the full CNN and Mask structure. The full CNN completes the boundary regression and classification task, and Mask completes the pixel-level instance segmentation task. Subsequently, the class information is used to identify the chassis model, find the corresponding dictionary, and finally the dictionary is used to realize identification of the chassis assembly parts.
During the overall detection process, the input feature vector S = ( S x , S y , S w , S h ) is defined, where x,y,w,h are the coordinates of the center point of the feature map and the width and height, respectively. The predicted bounding box feature vector t = ( t x , t y , t w , t h ) is
{ t x = x x a w a , t y = y y a h a , t w = log w w a , t h = log h h a
Then, the loss function can be expressed as follows:
L o s s = i N ( t * i ω * T Φ ( S i ) ) 2
where t * i is the correctly calibrated ground truth, ω * T is the learning parameter, and Φ ( S i ) is the input feature vector.
Following classification, border selection, and mask calculation, the multitasking loss function is defined as follows:
L = L c l s + L b o x + L m a s k ,
where L c l s is the classification loss, L b o x is the frame loss, and L m a s k is the mask loss.

2.2. Instance Segmentation

In general, target segmentation refers to semantic segmentation. Semantic segmentation has a long history of development and significant progress has been made. Furthermore, many scholars are currently conducting research in this area. Semantic segmentation and instance segmentation are used to segment the input image, and instance segmentation is a small field that is independent of the target segmentation domain. The instance segmentation requires finer segmentation of similar objects on the basis of semantic segmentation [37,38,39]. The instance segmentation algorithm can be used to perform more precise classification tasks for chassis assembly parts that may be similar, such as USB2.0 and USB3.0, audio input, and output interfaces, thus achieving accurate identification.

2.2.1. Full Convolutional Networks

A full convolutional network (FCN) is a hierarchical structure that can generate features through pixel-to-pixel training. It is one of the most advanced techniques for segmentation. The advantage is to build an FCN that accepts image inputs of any size and generates outputs of the corresponding size through effective reasoning and learning [29]. An FCN consists of upsample, skip layer, and convolution sections, and classifies the image at the pixel level. It can accept input images of any size and uses the deconvolution layer to upsample the last convolutional feature map to restore it to the same size as the input image, thus producing a prediction for each pixel. At the same time, the spatial information in the original input image is preserved, and the feature map of the upper and lower parity is finally subjected to pixel classification.

2.2.2. Region of Interest Align

Region of interest align (ROIAlign) is proposed to solve the problem of large pixel errors in ROI Pooling candidate frame boundary quantization and cell boundary quantization. To achieve instance segmentation, the impact of errors on the target must be reduced. Therefore, properly constructing the mask branch is critical to achieving good results. ROI Pooling uses the rounding method to quantize twice, resulting in a more severe deviation of the candidate area, while ROIAlign can preserve the precise spatial position. First, ROIAlign can increase the mask accuracy to 10% to 50%, showing a greater advantage in more stringent position measurements. Second, decoupling masks and class predictions are critical. In the absence of inter-class competition, predicting binary masks independently for each class depends on the network ROI classification branch to predict the class [30].
Following feature extraction of the chassis image, the quantization operation is cancelled, and the image value on the pixel with coordinates of floating point numbers is obtained using the bilinear interpolation method, thereby converting the entire feature aggregation process into a continuous operation. Figure 3 shows an example of the ROIAlign calculation of the chassis components. Input a 1200 by 900 image with a 175 by 75 bounding box (USB2.0). After the image is extracted through the trunk network, the stride of the feature map is 48. So, both the image and the bounding box are 1/48 of the length of the input. Eight hundred is exactly divisible by 32 into 25. but when dividing 900 by 48 you get 18.75, which is not going to be quantified. Both the chassis image and the feature map, as well as the ROI feature map, use the bilinear interpolation method to reduce the error [31].

3. Proposed Method

According to the algorithm described in Section 2, a chassis assembly detection and identification method based on deep learning component instance segmentation is proposed. Figure 4 shows a flowchart of the proposed chassis assembly detection and identification method. First, Mask R-CNN extracts the chassis image features. The extracted feature is composed of a set of multi-dimensional multivariate vectors, which represent attributes in the chassis image: component classification result, ROI spatial position information, frame offset, and mask information. Table 1 shows a list of vectors obtained by chassis image feature extraction.
The component classification structure is represented by the corresponding reference numerals; ROI spatial position information is represented by the upper left corner and the lower right corner vertical and horizontal coordinates of the rectangular frame; the border offset is represented by the offset value of the real box and the anchor; the mask information is represented by a Boolean array whose corresponding polygon value is valid. Then, according to the classification information, the corresponding assembly rule is selected by using the SD. Because misassembly and leak assembly of the assembly components randomly occur and are unpredictable, the identification cannot be directly performed using the detected image. The number and types of assembly of components in the image can be obtained through case segmentation, but it cannot guide whether there is wrong assembly or missing assembly, and cascade network is an effective method for deep learning implementation [18]. Therefore, each component of the chassis is accurately identified through a practical SD, and leakage of the assembly is confirmed according to the number of component classification results. If the chassis model is not detected or model does not exist in the SD, it is returned for re-detection. Finally, the quality of the chassis is analyzed by the identification result. Figure 4 shows a flowchart of the detection and identification methods for chassis assembly.

3.1. Mask R-CNN Based Components Instance Segmentation

As mentioned earlier, in the first step of the method, Mask R-CNN performs convolution and vectorization of the chassis image and extracts the anchor point in the form of a vector, and then performs feature extraction, full convolution, classification, regression, mask, etc., as in the previous one. 
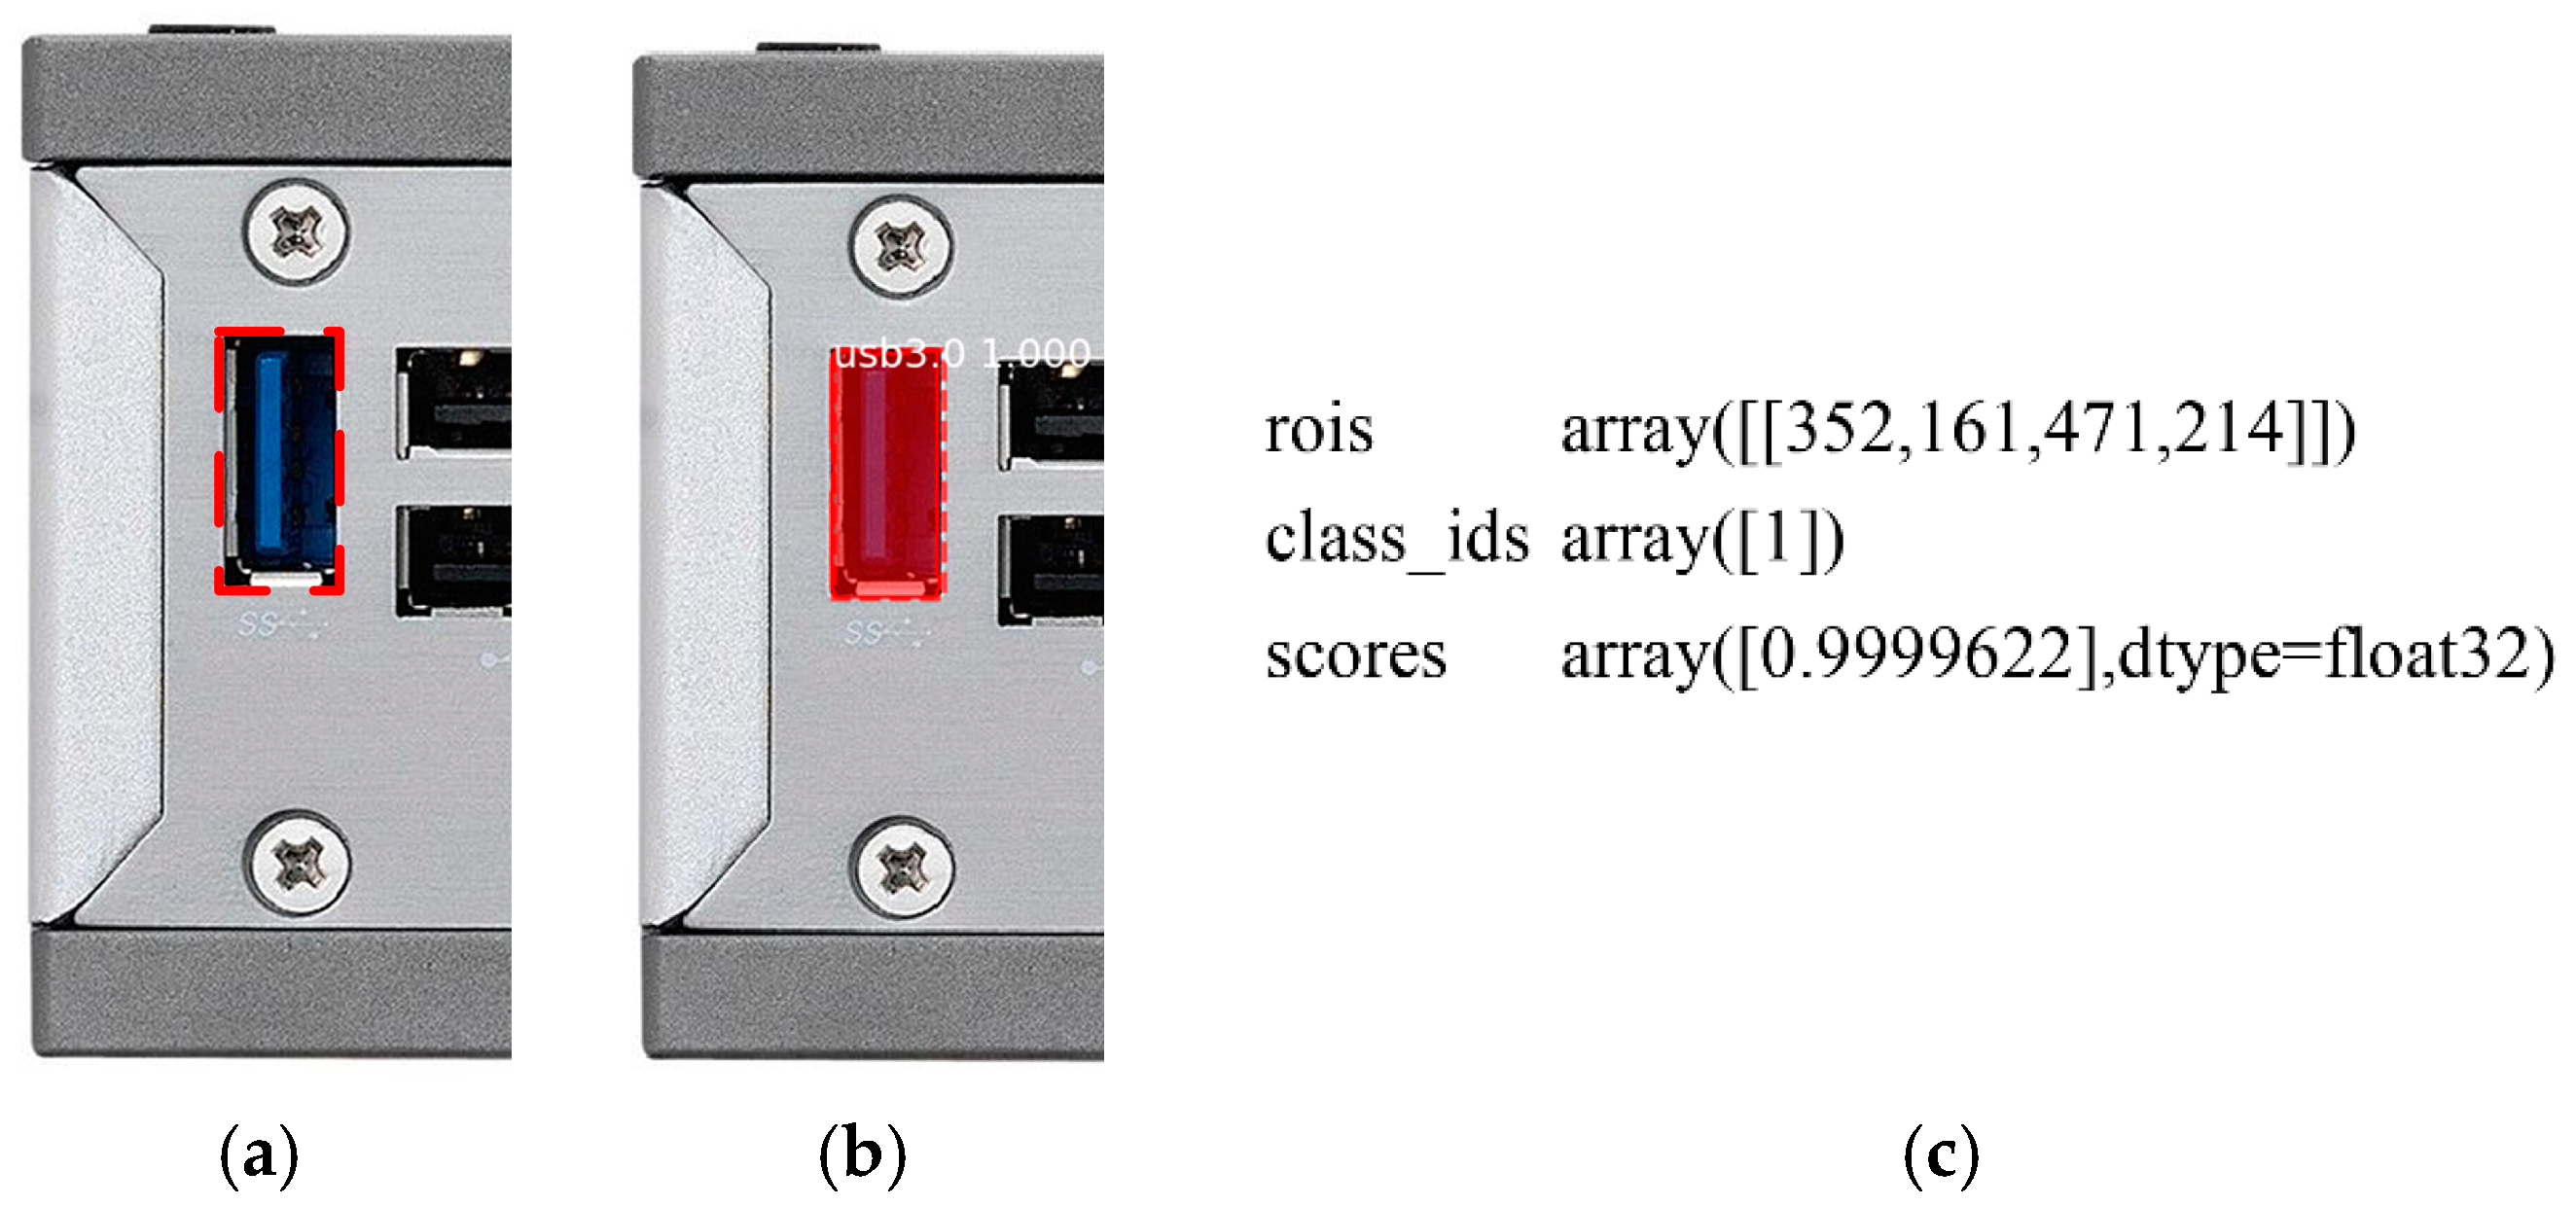
Figure 5 shows the positioning example of USB3.0 instance segmentation. Figure 5a is an example of the component USB3.0 that needs to be positioned in the original chassis assembly image, and the area within the dotted line is the positioning information to be obtained. Figure 5b is an example of the feature extraction diagram of the chassis detection component USB3.0; ROI positioning information is extracted after the instance is segmented. Figure 5c shows ROI positioning information of USB3.0, including the coordinates of the upper left corner ( y u p i , x u p i ) and the coordinates of the lower right corner ( y d o w n i , x d o w n i ) . The ROI geometric center is defined as the component positioning point ( x c i , y c i ) and solved using Equation (4).
( x c i , y c i ) = ( | x d o w n i x up i | 2 , | y d o w n i y up i | 2 )
Through the above step, instance segmentation of each component is completed, and the classification result and frame offset are output. 
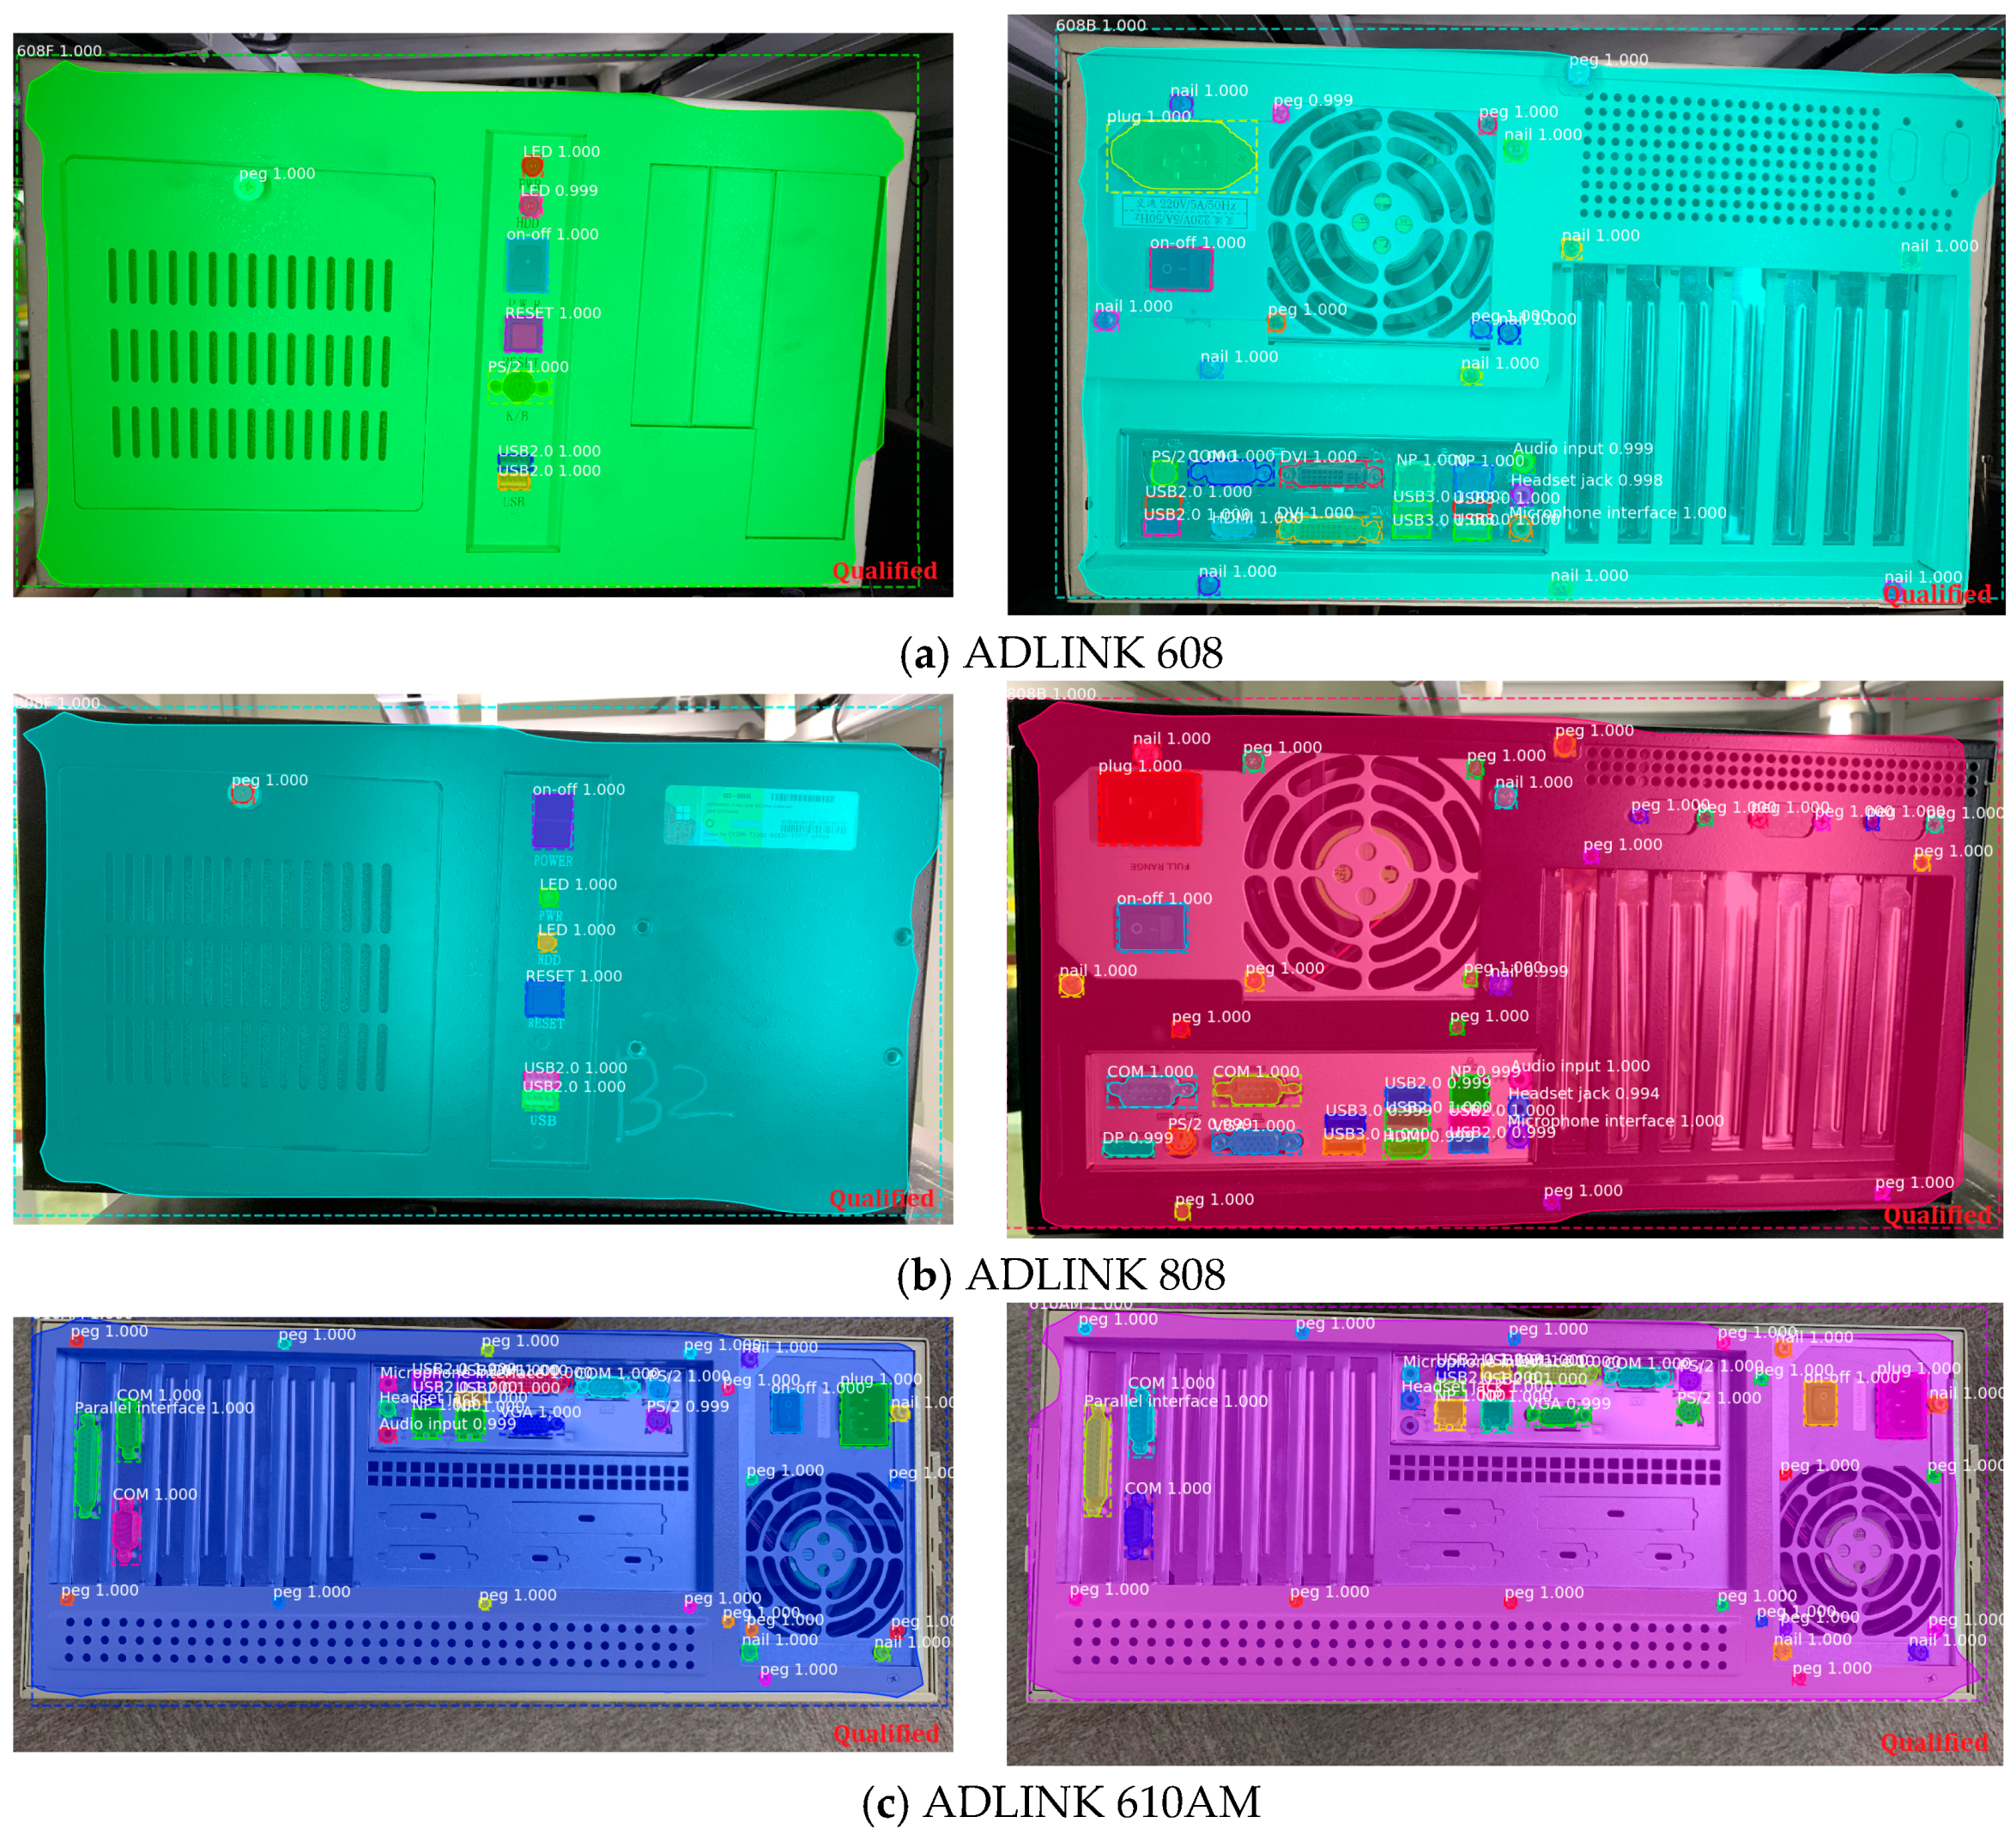
Figure 6 shows an example based on Mask R-CNN instance segmentation, where Figure 6a is an example of the original chassis assembly image. The area inside the dotted line is the model to be tested and the assembly parts; Figure 6b is the chassis assembly detection feature extraction map. From Figure 6b, it can be seen that USB2.0, USB3.0, NP and other components can be detected and perfect semantic segmentation Instance segmentation of each component is realized and the component name is accurately obtained.

3.2. SD Construction Method and Detection Cethod

The chassis component information extracted in the previous section is used to perform authentication, which is a technique for automatically extracting information to be authenticated using deep learning methods. Table 2 shows an example of SD storage. First, the SD, which includes the chassis model, chassis size, number of assembly parts, name of each component, and corresponding assembly location, should be established. The chassis size is the length of the upper left corner and the lower right corner of the chassis; the assembly position of each component is represented by the spatial distance from the geometric center to the geometric center of the chassis. SD has a three-level structure: the first level is the chassis model; the second level is the chassis size, the number of assembled components, and the name of each component; the third level is the corresponding assembly position of each component.
SD can be found through the keyword, that is, the chassis model is defined as the Keywords: The corresponding information of SD can be obtained through the chassis model, and the positioning of the component name can be obtained to determine whether it is correctly assembled. Figure 7 is the implementation process of SD:
As the angle between the chassis and industrial camera cannot be guaranteed in actual shooting, an identification method capable of adapting to rotation and translation is proposed. The proposed method satisfies the positional arbitrariness of the chassis image. Figure 8 is an example of shooting at any angle. Because the translation and rotation of the same shooting plane does not cause a change in the size of the space of the chassis during shooting, only the rotation different from the shooting plane needs to be considered.
In order to facilitate the calculation, the rotation can be regarded as rotating around a certain point. By constructing a circle to simplify the calculation process, the actual position of the industrial camera shooting chassis can be mapped to the shooting plane. Then the rotation angle θ can be expressed by Equation (5):
θ = | arccos ( x P d o w n j x P u p j ) 2 + ( y P d o w n j y P u p j ) 2 ( x R d o w n j x R u p j ) 2 + ( y R d o w n j y R u p j ) 2 |
where j is j -class chassis; ( x P u p j , y P u p j ) and ( x P d o w n j , y P d o w n j ) are the coordinates of the upper left corner and lower right corner of the chassis in the image when the front is photographed; ( x R u p j , y R u p j ) and ( x R d o w n j , y R d o w n j ) are the coordinates of the upper left corner and lower right corner of the chassis in the image during actual shooting.
Then, the chassis image is detected by Mask R-CNN. The process has been described in detail in the previous section. In order to realize the chassis assembly identification, each component assembly needs to be identified. Therefore, the chassis image detection feature vector list information with the SD is used for identification according to the chassis model, and the component identification result is obtained by using the feature of the chassis image extraction in Figure 6 and SD of Table 2.
Defining the chassis geometry center as the component assembly reference point, the true assembly space distance d c i between each component and the chassis is obtained:
d c i = d j ( x R d o w n j x R u p j ) 2 + ( y R d o w n j y R u p j ) 2 ( x P d o w n j x P u p j ) 2 + ( y P d o w n j y P u p j ) 2 ( x R d o w n j x R u p j ) 2 + ( y R d o w n j y R u p j ) 2 ( | x d o w n i x up i | 2 x R d o w n j x R u p j 2 ) 2 + ( | y d o w n i y up i | 2 y R d o w n j y R u p j 2 ) 2 = d j ( x P d o w n j x P u p j ) 2 + ( y P d o w n j y P u p j ) 2 ( | x d o w n i x up i | 2 x R d o w n j x R u p j 2 ) 2 + ( | y d o w n i y up i | 2 y R d o w n j y R u p j 2 ) 2 ( x R d o w n j x R u p j ) 2 + ( y R d o w n j y R u p j ) 2
According to Equations (4) and (5), Equation (6) is reduced to
d c i = cos θ d j ( x c i x R d o w n j x R u p j 2 ) 2 + ( y c i y R d o w n j y R u p j 2 ) 2 ( x R d o w n j x R u p j ) 2 + ( y R d o w n j y R u p j ) 2
Then, according to SD, each component is identified. If the component space distance is within the standard distance, the assembly is correct; otherwise, the assembly error is identified using Equation (8):
r i = { 1 , i f d c i d i 1 d i 2 d i N 0 , o t h e r w i s e
Finally, the chassis assembly test results are obtained as shown in Equation (9):
r j = { Q u a l i f i e d , i f r 1 r 2 r i = 1 D i s q u a l i f i c a t i o n , o t h e r w i s e

4. Experimental

The proposed method was evaluated using the chassis assembly real image detection discrimination results. The instance segmentation contrast experiment and the detection and discrimination experiment were carried out under different illumination conditions, and the results were compared with those of other methods. Furthermore, extensive experimentation was carried out on a variety of other chassis.

4.1. Experimental Setup

Dataset: Datasets were collected on the production-line chassis assembly image acquisition platform using the OPT-C7528-2M industrial lens. All components are specified by the assembly standards and are marked with dimensions and their categories. In actual industrial production lines, the number and type of assembly parts of different chassis models vary greatly, involving high cost and extensive manual labor for the acquisition and marking of image parts. We collected a total of 80 images as a chassis assembly dataset. As one of the important parts of the computer, the chassis has many kinds of components, but its types are fixed and there is no image occlusion problem in the assembly image of the chassis. The assembly of industrial production chassis is mainly caused by missing assembly and misassembly, which leads to unqualified assembly of the chassis. Moreover, in industrial application scenarios, the imaging conditions are relatively simple, the camera is fixed, and the scene changes are small. So, it needs a lot of properly assembled chassis images without many chassis images. At present, there is no chassis data set, so the collection of chassis images is limited. However, better results can be obtained through the cascading network. For the difficulty of obtaining multiple chassis samples, the method of data enhancement is adopted [37,40], mainly including random rotation, translation, scaling, shearing and elastic transformation. The operation significantly increased the size of the training set, raising the number of the training set to 2500, thus improving the generalization ability of the model, 2000 images were randomly selected as the training set and the rest of the images are used as the test set. For the classification task, all samples have their own label image. The tag image is an output JSON file based on the annotated polygon coordinates and its tag.
Implementation: Testing was performed using the Python 3.5.0 detection experimental system, and TensorFlow (Google Brain, Mountain View, CA, USA) was used as the deep learning computing platform [38]. The test was performed using a computer with the following specifications: Intel Core i7 CPU, NVIDIA GTX-1080ti graphics processing unit (GPU), and 11 GB of video memory. The network was trained for 100 cycles, and the learning rate was set to 0.001 before the 120 k iterations, and then decreased by a factor of 10. The weight attenuation rate was 0.0001, and the impulse was set to 0.7. On ResNeXt, each GPU processes a picture and the learning rate was initially set to 0.01 [30]. Table 3 compares the influence of learning rate setting on classification results. When the learning rate setting is set as above, the best classification effect can be achieved.

4.2. Chassis Components Testing and Chassis Quality Identification

Before the quality of the chassis is identified, it is first necessary to select the corresponding assembly standard and then accurately identify and classify each component of the chassis. Therefore, the weighting file is trained through the created dataset so that each component can be accurately (mAP) segmented and classified. Figure 9 shows the results of the classification and classification of the five components: USB2.0, Network port, nail, on-off, and BD. Based on the Mask R-CNN network, all five parts were accurately segmented and classified, with the classification accuracy (Top-1) reaching 100% and the frame offset score reaching above 0.99 (full mark is one).
After training, the weight files corresponding to the segmentation and classification results with high accuracy were obtained, and the MEX1301 chassis was selected for the experiment. The number of components on the front and back sides of the MEX1301 box was 22 and 17, respectively, and the number of each part was recorded separately. According to the assembly drawing, SD was used as the identification standard, and the Mask R-CNN keyword was used to identify the quality of the chassis. Figure 10 shows the detection and identification results of the MEX1301 chassis based on the SD Mask R-CNN. Figure 10a shows the MEX1301 chassis, and Figure 10b shows the results after detection and identification. In the detection and identification results based on the SD Mask R-CNN, the chassis type of the chassis image is identified and marked, each part is segmented and classified, the type of each part and the frame offset score are marked, the detection and identification results of the chassis are obtained through SD, and the chassis is marked as either qualified or unqualified.

4.3. Multiple Experiments

Using the deep learning algorithm, it is possible to obtain the feature information of the component multiple times because the image features are extracted by the multi-volume layer. In this manner, the influence of the illumination condition on the detection can be reduced. In particular, the problem of metal products excessively reflecting light, which significantly affects the image characteristics, can be reduced. The MEX1301 chassis was tested under multiple light intensities. Figure 11 shows the chassis inspection results under three illumination intensities. Figure 11a shows the detection results of the front end and the back end of the chassis at an illumination intensity of I; Figure 11b shows the detection results of the front end and the back end of the chassis at an illumination intensity of II; Figure 11c shows the detection results of the front end and the back end of the chassis at an illumination intensity of III [31]. Figure 10 shows SD Mask R-CNN detection results under various illumination intensities. When the light intensity of I, II, and III realize a detection accuracy of 100%, the corresponding border offset points are, respectively, 0.999 above, more than 0.997, and 0.998 above (full mark is 1). The image detection effect of the chassis based on the Mask R-CNN is unaffected by the light intensity.
Figure 12 shows the detection and identification results of SD Mask R-CNN under various light intensities. Based on the above detection results, through SD identification, the assembly quality identification results of the chassis under three different light intensities were all found to be qualified. Among them, Figure 12a is the light intensity for I, Figure 12b is the light intensity for II, Figure 12c is the light intensity for III.
To quantitatively (it is measured by classification accuracy, the probability of accurate classification of all test picture objects) evaluate the performance of SD Mask R-CNN detection discrimination, we compared the results with those of traditional machine learning methods.
(1) Histogram of Oriented Gradients (HOG) [41,42]: This is a directional histogram feature, usually obtained by the following steps. First, a unit is obtained by dividing an image into small connected regions, and then a gradient or edge direction histogram of each pixel in the unit is acquired. Finally, these histograms are combined to form a complete feature descriptor.
(2) Template matching [43,44]: Using the improved traditional template matching method, higher processing efficiency of the binary descriptor is achieved, and the matching method adapts to some image changes.
According to the above characteristics, three types of chassis detection and identification experiments were carried out using the three methods. Among them, the quantization of the gray value in HOG was eight. Table 4 shows the experimental results obtained. Under the influence of different light conditions, Accuracy is expressed by classification accuracy, the shallow feature method based on machine learning appears to have achieved an accuracy of only approximately 70%, whereas the accuracy of SD Mask R-CNN is higher than those of these methods by more than 10%.
The quantitative results in Table 5 show that SD Mask-RCNN performs well in classification accuracy, and the use of ResNet backbone network is one of the reasons to improve its classification accuracy, and it also gets good scores in mAP and mIOU. DeepLab has advantages in model size and computing time, but we mainly consider its accuracy.
Figure 13 shows the comparison of qualitative results between the best model SD Mask-RCNN and other networks. The SD Mask-RCNN achieved high accuracy, and it showed a good segmentation effect for each type of chassis of SD Mask-RCNN. HED [45] changed the scale of the image and DeepLab v3 does not achieve high segmentation accuracy [19].
As verified by the results in Figure 12 and Table 4, SD Mask R-CNN can be used for chassis assembly detection and identification through simple training. It overcomes the low-accuracy and time-consuming problems of feature and threshold parameter selection and reduces the impact of different illumination and surface reflections on component inspection. Experiments were conducted on the ADLINK 608, ADLINK 808, and 610AM chassis. Figure 14 shows the results of multiple chassis detection and identification experiments, all images of the three chassis represent accurate detection and identification, and the identification results are qualified for assembly.

5. Conclusions

In this paper, we proposed a chassis assembly detection and identification method based on a deep learning component instance segmentation method—SD Mask R-CNN. By using Mask R-CNN for chassis instance segmentation, component segmentation and classification tasks were completed, and the component types, spatial locations, and mask information of the chassis were obtained. In order to realize identification of the chassis assembly parts, we built SD as the authentication standard, and identified the actual position and angle of the chassis in the image. The whole process was divided into two steps. In the first step, the data enhancement method was used to solve the small dataset problem, and Mask R-CNN based chassis detection performed. In the second step, component identification was performed using the information obtained by the detection and the corresponding standard in the selection SD. Finally, the chassis assembly was evaluated. The experimental results show that the proposed method achieves good performance in the detection and identification of chassis assembly and proves that our deep learning method is feasible and provides quality identification.

Author Contributions

B.H. and G.L. conceived the study. B.H. performed the experiments and wrote the paper with S.L. and J.H. who also analyzed the results.

Funding

This research was funded by the Guangzhou Science and Technology Plan Project (201802030006).

Acknowledgments

The authors would like to thank Editage (www.editage.cn) for English language editing.

Conflicts of Interest

The authors declare no conflict of interest.

References

  1. Yuk, E.H.; Park, S.H.; Park, C.S.; Baek, J.G. Feature Learning-Based Printed Circuit Board Inspection via Speeded-Up Robust Features and Random Forest. Appl. Sci. 2018, 8, 932. [Google Scholar] [CrossRef]
  2. Huang, J.; Liu, G. Multi-color space threshold segmentation and self-learning k-NN algorithm for surge test EUT status identification. Front. Mech. Eng. 2016, 11, 311–315. [Google Scholar] [CrossRef]
  3. Zeng, L.; Xiong, W.; Zhai, Y. Gun bore flaw image matching based on improved SIFT descriptor. In Proceedings of the SPIE Eighth International Symposium on Precision Engineering Measurement and Instrumentation, Chengdu, China, 8 August 2012; Volume 8759. [Google Scholar]
  4. Tahir, M.W.; Zaidi, N.A.; Blank, R.; Vinayaka, P.P.; Vellekoop, M.J.; Lang, W. Detection of fungus through an optical sensor system using the histogram of oriented gradients. In Proceedings of the 2016 IEEE SENSORS, Orlando, FL, USA, 30 October–3 November 2016; IEEE: New York, NY, USA, 2017. [Google Scholar]
  5. Kumar, M.; Singh, N.K.; Kumar, M.; Vishwakarma, A.K. A novel approach of standard data base generation for defect detection in bare PCB. In Proceedings of the IEEE 2015 International Conference on Computing, Communication & Automation (ICCCA), Greater Noida, India, 15–16 May 2015; IEEE: New York, NY, USA, 2015; pp. 11–15. [Google Scholar]
  6. Kim, H.W.; Yoo, S.I. Defect detection using feature point matching for non-repetitive patterned images. Pattern Anal. Appl. 2014, 17, 415–429. [Google Scholar] [CrossRef]
  7. Huang, J.; Jia, P.; Liu, G. An OVR-SVM Based Machine Vision Evaluation Method for Standard Component Assembly. In Proceedings of the Advances in Materials, Machinery, Electrical Engineering (AMMEE 2017), Tianjin, China, 10–11 June 2017; Atlantis Press: Paris, France, 2017. [Google Scholar] [Green Version]
  8. Srisaila, A.; Kranthi, S.; Pranathi, K.; Latha, P.M. Tag Identification for Vehicles by Using Connected Components based Segmentation and Template Matching Based Recognition. In Proceedings of the 2018 Second International Conference on Electronics, Communication and Aerospace Technology (ICECA), Coimbatore, India, 29–31 March 2018; pp. 1745–1749. [Google Scholar]
  9. Minaee, S.; Wang, Y. Masked signal decomposition using subspace representation and its applications. arXiv 2017, arXiv:1704.07711. [Google Scholar]
  10. Minaee, S.; Wang, Y. Screen content image segmentation using robust regression and sparse decomposition. IEEE J. Emerg. Sel. Top. Circuits Syst. 2016, 6, 573–584. [Google Scholar] [CrossRef]
  11. Gibson, E.; Li, W.; Sudre, C.; Fidon, L.; Shakir, D.I.; Wang, G.; Eaton-Rosen, Z.; Gray, R.; Doel, T.; Hu, Y.; et al. NiftyNet: A deep-learning platform for medical imaging. Comput. Methods Programs Biomed. 2018, 158, 113–122. [Google Scholar] [CrossRef] [PubMed]
  12. Ntalampiras, S. A Deep Learning Framework for Classifying Sounds of Mysticete Whales. Handb. Neural Comput. 2017, 22, 403–415. [Google Scholar]
  13. Badrinarayanan, V.; Kendall, A.; Cipolla, R. Segnet: A deep convolutional encoder-decoder architecture for image segmentation. IEEE Trans. Pattern Anal. Mach. Intel. 2017, 39, 2481–2495. [Google Scholar] [CrossRef] [PubMed]
  14. Romera-Paredes, B.; Torr, P.H.S. Recurrent instance segmentation. In European Conference on Computer Vision; Springer: Cham, Switzerland, 2016; pp. 312–329. [Google Scholar]
  15. Ahmed, S.B.; Naz, S.; Razzak, M.I.; Yusof, R. Arabic Cursive Text Recognition from Natural Scene Images. Appl. Sci. 2019, 9, 236. [Google Scholar] [CrossRef]
  16. Kang, X.; Song, B.; Sun, F. A Deep Similarity Metric Method Based on Incomplete Data for Traffic Anomaly Detection in IoT. Appl. Sci. 2019, 9, 135. [Google Scholar] [CrossRef]
  17. Guo, H.; Wei, G.; An, J. Dark Spot Detection in SAR Images of Oil Spill Using Segnet. Appl. Sci. 2018, 8, 2670. [Google Scholar] [CrossRef]
  18. Guo, Y.; Liu, Y.; Oerlemans, A.; Lao, S.; Wu, S.; Lew, M.S. Deep learning for visual understanding: A review. Neurocomputing 2016, 187, 27–48. [Google Scholar] [CrossRef]
  19. Chen, L.C.; Papandreou, G.; Kokkinos, I.; Murphy, K.; Yuille, A.L. Deeplab: Semantic image segmentation with deep convolutional nets, atrous convolution, and fully connected crfs. IEEE Trans. Pattern Anal. Mach. Intel. 2017, 40, 834–848. [Google Scholar] [CrossRef] [PubMed]
  20. Ma, C.; Chen, L.; Yong, J. AU R-CNN: Encoding expert prior knowledge into R-CNN for action unit detection. Neurocomputing 2019, 355, 35–47. [Google Scholar] [CrossRef] [Green Version]
  21. Mubin, N.A.; Nadarajoo, E.; Shafri, H.Z.M.; Hamedianfar, A. Young and mature oil palm tree detection and counting using convolutional neural network deep learning method. Int. J. Remote Sens. 2019, 40, 7500–7515. [Google Scholar] [CrossRef]
  22. Liu, T.; Stathaki, T. Faster R-CNN for robust pedestrian detection using semantic segmentation network. Front. Neurorobot. 2018, 12, 64. [Google Scholar] [CrossRef] [PubMed]
  23. Mou, L.; Zhu, X.X. Vehicle instance segmentation from aerial image and video using a multitask learning residual fully convolutional network. IEEE Trans. Geosci. Remote Sens. 2018, 56, 6699–6711. [Google Scholar] [CrossRef]
  24. Redondo-Cabrera, C.; Baptista-Ríos, M.; López-Sastre, R.J. Learning to Exploit the Prior Network Knowledge for Weakly Supervised Semantic Segmentation. IEEE Trans. Image Process. 2019, 28, 3649–3661. [Google Scholar] [CrossRef]
  25. Trujillo, C.; Garcia-Sucerquia, J. Automatic detection and counting of phase objects in raw holograms of digital holographic microscopy via deep learning. Opt. Lasers Eng. 2019, 120, 13–20. [Google Scholar] [CrossRef]
  26. Qin, P.; Chen, J.; Zhang, K.; Chai, R. Convolutional neural networks and hash learning for feature extraction and of fast retrieval of pulmonary nodules. Comput. Sci. Inf. Syst. 2018, 15, 517–531. [Google Scholar] [CrossRef] [Green Version]
  27. Hou, W.; Wei, Y.; Jin, Y.; Zhu, C. Deep features based on a DCNN model for classifying imbalanced weld flaw types. Measurement 2019, 131, 482–489. [Google Scholar] [CrossRef]
  28. Chang, S.J.; Park, J.B. Wire Mismatch Detection Using a Convolutional Neural Network and Fault Localization Based on Time–Frequency-Domain Reflectometry. IEEE Trans. Ind. Electron. 2018, 66, 2102–2110. [Google Scholar] [CrossRef]
  29. Long, J.; Shelhamer, E.; Darrell, T. Fully Convolutional Networks for Semantic Segmentation. IEEE Trans. Pattern Anal. Mach. Intell. 2014, 39, 640–651. [Google Scholar]
  30. He, K.; Gkioxari, G.; Dollár, P.; Girshick, R. Mask R-CNN. In Proceedings of the 2017 IEEE International Conference on Computer Vision (ICCV), Venice, Italy, 22–29 October 2017; pp. 2980–2988. [Google Scholar]
  31. Girshick, R. Fast R-CNN. In Proceedings of the 2015 IEEE International Conference on Computer Vision, Santiago, Chile, 7–13 December 2015; pp. 1440–1448. [Google Scholar]
  32. Ren, S.; He, K.; Girshick, R.; Sun, J. Faster R-CNN: Towards Real-Time Object Detection with Region Proposal Networks. In Advances in Neural Information Processing Systems; MIT Press: Cambridge, MA, USA, 2015; pp. 91–99. [Google Scholar]
  33. He, K.; Zhang, X.; Ren, S.; Sun, J. Deep residual learning for image recognition. In Proceedings of the IEEE Conference on Computer Vision and Pattern Recognition, Las Vegas, NV, USA, 26 June–1 July 2016. [Google Scholar]
  34. Lin, H.; Li, B.; Wang, X.; Shu, Y.; Niu, S. Automated defect inspection of LED chip using deep convolutional neural network. J. Intell. Manuf. 2018, 29, 1–10. [Google Scholar] [CrossRef]
  35. Ahmed, M.; Mahmood, A.N.; Hu, J. A survey of network anomaly detection techniques. J. Netw. Comput. Appl. 2016, 60, 19–31. [Google Scholar] [CrossRef]
  36. Krizhevsky, A.; Sutskever, I.; Hinton, G.E. Imagenet classification with deep convolutional neural networks. In Proceedings of the Advances in Neural Information Processing Systems, Curran Associates, Inc., Lake Tahoe, NV, USA, 3–6 December 2012; pp. 1097–1105. [Google Scholar]
  37. Chen, L.C.; Papandreou, G.; Kokkinos, I.; Murphy, K.; Yuille, A.L. Semantic Image Segmentation with Deep Convolutional Nets and Fully Connected CRFs. arXiv 2014, arXiv:1412.7062. [Google Scholar]
  38. Girshick, R.; Donahue, J.; Darrell, T.; Malik, J. Rich Feature Hierarchies for Accurate Object Detection and Semantic Segmentation. In Proceedings of the 2014 IEEE Conference on Computer Vision and Pattern Recognition (CVPR), Columbus, OH, USA, 24–27 June 2014; IEEE Computer Society: Washington, DC, USA, 2014. [Google Scholar]
  39. Liu, S.; Qi, L.; Qin, H.; Shi, J.; Jia, J. Path Aggregation Network for Instance Segmentation. arXiv 2018, arXiv:1803.01534. [Google Scholar]
  40. Fawzi, A.; Samulowitz, H.; Turaga, D.; Frossard, P. Adaptive data augmentation for image classification. In Proceedings of the 2016 IEEE International Conference on Image Processing (ICIP), Phoenix, Arizona, 25–28 September 2016; IEEE: Middlesex, NJ, USA, 2016; pp. 3688–3692. [Google Scholar] [Green Version]
  41. Schaefer, S.; McPhail, T.; Warren, J. Image deformation using moving least squares. ACM Trans. Gr. (TOG) 2006, 25, 533–540. [Google Scholar] [CrossRef]
  42. Shumin, D.; Zhoufeng, L.; Chunlei, L. AdaBoost learning for fabric defect detection based on hog and SVM. In Proceedings of the International Conference on Multimedia Technology, Hangzhou, China, 26–28 July 2011. [Google Scholar]
  43. Yang, H.; Huang, C.; Wang, F.; Song, K.; Yin, Z. Robust Semantic Template Matching Using a Superpixel Region Binary Descriptor. IEEE Trans. Image Process. 2019, 28, 3061–3074. [Google Scholar] [CrossRef]
  44. Abadi, M.; Barham, P.; Chen, J.; Chen, Z.; Davis, A.; Dean, J.; Devin, M.; Ghemawat, S.; Irving, G.; Isard, M.; et al. TensorFlow: A system for large-scale machine learning. OSDI 2016, 16, 265–283. [Google Scholar]
  45. Xie, S.; Tu, Z. Holistically-nested edge detection. In Proceedings of the IEEE International Conference on Computer Vision, Santiago, Chile, 13–16 December 2015; pp. 1395–1403. [Google Scholar]
Figure 1. Diagram of general computer chassis.
Symmetry 11 01001 g001
Figure 2. Flowchart of Faster R-CNN implementation.
Symmetry 11 01001 g002
Figure 3. Calculation example of chassis parts with region of interest align (ROIAlign).
Symmetry 11 01001 g003
Figure 4. Flowchart of detection and identification methods for chassis assembly.
Symmetry 11 01001 g004
Figure 5. Sample of USB3.0 instance split location: (a) An example of a USB3.0 component to be positioned in the original chassis assembly image; (b) Chassis detection parts USB3.0 feature extraction; (c) USB3.0 ROI location information.
Symmetry 11 01001 g005
Figure 6. Instance segmentation based on Mask R-CNN: (a) Original chassis; (b) Resultant image after feature extraction of chassis assembly detection.
Symmetry 11 01001 g006
Figure 7. The implementation process of SD.
Symmetry 11 01001 g007
Figure 8. An example of shooting from any angle.
Symmetry 11 01001 g008
Figure 9. Results of instance segmentation: sample test of five parts. (a), USB2,0; (b), Network port; (c), nail; (d), on-off; (e), BD.
Symmetry 11 01001 g009
Figure 10. Detection and identification results of MEX1301 chassis based on SD Mask R-CNN: (a) MEX1301 chassis; (b) MEX1301 chassis detection and identification results.
Symmetry 11 01001 g010
Figure 11. Chassis detection results under three light intensifications: (a) Illumination intensity I; (b) Illumination intensity II; (c) Illumination intensity III.
Symmetry 11 01001 g011
Figure 12. Identification results of SD Mask R-CNN under various light intensities. (a), Illumination intensity I; (b), Illumination intensity II; (c), Illumination intensity III.
Symmetry 11 01001 g012
Figure 13. Multiple experiments results. Input image, ground-truth, HED, DeppLab v3, and our SD Mask-RCNN.
Symmetry 11 01001 g013
Figure 14. Multiple chassis detection and identification experimental results.
Symmetry 11 01001 g014
Table 1. Of vectors extracted from chassis image features.
Class_NameROIScoresMask
[5,3,…,i,…] [ y R u p 5 , x R u p 5 , y R d o w n 5 , x R d o w n 5 ]
[ y R u p 3 , x R u p 3 , y R d o w n 3 , x R d o w n 3 ]

[ y R u p i , x R u p i , y R d o w n i , x R d o w n i ]
[ c s c o r e 5 , c s c o r e 3 , , c s c o r e i , ] [true false … false…]
[false … false…]

[true false … false…]
Table 2. Standard dictionary (SD) storage sample.
Chassis_Name ( c j )Chassis_Size ( d j )
Part_count ( N )
Part_name ( c i )Part_location ( d i N )
Table 3. Detection performance for the different methods.
Learning RateError Top-5
Before 120 k IterationsAfter 120 k Iterations
0.0010.000193.7%
0.0010.0000189%
0.0010.00185.2%
Table 4. Detection performance for the different methods.
MethodAccuracy
HOG76%
Template Matching83.5%
SD Mask R-CNN93.7%
Table 5. Quantitative Comparison of Deep Architectures on 800 chassis.
MethodBackboneError (Top-1)mAPmIOUModel Size (MB)Computational Time (ms)
SD Mask-RCNNResNet-5011.7%73.679.3-1877
SD Mask-RCNNResNet-1016.3%78.182.5-2148
DeepLabResNet-10119.2%72.879.783271
SegNetVGG1626.6%6576.1117912

