Article

A Novel Method of Using Vision System and Fuzzy Logic for Quality Estimation of Resistance Spot Welding

School of Mechanical and Electrical Engineering, Wuhan University of Technology, Wuhan 430000, China
*
Author to whom correspondence should be addressed.
Symmetry 2019, 11(8), 990; https://doi.org/10.3390/sym11080990
Submission received: 28 June 2019 / Revised: 24 July 2019 / Accepted: 26 July 2019 / Published: 2 August 2019

Abstract

:
Finding a reliable quality inspection system of resistance spot welding (RSW) has become a very important issue in the automobile industry. In this study, improvement in the quality estimation of the weld nugget’s surface on the car underbody is introduced using image processing methods and training a fuzzy inference system. Image segmentation, mathematical morphology (dilation and erosion), flood fill operation, least-squares fitting curve and some other new techniques such as location and value based selection of pixels are used to extract new geometrical characteristics from the weld nugget’s surface such as size and location, shape, and the numbers and areas of all side expulsions, peaks and troughs inside and outside the fusion zone. Topography of the weld nugget’s surface is created and shown as a 3D model based on the extracted geometrical characteristics from each spot. Extracted data is used to define input fuzzy functions for training a fuzzy logic inference system. Fuzzy logic rules are adopted based on knowledge database. The experiments are conducted on a 6 degree of freedom (DOF) robotic arm with a charge-coupled device (CCD) camera to collect pictures of various RSW locations on car underbodies. The results conclude that the estimation of the 3D model of the weld’s surface and weld’s quality can reach higher accuracy based on our proposed methods.

Graphical Abstract

1. Introduction

Since the mid-20th century, the resistance spot weld (RSW) is widely used in automobile and machine industries [1]. RSW has many advantages, one is that it can be applied to different kinds and thicknesses of material metal sheets [2]. Its process is effective, economical, relatively cheap and robust. The underbody of the passenger vehicle S50 produced by Dongfeng Motor, on average, requires between 6500 and 7000 weld nuggets which are executed all by robotic arms. Recently, the competition between automotive companies requested to decrease the number of weld nuggets to between 2000 and 5000, while still satisfying the quality [3]. However, various factors such as welding current, misalignment of sheets and erosion of electrodes directly affect the weld’s quality. To reduce the risk of spot-welding failure, the reliable quality inspection system of the RSW has become a very important issue in industry.
Some automobile manufacturers execute destructive testing methods such as peel test, chisel test or tensile-shear test to directly measure the resistance spot welding’s quality. However, these methods, are human-operated, off-line processes, non-automated and post-weld tests. As well, they consume time and money, and reduce the flexibility of the production line [4]. The need to increase the flexibility and reduce the manufacturing cost, made the auto industry seek to use effective non-destructive spot-welding inspection methods.
Various non-destructive technologies were introduced such as studying the electrical signals of the welding machine (welding voltage, welding current and dynamic resistance [5]), or sensing the mechanical welding parameters (force and electrode pressure-displacement). Dickinson et al. [6] designed a dynamic electrical parameter monitoring device to record the instantaneous values of voltage, current, power, and resistance during RSW. The relationship between these variables and the phenomena that occurred during the formation of a spot weld has been obtained to prove that the variations in the shape of the dynamic resistance curve were related to variations in material, secondary RMS current, and electrode force. Gedeon et al. [7] proposed a method to reduce the errors in the measurement of these electrical signals. Finally, an example of the welding process in both the coated and the uncoated steel also showed that the dynamic electrical resistance and the mechanical displacement curves provide the most significant information of the weld nugget formation and its growth. Hao et al. [8] developed a data acquisition and processing system to extract pertinent features from the captured data of aluminum resistance spot welding. In their work, the spot diameter and weld strength in aluminum resistance spot welding were predicted by using the multiple linear regression methods. Authors proved that the prediction of diameter and strength, and the detection of expulsion are all feasible with electrical measurement alone.
Recently, an artificial neural network has been used in the area of RSW control and quality estimation of the spot diameter [9]. Dilthey et al. [10] developed a neural network based system to evaluate the spot welds, classifying them by the means of pre-processed data of welding current and voltage. Cho et al. [11] developed an artificial intelligence quality estimation system to monitor the dynamic resistance in the primary circuit of the welding machine. The monitored resistance is linked into a vector for pattern recognition. The Hopfield neural network is used to classify the pattern vectors and utilize them to estimate weld quality. Moreover, weld tensile-shear strength measurements proved the performance of the estimation system. Hwang et al. [12] used also adaptive resonance theory in artificial neural networks with a vigilance parameter to predict the quality of RSW. The expermints confirmed that different patterns can be classified under the same welding condition according to the vigilance parameter. The best results were obtained when the vigilance parameter is 0.8.
Other technologies were based on ultrasonic transmission inspections, sonic emission signals, and magnetic signals inspection which have been involved widely in the industries. Wylie et al. [13] proposed a real-time ultrasonic non-destructive system, to monitor the quality of RSW, by installing transducers on the lower and upper electrode arms of the welding gun. Liu et al. [14] used the ultrasonic signals to detect four types of stainless steel RSW specimens, which were failed weld, stick weld, defective weld with gas pore, and good weld, and analyzed fourteen characteristic signals of different types of spot welds respectively in time domain, frequency domain and time-frequency domain. The test results showed the efficiency of using this method in the offline quality evaluation. Podržaj et al. [15] introduced a new method to inspect the weld strength of the RSW of zinc coated steels based on sonic emission indicator and emission count indicator. The process of the ultrasonic testing usually requires a contact and a couplant gel between the transducer and the material surface, and most of the existing ultrasonic devices are limited to post-weld offline process. As a conclusion, the inspection cycle is relatively long which doesn’t suit the industrial environment.
Tsukada et al. introduced three works for estimating the resistance spot welding’s quality based on magnetic signals. In their first work [16], authors introduced an online monitoring method based on using the magnetic flux leakage. In the second work [17], authors used eddy current test in a quality evaluation system of RSW to analyze the variation of internal structure of the spot welds. In their third work [18], Tsukada et al. combined techniques of magnetic flux penetration and eddy current test for weld estimation and non-destructive testing. The final results proved that the combined method could be expected to be an effective online monitoring non-destructive system of the RSW process. The inspection time of the previously mentioned works is relatively long.
Knowing that it is possible to check the size of the welding using image-processing techniques and computer vision system to measure the weld’s sizes, the following works introduced fully intelligent automatic quality inspection systems of resistance spot welds using vision techniques. Abdulhadi et al. [19] noted that the number of welds and the excessive wear of the welding electrodes, adversely affect the quality of the spot welding due to the increment in the contact area between the electrode tip and work piece. The authors proposed various image-processing algorithms to measure the tip width in captured images of two types of the electrode tips (dome and flat tips). Simončič et al. presented a new image processing algorithm for electrode tip displacement measurement. The purpose of their work introduced in [20] is to detect the electrode tips, determine the size of the reference areas on the electrode tips, and track these areas during the welding process. Authors suggested using a multi-shader graphics card and a camera with relatively low sampling frequency in order to decrease the execution time. The results of their work introduced in [21] showed that with the increment of the current, the maximum electrode tip displacement increases and reaches its highest value in a shorter time until the expulsion region is reached. The results showed accurate measurements and proved the influence of thermal expansion of the welding machine components on other electrode tip displacement measuring methods. In [22], Simončič et al. used signal Kalman filter in order to reduce noise in calculating the displacement measurement and the tip velocity. The results showed that weld strength could be investigated by using image processing-based electrode displacement and velocity measurement.
Other works inspected the RSW’s quality by applying directly their novel image processing methods on both cold weld nuggets via CCD camera and hot weld nuggets via IR camera. Authors [23,24] proposed an online real-time non-destructive evaluation system based on vision algorithms to inspect spot welding quality. An image of the weld nugget was captured by a low-cost camera placed on the welding gun. The structure of the novel system guaranteed real-time process. The image was inputted to the system and processed by built-in algorithms in order to compute the nugget area from the minimum and maximum axis of a fitted ellipse. Zhanfeng et al. [25] proved that the increment of fractal dimension strengthens the welding strength. Therefore, authors used the threshold values of the fractal dimension to identify the quality of welding through a real-time vision system. Ye et al. [26] developed a vision system to extract 15 features from the welding images and detect the defects of the weld based on training a neural network. Yang et al. [27] used learning technique in a novel vision method to assort the spot-welding. Features were extracted from the weld spot image using the GoogLeNet and ImageNet. Then a multi-layer perceptron was used to assort the spots. The results showed an accuracy of 96.99% on an experiment including 334 images. Chen et al. [28,29] developed an IR camera based non-destructive system to inspect the quality of the spot welding (nugget size, thickness and shape) in vehicles underbodies. The system can be used either as a real-time inspection system, or as a post-weld inspection system with an induction heating device. The results showed that the measurement accuracy of both spot size and thickness is very good.
These last few works included non-contact and non-destructive inspection methods of the RSW. However, some of these methods presented certain challenges in reliable quality estimation of the weld nuggets in the automotive production factories. For example, some proposed works showed lack of experience and limitations on various fields such as illumination, location of the camera, and checking of the weld nugget’s surface which are all factors that affect the process of estimating the quality. Some defects of the infrared thermography-based inspection system include the high cost of the IR camera, and the limited ability to properly check the weld nugget’s surface.
Therefore, the main contribution of the current work is to enhance the quality inspection of the weld nugget’s surface by providing a reliable, fully intelligent and automatic online quality inspection system based on image-processing techniques and training a fuzzy logic fuzzy inference system. In addition to the nugget’s shape, center and dimension, new geometrical characteristics are detected such as:
  • The number and areas of all side expulsions.
  • The number and areas of all the isolated peaks inside and outside the fusion zone.
  • The number and areas of all the isolated troughs which refer to the existence of voids (blow holes), cracks, or pitting inside and outside the fusion zone.
This paper reveals that the new geometrical characteristics have great effects on the RSW’s quality. In order to conduct experiments, a vision eye-in-hand fuzzy system based on a 6DOF robotic arm with a CCD camera is constructed to move and take pictures of the weld nugget. Image processing methods are applied to extract the new geometrical characteristics. The topography of the weld nugget’s surface is shown as a 3D model. After that, Fuzzy logic decision making is used to estimate the quality of the spot welding. Finally, tests on 350 weld nuggets’ images were carried out, and the results show that the accuracy of our proposed system is very satisfactory, and the execution time is about 50 ms for each weld. The use of fuzzy logic decision making, which is based on natural language, provides high flexibility [30,31,32]. In addition, human knowledge database can be used to define 46 fuzzy rules, so it is a convenient, easy, and intelligent technique for connecting the extracted geometrical characteristics of the spot welding with its corresponding quality estimation.

2. Resistance Spot Welding Quality Vision-Estimation System

2.1. System’s Structure

The proposed resistance spot welding quality vision-estimation system works as an eye-in-hand system, which includes three main function modules as shown in Figure 1. The first module controls the robotic arm to find the locations of the weld nuggets on the car underbodies to take pictures of them. The second module applies image processing methods on the pictures to extract characteristics. The third module includes training a fuzzy logic system and then estimating the quality in two estimation units. In the training stage, the extracted data of 48 weld nuggets samples and knowledge database are used to define 11 input fuzzy functions and 46 fuzzy rules of the fuzzy logic fuzzy inference system. In the first estimation unit, the possibility of significant defects in the weld nugget’s surface such as the presence of deformed metal failure and no-weld failure modes is analyzed. The output of this unit is used also to select some images which have no deformed metal failure and no-weld failure modes to be used in training stage of the second fuzzy estimation unit. In the second fuzzy unit, other defects such as the existence of side expulsions, cracks or voids (blow holes), pitting, bad size-weld, and bad location-weld are estimated.
The hardware parts of the proposed quality vision-estimation system include a 6DOF robotic arm controlled by Galil motion card. The end effector of the robotic arm is a fixture which holds a CCD camera, a linear laser light device, a variable intensity light source and a distance sensor connected to an Arduino. Figure 2 show the 3D model designed by Solidworks, and the real built design of the vision system experimental platform, respectively. The digital grey images used for analysis were captured by a GigE Daheng Imavision type MER-125-30UM/C CCD digital camera at the rate of 30 frames per second, and sent through a USB cable to a supervisor computer to be processed in order to extract the geometrical characteristics from the weld nugget’s surface. The camera is connected to a lens which has a focal length of 25 mm. In order to ensure a constant homogeneous lighting condition on each weld nugget on the surface of the car underbody, a controllable white LEDs lighting system was installed circularly in the front side of the CCD camera in a ring-shaped case. The HC-SR04 ultrasonic sensor connected to Arduino is used to mainly measure the distance between the camera and the nugget. A red linear laser with a wave length of 656 nm was used in this study to find the geometric location of each nugget.

2.2. The System’s Software Interface

The software interface of the proposed system includes a designed graphical user interface (GUI), shown in Figure 3, and embedded algorithms built within Matlab. The main purpose of the GUI is to show the process of the proposed methods and visualize the results.
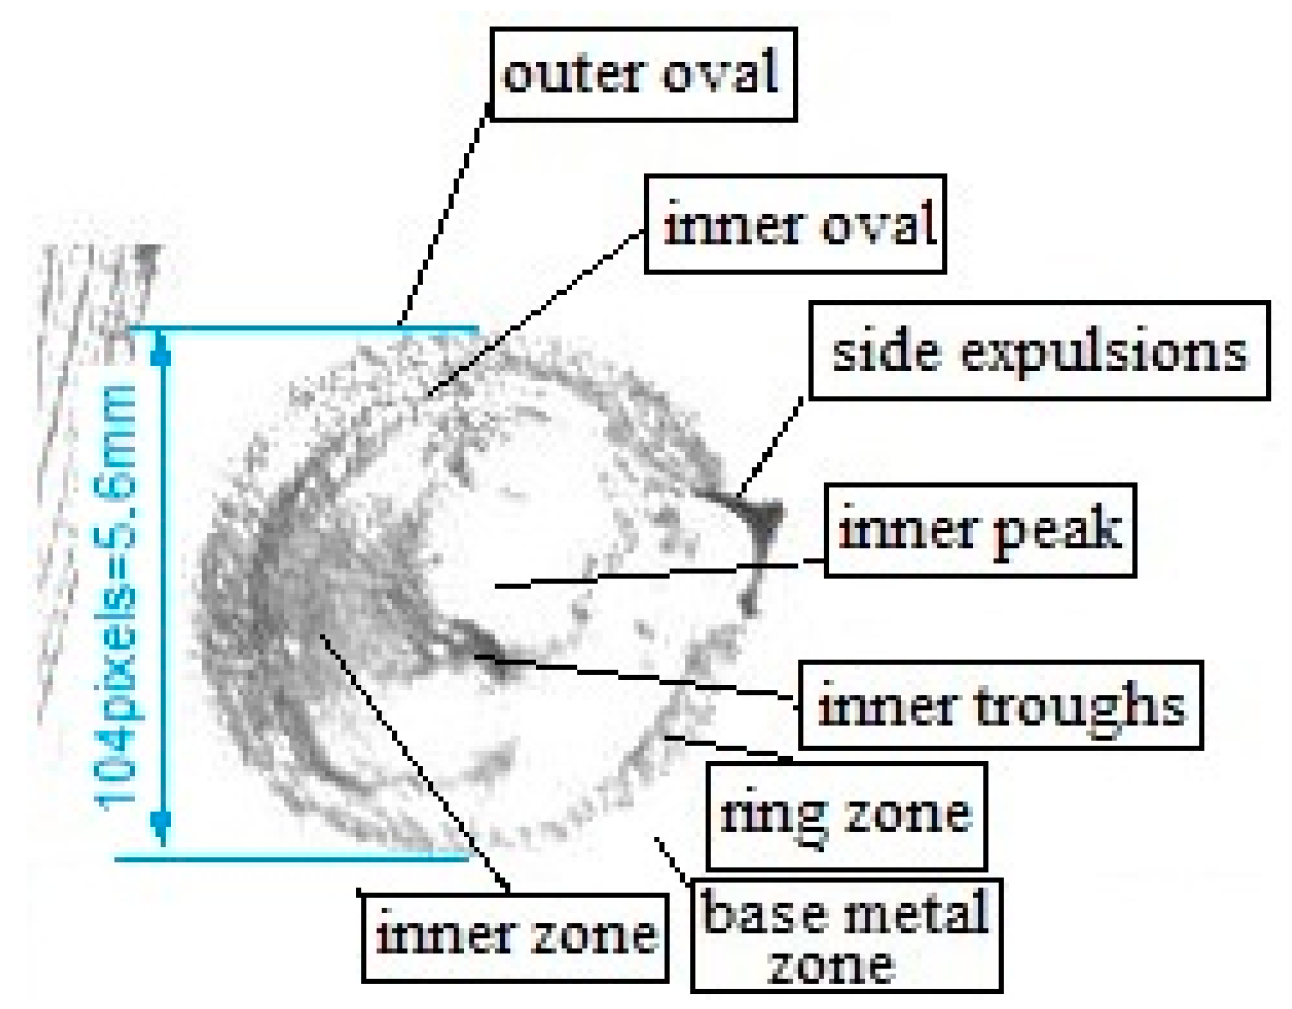
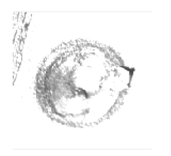
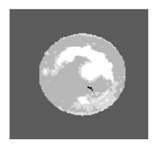
The first step is reading the input grey image of the weld nugget from a front panel of the car underbody used for the experimental work. This front panel is made up of steel with 2 mm thickness, and contains different types of weld nuggets. For a given sheet metal thickness, the correct choice of weld size is critical. The sub-sized weld nuggets may lead to weak quality, while over-sized ones cost higher. Various industry standards recommend the optimum diameter of the weld spot to be d = 4 t for steels, where d and t are the nugget’s diameter and the sheet thickness, respectively, in mm. Regarding, the front panel used for the experimental work in this paper, the optimal nugget’s diameter is 5.6 mm. The shape of the weld nuggets is a circle. Figure 4 shows an image of a weld nugget with its geometrical characteristics. As shown in Figure 4, the inner area of the spot refers to the area of the fusion zone which is contoured by the inner contour, while the outer contour indicates the outlined main contour of the heat-affected zone of the weld nugget. Side expulsions refer to spatters located close and outside of the outer contour in the base metal zone. Inner troughs refer to the existence of voids (blow holes) or cracks inside the fusion zone, while ring troughs refer to the existence of voids or pitting outside the fusion zone outside the fusion zone. The inner peaks refer to the superficial protuberances inside the inner zone.

3. Image Processing System Methodology of Resistance Spot Welding

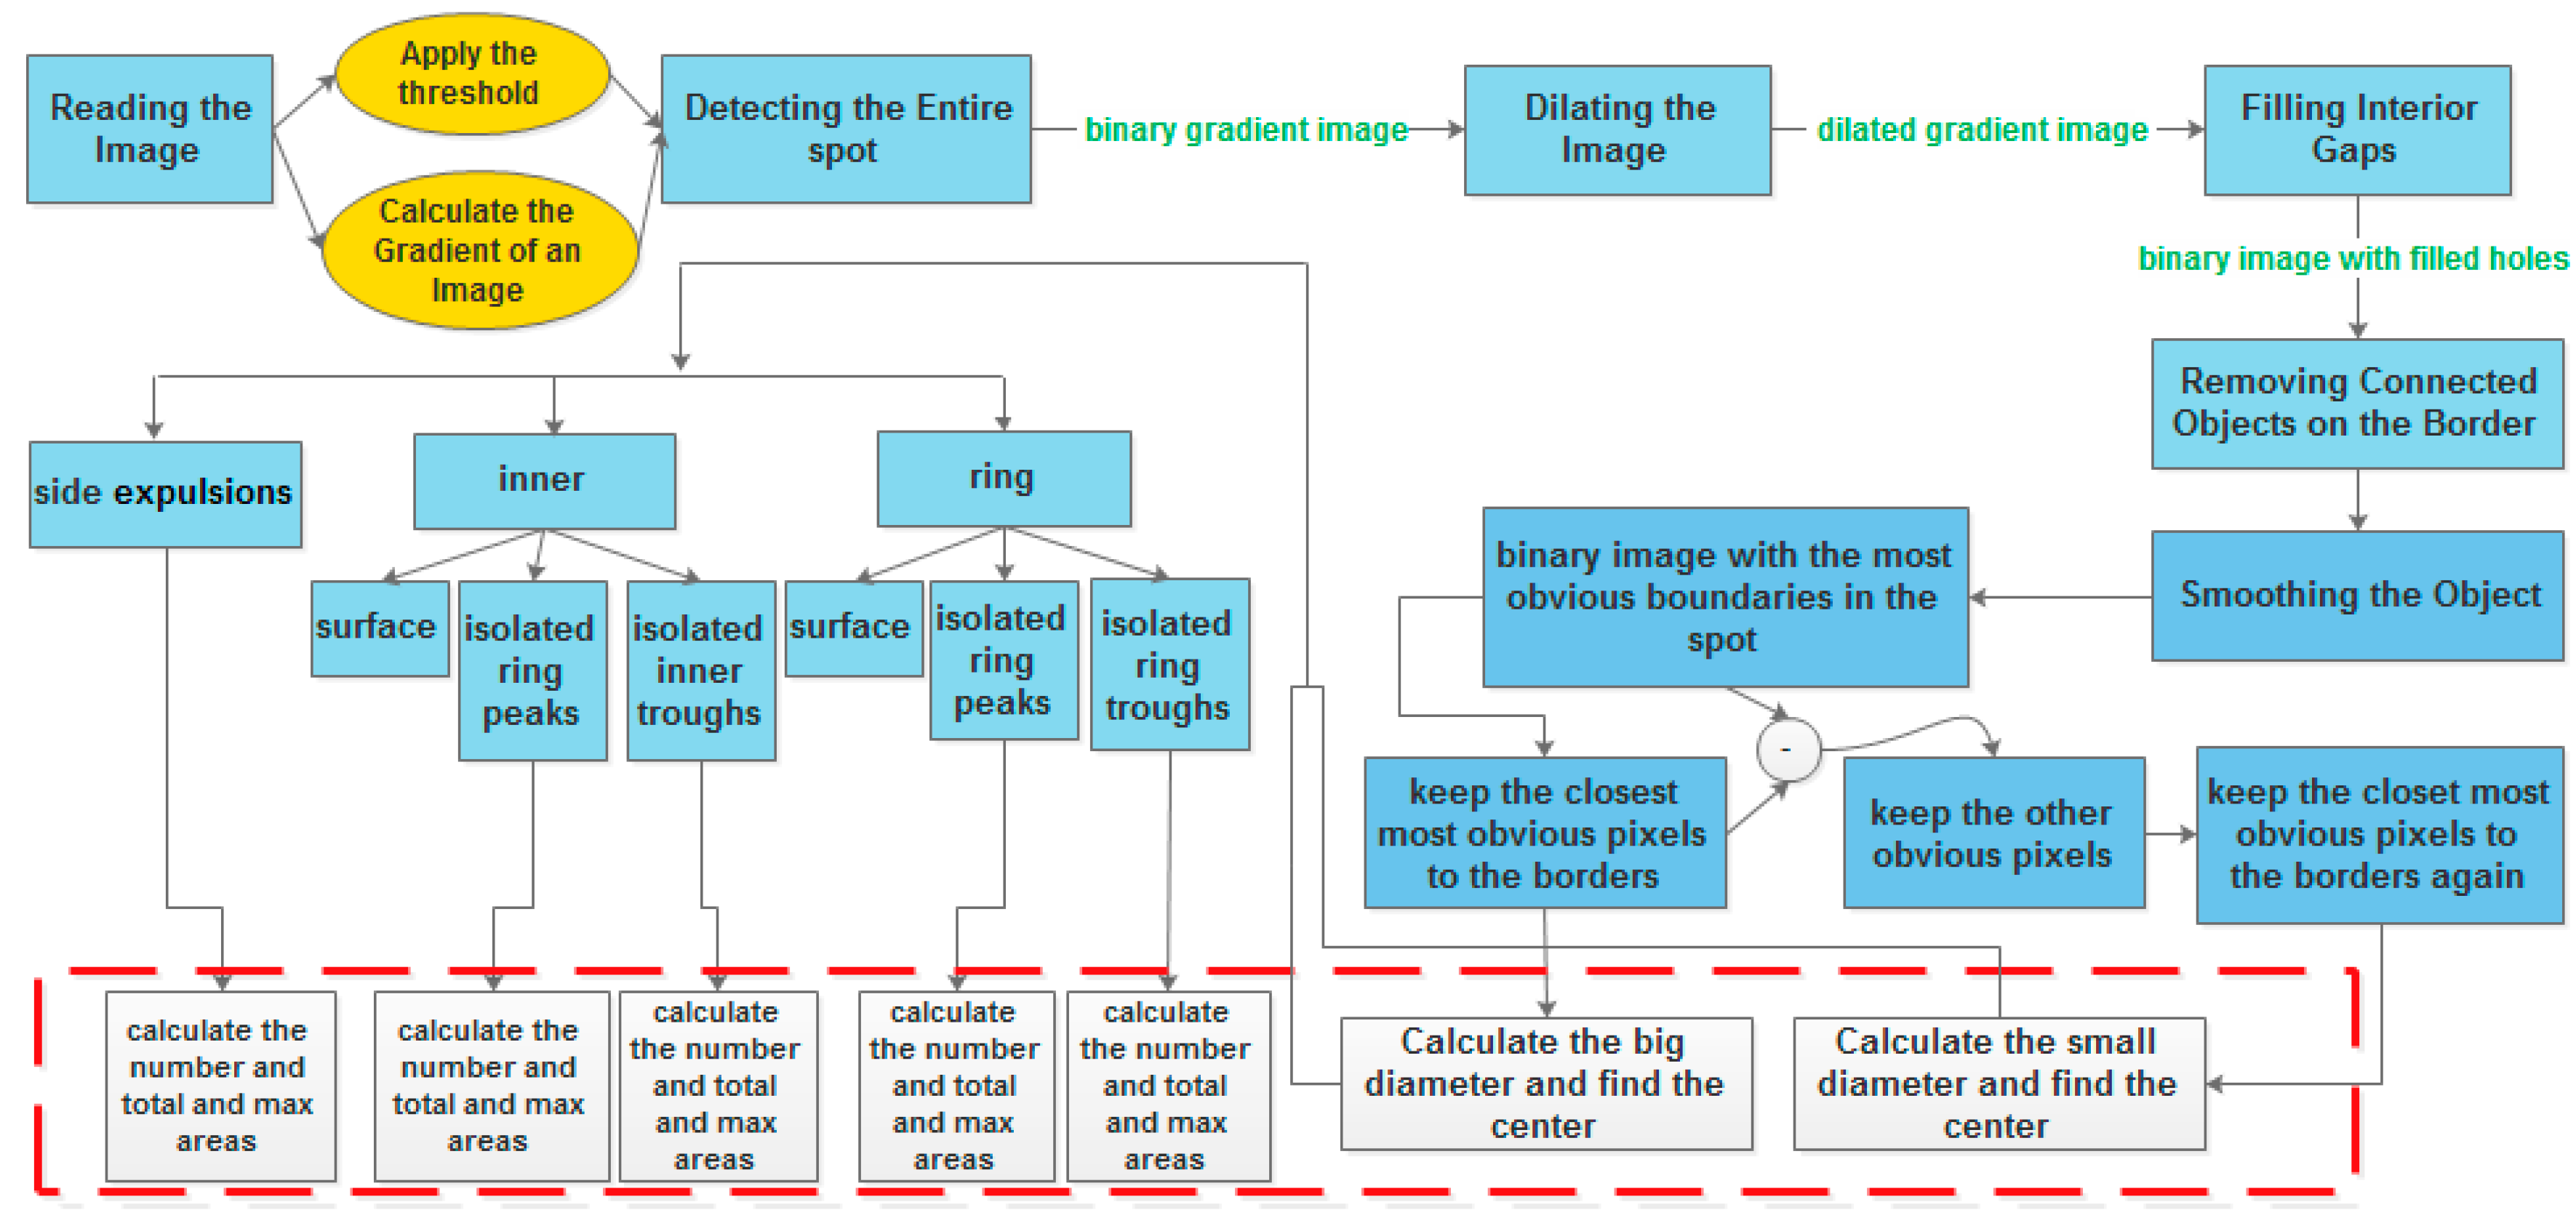
Original digital grey images such as shown in Figure 4, taken by the CCD camera, are transferred through the USB cable to the supervisor computer for further processing by the proposed algorithms. The primary purpose of the vision methods is to find the location of the center and the inner and outer contours of the weld nugget in the original digital grey image, and then extract its characteristics. The following diagram (Figure 5) shows the key steps of the proposed algorithms to detect the nugget’s contours and extract the geometrical characteristics from its surface.

3.1. Segmentation Operation, Thresholding Process and Dilation Morphological Operation

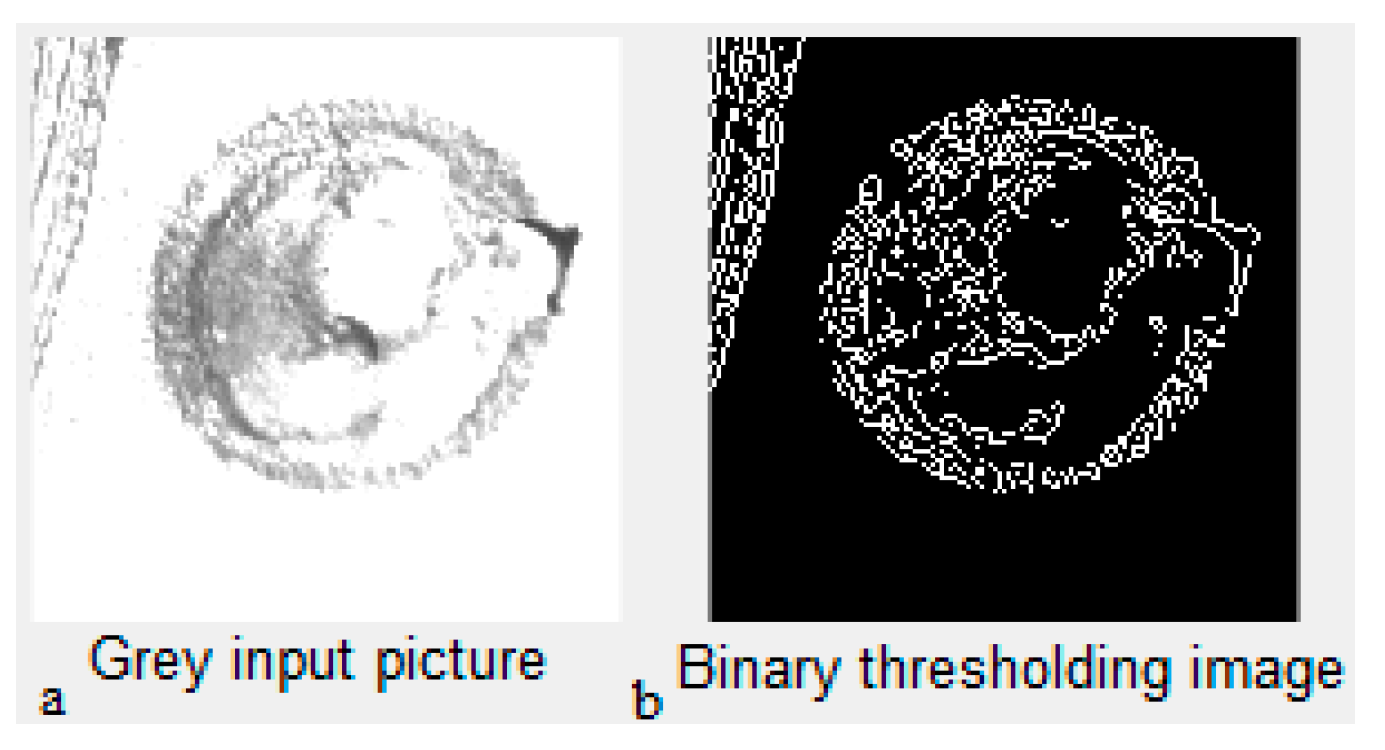
Firstly, it is necessary to read the image of the nugget into Matlab. To detect this spot, object segmentation and thresholding process have been used. The thresholding value affects the segmentation result of the weld nugget which is necessary to obtain the nugget’s parameters and estimate its quality. In an outdoor environment, the lighting conditions may lead to poor results, but in our research, the robotized vision-estimation system of the resistance spot welding takes place in an indoor environment at the auto factory or at the laboratory, and the use of a controllable lighting system shown in Figure 2 nearly prevents the effect of ambient lighting. Therefore, the weld nugget to be segmented looks greatly different in contrast with the background (the base metal band), as shown in Figure 4. This can be detected by using Sobel operators that calculate the gradient value of the image. Then, this value can be tuned and used as a factor in a threshold function to create a binary image containing segmented lines of the spot. The output image shown in Figure 6 is a binary image with only two values; zeroes for black pixels of the background and ones for white foreground pixels which refer to the main lines of the weld nugget in the image.
By comparing the resulting thresholding binary image with the original image, gaps and high contrast lines surrounding and inside the weld nugget could be seen. These lines do not quite delineate the outline of the object of interest. The gaps will disappear if this binary image is dilated using linear vertical and horizontal structuring elements that are a small binary set of coordinate pixels, each with a value of one. As shown in Figure 7, the structuring element is positioned at all possible locations in the binary image. For each background (zero-value) pixel in the binary image, the structuring element is placed on top of the input image so that its origin coincides with this background (zero-value) pixel position. If at least one pixel in the structuring element coincides with a foreground (one-value) pixel in the image underneath, then the input pixel is set to the foreground (one-value) pixel. The structuring element is said to fit or hit the image at that position. If all the corresponding pixels in the image are background, the input pixel is left at the background value, and there is neither fit nor hit in this case.
Mathematically, dilation of a binary image I by a structuring element b is a morphology operation, which produces a new binary image g = I b with ones in all locations ( x , y ) of a structuring element’s origin at which that structuring element b hits or fits the input image I, i.e., g ( x , y ) = 1 if b hits or fits I and 0 otherwise, repeating for all pixel coordinates ( x , y ) .
I b = { ( x , y ) | ( b ) ( x , y ) I }
The resulting image of applying this dilatation morphological operation on the binary thresholding image is shown in Figure 8c. The practical result shows that foreground regions grow in size gradually and gaps inside the weld nugget shrink.

3.2. Flood-Fill Operation, Borders Clearance and Smoothing Operation

After the dilatation process, the outline of the spot appears quite nicely, but there are still holes (area of dark pixels surrounded by white pixels) inside the weld nugget image. To remove these holes, a flood-fill operation on background pixels of the 2-D input dilated binary image is performed using 4-connected background neighbors. That means that the pixels are connected if their edges touch, and the neighborhood of a pixel is the adjacent pixels in the horizontal or vertical direction. This operation changes connected background pixels (zeroes) to foreground pixels (ones), stopping when it reaches object boundaries. The implications of connectivity can be illustrated with this matrix shown in Figure 9.
After applying the flood fill operation, the holes inside the regions of interest shrink. The spot of interest has been successfully segmented, but it is not the only object that has been found. Therefore, it is necessary to remove any objects that are connected to the border of the image, then smoothing the segmented objects to make it look natural by eroding the image twice with a diamond structuring element. Mathematically, the erosion of a binary image I by a structuring element b is a mathematical morphology operation, which produces a new binary image g = I Θ b with ones in all locations (x,y) of a structuring element’s origin at which that structuring element b fits the input image I, i.e., g(x,y) if b fits I and 0 otherwise, repeating for all pixel coordinates (x,y). The holes and gaps between different regions become larger, and small details are eliminated.
I Θ b = { ( x , y ) | b ( x , y ) I }
In other words, it is the set of pixel locations (x,y), where the structuring element translated to location (x,y) overlaps only with foreground pixels in I. The resulting right image shown in Figure 10f, is a binary image showing the segmented areas of the spot in white color with black background.

3.3. Contours Detection, Location Based Selection of Pixels Method and Least-Squares Fitting Curve Algorithm

After that, it is wanted to isolate the pixels which belong to the perimeter of the segmented areas. A pixel is part of the perimeter if it is nonzero and connected to at least one zero-valued pixel. These pixels are the outlined contours of the segmented areas of the weld nugget. And they represent the most intense lines of the spot. Then, the outlined contours are placed around the segmented areas of the weld nugget in the original image. And by subtracting this matrix from the matrix of the original image itself, the outlined contours around the segmented areas of the weld nugget will appear in a white color with black background as shown in Figure 11b.
Figure 11b shows the most intense lines in the original picture of the weld nugget in white colors with black background. These lines refer to the most likely locations for the pixels’ existence. Usually those pixels belong to the inner and outer contours of the whole weld nugget, or they belong to inside the fusion zone, and very few out of the outer contour of the spot. The goal is to split these pixels into two images. Figure 12b contains only the pixels which belong to the outer contour of the spot, while Figure 12c contains only the pixels which belong to the inner contour. To execute that, Figure 12a has been divided into 4 quarters in order to check the white pixels’ locations separately. In each row, only those white pixels closest to the image border were selected, while the rest are converted to zero. Whenever white pixels are found in two consecutive rows, the one closest to the border is preserved and the other one turns into zero. The information gathered from all four quarters is then displayed, according to their original location, in Figure 12b. This method is called the “location-based selection of pixels”. By using newton method with algorithm “least-squares fitting curve” [33] for fitting a circle to a set of points, the most likely circle (radius and center coordinates) of the white pixels in Figure 12b has been detected. Finally, by subtracting Figure 12b from Figure 12a and deleting those pixels placed within the detected weld nugget’s center and less than half of the detected radius of the weld nugget’s main contour, Figure 12c could be extracted to represent the most likely locations of the pixels of the contour of the fusion zone.
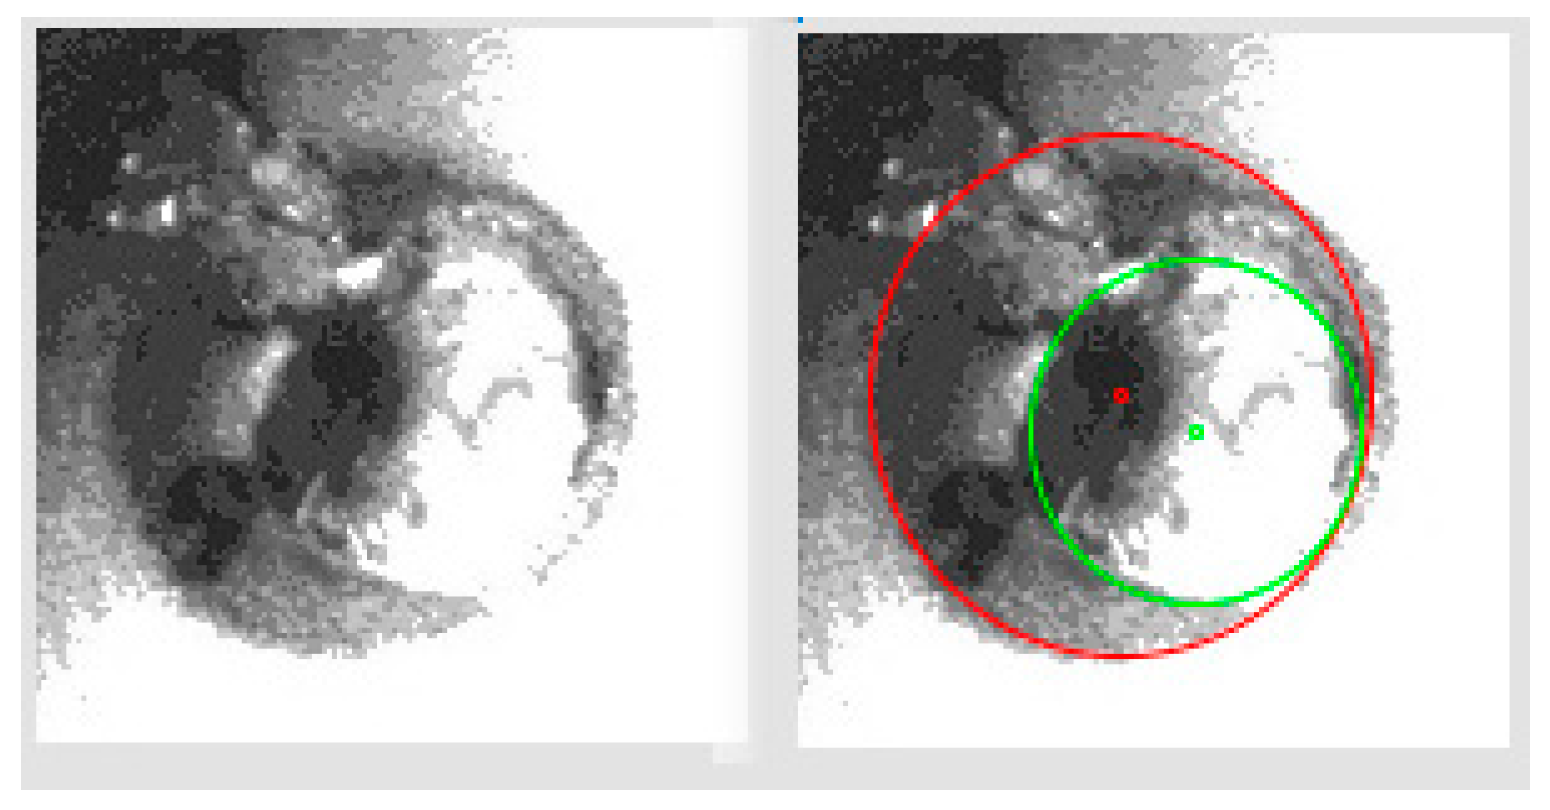
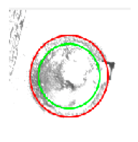
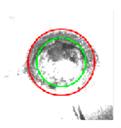
As it is mentioned above, by using “least-squares fitting curve” for fitting a circle to a set of points, the center location of the spot, the biggest radius, whole area, smallest radius, and the inner area of the weld nugget have been calculated. In Figure 13a, the two calculated circles were added to the images.
Figure 13b shows the results of the center coordinates of the outer contour (xo,yo), the errors (dxo,dyo) in the center coordinates of the outer contour with respect to the ideal coordinates of the outer contour (80,80), radius ro, and area ao of the outer contour. To improve the calculation of the inner contour, all the pixels in the smoothed image, shown in Figure 10f, which are located outside the blue circle shown in Figure 13a, are converted into zeroes as shown in Figure 14a. Then, Figure 14b shows the application of an erosion process with a diamond structuring element to erode some white pixels. And after that “location based selection of pixels” method and newton method with “least-squares fitting curve algorithm” were used again to obtain the green circle as shown in Figure 14c,d, respectively. Improved results of the inner contour are shown in Figure 14e.

3.4. Zones Division, Value Based Selection of Pixels Method and 3D Model of the Weld Nugget

After finding the two contours, the original grey input picture of the weld nugget is divided into three main zones as shown in Figure 15; the inner zone represents all the pixels inside the inner contour. The ring zone represents all the pixels between the two contours. The side expulsion zone represents all the pixels located close and outside the outer contour.
For the inner zone and ring zone, the contrast has been enhanced by applying histogram equalization, then the thresholding function has been used to separate the white regions, dark regions and grey regions which refer to peaks, troughs and normal surface of the weld nugget, respectively. The resulting images are as shown in Figure 16 and Figure 17.
Next, it is wanted to calculate the number and the area of both the white peak regions and black troughs regions shown in Figure 16b,d and Figure 17b,d. To achieve that, a novel “value based selection of pixels” method has been applied to separate each peak’s white region and calculate its area, as shown in Figure 18. The input image of this method is a binary image which contains white areas (foreground one-value pixels) with black backgrounds (zero-value). The process is based on changing the first white one-value pixel in the binary image matrix from one-value to   10 × ( c o u n t e r + 1 ) value, where “counter” is a variable which initial value is zero, and refers to the number of the white peaks regions. Then all the white pixels (ones), which are neighbors to the previous changed-value 10 × ( c o u n t e r + 1 ) , are also changed to the same value   10 × ( c o u n t e r + 1 ) . The process ends when we reach to a zero pixel or to a white one-value pixel which doesn’t have any neighboring pixel with 10 × ( c o u n t e r + 1 ) value. “Counter” is increased by one each time we find a new white one-value pixel which had no connectivity to a pixel with 10 × ( c o u n t e r + 1 ) value before increment. The whole process ends when we reach the last right bottom pixel in the input image. The principle of the method is similar to the Minesweeper game and it can be used in many image processing applications, especially the medical applications for separation of regions inside a cell and measurement of their sizes.
The same method has been applied for the side expulsion zone in order to calculate the total number of the side expulsions and their areas.
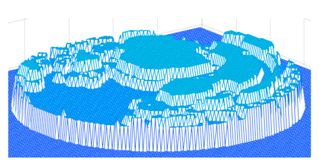
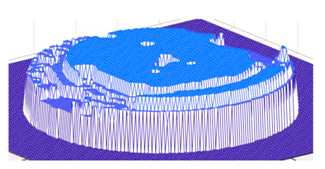
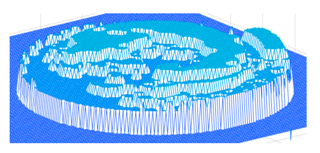
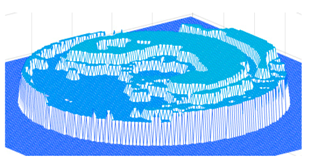
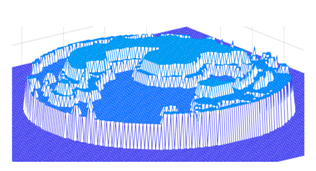
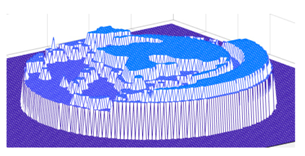
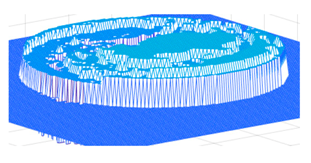
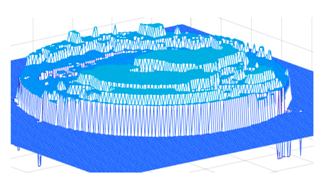
Finally, a 3D model of the weld nugget, as shown in Figure 19, has been excluded based on the final results to show the topography of the weld nugget. As can be seen, the figure shows the bends of the spot’s surface.

4. Quality Estimation of Resistance Spot Welding

The resistance spot welding quality estimation process goes through two stages as shown in Figure 20. In the first stage, the first estimation unit detects the possibility of significant defects in the weld nugget’s surface such as the presence of deformed metal failure or no-weld failure modes. When these defects aren’t found, a second estimation unit comes into action. The process in the second fuzzy unit includes training a fuzzy inference system in the beginning. There were 48 weld nuggets samples, which have neither a deformed metal failure nor no-weld failure based on the output result of the first estimation unit, are used to train the fuzzy system by defining 11 fuzzy input functions based on the geometrical characteristics extracted using image processing of the weld nugget’s surface. After the training, the final estimation of spot welding’s quality is based on the probability output of the first unit and the second fuzzy unit. In other words, based on the first unit’s output, a decision is taken on whether the system has to continue the quality inspection process or no.

4.1. The First Estimation Unit

The deformed metal failure occurs when the metal around the weld nugget is bent or deformed before the welding process. This causes incorrect alignment in the contours of the heat-affected zone and fusion zone. The no-weld failure occurs when no weld nugget has formed, and it is often caused by low weld current or short weld time. In this case, the proposed methods fail in detection of the weld nugget’s contour. The deformed metal failure and the no-weld failure modes are detected through the first unit. The detection process in this unit is performed by comparing the centers and radiuses results of the fusion zone and the heat-affected zone of the weld nugget. In other words, the failures occurred if:
( e 0.5 h ) ( r i r o )
where, e and h are obtained using the following equations:
e = ( x o x i ) 2 + ( y o y i ) 2 h = r o r i
where, (xo,yo,ro) and (xi,yi,ri) are the circle parameters of the outer and inner contours, respectively.

4.2. The Second Fuzzy Estimation Unit

Other defects such as the existence of side expulsions, cracks or voids (blow holes), pitting, bad size-weld, and bad location-weld are estimated through the second unit. The side expulsions occur when the molten metal is blown out from under the weld tips. The cracks or voids occur when the molten metal is squeezed from between the weld tips. The pitting occurs when arcing current burns a black hole into the weld’s surface. The image processing methods extract the geometrical characteristics of the 48 weld nuggets’ images which have successfully passed the first estimation unit. Using these characteristics, the fuzzy unit is trained to be used to estimate the probability of previous failures in the weld nugget’s surface. To achieve that, the resulting values of the center’s coordinates, big radius, and small radius were compared respectively with the ideal values of the same geometrical characteristics for the same spot which were stored on the computer to compute DeltaX, DeltaY, DeltaHeatAffectedZoneArea, and DeltaFusionZoneArea.
D e l t a X = 0.5 ( d x o + d x i ) D e l t a Y = 0.5 ( d y o + d y i ) D e l t a H e a t A f f e c t e d Z o n e A r e a = π ( r o 2 50 2 ) D e l t a F u s i o n Z o n e A r e a = π ( r i 2 40 2 )
where, 50 and 40 is the ideal values of the big and small radius in pixel, respectively.
The previous 4 values are used to estimate the problems in weld’s size and location. In addition, the numbers and maximum areas of peaks, troughs and side expulsions are used as addition variables to estimate the existence of side expulsions, cracks or voids (blow holes), and pitting. All the variables are used to define 11 fuzzy input functions of the proposed fuzzy estimation unit. In order to transform the inputs into linguistic variables, the fuzzy sets of the first four inputs are defined as positive (P), zero (Z) and negative (N), and for the other inputs, they are defined as small (S), middle (M) and big (B) for each one. These membership functions have been defined using training process. For example, the values obtained of the first input (DeltaX) has been stored as a training database in a vector of 48 elements (which refer to the number of the samples), then the max, min and mean values of the vector have been used to define the member functions of the first fuzzy input as shown in Figure 21.
The same way has been used to define all the member functions of all the fuzzy inputs. For the output function “the quality of the weld nugget’s surface”, the fuzzy sets are defined as good quality (G), medium quality (M), and bad quality (B). It is shown in Figure 22.
Figure 23 shows the structure of the fuzzy logic controller. As can be seen, the fuzzy inputs of the proposed controller are DeltaX, DeltaY, DeltaHeatAffectedZoneArea, DeltaFusionZoneArea, MaxAreaSideExpulsions, ObjectCountSideExpulsions, MaxAreaInnerBlack, ObjectCountInnerBlack, MaxAreaInnerWhite, MaxAreaRingBlack and MaxAreaRingWhite.
Forty-six fuzzy rules are depicted to estimate the quality based on knowledge database and the 11 fuzzy input functions. Below there are three of those rules:
  • If [(deltaX is N) and (deltaY is N) and (DeltaHeatAffectedZoneArea is N) and (DeltaFusionZoneArea is N) and (MaxAreaSideExpulsions is B) and (ObjectCountSideExpulsions is B) and (MaxAreaInnerBlack is B) and (ObjectCountInnerBlack is B) and (MaxAreaInnerWhite is S) and (MaxAreaRingBlack is B) and (MaxAreaRingWhite is S)] then (quality is bad).
  • If [(deltaX is P) and (deltaY is P) and (DeltaHeatAffectedZoneArea is P) and (DeltaFusionZoneArea is P) and (MaxAreaSideExpulsions is B) and (ObjectCountSideExpulsions is B) and (MaxAreaInnerBlack is B) and (ObjectCountInnerBlack is B) and (MaxAreaInnerWhite is S) and (MaxAreaRingBlack is B) and (MaxAreaRingWhite is S)] then (quality is bad).
  • If [(deltaX is Z) and (deltaY is Z) and (DeltaHeatAffectedZoneArea is Z) and (DeltaFusionZoneArea is Z) and (MaxAreaSideExpulsions is S) and (ObjectCountSideExpulsions is S) and (MaxAreaInnerBlack is S) and (ObjectCountInnerBlack is S) and (MaxAreaInnerWhite is B) and (MaxAreaRingBlack is S) and (MaxAreaRingWhite is B)] then (quality is good).

5. Experimental Work

5.1. Collect the Pictures of the Weld Nuggets on a Car Underbody

As shown in Figure 24, the coordinates system of the end effector of the robotic arm, which function is to collect the required perfect picture of the target “weld nuggets”, is based on the following conditions:
  • The axis z5 of the 5th joint or the last joint, which is also the axis of the camera, must be perpendicular to the weld nugget’s surface.
  • The best distance between the end effector and the nugget’s surface (d + s) is measured for the first nugget after considering the best clearance of the picture shown by the camera.
  • The best value (30 cm) of s is measured by a light distance sensor, and has to be used for all the weld nuggets on the body.
Figure 25 shows the experimental results of applying the previous method for the coordinates’ detection of the weld nugget.
The laser light ends at the center of the weld nugget. In order to achieve that in our experimental platform, a circle and its center point have been added to the video recorded by the camera. The end of laser light must touch the center point and the circle must touch the weld nugget’s edges. When working with factory environment conditions, the six coordinates of the weld nugget’s center are given, so using simple calculations, the required six coordinates of O5 can be concluded and used to solve the inverse kinematics of the robotic arm, and obtain the required six motors’ angles. REbot6V, shown in Figure 26, is the robotic arm motion control system interface which is written by VC++6.0. It is used in this paper to enter the G-code commands to control the motion of the robotic arm.

5.2. Results

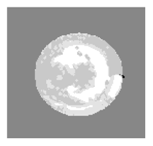
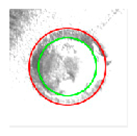
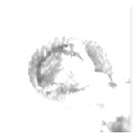
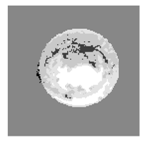
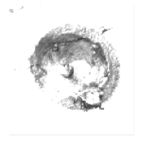
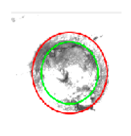
Table 1 shows different cases and results of applying the previous methods on different images of weld nugget types.

5.3. Discussion

Firstly, in order to check the accuracy of our proposed system in detecting the radiuses of the heat-affected zone and fusion zone, 30 weld nuggets were manually measured. The results showed the efficiency of our proposed system in measuring the size when the weld nugget’s shape is almost a circle. Also, the topography of each of those samples was compared with the corresponding 3D model which was concluded based of our proposed system. The comparison results show a high accuracy in detection the troughs, tops and side expulsions.
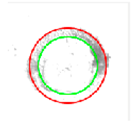
Secondly, 20 images of nuggets samples, where deformed metal failure occurred were used to prove the efficiency of our proposed system in detection the deformed metal failure and the no-weld failure modes. Our system detected the failure correctly in 18 out of 20 images. This was caused because the nugget’s shape in these two images was elliptical. Figure 27 shows one of these 18 images, where ro = 50, ri = 33, (xo,yo) = (83,78), (xi,yi) = (87,95), e = 17 and h = 17.
Thirdly, for the other defects such as the existence of side expulsions, cracks or voids (blow holes), pitting, bad size-weld, and bad location-weld, 330 images were used, and the quality estimation result was very positive when the nugget’s shape is almost a circle. The proposed fuzzy unit classified the images correctly as “good quality, middle quality and bad quality”. Four of those images were correctly detected as no-weld failure mode.
Based on Table 1, the weld nugget number 1 has a medium quality because of the small void in the fusion zone and the side expulsion. The weld nugget number 8 has the lowest quality due to the number and areas of the side expulsions and inner troughs mainly. The weld nugget number 7 has a low quality also because it is an undersized-weld, while the weld nugget number 2 has the best quality because its size and its location are very close to the ideal, and it doesn’t have any side expulsions, voids or cracks. Compared with other works, the proposed system in this paper enhanced the quality estimation of the resistance spot welding and solved the problem of the bad lighting conditions by using controllable lighting system shown in Figure 2.

6. Conclusions

A novel detailed study of the estimation of the quality of resistance spot welding was developed based on image processing and training fuzzy a logic inference system. A vision eye-in-hand system based on a 6DOF robotic arm carried a CCD camera, has been controlled to take pictures of various weld nuggets’ locations on the car underbody after the welding process. Through applying the proposed image processing methods on the input images, new geometrical characteristics were obtained and used to define eleven fuzzy input functions of a fuzzy inference system model. Based on knowledge database, 46 fuzzy rules were added to the model. The main conclusions of this article are as follows:
  • The extracted geometrical characteristics include:
    • The weld nugget’s shape and center’s location.
    • The smallest radius and the inner area of fusion zone of a weld nugget.
    • The largest radius and the whole area of the heat-affected zone of a weld nugget.
    • The number and areas of all side expulsions.
    • The number and areas of all the isolated inner peaks
    • The number and areas of all the isolated inner troughs which refer to the existence of voids (blow holes), cracks, or pitting inside and outside the fusion zone.
    • The number and areas of all the isolated ring peaks.
    • The number and areas of all the isolated ring troughs which refer to the existence of voids (blow holes), cracks, or pitting inside and outside the fusion zone.
  • The topography of the weld nugget’s surface is concluded and shown as a 3D model.
  • The results of the study concluded that the estimation of the 3D model of the weld nugget’s surface reaches a very high accuracy.
  • The proposed system shows high accuracy in detecting different kinds of defects such as the deformed metal failure, the no-weld failure, the existence of side expulsions, cracks, voids (blow holes), pitting, bad size-weld, and bad location-weld.
  • The execution time of the methods for each weld nugget is about 50 ms.
This non-contact and non-destructive automatic quality inspection system of weld nuggets’ surfaces can be easily applied in automobile factories and greatly improve the flexibility of the manufacturing process. The proposed system showed limitations when the shape of the weld nugget to be analyzed is an ellipse. So, in the next work, it will be fundamental to develop the methods to improve the estimation quality to meet the industry’s requirements.

Author Contributions

Conceptualization, E.A. and H.L.; methodology, M.M.; project administration, Q.C. and S.L.; resources, M.M. and Y.Z.; software, E.A.; supervision, H.L.; writing-original draft, E.A.; writing-review & editing, E.A. and A.A.G.

Funding

This work is supported by [The National Natural Science Foundation of China] grant number [51675393], [Wuhan High-Tech Development Project Foundation] grant number [2017010201010138] and [the major projects of technological innovation of Hubei Province] grant number [2017AAA111].

Conflicts of Interest

The authors declare no conflict of interest.

References

  1. Tianhu, S. Application of welding technology in automotive manufacturing. Aeronaut. Manuf. Technol. 2004, 3, 24–27. [Google Scholar]
  2. Akkaş, N. Welding time effect on tensile-shear loading in resistance spot welding of SPA-H weathering steel sheets used in railway vehicles. Acta Phys. Pol. A 2017, 131, 52–54. [Google Scholar] [CrossRef]
  3. Pouranvari, M.; Marashi, S.P.H. Critical review of automotive steels spot welding: Process, structure and properties. Sci. Technol. Weld. Join. 2013, 18, 361–403. [Google Scholar] [CrossRef]
  4. Lan, Z.; Jianwei, Y.; Jing, C. Present status and trend analysis of quality monitor technique for resistance spot welding. J. Hubei Univ. Technol. 2008, 23, 38–45. [Google Scholar]
  5. Patange, S.; Anjaneyulu, T.; Reddy, G. Microprocessor-based resistance welding monitor. Weld. J. 1985, 25, 33–38. [Google Scholar]
  6. Dickinson, D.W.; Franklin, J.E.; Stanya, A. Characterization of spot welding behavior by dynamic electrical parameter monitoring. Weld. J. 1980, 59, 170–176. [Google Scholar]
  7. Gedeon, S.A.; Sorensen, C.D.; Ulrich, K.T.; Eagar, T.W. Measurement of dynamic electrical and mechanical properties of resistance spot welds. Weld. Res. Suppl. 1987, 66, 378–385. [Google Scholar]
  8. Hao, M.; Osman, K.A.; Boomer, D.R.; Newton, C.J. Developments in characterization of resistance spot welding of aluminum. Weld. J. 1996, 75, 1. [Google Scholar]
  9. Brown, J.D.; Rodd, M.G.; Williams, N.T. Application of artificial intelligence techniques to resistance spot welding. Ironmak. Steelmak. 1998, 25, 199–204. [Google Scholar]
  10. Dilthey, U.; Dickersbach, J. Application of neural networks for quality evaluation of resistance spot welds. ISIJ Int. 1999, 39, 10. [Google Scholar] [CrossRef]
  11. Cho, Y.; Rhee, S. Quality estimation of resistance spot welding by using pattern recognition with neural networks. IEEE Trans. Instrum. Meas. 2004, 53, 330–334. [Google Scholar] [CrossRef]
  12. Hwang, I.; Yun, H.; Yoon, J.; Kang, M.; Kim, D.; Kim, Y.M. Prediction of resistance spot weld quality of 780 MPa grade steel using adaptive resonance theory artificial neural networks. Metals 2018, 8, 453. [Google Scholar] [CrossRef]
  13. Athi, N.; Wylie, S.R.; Cullen, J.D.; Al-Shamma’a, A.I.; Sun, T. Ultrasonic non-destructive evaluation for spot welding in the automotive industry. In Proceedings of the IEEE Sensors, Christchurch, New Zealand, 25–28 October 2009; pp. 1518–1523. [Google Scholar]
  14. Liu, J.; Xu, G.; Ren, L.; Qian, Z.; Ren, L. Defect intelligent identification in resistance spot welding ultrasonic detection based on wavelet packet and neural network. Int. J. Adv. Manuf. Technol. 2017, 90, 2581–2588. [Google Scholar] [CrossRef]
  15. Podržaj, P.; Polajnar, I.; Diaci, J.; Kariž, Z. Estimating the strength of resistance spot welds based on sonic emission. Sci. Technol. Weld. Join. 2005, 10, 399–405. [Google Scholar] [CrossRef]
  16. Tsukada, K.; Yoshioka, M.; Kiwa, T.; Hirano, Y. A magnetic flux leakage method using a magnetoresistive sensor for nondestructive evaluation of spot welds. NDT E Int. 2011, 44, 101–105. [Google Scholar] [CrossRef]
  17. Harada, D.; Sakai, K.; Kiwa, T.; Tsukada, K. Analysis of the internal structure of a spot-weld by magnetic measurement. In Proceedings of the Singapore International NDT Conference & Exhibition, Singapore, 19–20 July 2013. [Google Scholar]
  18. Tsukada, K.; Miyake, K.; Harada, D.; Sakai, K.; Kiwa, T. Magnetic nondestructive test for resistance spot welds using magnetic flux penetration and eddy current methods. J. Nondestruct. Eval. 2013, 32, 286–293. [Google Scholar] [CrossRef]
  19. Abdulhadi, A.; Gdeisat, M.; Burton, D.; Lilley, F. Assessing the quality of spot welding electrode tips using image processing techniques. Proc. World Congr. Eng. 2011, 2, 4–9. [Google Scholar]
  20. Simončič, S.; Podržaj, P. Image-based electrode tip displacement in resistance spot welding. Meas. Sci. Technol. 2012, 23, 6. [Google Scholar] [CrossRef]
  21. Podržaj, P.; Simončič, S. A machine vision-based electrode displacement measurement. Weld. World. 2014, 58, 93–99. [Google Scholar] [CrossRef]
  22. Simončič, S.; Podržaj, P. Resistance spot weld strength estimation based on electrode tip displacement/velocity curve obtained by image processing. Sci. Technol. Weld. Join. 2014, 19, 468–475. [Google Scholar] [CrossRef]
  23. Ruisz, J.; Biber, J.; Loipetsberger, M. Quality evaluation in resistance spot welding by analysing the weld fingerprint on metal bands by computer vision. Int. J. Adv. Manuf. Technol. 2007, 33, 952–960. [Google Scholar] [CrossRef]
  24. Yang, O.; Li, Y. Quality evaluation and automatic classification in resistance spot welding by analyzing the weld image on metal bands by computer vision. Int. J. Signal Process. Image Process. Pattern Recognit. 2015, 8, 301–314. [Google Scholar]
  25. Zhanfeng, H.; Pei, W.; Jing, X.; Jingyu, H. Application of fractal theory in examination of resistance spot welding quality. Mater. Sci. Technol. 2010, 17, 422–424. [Google Scholar]
  26. Ye, S.; Guo, Z.; Zheng, P.; Wang, L.; Lin, C. A vision inspection system for the defects of resistance spot welding based on neural network. In International Conference on Computer Vision Systems; Lecture Notes in Computer Science; Springer: Cham, Switzerland, 2017; pp. 161–168. [Google Scholar]
  27. Yang, Y.; Zheng, P.; He, H.; Zheng, T.; Wang, L.; He, S. An evaluation method of acceptable and failed spot welding products based on image classification with transfer learning technique. In Proceedings of the 2nd International Conference on Computer Science and Application Engineering (CSAE2018), Hohhot, China, 22–24 October 2018. [Google Scholar]
  28. Chen, J.; Feng, Z. IR-based spot weld NDT in automotive applications. Proc. SPIE 2015, 9485, 948513. [Google Scholar]
  29. Chen, J.; Feng, Z. Online resistance spot weld NDE using infrared thermography. Proc. SPIE 2017, 10169, 101690K. [Google Scholar]
  30. Božanić, D.; Pamučar, D.; Bojanić, D. Modification of the analytic hierarchy process (AHP) method using fuzzy logic: Fuzzy AHP approach as a support to the decision making process concerning engagement of the group for additional hindering. Serbian J. Manag. 2015, 10, 151–171. [Google Scholar] [CrossRef] [Green Version]
  31. Pamučar, D.; Božanić, D.; Lukovac, V.; Komazec, N. Normalized weighted geometric bonferroni mean operator of interval rough numbers—Application in interval rough dematel-copras. Facta Univ. Ser. Mech. Eng. 2018, 16, 171. [Google Scholar] [CrossRef]
  32. Pamučar, D.; Stević, Ž.; Sremac, S. A new model for determiningweight coefficients of criteria in MCDM models: Full consistency method (FUCOM). Symmetry 2018, 10, 393. [Google Scholar] [CrossRef]
  33. Pratt, V. Direct least-squares fitting of algebraic surfaces. ACM SIGGRAPH Comput. Graph. 2005, 21, 145–152. [Google Scholar] [CrossRef]
Figure 1. Function modules of the resistance spot welding (RSW) quality vision-estimation system.
Symmetry 11 00990 g001
Figure 2. (a) Schematic diagram model; (b) The 3D model and the experimental platform for RSW quality vision-estimation system.
Symmetry 11 00990 g002
Figure 3. The System’s Software Interface.
Symmetry 11 00990 g003
Figure 4. Grey image of a weld nugget.
Symmetry 11 00990 g004
Figure 5. Proposed detection method diagram.
Symmetry 11 00990 g005
Figure 6. Segmentation operation.
Symmetry 11 00990 g006
Figure 7. Fitting and hitting of a binary image with structuring vertical and horizontal elements.
Symmetry 11 00990 g007
Figure 8. Dilatation morphological operations.
Symmetry 11 00990 g008
Figure 9. Flood-fill operation.
Symmetry 11 00990 g009
Figure 10. Flood-fill operation, borders clearance and smoothing of the image.
Symmetry 11 00990 g010
Figure 11. The outlined contours of the segmented areas of the weld nugget.
Symmetry 11 00990 g011
Figure 12. Pixels of outer contour and inner contour.
Symmetry 11 00990 g012
Figure 13. (a) Least-squares fitting curve; (b) Results of the center coordinates and radius of the outer contour.
Symmetry 11 00990 g013
Figure 14. Improve the calculation of the inner contour.
Symmetry 11 00990 g014
Figure 15. Weld nugget’s zones.
Symmetry 11 00990 g015
Figure 16. Inner zone.
Symmetry 11 00990 g016
Figure 17. Ring zone.
Symmetry 11 00990 g017
Figure 18. Separated white peaks regions in the inner zone.
Symmetry 11 00990 g018
Figure 19. 3D model of the weld nugget.
Symmetry 11 00990 g019
Figure 20. The resistance spot welding quality estimation process.
Symmetry 11 00990 g020
Figure 21.DeltaX” input (the samples and member functions defining).
Symmetry 11 00990 g021
Figure 22. Fuzzy output function (the quality).
Symmetry 11 00990 g022
Figure 23. Fuzzy system structure: 11 inputs, 1 outputs, 46 rules.
Symmetry 11 00990 g023
Figure 24. The coordinates system of the end effector of the robotic arm.
Symmetry 11 00990 g024
Figure 25. Experiments for location detection of the weld nuggets.
Symmetry 11 00990 g025
Figure 26. The robotic arm motion control system interface.
Symmetry 11 00990 g026
Figure 27. Detection of the deformed metal failure.
Symmetry 11 00990 g027
Table 1. Experiment results.
Weld No.InputWeld Nugget Features ExtractionsOutput
Gray ImageContours Detection(xo,yo)Segmented Areas(M,T,N)
M = Max
T = Total
N = Number
3D Model and Digital Image of the SurfaceQuality
(dxo,dyo)
(xi,yi)
(dxi,dyi)
(ro,ri)
1 Symmetry 11 00990 i001 Symmetry 11 00990 i002(84,80)Inner white(1035,2068,4) Symmetry 11 00990 i003 Symmetry 11 00990 i0045.3
(4,0)Inner black(10,11,2)
(85,81)Ring white(142,367,8)
(5,1)Ring black(3,3,1)
(51,40)Side expulsions(60,66,2)
2 Symmetry 11 00990 i005 Symmetry 11 00990 i006(86,81)Inner white(3502,3503,2) Symmetry 11 00990 i007 Symmetry 11 00990 i0088.7
(6,1)Inner black(0,0,0)
(84,80)Ring white(479,490,2)
(4,0)Ring black(0,0,0)
(51,40)Side expulsions(0,0,0)
3 Symmetry 11 00990 i009 Symmetry 11 00990 i010(83,85)Inner white(1766,1766,1) Symmetry 11 00990 i011 Symmetry 11 00990 i0128
(3,5)Inner black(0,0,0)
(81,85)Ring white(218,316,5)
(1,5)Ring black(4,4,1)
(51,39)Side expulsions(5,6,2)
4 Symmetry 11 00990 i013 Symmetry 11 00990 i014(81,80)Inner white(1864,1864,1) Symmetry 11 00990 i015 Symmetry 11 00990 i0168.2
(1,0)Inner black(0,0,0)
(81,81)Ring white(357,434,2)
(1,1)Ring black(6,15,6)
(52,40)Side expulsions(4,4,1)
5 Symmetry 11 00990 i017 Symmetry 11 00990 i018(81,85)Inner white(1407,1595,5) Symmetry 11 00990 i019 Symmetry 11 00990 i0208.3
(1,5)Inner black(11,11,1)
(84,85)Ring white(3,3,1)
(4,5)Ring black(0,0,0)
(51,42)Side expulsions(0,0,0)
6 Symmetry 11 00990 i021 Symmetry 11 00990 i022(84,86)Inner white(1396,1415,3) Symmetry 11 00990 i023 Symmetry 11 00990 i0245
(4,6)Inner black(0,0,0)
(85,85)Ring white(645,735,3)
(5,5)Ring black(0,0,0)
(47,34)Side expulsions(0,0,0)
7 Symmetry 11 00990 i025 Symmetry 11 00990 i026(77,86)Inner white(1273,1294,5) Symmetry 11 00990 i027 Symmetry 11 00990 i0285
(−3,6)Inner black(265,402,17)
(76,84)Ring white(447,457,4)
(−4,4)Ring black(27,97,22)
(48,35)Side expulsions(24,34,6)
8 Symmetry 11 00990 i029 Symmetry 11 00990 i030(80,86)Inner white(1049,1793,4) Symmetry 11 00990 i031 Symmetry 11 00990 i0324
(0,6)Inner black(77,237,18)
(80,86)Ring white(278,396,9)
(0,6)Ring black(65,132,12)
(54,42)Side expulsions(17,42,8)