Review

Diamond B23 CD Imaging of Thin Films of Chiral Materials or Achiral Polymers Coated with Chiral Molecules

by
Rohanah Hussain
1,*,
Tamás Jávorfi
1,
Charlotte S Hughes
1,
Harini Sriram
2,
Rajamani Lashminarayanan
2 and
Giuliano Siligardi
1,*
1
Diamond Light Source Ltd., Diamond House, Harwell Science & Innovation Campus Didcot, Oxfordshire OX11 0DE, UK
2
Anti-Infectives Research Group, Singapore Eye Research Institute, Singapore 168751, Singapore
*
Authors to whom correspondence should be addressed.
Symmetry 2020, 12(11), 1847; https://doi.org/10.3390/sym12111847
Submission received: 29 September 2020 / Revised: 3 November 2020 / Accepted: 4 November 2020 / Published: 9 November 2020
(This article belongs to the Special Issue Symmetric and Asymmetric Structure in Drug Design and Biomolecules)

Abstract

:
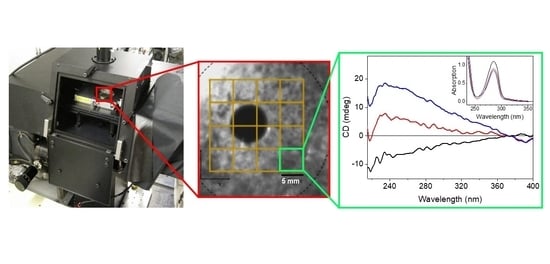
The novel vertical sample chamber, developed at the B23 beamline for synchrotron radiation circular dichroism (SRCD), has enabled the Diamond User community to conduct different types of experiments from high throughput CD of protein and DNA folding using 96-well multiplates to CD imaging at high spatial resolution. Here, we present the application of CD imaging to large areas of achiral polymer PVA films doped with D-dopa to assess the chiral homogeneity of the film preparation with potential antimicrobial property. Synopsis: CDi application of Diamond B23 SRCD beamline.

Graphical Abstract

Introduction

Beamline B23 at Diamond Light Source Ltd., UK, is a bending magnet beamline dedicated to circular dichroism to study, in particular, the structure and function of biological macromolecules [1,2]. The beamline can deliver in excess of 1 × 10¹² photons/s/0.1% bw(bandwidth) at 6.2 eV (200 nm), with Diamond operating at 300 mA ring current into a focal spot size in the order of 0.5 mm2 (Figure 1A) to either of two independent end stations (Modules A and B), which together span the 125–650 nm wavelength range. The two end station modules have been fully operational since 2010 [3,4,5,6,7].
A special sample chamber has been developed and used since 2015 with the B23 SRCD beamline to accept 96-well sample plates in order to speed up, automate and analyse the collection of spectral information from a large number of samples [8,9,10,11]. The chamber includes a motorised sample stage that enables the positioning of the object of interest, from cuvette cells to 96-well multiplates to thin films held in the optical path, with high precision and repeatability (Figure 1B). The highly collimated nature of the micro beamlight produced by the B23 beamline [3,4,5,6,7] enables the incident light to pass through the double grating subtractive monochromator, the linear polariser, the photoelastic modulator (PEM), the 10× objective lens, and the sample, reaching the photomultiplier tube (PMT) detector (Figure 1A).
This set-up has also been used for a large variety of experiments where the precise positioning of the horizontal arrangement of the samples is a crucial factor in order to achieve the highest precision and repeatability of spatially resolved SRCD measurements of thin films in the field of material science [12,13].
The beamlight spot size, measured with beamage at the sample position, with and without the 10× UV objective lens, is illustrated in Figure 1A. The main elements of the vertical chamber, such as the 45° MgF2-coated Al plane mirror, the focusing lens, the linear polariser Rochon prism, the photoelastic modulator (PEM), the Iris aperture that can hold the 10× objective lens, the sample held on the XY motorised stage, and the photomultiplier tube (PMT) detector, are sketched in Figure 1B. The sample held on the XY motorised stage is controlled by the data acquisition software. All CD mapping was conducted by scanning SRCD spectra in a rastering manner by starting at the bottom left corner at the coordinates of the 1st row and 1st column of the chosen grid and moving the sample to the right for the chosen interval value until reaching the coordinate of the 1st row and last column. This process was repeated for the 2nd row and so forth.
To assess the limitation of the technique, the CD mapping of a spinach leaf was attempted (Figure 1C). The epidermis of a spinach leaf was removed, and the remaining leaf was sandwiched between two fused silica plates of a demountable cell and positioned in the XY stage sample holder. The mapping was conducted on a grid area, defined by the number of columns (X) and rows (Y). In this example, each square of the grid had an area of 0.5 × 0.5 mm = 0.025 mm2. With the chosen X,Y coordinates of the starting point, the mapping of the leaf followed the defined grid of 8 × 5 at 0.5 mm intervals, corresponding to a total area of 4 × 2.5 = 10 mm2. Variations in intensity can be accounted for by uneven sample thickness (equivalent to the cell path length for solution measurements) at different positions, whereas spectral changes reflect on the differences in the underlying macrostructure of the leaf as well as possible birefringence contributions. The 2D contour colour map of the CD intensity at 420 nm of the grid was shifted from the spinach epidermis layer for clarity. This 2D map was generated by plotting the CD values at 420 nm of the grid from the CD spectra measured from 400–550 nm (Figure 1C).
This CD mapping indicated that apart from the possible birefrinfgence contributions and providing the absorbance was within the 0.5–1.5 range and that light scattering was not dominant, which would create artifacts, the data of repeated consecutive measurements were reproducible.
The highly collimated micro beamlight of B23 allows the mapping of thin-film samples by SRCD to assess the homogeneity/heterogeneity of the chiral sample supramolecular structure [12,13,14,15,16]. This is illustrated in Figure 1D, where the CD mapping, also analysed in terms of similarity, revealed an heterogenous supramolecular structure of the spin-coating sample preparation.
The use of the B23 CD Imaging method with the vertical chamber (Figure 1B), following the protocols described in Figure 1C,D, can be applied for quality control to assess the homogeneity of the supramolecular structure of any thin film of chiral materials.
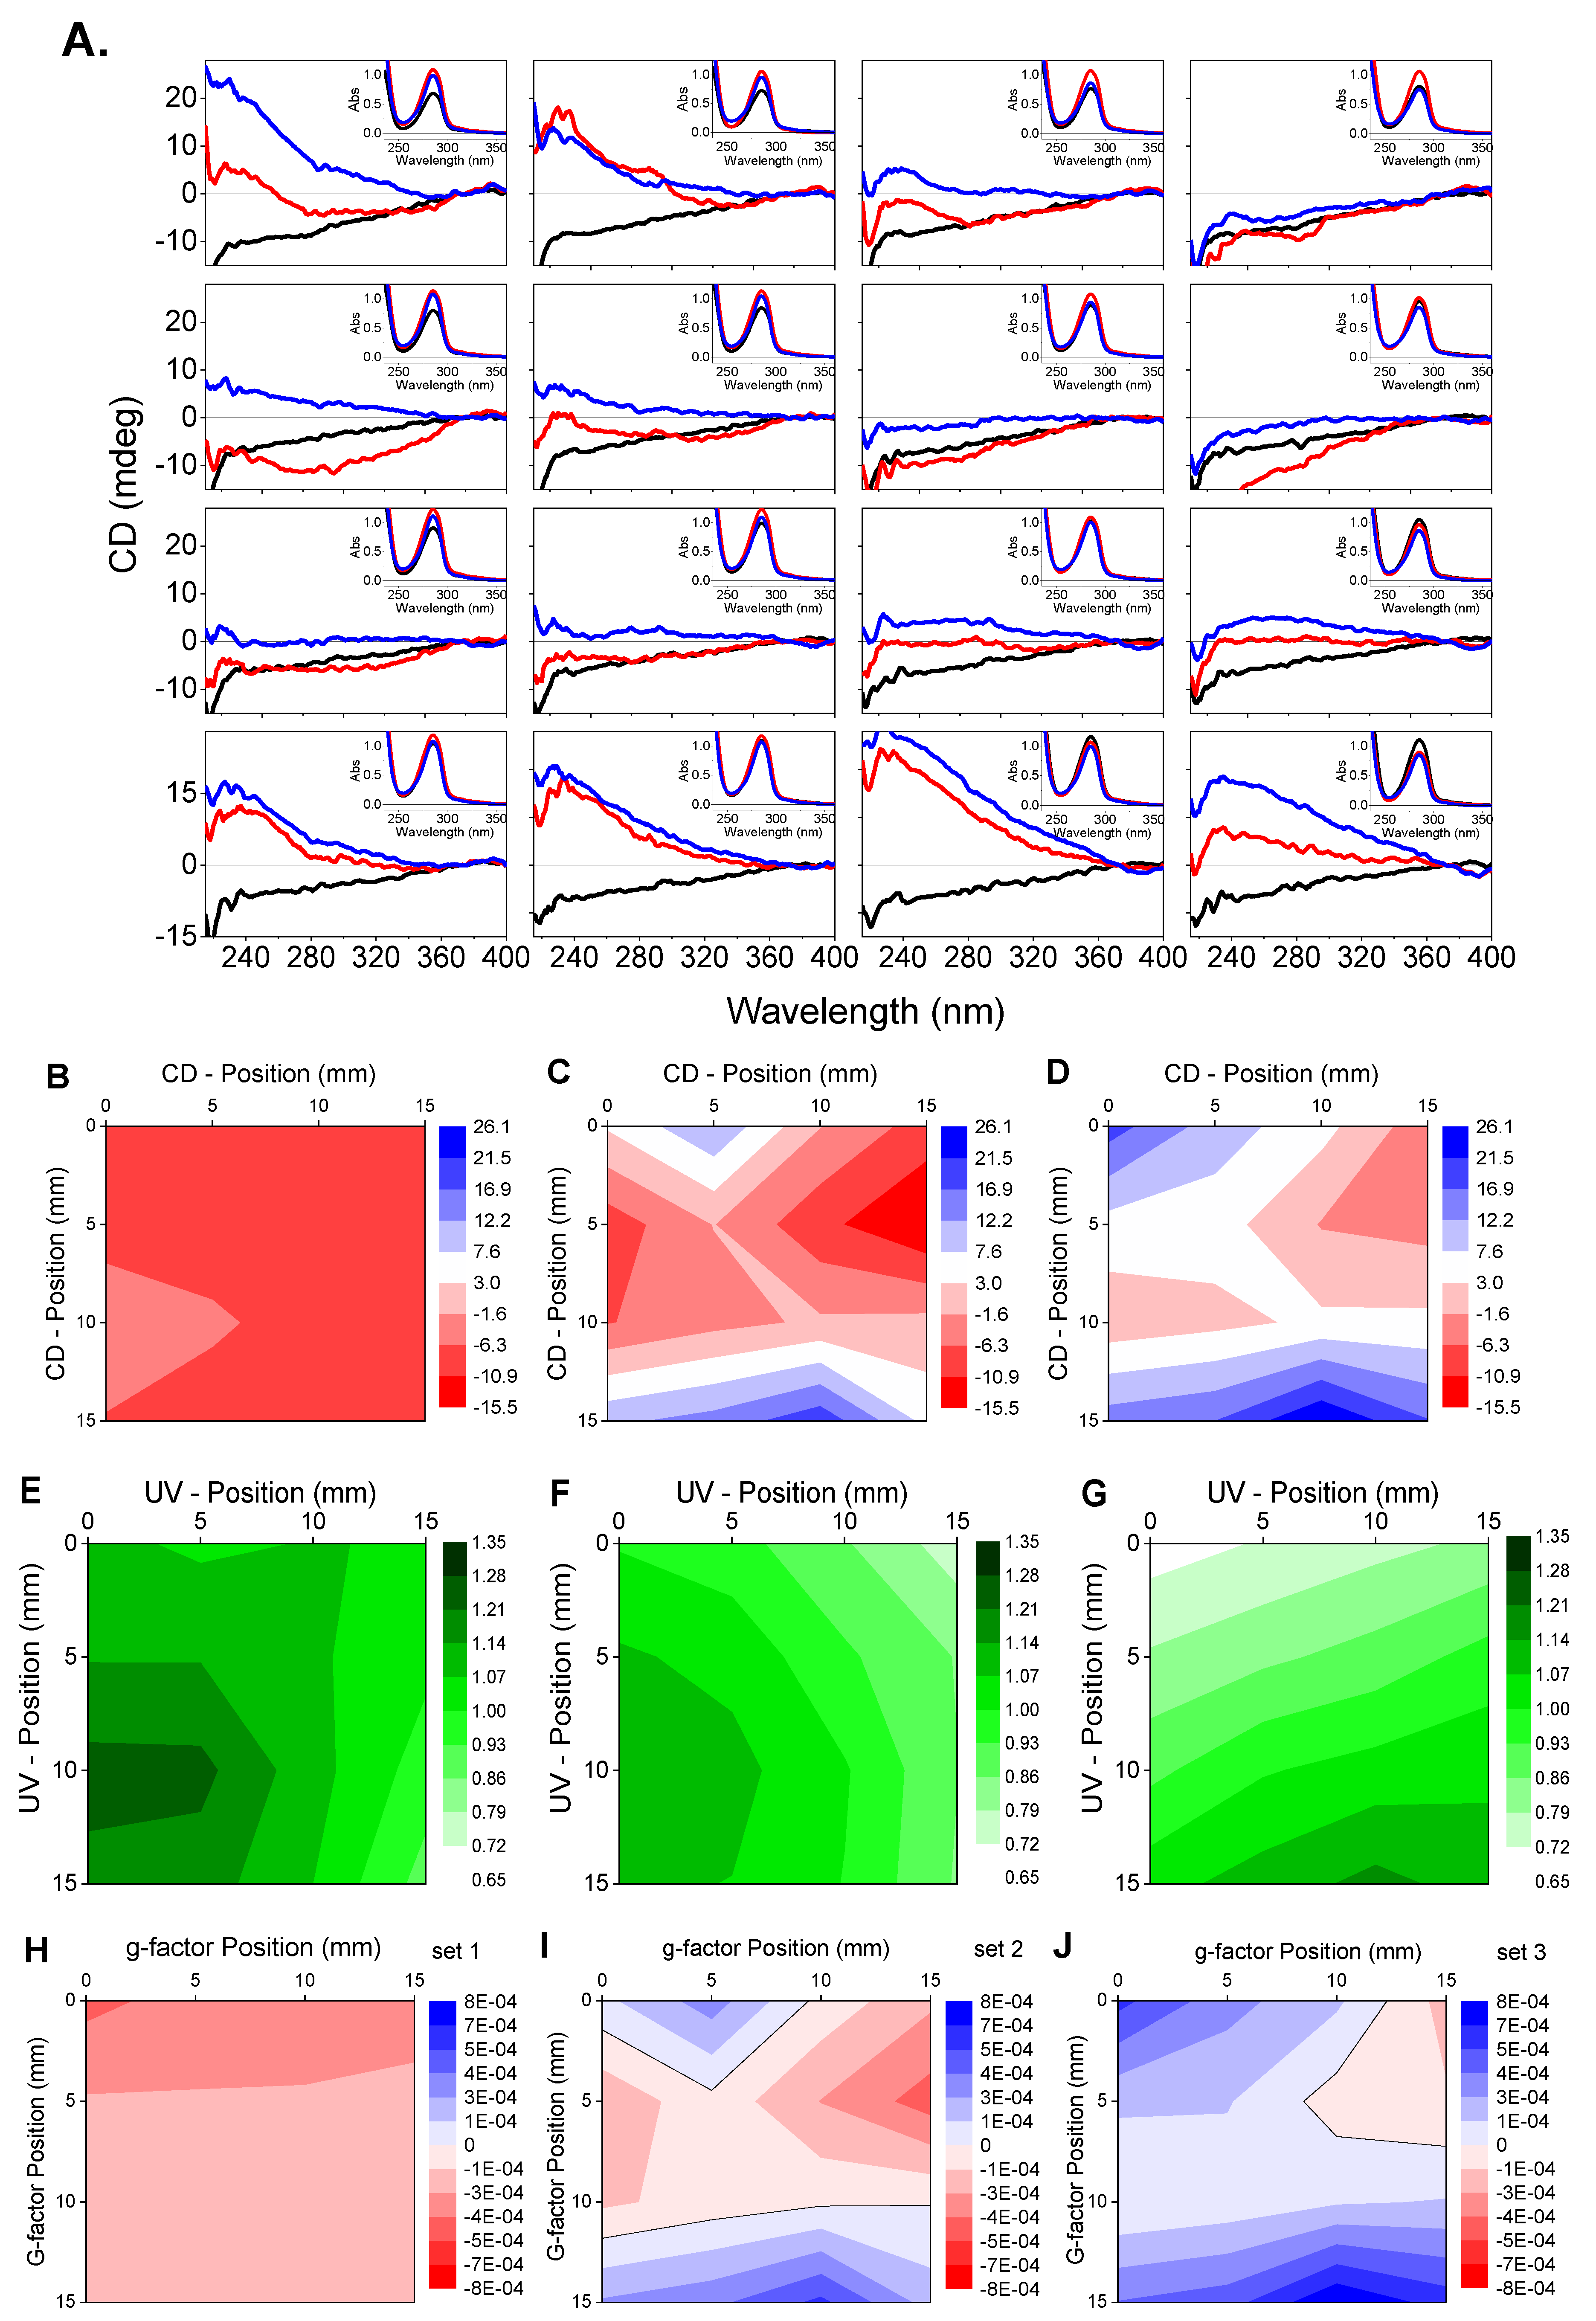
This is illustrated in Figure 2 for the assessment of the homogeneity of chiral catecholamine D-dopa when coated on the surface of achiral polyvinyl alcohol (PVA), with potential antimicrobial property (Dhand et al., 2016) [17] for contact lenses and food packaging. Comparison with L-dopa is shown in Supplementary Materials with majority of the CD spectra of 1% L-dopa in PVA were of positive sign that is the opposite for the majority of those of D-dopa, as expected. The linear dichroism (LD), linear birefringence (LB) and circular birefringence (CB) contributions to CD should be discriminated using the Mueller Matrix Polarimeter (MMP) instrument [18]. Another method to measure CD devoids of the other polarisations can be achieved with the partially modulated polarisation (PMP) method [19]. However, these methods could not be used for these D-dopa–PVA thin films for two main reasons: the overall signals were smaller than the detection limit and the far-UV wavelength range not accessible in the current methods of both MMP and PNP.
The CD and UV imaging of PVA film coated with 1% (w/v) D-dopa, conducted in triplicates (labelled Set 1, 2 and 3), showed Set 1 to be more homogeneous than the other two sets (Figure 2B–J). The 2D CD map of Set 1 showed that the D-dopa CD signal was fairly uniform throughout the investigated 15 mm2 surface area (Figure 2B–G). This was not the case for Set 2 and Set 3 films, where heterogeneous 2D CD maps showed some areas of opposite CD signs, from negative (red) to positive (blue), despite maintaining a similar concentration of D-dopa from the UV absorption intensity at about 280 nm (Figure 2A). The more likely explanation is that Set 2 and Set 3 also adopted different D-dopa conformations than that observed in Set 1, showing the positive CD being clustered in several areas of the investigated film surface, as revealed by the 2D CD imaging (CDi) maps (Figure 2C,D) and further supported by g-factor map analysis. This is shown in Figure 2H–J, where D-dopa, being concentration-independent, showed the presence of conformational and/or configurational changes for Set 2 and Set 3 as the result of the laccase action in preparing the films [16,20]. The g-factor, also known as dissymmetry factor [21], is the ratio between the CD reported DA unit (mdeg/32980) over the absorption (g = A/A = ε/ε = 4 R/D = 4 |m| |μ| cos θ), where A AL AR is the differential absorbance of left circularly polarised light (cpl) minus the absorption of right cpl ε = (εL − εR), ε = molar extinction coefficient, R = rotational strength, D = dipole strength, m and μ are magnetic and electric dipole transition moments, respectively, and θ is the angle between m and μ). As a good approximation, if light scattering is negligible, the g-factor is independent of concentration, which for thin films is independent of thickness.
There is another important piece of information from the g-factor magnitude that can help identify the amount of magnetic dipole character of the electronic transitions of the chiral molecule [22]:
  • g > 10−2, the transition is magnetically allowed and electrically forbidden;
  • g ≈ 10−2, the transition is both electrically and magnetically allowed;
  • g < 10−2, the transition is electrically allowed and magnetically forbidden.
For the specimens studied in Figure 2H–J, the g-factor range of 10−4 of the mapped 4 × 4 grids at 5 mm intervals was consistent with both forbidden magnetic dipole transition moment m and electric dipole transition moment µ [20]. For Sets 2 and 3, the fact that the 2D g-factor maps showed both positive and negative values is indicative of the presence of isomers of opposite conformations and/or configurations. Figure 3 illustrates the mirror-imaged CD spectra of the Dopa enantiomers measured at the same concentration, showing a positive band for L-dopa and a negative one for D-dopa at about 280 nm.
The CDi data of Figure 2B–J indicate that an investigation of the protocol used to prepare the PVA-coated films with D-dopa must be carried out to identify the critical step/s in need of optimisation in order to achieve a reproducible and homogeneous PVA film coated with chiral D-dopa, which is the sine qua non for any commercial application.
In summary, the use of the B23 highly collimated microbeam has been successfully applied to characterise thin films of chiral materials, as well as achiral polymers coated with chiral molecules, to assess their uniformity and conformational/supramolecular structure homogeneity. B23 CD Imaging is the best method to characterise the homogeneity of the chiroptical properties of materials, which is strictly related to their function and activity.

Supplementary Materials

The following are available online at https://www.mdpi.com/2073-8994/12/11/1847/s1, Figure S1: SRCD spectra of 1% D-Dopa in PVA (left) and 1% L-Dopa in PVA (right) for Set 1 (black), Set 2 (red), and Set 3 (blue) films measured on 3x3 grids at 5 mm intervals resulting in two 9 SRCD spectral figures.

Author Contributions

R.H. and R.L. conceived the idea. H.S. prepared the samples. R.H., C.S.H., T.J. and G.S. conducted the experiments and analysis, R.H. and G.S. wrote the manuscript. All authors have read and agreed to the published version of the manuscript.

Funding

This research received no extra funding.

Acknowledgments

The authors would like to thank Diamond Light Source Ltd. for funding this research, specifically related to beamtime allocation SM8893, SM14842, and SM13518 on B23 beamline.

Conflicts of Interest

The authors declare there is no conflict of interest.

References

  1. Berova, N.; Nakanishi, K.; Woody, R.W. Circular Dichroism Principles and Applications, 2nd ed.; Wiley-VCH: New York, NY, USA, 2000. [Google Scholar]
  2. Fasman, G.D. Circular Dichroism and Conformational Analysis of Biomolecules; Plenum Press: New York, NY, USA, 1996. [Google Scholar]
  3. Hussain, R.; Krumpa, N.; Strachan, J.; Clarke, D.; Wagner, U.; Macdonald, B.; Reading, D.; Cobb, T.; Gillingham, I.; Price, A.; et al. Design of B23 circular dichroism beamline at Diamond Light Source. Adv. Synchrotron Radiat. 2008, 1, 265–270. [Google Scholar] [CrossRef]
  4. Jávorfi, T.; Hussain, R.; Myatt, D.; Siligardi, G. Measuring circular dichroism in a capillary cell using the B23 synchrotron radiation CD beamline at diamond light source. Chirality 2010, 22 (Suppl. 1), E149–E153. [Google Scholar] [CrossRef] [PubMed]
  5. Siligardi, G.; Hussain, R.; Myatt, D.; Jávorfi, T. Diam. Light Source Proc. 2010, 1, e104. [Google Scholar] [CrossRef]
  6. Hussain, R.; Javorfi, T.; Siligardi, G. Circular dichroism beamline B23 at the Diamond Light Source. J. Synchrotron Radiat. 2012, 19, 132–135. [Google Scholar] [CrossRef] [PubMed]
  7. Hussain, R.; Jávorfi, T.; Siligardi, G. Spectroscopic Analysis: Synchrotron Radiation Circular Dichroism. Compr. Chiral. 2012, 8, 438–448. [Google Scholar]
  8. Hussain, R.; Siligardi, G. Characterisation of Conformational and Ligand Binding Properties of Membrane Proteins Using Synchrotron Radiation Circular Dichroism (SRCD). In The Next Generation in Membrane Protein Structure Determination, Advances in Experimental Medicine and Biology; Moraes, I., Ed.; Springer: Cham, Switzerland, 2016; Volume 922, pp. 43–60. [Google Scholar]
  9. Hussain, R.; Jávorfi, T.; Rudd, T.; Siligardi, G. High-throughput SRCD using multi-well plates and its applications. Sci. Rep. 2016, 6, 1–6. [Google Scholar] [CrossRef] [PubMed] [Green Version]
  10. Siligardi, G.; Hussain, R. CD Spectroscopy, An Essential Tool for Quality Control of Protein Folding. Meth. Molec. Biol. 2015, 1261, 255–276. [Google Scholar]
  11. Hussain, R.; Benning, K.; Myatt, D.; Javorfi, T.; Longo, E.; Rudd, T.R.; Pulford, B.; Siligardi, G. CDApps: Integrated software for experimental planning and data processing at beamline B23, Diamond Light Source. J. Synchrotron Radiat. 2015, 22, 465–468. [Google Scholar] [CrossRef] [PubMed] [Green Version]
  12. Borisenko, K.B.; Shanmugam, J.; Williams, B.A.; Ewart, P.; Gholipour, B.; Hewak, D.W.; Hussain, R.; Jávorfi, T.; Siligardi, G.; Kirkland, A.I. Photo-induced optical activity in phase-change memory materials. Sci. Rep. 2015, 5, 1–5. [Google Scholar] [CrossRef] [PubMed] [Green Version]
  13. Zinna, F.; Resta, C.; Gorecki, M.; Pescitelli, G.; di Bari, L.; Javorfi, T.; Hussain, R.; Siligardi, G. Circular Dichroism Imaging: Mapping the Local Supramolecular Order in Thin Films of Chiral Functional Polymers. Macromolecules 2017, 50, 2054–2060. [Google Scholar] [CrossRef]
  14. Cseh, L.; Mang, X.; Zeng, X.; Liu, F.; Mehl, G.H.; Ungar, G.; Siligardi, G. Helically Twisted Chiral Arrays of Gold Nanoparticles Coated with a Cholesterol Mesogen. J. Am. Chem. Soc. 2015, 137, 12736–12739. [Google Scholar] [CrossRef] [PubMed]
  15. Dressel, C.; Liu, F.; Prehm, M.; Zeng, X.; Ungar, G.; Tschierske, C. Dynamic mirror-symmetry breaking in biscontinuous cubic phases. Angew. Chem. Int. Ed. 2014, 53, 13115–13120. [Google Scholar] [CrossRef] [PubMed] [Green Version]
  16. Albano, G.; Górecki, M.; Pescitelli, G.; di Bari, L.; Jávorfi, T.; Hussain, R.; Siligardi, G. Electronic circular dichroism imaging (CDi) maps local aggregation modes in thin films of chiral oligothiophenes. New J. Chem. 2019, 43, 14584–14593. [Google Scholar] [CrossRef]
  17. Dhand, C.; Harini, S.; Venkatesh, M.; Dwivedi, N.; Ng, A.; Liu, S.; Verma, N.K.; Ramakrishna, S.; Beuerman, R.W.; Xian, J.L.; et al. Multifunctional Polyphenols- and Catecholamines-Based Self-Defensive Films for Health Care Applications. ACS Appl. Mater. Interfaces 2016, 8, 1220–1232. [Google Scholar] [CrossRef] [PubMed]
  18. Arteaga, O.; Freudenthal, J.; Wang, B.; Kahr, B. Mueller matrix polarimetry with four photoelastic modulators: Theory and calibration. Appl. Opt. 2012, 51, 6805–6817. [Google Scholar] [CrossRef] [PubMed]
  19. Szustakiewicz, P.; Kowalska, N.; Grzelak, D.; Narushima, T.; Gora, M.; Baginski, M.; Pociecha, D.; Okamoto, H.; Liz-Marzan, L.M.; Lewandowski, W. Supramolecular Chirality Synchronization in Thin Films of Plasmonic Nanocomposites. ACS Nano 2020. [Google Scholar] [CrossRef] [PubMed]
  20. Riva, S. Laccases, Blue Enzymes for Green Chemistry. Trends Biotechnol. 2006, 24, 219–226. [Google Scholar] [CrossRef] [PubMed]
  21. Kuhn, W.; Braun, E. Measurement of circular dichroism in the ultra-violet. Z. Physik. Chem. Abt. B 1930, 8, 445–454. [Google Scholar]
  22. Snatzke, G. Circular Dichrosim and Optical Rotatory Dispersion—Principles and Application to the Investigation of the Stereochemistry of Natural Products. Angew. Chem. Int. Ed. Engl. 1968, 7, 14–25. [Google Scholar] [CrossRef]
Figure 1. (A) The beamlight spot size at the sample was measured at 50% of the peak intensity along the vertical and horizontal lines passing through the hottest point of the map. (B) Module A end-station of B23 synchrotron radiation circular dichroism (SRCD) beamline. (C) A magnified image of a spinach leaf showing a grid of points (overlaid) where the SRCD spectra were measured. (D) Twenty-five SRCD spectra of the 5 × 5 grid, scanned at 1 mm intervals, and the 2D images of a thin film of poly(phenylene ethylene) derivative polymer in terms of SRCD intensity and similarity at 480 nm (redrawn from Zinna et al., 2016 [13]).
Symmetry 12 01847 g001
Figure 2. CD and UV imaging spectra for 3 sets of PVA film coated in 1% (w/v) of D-dopa. (A) CD with inserted UV spectra of each grid point of the 4 × 4 grid at 5 mm interval steps for Set 1 (black), Set 2 (red) and Set 3 (blue), respectively. Two-dimensional (2D) maps of CD at 285 nm for (B) Set 1, (C) Set 2 and (D) Set 3; UV for (E) Set 1, (F) Set 2 and (G) Set 3; g-factor for (H) set 1, (I) Set 2 and (J) Set 3.
Symmetry 12 01847 g002
Figure 3. (A), CD and (B), UV absorbance spectra of 0.5% D- and L-dopa aqueous solutions.
Symmetry 12 01847 g003
Publisher’s Note: MDPI stays neutral with regard to jurisdictional claims in published maps and institutional affiliations.