Article

An Enhancement in Cancer Classification Accuracy Using a Two-Step Feature Selection Method Based on Artificial Neural Networks with 15 Neurons

by
Md Akizur Rahman
* and
Ravie Chandren Muniyandi
Research Center for Cyber Security, Faculty of Information Science and Technology, Universiti Kebangsaan Malaysia, 43600 UKM Bangi, Selangor, Malaysia
*
Author to whom correspondence should be addressed.
Symmetry 2020, 12(2), 271; https://doi.org/10.3390/sym12020271
Submission received: 6 January 2020 / Revised: 24 January 2020 / Accepted: 4 February 2020 / Published: 10 February 2020

Abstract

:
An artificial neural network (ANN) is a tool that can be utilized to recognize cancer effectively. Nowadays, the risk of cancer is increasing dramatically all over the world. Detecting cancer is very difficult due to a lack of data. Proper data are essential for detecting cancer accurately. Cancer classification has been carried out by many researchers, but there is still a need to improve classification accuracy. For this purpose, in this research, a two-step feature selection (FS) technique with a 15-neuron neural network (NN), which classifies cancer with high accuracy, is proposed. The FS method is utilized to reduce feature attributes, and the 15-neuron network is utilized to classify the cancer. This research utilized the benchmark Wisconsin Diagnostic Breast Cancer (WDBC) dataset to compare the proposed method with other existing techniques, showing a significant improvement of up to 99.4% in classification accuracy. The results produced in this research are more promising and significant than those in existing papers.

1. Introduction

An artificial neural network (ANN) is a powerful but relatively crude classification tool, based on the neural structure of the human brain, that has had a profound impact on the many recent advancements in scientific and engineering research. They can be distinguished from conventional mathematics-based time-series models through their ability to learn complex nonlinear relationships between input-output patterns, learn sequential training paradigms, and make adaptations to the training dataset. The most widely used species of ANNs for classification problems are the feed-forward-based architectures comprising multi-layer perceptrons (MLP), radial-basis function (RBF) networks, and self-organizing maps (SOMs). SOMs were previously used for feature mapping and data clustering only. Nowadays, researchers from other fields have been interested in using ANNs to solve other problems such as bioinformatics data classification and medical diagnosis and prognosis. ANNs have some promising benefits, including nonlinearity, insensitivity to noise, high parallelism, learning, adaptability, and generalization. The basic building blocks of ANNs are the mathematically modeled artificial neurons proposed by McCulloch and Pitt in 1943 [
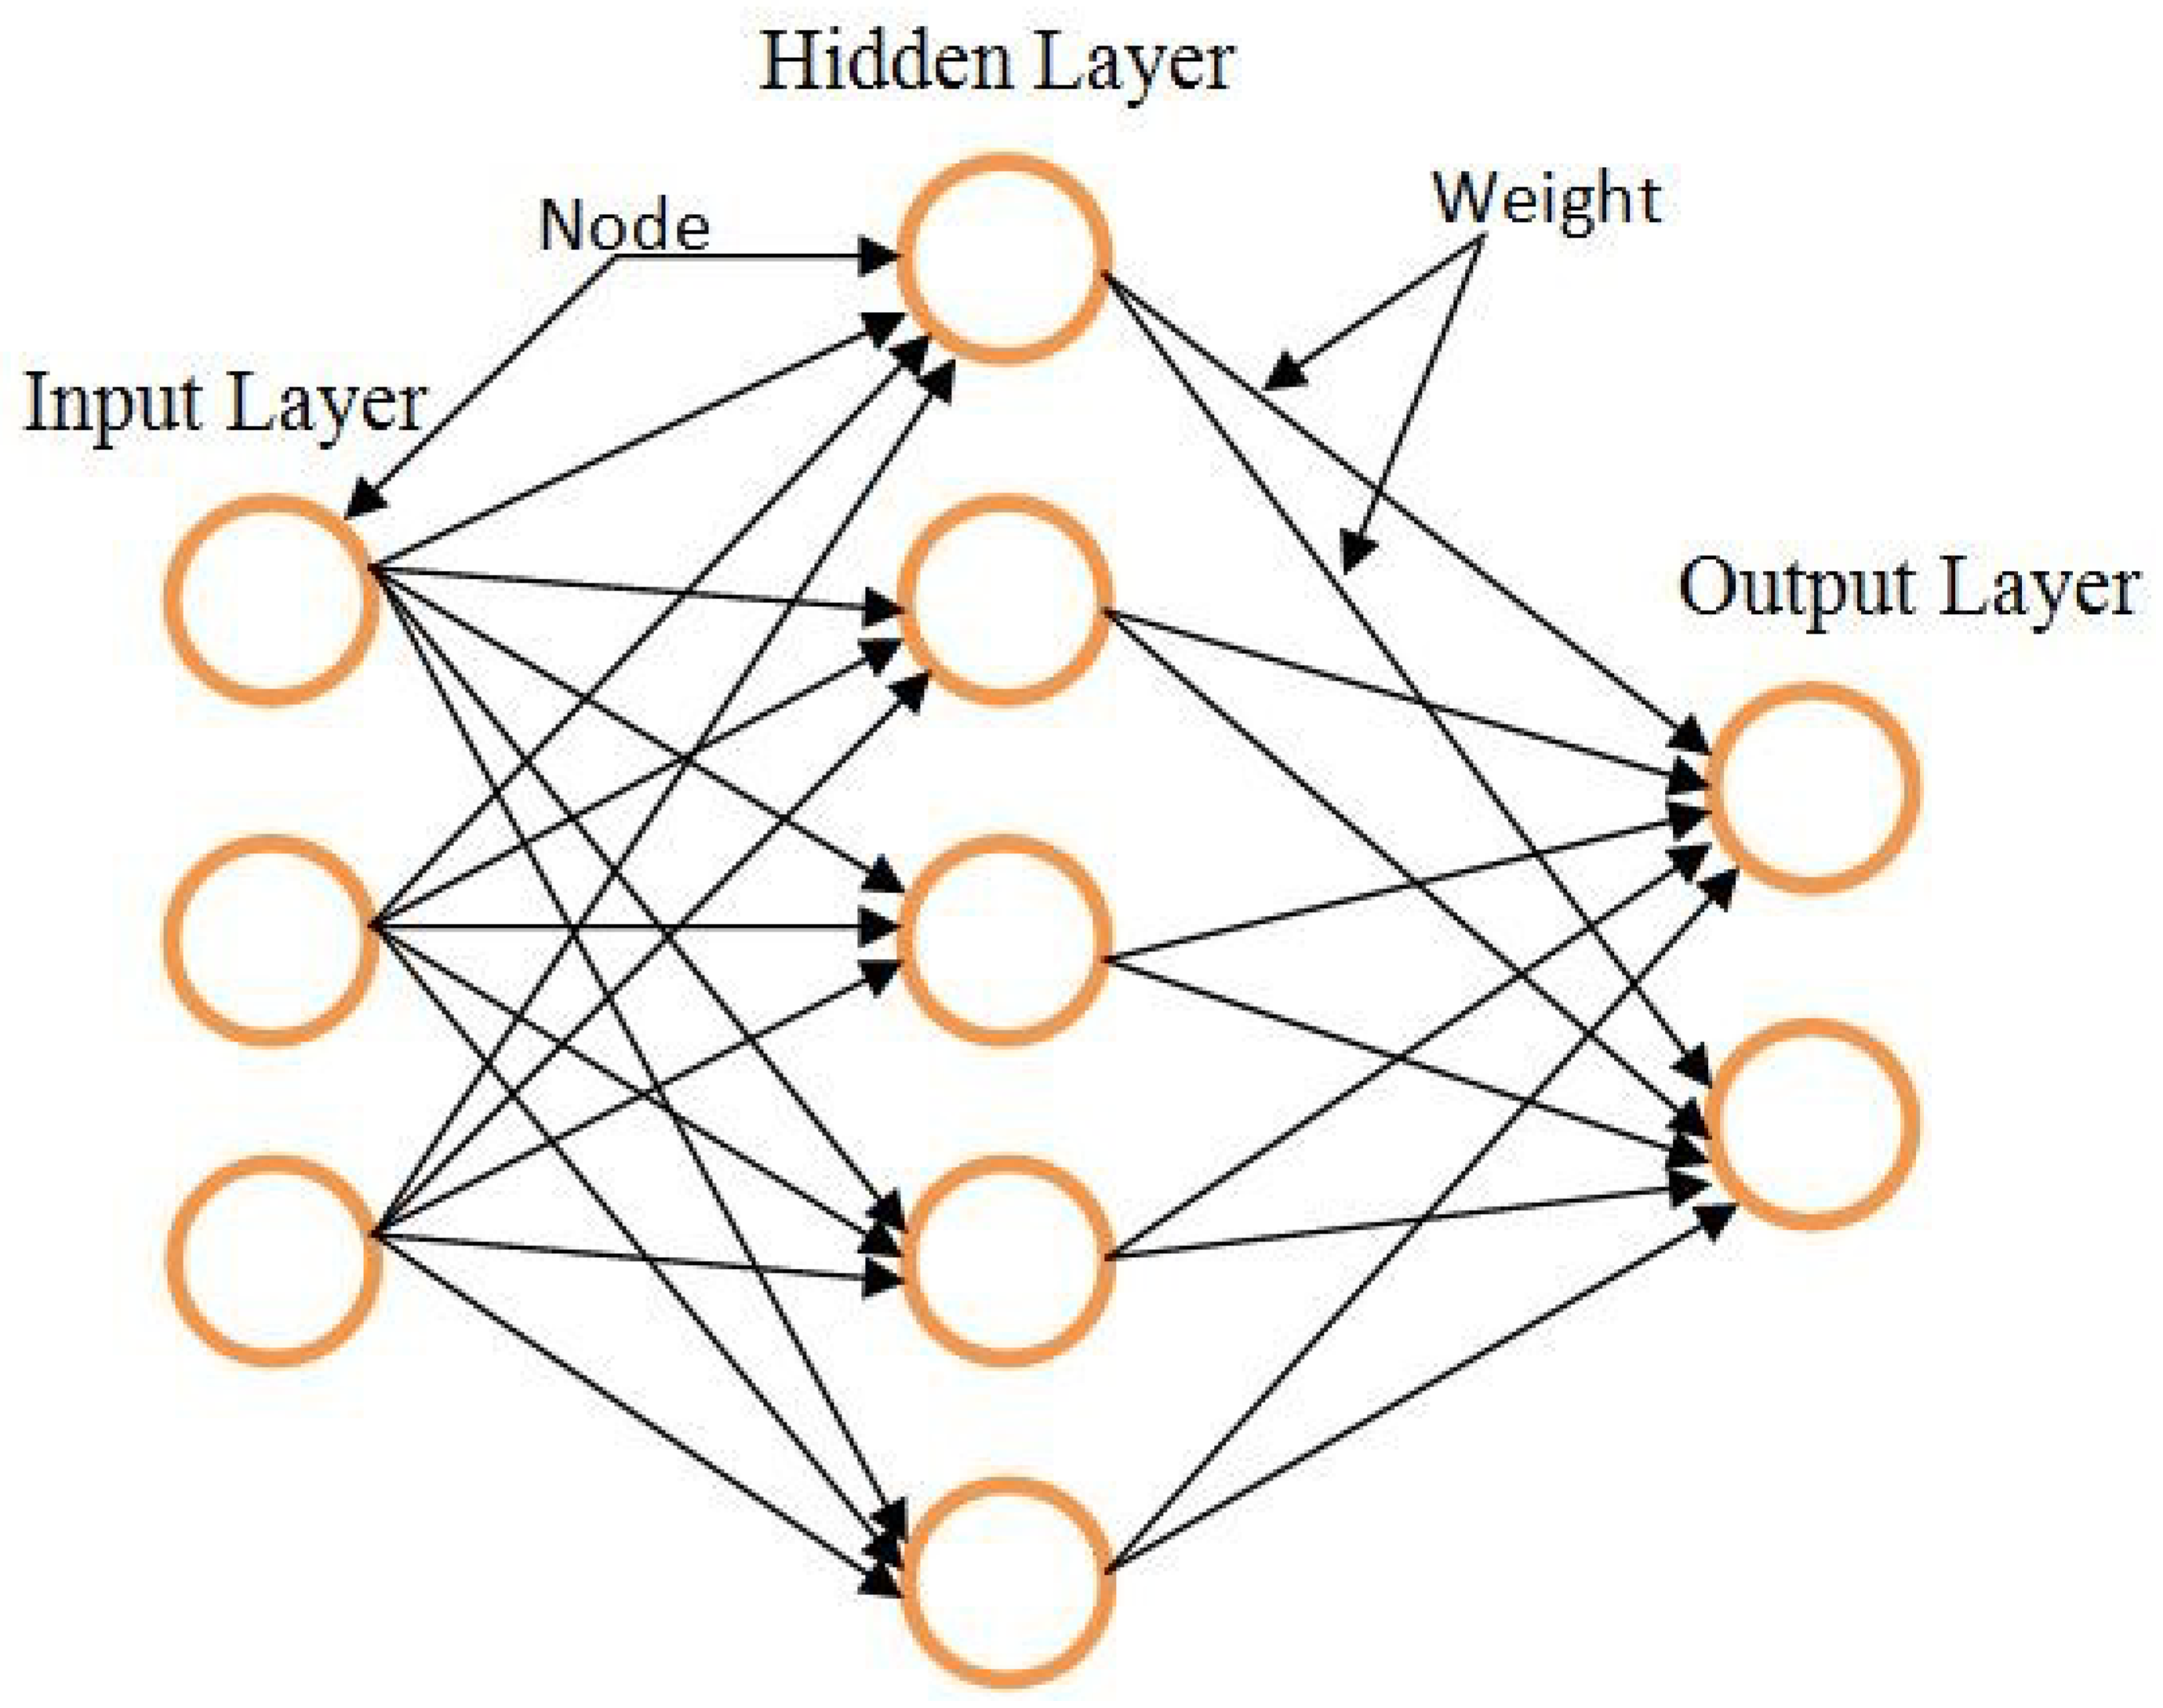
1]. By simple definition, an ANN consists of processing elements called neurons, which are interrelated and work together to respond to a specific problem. Neural networks (NNs) can be utilized in situations where trends and patterns are too difficult for human or other computer techniques to identify and interpret, as they have an exceptional ability to extract meaning from imprecise or complicated problems. They are constructed for many real-world applications such as pattern recognition and data mining through training and learning processes. Due to their parallel-processing capability, ANNs are suitable enough for real-time classification problems.
Feature selection (FS) has become the focus of many recent studies, particularly in bioinformatics, where it has numerous applications. Machine learning (ML) is a powerful tool that can select the most relevant features from datasets, but not all ML algorithms perform equally in FS techniques. Nonetheless, several methods have been proposed in bioinformatics for FS. In a classification problem, FS remains the most imperative task. It is a technique that can enhance classification accuracy. The three types of FS techniques—the filter technique, the wrapper technique, and the embedded techniques—are organized in view of classification based on how they combine the search for FS with the creation of the classification model [2].
The filter and wrapper approaches are the two primary approaches that researchers utilize to tackle this problem. The important difference between the filter and wrapper approaches is their use of univariate and multivariate analyses, respectively. The filter approach performs FS as a preprocessing stage before the use of a classification algorithm [3]. Studies of the feature reduction of microarray data most commonly use this approach [4]. A commonly used test for statistics in microarray studies is the t-test, which is used to isolate significantly differentially expressed genes.
The wrapper approach is any method that incorporates a classifier to select relevant features in a group [3]. This approach, while generally more accurate than the filter approach, comes at a computational cost [4]. The wrapper approach relies on many evaluations of the data, while the filter approach uses a single evaluation.
The quest for an optimal subset of features is integrated into the classifier in the embedded approaches and possibly seen as a search in the combined space of the subsets and hypotheses of the features. The embedded approaches are specific to an assumed learning algorithm, like wrapper approaches. Embedded approaches have many advantages, including communication with the classification model, and are less computationally intensive than wrapping approaches [5].
Cancer classification is a machine-learning-based data mining method that is utilized to categorize the elements of a dataset into predefined classes or groups [6,7]. In the field of medicine, classification has been extended to numerous theoretical and practical applications, including breast cancer, colon cancer, heart disease, liver disease, ovarian cancer, prostate cancer, and so on. Many medical researchers have intensified efforts to improve classification in order to obtain better outcomes when diagnosing or detecting associated diseases. Classification challenges are multifaceted because of the difficulties in collecting data and testing the classification methods. Data cleaning, the elimination of irrelevant attributes, and detailed sensitivity and specificity classification are amongst these challenges.
This paper is structured as follows: Section 2 introduces related works, while Section 3 details ANNs, best-first search, FS, the Taguchi method, cancer classification, and the dataset. Section 4 discusses the ANN classifier performance evaluation criteria. Section 5 and “Breast Cancer with FS” present the experimental results and a discussion. Section 6 concludes the study and provides directions for future research.

2. Related Work

FS methods have become essential in various classification problems. These problems are characterized by a dataset with many features. There are a few features within such a collection of features that contain relevant information, with most of the features being either irrelevant or of low relevancy. Usually, the highly informative features are used to construct a classification model while disregarding the non-informative ones. By decreasing the number of features that are ultimately utilized for classification, there can be an enhancement in the performance of the algorithm [3,8,9,10,11].
Various pattern recognition methods were not initially designed to handle a great deal of inappropriate features; hence, they have been combined with FS techniques [12,13,14]. FS has a number of objectives; the topmost include (a) the avoidance of overfitting and improvement of model performance, i.e., prediction performance for supervised classification and well-cluster detection for clustering, (b) the provision of efficient and economical models, and (c) an increase in information around the processes of the data that are generated. However, the benefits of FS methods can become expensive, as the search for an optimal subset of relevant features in the modeling task can become more complex. The optimal model parameters for the optimized feature subset must be sought rather than simply optimizing the model parameters for the entire feature subset. This should be done since one cannot guarantee equality between the full feature set and the optimal feature subset [15]. This results in the production of the optimal subset of appropriate features. In the model selection, the FS methods vary depending on the additional space of feature subsets.
Banerjee et al. [16] utilized an evolutionary rough FS algorithm to classify datasets with three different cancer samples for the microarray gene expression. Nieto et al. [17] utilized a multi-objective genetic algorithm (MOGA) in microarray datasets for gene selection. This algorithm carries out gene selection from a sensitivity and specificity viewpoint. In this algorithm, the classification task is achieved with support vector machines (SVMs); in addition, the resulting subsets use a 10-fold cross-validation. Based on the Wisconsin Breast Cancer Database (WBCD), Hasan et al. [18] utilized an FS algorithm that utilized principal component analysis (PCA) and ANNs as classifiers and as the best tool to enhance the classification accuracy of benign or malignant tumors. Furthermore, there are three rules of thumb in PCA applications, namely, (i) the cumulative variance, (ii) the Kaiser–Guttman (KG), and (iii) the screen test rule, which were used for FS.
Rahideh et al. [19] presented a cancer classification technique utilizing clustering-based gene selection and an ANN. The researchers utilized three different clustering algorithms for selecting the most valuable genes. The three different algorithms were fuzzy C-means clustering, K-means clustering, and SOMs. An MLP NN trained with the Levenberg–Marquardt learning algorithm was used for cancer classification. Dora et al. [20] utilized a Gauss–Newton representation-based algorithm (GNRBA) and focused on optimal weight. They evaluated it with the Wisconsin Diagnostic Breast Cancer (WDBC) dataset and achieved a classification performance of 98.86% using a 70-30 data partition. Jeyasingh et al. [21] utilized a modified bat algorithm (MBA) to select the optimal features from the WDBC dataset. They were thus able to achieve a classification accuracy of 96.85%. Mafarja et al. [22] achieved a 97.10% classification accuracy using the WOA-CM method with this dataset. The reviewed and investigated literature provided information that helped in understanding different FS methods.
Resolving classification problems has become a challenge for researchers. Different types of classifiers have already been proposed in the literature for classification problems. These include decision tree (DT) algorithms, k-nearest neighbor (k-NN) algorithms, naive Bayes (NB) classifiers, NNs, rule-based algorithms, SVMs, and other statistical methods, such as linear discriminant analysis and logistical regression. The most important and desired factor in medical diagnosis ML techniques for the classification of the causes of cancer is accuracy. Zheng et al. [23] utilized a hybrid K-means algorithm and an SVM (K-SVM) to diagnose breast cancer. Their experiment reached 97.38% accuracy when tested on the WDBC data. Moreover, Orkcu et al. [24] evaluated the efficiency of three different algorithms using this dataset: (i) a real coded genetic algorithm (RCGA), (ii) a back propagation NN (BPNN), and (iii) a binary coded genetic algorithm (BCGA). They achieved accuracies of 96.5, 93, and 94.0%, respectively. Moreover, Salama et al. [25] utilized five different classifiers: (i) NB, (ii) sequential minimal optimization (SMO), (iii) DT (J48), (iv) MLP, and (v) instance-based k-NN (IBK). The experiment used a confusion matrix based on the 10-fold cross-validation technique with three distinctive breast cancer databases to acquire classification accuracy. The experiment achieved the highest classification accuracy of 97.7% with SMO. Chunekar at al. [26] used a Jordan-Elman NN technique for the classification of three different breast cancer databases. Their technique achieved a classification accuracy of 98.25% using 4 hidden neurons in the hidden layer.
On the other hand, Lavanya et al. [27] used a CART classifier and achieved a 94.72% classification accuracy with WDBC datasets using a DT. The same researcher [28] used a hybrid technique and was able to achieve a classification accuracy of 95.96%. Another group of researchers, Malmir et al. [29], utilized the imperialist competitive algorithm (ICA) with an MLP network and particle swarm optimization (PSO). Classification accuracies of 97.75% and 97.63%, respectively, were achieved. In addition, out of nine classifiers tested by Koyuncu et al. [30], the rotation-forest artificial neural network (RF-ANN) achieved the highest classification accuracy at 98.05%. Aalaei et al. [31] utilized a genetic algorithm (GA) with three dissimilar classifiers, namely the PS-classifier, an ANN with 5 neurons, and a GA-based classifier, and the optimal feature subset was found using a GA. Their experiment after FS achieved a classification accuracy of 97.2, 97.3, and 96.6%, respectively, with WDBC datasets. Onur Inan et al. [32] used breast cancer datasets for their experiment. They used an Apriori algorithm (AP) with a NN classifier for cancer classification. This study reported a classification accuracy of 98.29%. Nguyen et al. [33] used a modified version of the analytical hierarchy process (AHP) to select the most informative genes for cancer classification. These genes served as inputs to a type-2 fuzzy logic system interval (IT2FLS). Aidaroos et al. [34] used the NB classification algorithm for medical data classification on datasets, including breast cancer and lunch cancer datasets. Soria et al. [35] proposed three different methods to classify data related to breast cancer. Their study utilized C4.5 tree, MLP, and NB classifiers. Mert et al. [36] utilized SVMs to classify breast cancer. To decrease the data dimensionality, the authors used independent component analysis (ICA) and the WDBC dataset and achieved a classification accuracy of 94.40%.
Amrane et al. [37] utilized ML techniques with two different classifiers, NB and k-NN classifiers, for breast cancer classification. The NB method achieved a 96.19% accuracy and the k-NN achieved 97.51%. Eleyan et al. [38] tried to improve classification performance. They presented a technique to detect breast cancer based on time. This study used a 10-fold cross-validation technique and various classifiers. The performance of the classifiers was evaluated using the WBCD. Karabatak [39] used the weighted NB (W-NB) classifier and carried out an experiment with five-fold cross-validation. The experiment was conducted using the WDBC dataset and achieved a classification accuracy of 98.54% along with a sensitivity of 99.11% and a specificity of 98.25%. Sheikhpour et al. [40] utilized a hybrid model to classify breast cancer. The author built a hybrid model by using PSO and kernel density estimation (KDE) classifiers. The PSO-KDE model achieved an accuracy of 98.45%, a sensitivity of 97.73%, and a specificity of 98.66%.
Hasri et al. [41] proposed an SVM and recursive feature elimination (RFE) technique for the detection of cancer. Wang et al. [42] used an SVM-based ensemble learning algorithm to make a hybridization model of weighted area under the receiver operating characteristics (ROC) curve (AUC) ensemble (WAUCE). The authors achieved a classification accuracy of 97.68% from the WDBC dataset using the WAUCE model with 10-fold cross-validation. Obaid et al. [43] utilized three different algorithms for classification breast cancer, namely DT, k-NN, and SVM. The highest classification accuracy of the experiment was 98.1%, using the SVM with the WDBC dataset. Emami et al. [44] proposed an AP-AMBFA method for diagnosis of breast cancer. The affinity propagation (AP) method was used for reducing the noise data, and adaptive modified binary firefly algorithm (AMBFA) was used for FS and classification. The authors were able to reach the highest classification accuracy of 98.60% using the proposed technique. Muhammer et al. [45] utilized harmony search and back propagation based on an ANN for the classification of breast cancer data. The accuracies achieved were 94.1 and 97.57% for back propagation and harmony search, respectively.
Shah et al. [46] discussed three different data mining algorithms, namely NB, DT, and k-NN algorithms, for the classification of cancer. The researchers used the WEKA tool and a breast cancer dataset for their experiments. The algorithm that achieved the highest accuracy, 95.99%, was the NB algorithm. Moloud et al. [47] proposed a nested ensemble technique to evaluate the WDBC dataset. The authors utilized classifiers and metaclassifiers to develop a two-layer nested ensemble classifier. They achieved the highest classification accuracy of 98.07%. Wang et al. [48] tried to solve the medical decision-making issues. They utilized a context-based probability NN (CPNN). The experiments utilized three different datasets, including the WDBC dataset, and achieved a classification accuracy of 97.40%. Karabatak et al. [49] proposed association rules (ARs) and an NN for performing cancer classification. To reduce the dimensionality of the breast cancer database, the authors applied ARs and an NN for intelligent classification. The authors utilized two dissimilar methods of association rules (ARs), AR1 and AR2. They described a classification accuracy of 95.2% from the NN, 97.4% from AR1+NN, and 95.6% from AR2+NN.
Senapati et al. [50] presented some experiments to classify breast cancer tumors. The authors proposed a local linear wavelet NN for the detection of normal and abnormal cases. Using the said method, the fundamental linear model replaced the connection weights between the input layer and the output layer. The recursive least square (RLS) strategy was utilized to update the parameter for training in order to improve the performance. The presented technique is very strong and efficient; it achieved a classification accuracy of 97.2%. Nguyen et al. [51] utilized a medical model for breast cancer classification based on the fuzzy standard additive model and a GA. In this system, the rule initialization was handled through the clustering of adaptive vector quantization. A GA optimizes the parameters. The parameter tuning was done through a gradient descent algorithm. In order to reduce the dimensionality of datasets, wavelet transform was applied. This model achieved a classification accuracy of 97.40%. Nguyen et al. [52] proposed a classification model that combines the interval type-2 fuzzy logic system (IT2FLS) and wavelet transformation (WT). These methods were combined to precisely handle high dimensionality and indecision. The fuzzy logic system type-2 interval consists of fuzzy c-means clustering-based unsupervised learning and parameter tuning driven on GAs. Such logic device mechanisms have high computational costs, and wavelet transform functions to reduce such computational expenses. The model achieved a 97.88% classification accuracy for breast cancer diagnosis.

3. Methodology

3.1. The ANN

Recently, research on artificial intelligence (AI) has increased in popularity and has been utilized more widely in most technical and scientific areas to construct models for solving various problems. AI includes intellectual mechanisms that represent or imitate human capacities to solve problems [53]. Such intellectual mechanisms include ANNs and deliver a number of advantages, such as their learning capacity and the ability to handle enormous volumes of irrelevant data, from active and nonlinear techniques where nonlinearities and variable interactions are of great importance. In addition, some studies have revealed the power of ANNs in solving various problems, including classification problems.
ANNs are models that attempt to imitate a number of core information processing techniques in the human brain. The ANN model, which is patterned on human brain functioning, can model and solve complex problems [54]. Moreover, an ANN has a powerful processor that can naturally store and share knowledge produced from an experiment [55]. The ANN contains three different layers, namely, input, hidden, and output layers. A number of neurons and weight functions are contained in each layer [56]. The basic model of an ANN is illustrated in Figure 1.
The neuron is the central processing component of an NN. The mathematical function is known as an artificial neuron and is considered as a general model of an actual (biological) neuron. Neurons are the primary solving unit generated to process local data inside the network. Parallel networks formulate a massive structure with these neurons, thus determining the function of the network structure [54]. Neurons are also known as nodes or units. They obtain input from a few other nodes, or perhaps from the inner source. Weight (w) is a factor in each input. It determines the node in some functions (f) of the sum-weighted inputs. In other units, the output can be reversed and serve as an input. The neuron is shown above in Figure 1.
For the purposes of classification, in this research, a 15-neuron network was used in the hidden layer. For the selection of the 15-neuron network, the Taguchi method was used.
ANN Pseudo Code for Selecting Neuron
Begin:
Step 1Upload Dataset
Step 2Identification of Input and Output
Step 3Dataset Partitioning for Training, Testing, and Validation
Step 4Set the neuron (start 10 by default)
Step 5Train the Network Based on Taguchi Method
Step 6Record Error Performance
Step 7Check the Error Performance
If (performance is poor), repeat steps 4-7; until finding the high performance.
If (performance is good), stop training;
Step 8Test the Network
Step 9Network is ready to perform
End.

3.2. Best-First Search

Best-first search refers to the technique of first scanning the node with the best “score.” Each candidate node was allocated to a score through the evaluation function. The algorithm maintains two lists, one with a list of candidates yet to be explored (OPEN) and another one with a list of nodes already visited (CLOSED). States in OPEN are ordered in accordance to some heuristic estimate of their “closeness” to a goal. This ordered OPEN list is referred to as a priority queue.
Symmetry 12 00271 i001

3.3. FS

FS is a technique that can reduce data dimensionality; it also involves the selection of the most relevant subset of the main feature dataset. In data pre-processing, FS is frequently utilized to classify relevant features that are frequently unknown beforehand; it also removes noise and irrelevant or redundant features that have zero significance in the task of classification. The principal objective of FS is to enhance the classification accuracy. This section demonstrates the FS model as shown in Figure 2.
This research utilized a two-step method to select the relevant features. The best-first search method was the first step, and the second step was the Taguchi method. The first step used the WEKA Tool with the best-first search method for extracting features from the main dataset. Feature extraction helps to reduce the amount of information requirements needed for a better definition of the dataset. An algorithm for input data, processed with suspected higher redundancy, can be transformed into a lower set of features. Based on the best-first search method, in this study, a feature-extracted set was created by using WEKA with information gain. Information gain calculates the values of each feature through WEKA and checks the rank. The higher rank features are sorted in accordance with the rank. A total of 32 main features of a breast cancer dataset was reduced to 29 features after feature extraction. The second step utilized the Taguchi method to extract the high optimum feature set from the rest of the features.

3.4. The Taguchi Method

The Taguchi method is an experimentally reliable design [57]; by changing relative design factors, its processes can be analyzed and improved. It is also called a statistical method. This reliable design approach is commonly used. The Taguchi method offers two methods for development and analysis: an orthogonal array (OA) and a signal-to-noise ratio (SNR). This research utilized an OA method for the analysis and improvement for FS. For instance, when a particular target has several design factors for N, a 2 N two-dimensional array, then (1) a specific design parameter is shown in each column, and (2) an experimental trial with a combination of several levels for all design factors is represented in each row. The proposed system utilizes the two-level OA (which is commonly used) to select characteristic features from the main feature dataset. A general orthogonal might be measured in full factorial experimental design as potential experimental trials. OAs are used to reduce the experimental effort assigned or related to these parameters of N design. An OA may be measured as a fractional factorial experimental design matrix in which a comprehensive interaction analysis is provided between all design factors and a reasonable, balanced, and systematic comparison of several levels of each design factor can be made. The array of two levels can be described as
L M ( 2 N )
where N is the number of columns (i.e., the number of design parameters) in the orthogonal matrix, M = 2 K ( M > N , K > l o g 2 ( N ) and K is the integer) represents the number of experimental tests, and base 2 indicates the number of levels for every design parameter (i.e., Levels 0 and 1).
As an example, from a particular target with 10 design parameters that have two levels (i.e., Levels 0 and 1), the orthogonal two-level array L 11 ( 2 10 ) can be produced as shown in Table 1. Only 11 experimental trials were tested, analyzed, and developed for this two-level OA. FS: 1 = select; 0 = not select. In comparison, for the full factorial experimental design, all possible combinations of 10 design factors (i.e., 2 10 = 1024 ) should be measured, but this is not applicable.
After feature extraction, based on the Taguchi method, the features were selected. First, the researcher made an OA in which every column corresponds to every input feature. Every row corresponds to 1 training of the ANN, with input features that are set to Level 0 or 1 in that row. After training the rows, this study compared the average input vector output to a specific feature. We then chose the features that yielded a better average improvement.
The breast cancer dataset had 29 remaining features with two levels (i.e., 0 and 1) after feature extraction. For this OA of two levels generated as L 30 ( 2 29 ) , only 30 experimental tests were evaluated, analyzed, and developed. On the other hand, in the complete factorial experimental design, all possible combinations of 29 design factors (i.e., 2 29 = 536870912 ) were calculated, but this is considered not applicable in practice. To obtain the final set of selected features, this study took 30 different selection experimental trials randomly for evaluation, analysis, and improvement. After final evaluation, only the 22 most relevant features were identified and selected for breast cancer classification.

3.5. Cancer Classification

Cancer is a common and severe disease, the instantiation of which has been increasing day by day around the world in recent times [58]. One common type of cancer is breast cancer. Classification is the most significant task for reducing the percentage of mortality associated with various types of cancers. Early detection is important to enhance breast cancer outcomes and survival. This research used a 15-neuron ANN for increasing breast cancer classification accuracy. For breast cancer classification, there are six phases to consider, shown below in Figure 3.
Data collection is the first and foremost step for classification. One must process the data with a specific objective in a process called Data Preprocess, where noise data and redundancy are filtered out. The fourth step is data partition, which is possible using MATLAB. The 15-neuron ANN model is utilized to train, validate, and test. Finally, an accurate estimate for breast cancer classification is possible using the 15-neuron ANN model.

3.6. Dataset

Breast cancer is one of the main causes of death for women around the world. Classification techniques can help doctors give proper treatment. This study uses the UCI Machine Learning Repository dataset on breast cancer diagnosis in Wisconsin (published website http:/archive.ics.uci.edu/ml/index.php) to discriminate malignant from benign tumor samples. Dr. William H. Wolberg (1993), Department of General Surgery, The University of Wisconsin, Clinical Science Center Madison, WI-53792, pioneered the usage of this dataset. The data concern both normal (Benign) and cancer (Malignant) samples. The dataset has 32 attributes, IDs, diagnoses, and 30 real-valued input features containing 569 samples. It also has two classes: 357 samples are normal, and 212 samples are cancer. There are no missing attribute values. The attribute information is illustrated in the following:
Attribute Information:
1 Identification Number
2 Type of Diagnosis (M = Malignant, B = Benign)
3 to 32 Ten real-valued features are measured for every cell nucleus:
iRadius (mean of distances from center to points on the perimeter)
iiTexture (Standard deviation of gray-scale values)
iiiPerimeter
ivArea
vSmoothness (Local variation in radius lengths)
viCompactness ( P e r i m e t e r 2 / a r e a 1.0 )
viiConcavity (Severity of concave portions of the contour)
viiiConcave Points (Number of concave portions of the contour)
ixSymmetry
xFractal Dimension (“Coastline approximation” −1)

4. ANN Classifier Performance Evaluation Criteria

The classifier performance depends on several aspects such as accuracy rate (AR), sensitivity, or true positive rate (TPR), specificity, or true negative rate (TNR), and the AUC [59,60]. All these values are estimated using a confusion matrix, as shown in Table 2 below.
TP: the number of true positives; FP: the number of false positives; FN: the number of false negatives; TN: the number of true negatives. Equation (2) was used for calculating the classification AR.
A R = T P + T N T P + F N + T N + F P
Sensitivity is a statistical test. How well the positive cases are properly identified by a binary classifier is called sensitivity or the TPR. Equation (3) was used for this.
T P R = T P T P + F N
Specificity is also a statistical test. Specificity or the TNR is how well a binary classifier precisely identifies negative cases. Equation (4) was used for calculating this.
T N R = T N T N + F P
In brief, the FPR is used in statistics when performing multiple comparisons; a false positive ratio is the probability that the null hypothesis for a particular test is wrongly rejected. Equation (5) was used for calculating the FPR.
F P R = F P F P + T N
The FNR is the proportion of positive outcomes that are predicated as negative test outcomes. Equation (6) was used for calculating this.
F N R = F N F N + T P
The ROC curve is used for the identification of the relationship between the hit rate (specificity) and the false alarm rate in a noisy communication channel in signal detection theory. The methodology for arranging classifiers is also considered, and their output is visualized [61]. The ROC curve possesses the ability to demonstrate the efficiency of the binary classification system, as its threshold for discrimination varies. By plotting the TPR against the FPR, the curve is formed.

5. Experimental Results and Discussion

Before the two-step FS in this research, an NN was utilized to classify the breast cancer dataset consisting of 569 samples with 32 features. The proposed 15-neuron ANN classifier was used without FS in the breast cancer dataset from 30 conducted experiments and achieved an average classification accuracy of 98.8%.

Breast Cancer with FS

The proposed method selected the 22 most valuable features from the breast cancer dataset for accurate cancer classification. The classification output was normal or cancer. In the NN output, normal is represented as (1 0) and cancer as (0 1). The training input matrix for the breast cancer dataset with FS for the proposed method is 399 by 22, which represents static data: 399 samples of 22 features. The output matrix is 399 by 2, representing static data: 399 samples of 2 outputs. The output matrix format is a version of the 399 by 2 binary matrixes, as shown in Table 2 in “Breast Cancer with FS”. The ANN was performed by using training, validation, and testing datasets. The network was presented during training and accordingly adjusted itself by its error. The validation was utilized to compute network simplification and to stop training through improving simplification. Testing in training is ineffective; thus, network performance offers independent computations at that time and after training. The dataset containing a total of 569 samples was randomly divided into two groups: 70% (399 samples) for training and 30% (170 samples) for testing. The 399 samples for the purposes of training the NN were divided randomly into three groups: 70% (279 samples) for training and 15% (60 samples) for both testing and validation. The experimental results for breast cancer with FS are recorded in Table 3.
Table 3 indicates 30 different recorded experimental results. The table also recorded the highest test accuracy of 100%, but this study has an average result of 99.4% test accuracy, which is called classification accuracy.
The NN training performance is shown in Figure 4. The exact performance of NN validation at Epoch 43 after FS is 3.4868 × 10 6 . At this point, the NN stopped training for generalization improvement.
The network’s performance in the training state is shown in Figure 5. The gradient efficiency at Epoch 49 is 0.0049699. The NN then stopped the training to improve generalization.
ANN error histogram performance is shown in Figure 6. It represents the performance error for the training, validation, and testing that overlapped on the zero-error line. From the graphical representation for the error histogram, the error for the proposed system was found to be near zero.
Figure 7 shows the output of the confusion matrix for the training phase. The confusion matrix shows the number and percentage of precise classifications with the first two diagonal cells. Classification was done by the trained network. The normal (benign) biopsy results show that 250 were precisely classified, corresponding to 62.7% of the total 399 biopsies. On the other hand, the cancer (malignant) biopsy results show that 145 were precisely classified, corresponding to 36.3% of total biopsies. The experiment also revealed that four of the cancer biopsies were wrongly classified as benign, corresponding to 1.0% of the total biopsy data, while zero normal biopsies were wrongly classified as cancer, corresponding to 0.0% of the total biopsy data. The total result of the 254 normal samples revealed that 98.4% were precise and that therefore only 1.6% were wrong. The total result of the 145 cancer cases was 100% precise and 0.0% wrong. The total result of the 250 normal cases was 100% precisely classified as normal and 0.0% as cancer. Out of the 149 cancer cases, 97.3% were precisely classified as cancer and 2.7% classified as normal. The overall confusion matrix shows that, at the training stage, 99.0% of classifications are precise, and 1.0% are wrong in this proposed system.
Efficient NN training with ROC curves was employed. FS performance analysis is shown in Figure 8. The ROC curve shows the graph of the performance of the binary classification system where its discrimination threshold is mixed. The curve is formed with the TPR against the FPR. From this ROC curve, it can be observed that NN performance improves with an increase in the number of iterations. The accurate classification result is achieved on the 49th iteration; this shows that each class has reached perfect accuracy in classification. Iteration 49 is the optimum iteration for the proposed system, where the best performance has been given by the NN.
Upon completion of the training, this study tested the classification accuracy of the NN using 30% of the breast cancer test dataset with FS. Figure 9 indicates the accuracy of the test, defined as the classification accuracy of the proposed technique.
In Figure 9, the experimental results with the breast cancer test dataset after FS represents that benign and malignant samples were precisely classified, and a 99.4% test accuracy was achieved.
Figure 10 shows the ROC curve with FS for the breast cancer test dataset. The ROC curve indicates that benign and malignant samples obtained the highest AUC. It also shows the highest faultless outcome for the breast cancer test dataset.
From the confusion matrix of the breast cancer results, the evaluation parameters after FS were sensitivity, specificity, FPR, and AR, based on the TPR, FPR, TNR, and FNR; these are shown in Table 4.
Table 5 shows a comparative study between the proposed method and other existing methods after FS for the breast cancer dataset.
The proposed method has been compared to conventional methods based on the evaluation parameters in Table 5. The comparison was based on the sensitivity, specificity, FPR, processing time, and overall accuracy. According to the accuracy percentages, the closest accuracy, given by Yoon et al. [63], was 98.8%, while, for Yong Zhang et al. [62], it was 98.36%; the distance given by Azhagusundari et al. [66] was 73.78%—73.8% with sensitivity. Mafarja et al. [22] achieved a 97.10% classification accuracy. Aalaei et al. [31] achieved a 97.30% accuracy, 98.40% with sensitivity, and 95.10% with specificity. Murugan et al. [63] achieved an accuracy of 98.19%. Nekkaa et al. [65] achieved a 97.88% classification accuracy with a processing time of 147.83 s. The comparison table shows that this study achieved the highest result and a significant classification accuracy of 99.4%, with a 99.9% sensitivity, a 98.4% specificity, a 1.6% false positive rate, and a 0.42 s processing time for breast cancer classification. Finally, this study clearly concludes that the proposed method, compared with the initial classifications without FS and with FS, increases the classification accuracy significantly, with an average improvement of 0.6%.

6. Conclusions

This research focused on FS to reduce data dimensionality and achieved a relatively high classification accuracy for breast cancer. The proposed two-step FS method selected the 22 most valuable features from 32 attributes in the WDBC dataset. The 15-neuron ANN classifier achieved a classification accuracy of 99.4%, with a 99.9% sensitivity, a 98.4% specificity, a 1.6% false positive rate, and a 0.42 s processing time for breast cancer classification. The initial experiment, conducted without FS, achieved a 98.8% classification accuracy using the proposed 15-neuron ANN classifier. After FS, the classification accuracy increased, with an average of 0.6%, which is promising. In future work, the aim is to achieve accurate cancer detection with a large dataset.

Author Contributions

Conceptualization, M.A.R.; methodology, M.A.R. and R.C.M.; software, M.A.R.; validation, M.A.R. and R.C.M.; formal analysis, R.C.M.; investigation, M.A.R.; resources, M.A.R. and R.C.M.; data curation, M.A.R.; writing—original draft preparation, M.A.R.; writing—review and editing, R.C.M.; visualization, M.A.R.; supervision, R.C.M.; project administration, R.C.M.; funding acquisition, R.C.M. All authors have read and agreed to the published version of the manuscript.

Funding

This research is funded by Universiti Kebangsaan Malaysia (UKM), UKM Grant Code: GGP-2019-023.

Conflicts of Interest

The authors declare that there is no conflict of interest.

References

  1. McCulloch, W.S.; Pitts, W. A Logical Calculus of the Ideas Imminent in Nervous. Bull. Math. Biol. 1943, 52, 99–115. [Google Scholar] [CrossRef]
  2. Elkhani, N.; Muniyandi, R.C. Review of the effect of feature selection for microarray data on the classification accuracy for cancer data sets. Int. J. Soft Comput. 2016, 11, 334–342. [Google Scholar]
  3. Yang, J.; Honavar, V. Feature Subset Selection Using a Genetic Algorithm. In Feature eXtraction, Construction and Selection; Springer: Berlin, Germany, 1998; pp. 117–136. [Google Scholar]
  4. Inza, I.; Larrañaga, P.; Blanco, R.; Cerrolaza, A.J. Filter versus wrapper gene selection approaches in DNA microarray domains. Artif. Intell. Med. 2004, 31, 91–103. [Google Scholar] [CrossRef] [PubMed]
  5. Lal, T.N.; Chapelle, O.; Weston, J.; Elisseeff, A. Embedded methods. In Feature Extraction; Springer: Berlin, Germany, 2006; pp. 137–165. [Google Scholar]
  6. Han, J.; Kamber, M.; Pei, J. Data Mining: Concepts and Techniques (the MORGAN Kaufmann Series in Data Management Systems); Morgan Kaufmann: Burlington, MA, USA, 2000. [Google Scholar]
  7. Rahman, M.; Habib, T. A preprocessed counterpropagation neural network classifier for automated textile defect classification. J. Ind. Intell. Inf. 2016, 4, 209–217. [Google Scholar] [CrossRef] [Green Version]
  8. Rahman, M.A.; Muniyandi, R.C. Feature selection from colon cancer dataset for cancer classification using artificial neural network. Int. J. Adv. Sci. Eng. Inf. Technol. 2018, 8, 1387–1393. [Google Scholar] [CrossRef] [Green Version]
  9. Elkhani, N.; Muniyandi, R.C. Membrane computing inspired feature selection model for microarray cancer data. Intell. Data Anal. 2017, 21, S137–S157. [Google Scholar] [CrossRef]
  10. Sahran, S.; Albashish, D.; Abdullah, A.; Shukor, N.A.; Pauzi, S.H.M. Absolute cosine-based SVM-RFE feature selection method for prostate histopathological grading. Artif. Intell. Med. 2018, 87, 78–90. [Google Scholar] [CrossRef]
  11. Rahman, M.A.; Singh, P.; Muniyandi, R.C.; Mery, D.; Prasad, M. Prostate Cancer Classification Based on Best First Search and Taguchi Feature Selection Method; Springer International Publishing: Cham, Switzerland, 2019; pp. 325–336. [Google Scholar]
  12. Guyon, I.; Elisseeff, A. An introduction to variable and feature selection. J. Mach. Learn. Res. 2003, 3, 1157–1182. [Google Scholar]
  13. Liu, H.; Motoda, H. Feature Extraction, Construction and Selection: A Data Mining Perspective; Springer Science & Business Media: Berlin, Germany, 1998; Volume 453. [Google Scholar]
  14. Liu, H.; Yu, L. Toward Integrating Feature Selection Algorithms for Classification and Clustering. 2005. Available online: https://ieeexplore.ieee.org/abstract/document/1401889 (accessed on 5 January 2020).
  15. Daelemans, W.; Hoste, V.; De Meulder, F.; Naudts, B. Combined optimization of feature selection and algorithm parameters in machine learning of language. In Proceedings of the Joint European Conference on Machine Learning and Knowledge Discovery in Databases, Cavtat-Dubrovnik, Croatia, 22–26 September 2003; pp. 84–95. [Google Scholar]
  16. Banerjee, M.; Mitra, S.; Banka, H. Evolutionary rough feature selection in gene expression data. IEEE Trans. Syst. Man Cybern. Part (Appl. Rev.) 2007, 37, 622–632. [Google Scholar] [CrossRef]
  17. García-Nieto, J.; Alba, E.; Jourdan, L.; Talbi, E. Sensitivity and specificity based multiobjective approach for feature selection: Application to cancer diagnosis. Inf. Process. Lett. 2009, 109, 887–896. [Google Scholar] [CrossRef]
  18. Hasan, H.; Tahir, N.M. Feature selection of breast cancer based on principal component analysis. In Proceedings of the IEEE 2010 6th International Colloquium on Signal Processing & Its Applications, Mallaca City, Malaysia, 21–23 May 2010; pp. 1–4. [Google Scholar]
  19. Rahideh, A.; Shaheed, M.H. Cancer classification using clustering based gene selection and artificial neural networks. In Proceedings of the IEEE 2nd International Conference on Control, Instrumentation and Automation, Shiraz, Iran, 27–29 December 2011; pp. 1175–1180. [Google Scholar]
  20. Dora, L.; Agrawal, S.; Panda, R.; Abraham, A. Optimal breast cancer classification using Gauss–Newton representation based algorithm. Expert Syst. Appl. 2017, 85, 134–145. [Google Scholar] [CrossRef]
  21. Jeyasingh, S.; Veluchamy, M. Modified bat algorithm for feature selection with the wisconsin diagnosis breast cancer (WDBC) dataset. Asian Pac. J. Cancer Prev. 2017, 18, 1257. [Google Scholar] [PubMed]
  22. Mafarja, M.; Mirjalili, S. Whale optimization approaches for wrapper feature selection. Appl. Soft Comput. 2018, 62, 441–453. [Google Scholar] [CrossRef]
  23. Zheng, B.; Yoon, S.W.; Lam, S.S. Breast cancer diagnosis based on feature extraction using a hybrid of K-means and support vector machine algorithms. Expert Syst. Appl. 2014, 41, 1476–1482. [Google Scholar] [CrossRef]
  24. Örkcü, H.H.; Bal, H. Comparing performances of backpropagation and genetic algorithms in the data classification. Expert Syst. Appl. 2011, 38, 3703–3709. [Google Scholar] [CrossRef]
  25. Salama, G.I.; Abdelhalim, M.; Zeid, M.A.E. Breast cancer diagnosis on three different datasets using multi-classifiers. Breast Cancer (WDBC) 2012, 32, 2. [Google Scholar]
  26. Chunekar, V.N.; Ambulgekar, H.P. Approach of neural network to diagnose breast cancer on three different data set. In Proceedings of the IEEE2009 International Conference on Advances in Recent Technologies in Communication and Computing, Kottayam, India, 27–28 October 2009; pp. 893–895. [Google Scholar]
  27. Lavanya, D.; Rani, D.K.U. Analysis of feature selection with classification: Breast cancer datasets. Indian J. Comput. Sci. Eng. 2011, 2, 756–763. [Google Scholar]
  28. Lavanya, D.; Rani, K.U. Ensemble decision tree classifier for breast cancer data. Int. J. Inf. Technol. Converg. Serv. 2012, 2, 17. [Google Scholar] [CrossRef]
  29. Malmir, H.; Farokhi, F.; Sabbaghi-Nadooshan, R. Optimization of data mining with evolutionary algorithms for cloud computing application. In Proceedings of the ICCKE 2013, Mashhad, Iran, 31 October–1 November 2013; pp. 343–347. [Google Scholar]
  30. Koyuncu, H.; Ceylan, R. Artificial neural network based on rotation forest for biomedical pattern classification. In Proceedings of the IEEE 2013 36th International Conference on Telecommunications and Signal Processing (TSP), Rome, Italy, 2–4 July 2013; pp. 581–585. [Google Scholar]
  31. Aalaei, S.; Shahraki, H.; Rowhanimanesh, A.; Eslami, S. Feature selection using genetic algorithm for breast cancer diagnosis: Experiment on three different datasets. Iran. J. Basic Med. Sci. 2016, 19, 476. [Google Scholar]
  32. Inan, O.; Uzer, M.S.; Yılmaz, N. A new hybrid feature selection method based on association rules and PCA for detection of breast cancer. Int. J. Innov. Comput. Inf. Control. 2013, 9, 727–729. [Google Scholar]
  33. Nguyen, T.; Nahavandi, S. Modified AHP for gene selection and cancer classification using type-2 fuzzy logic. IEEE Trans. Fuzzy Syst. 2015, 24, 273–287. [Google Scholar] [CrossRef]
  34. Al-Aidaroos, K.; Bakar, A.; Othman, Z. Medical Data Classification with Naive Bayes Approach. Inf. Technol. J. 2012, 11, 1166–1174. [Google Scholar] [CrossRef] [Green Version]
  35. Soria, D.; Garibaldi, J.M.; Biganzoli, E.; Ellis, I.O. A comparison of three different methods for classification of breast cancer data. In Proceedings of the IEEE 2008 Seventh International Conference on Machine Learning and Applications, San Diego, CA, USA, 11–13 December 2008; pp. 619–624. [Google Scholar]
  36. Mert, A.; Kilic, N.; Akan, A. Breast cancer classification by using support vector machines with reduced dimension. In Proceedings of the ELMAR, Zadar, Croatia, 14–16 September 2011; pp. 37–40. [Google Scholar]
  37. Amrane, M.; Oukid, S.; Gagaoua, I.; Ensarİ, T. Breast cancer classification using machine learning. In Proceedings of the IEEE 2018 Electric Electronics, Computer Science, Biomedical Engineerings’ Meeting (EBBT), Istanbul, Turkey, 18–19 April 2018; pp. 1–4. [Google Scholar]
  38. Eleyan, A. Breast cancer classification using moments. In Proceedings of the IEEE 20th Signal Processing and Communications Applications Conference (SIU), Istanbul, Turkey, 18–19 April 2018; pp. 1–4. [Google Scholar]
  39. Karabatak, M. A new classifier for breast cancer detection based on Naïve Bayesian. Measurement 2015, 72, 32–36. [Google Scholar] [CrossRef]
  40. Sheikhpour, R.; Sarram, M.A.; Sheikhpour, R. Particle swarm optimization for bandwidth determination and feature selection of kernel density estimation based classifiers in diagnosis of breast cancer. Appl. Soft Comput. 2016, 40, 113–131. [Google Scholar] [CrossRef]
  41. Hasri, N.M.; Wen, N.H.; Howe, C.W.; Mohamad, M.S.; Deris, S.; Kasim, S. Improved support vector machine using multiple SVM-RFE for cancer classification. Int. J. Adv. Sci. Eng. Inf. Technol. 2017, 7, 1589–1594. [Google Scholar] [CrossRef] [Green Version]
  42. Wang, H.; Zheng, B.; Yoon, S.W.; Ko, H.S. A support vector machine-based ensemble algorithm for breast cancer diagnosis. Eur. J. Oper. Res. 2018, 267, 687–699. [Google Scholar] [CrossRef]
  43. Obaid, O.I.; Mohammed, M.A.; Ghani, M.K.A.; Mostafa, A.; Taha, F. Evaluating the Performance of Machine Learning Techniques in the Classification of Wisconsin Breast Cancer. Int. J. Eng. Technol. 2018, 7, 160–166. [Google Scholar]
  44. Emami, N.; Pakzad, A. A New Knowledge-Based System for Diagnosis of Breast Cancer by a combination of the Affinity Propagation and Firefly Algorithms. J. Data Min. 2019, 7, 59–68. [Google Scholar]
  45. İlkuçar, M.; Işik, A.H.; Çifci, A. Classification of breast cancer data with harmony search and back propagation based artificial neural network. In Proceedings of the IEEE 2014 22nd signal processing and communications applications conference (SIU), Trabzon, Turkey, 23–25 April 2014; pp. 762–765. [Google Scholar]
  46. Shah, C.; Jivani, A.G. Comparison of data mining classification algorithms for breast cancer prediction. In Proceedings of the 2013 Fourth International Conference on Computing, Communications and Networking Technologies (ICCCNT), Tiruchengode, India, 4–6 July 2013; pp. 1–4. [Google Scholar]
  47. Abdar, M.; Zomorodi-Moghadam, M.; Zhou, X.; Gururajan, R.; Tao, X.; Barua, P.D.; Gururajan, R. A New Nested Ensemble Technique for Automated Diagnosis of Breast Cancer. 2018. Available online: https://www.sciencedirect.com/science/article/abs/pii/S0167865518308766 (accessed on 5 January 2020).
  48. Wang, D.; Wan, S.; Guizani, N. Context-based probability neural network classifiers realized by genetic optimization for medical decision making. Multimed. Tools Appl. 2018, 77, 21995–22006. [Google Scholar] [CrossRef]
  49. Karabatak, M.; Ince, M.C. An expert system for detection of breast cancer based on association rules and neural network. Expert Syst. Appl. 2009, 36, 3465–3469. [Google Scholar] [CrossRef]
  50. Senapati, M.R.; Mohanty, A.K.; Dash, S.; Dash, P.K. Local linear wavelet neural network for breast cancer recognition. Neural Comput. Appl. 2013, 22, 125–131. [Google Scholar] [CrossRef]
  51. Nguyen, T.; Khosravi, A.; Creighton, D.; Nahavandi, S. Classification of healthcare data using genetic fuzzy logic system and wavelets. Expert Syst. Appl. 2015, 42, 2184–2197. [Google Scholar] [CrossRef]
  52. Nguyen, T.; Khosravi, A.; Creighton, D.; Nahavandi, S. Medical data classification using interval type-2 fuzzy logic system and wavelets. Appl. Soft Comput. 2015, 30, 812–822. [Google Scholar] [CrossRef]
  53. Chen, L. Pattern classification by assembling small neural networks. In Proceedings of the 2005 IEEE International Joint Conference on Neural Networks, Montreal, QC, Canada, 31 July–4 August 2005; Volume 3, pp. 1947–1952. [Google Scholar]
  54. Samarasinghe, S. Neural Networks for Applied Sciences and Engineering: From Fundamentals to Complex Pattern Recognition; Auerbach Publications: London, UK, 2016. [Google Scholar]
  55. Dey, R.; Bajpai, V.; Gandhi, G.; Dey, B. Application of artificial neural network (ANN) technique for diagnosing diabetes mellitus. In Proceedings of the IEEE Region 10 and the Third international Conference on Industrial and Information Systems, Kharagpur, India, 8–10 December 2008; pp. 1–4. [Google Scholar]
  56. Naim, N.F.; Yassin, A.I.M.; Zakaria, N.B.; Wahab, N.A. Classification of Thumbprint using Artificial Neural Network (ANN). In Proceedings of the IEEE International Conference on System Engineering and Technology, Shah Alam, Malaysia, 27–28 June 2011; pp. 231–234. [Google Scholar]
  57. Wu, Y.; Wu, A. Taguchi Methods for Robust Design; ASME Press: New York, NY, USA, 2000. [Google Scholar]
  58. Rahman, M.A.; Muniyandi, R.C.; Islam, K.T.; Rahman, M.M. Ovarian Cancer Classification Accuracy Analysis Using 15-Neuron Artificial Neural Networks Model. IEEE Stud. Conf. Res. Dev. (SCOReD) 2019, 20, 33–38. [Google Scholar]
  59. Lu, Z.; Szafron, D.; Greiner, R.; Lu, P.; Wishart, D.S.; Poulin, B.; Anvik, J.; Macdonell, C.; Eisner, R. Predicting subcellular localization of proteins using machine-learned classifiers. Bioinformatics 2004, 20, 547–556. [Google Scholar] [CrossRef] [Green Version]
  60. Tripathy, R.K. An Investigation of the Breast Cancer Classification Using Various Machine Learning Techniques. Ph.D. Thesis, Department of Biotechnology & Medical Engineering, National Institute of Technology, Orissa, India, 2013. [Google Scholar]
  61. Sing, T.; Sander, O.; Beerenwinkel, N.; Lengauer, T. ROCR: Visualizing classifier performance in R. Bioinformatics 2005, 21, 3940–3941. [Google Scholar] [CrossRef]
  62. Zhang, Y.; Gong, D.; Hu, Y.; Zhang, W. Feature selection algorithm based on bare bones particle swarm optimization. Neurocomputing 2015, 148, 150–157. [Google Scholar] [CrossRef]
  63. Yoon, H.; Park, C.S.; Kim, J.S.; Baek, J.G. Algorithm learning based neural network integrating feature selection and classification. Expert Syst. Appl. 2013, 40, 231–241. [Google Scholar] [CrossRef]
  64. Murugan, A.; Sridevi, T. An enhanced feature selection method comprising rough set and clustering techniques. In Proceedings of the 2014 IEEE International Conference on Computational Intelligence and Computing Research, Coimbatore, India, 18–20 December 2014; pp. 1–4. [Google Scholar]
  65. Nekkaa, M.; Boughaci, D. A memetic algorithm with support vector machine for feature selection and classification. Memetic Comput. 2015, 7, 59–73. [Google Scholar] [CrossRef]
  66. Azhagusundari, B. An integrated method for feature selection using fuzzy information measure. In Proceedings of the International Conference on Information Communication and Embedded Systems (ICICES), Chennai, India, 23–24 February 2017; pp. 1–6. [Google Scholar]
Figure 1. The ANN.
Figure 1. The ANN.
Symmetry 12 00271 g001
Figure 2. The feature selection (FS) model.
Symmetry 12 00271 g002
Figure 3. Breast cancer classification.
Symmetry 12 00271 g003
Figure 4. ANN training performance for breast cancer with FS.
Symmetry 12 00271 g004
Figure 5. ANN training state performance for breast cancer with FS.
Symmetry 12 00271 g005
Figure 6. ANN error histogram performance for breast cancer with FS.
Symmetry 12 00271 g006
Figure 7. ANN training confusion matrix performance for breast cancer with FS.
Symmetry 12 00271 g007
Figure 8. Receiver operating characteristics (ROC) curve performance for breast cancer with FS.
Symmetry 12 00271 g008
Figure 9. Result of test data for breast cancer with FS.
Symmetry 12 00271 g009
Figure 10. The ROC curve with the breast cancer test dataset with FS.
Symmetry 12 00271 g010
Table 1. Orthogonal array (OA) example.
RunF1F2F3F4F5F6F7F8F9F10
10111001000
21001110001
30110111111
41110100100
51010011010
60001001011
71101101001
80011010100
90100101101
101011010011
100100011010
Table 2. Confusion matrix for binary classifier.
TFN
FPTN
Table 3. The experimental results for breast cancer with FS.
Number of ExperimentsTraining Accuracy (%)Validation Accuracy (%)Test Accuracy (%)Percent of Error
198.799.298.91.1
299.498.799.90.1
399.299.599.20.8
499.098.799.50.5
599.499.21000.0
699.198.899.70.3
799.099.399.50.5
899.398.599.40.6
999.099.099.20.8
1098.599.298.81.2
1198.998.899.40.6
1298.698.399.20.8
1399.299.41000.0
1499.41001000.0
1599.299.199.80.2
1699.499.61000.0
1798.999.099.40.6
1899.399.899.80.2
1998.898.798.81.2
2099.299.599.90.1
2199.099.299.50.5
2299.098.899.01.0
2399.298.698.81.2
2498.898.598.31.7
2599.098.599.20.8
2699.299.499.90.1
2798.798.799.40.6
2898.498.699.01.0
2998.998.399.20.8
3099.297.599.60.4
Average99.098.999.40.6
Table 4. Parameter evaluation using breast cancer dataset with FS.
Parameters EvaluationMathematical EquationResult (%)
Sensitivity or True Positive Rate (TPR) T P R = T P T P + F N 99.9
Specificity or True Negative Rate (TNR) T N R = T N T N + F P 98.4
False Positive Rate (FPR) F P R = F P F P + T N 1.6
False Negative Rate (FNR) F N R = F N F N + T P 0.1
Accuracy Rate (AR) A R = T P + T N T P + F N + T N + F P 99.4
Table 5. Comparison of the proposed method with other existing methods using the breast cancer dataset with FS.
Author NameSensitivitySpecificityFalse PositiveClassificationProcessing
& References(%)(%)Rate (%)Accuracy (%)Time(s)
Zhang et al. [62]---98.36-
Yoon et al. [63]---98.80-
Murugan et al. [64]---98.19-
Nekkaa et al. [65]---97.88147.83
Aalaei et al. [31]98.4095.10-97.30-
Azhagusundari et al. [66]73.8--73.78-
Mafarja et al [22]---97.10-
This Study99.998.41.699.40.42

