1. Introduction
Promoting the sustainable development of renewable energy is a measure in response to issues like the shortage of fossil fuels, environmental pollution, climate change, and energy security, as well as an important means to achieve a healthy and sustainable development of society and economy [
1]. In recent years, low-carbon transformation and the upgrading of the power industry have been valued by countries around the world. With the target incentives and policy support of governments in various countries, the renewable energy power generation industry has achieved considerable development [
2]. By the end of 2019, the cumulative global installed capacity of non-water renewable energy power generation reached 1347.405 GW, and the wind power and photovoltaic installed capacity reached 622.704 GW and 586.434 GW, respectively. Meanwhile, China’s wind power and photovoltaic installed capacity reached 210.478 GW and 205.493 GW respectively, both ranking first in the world [
3]. At the same time, the Chinese government also pledged to further increase policy support for the renewable energy power industry and to continue to promote the green development of the power industry [
4,
5,
6]. With the rise of China’s renewable energy share in the energy supply system, it is of great practical significance to further increase the share of renewable energy in the energy consumption system and transform the driving force of renewable energy from a power generation incentive to a power consumption incentive, thereby promoting renewable energy consumption.
The reform of the global power system began in the 1980s. The first reform aimed to break the monopoly power industry structure and establish a competitive market mechanism [
7], and the second aimed to promote the marketization of power commodities and strengthen government regulation [
8]. So far, some scholars have discussed problems faced by the competitive power sales market, such as the optimal power purchase and sales decision making based on the analysis of the power quality and power load forecasting [
9,
10,
11,
12,
13,
14], prediction of electricity prices based on neural networks [
15], analysis of the power system flexibility based on uncertainty [
16], and mechanism design based on distributed energy [
17]. However, due to the generation cost and technical constraints, and the uncertainty of renewable power [
18], it is still difficult to promote the consumption of renewable energy power. Thus, the power system reform has been put on the agenda of the Chinese government [
19,
20]. On November 30, 2015, the State Council issued the “Implementation Opinions on Promoting the Reform of the Power Sales Side”, introducing various enterprises and users into the power retail market, and building a competitive sales market. Under the current implementation of the power sales side RPS policy, China’s electricity market is structured as shown in
Figure 1.
Renewable Portfolio Standards (RPS) is one of the renewable energy power industry support policies, and it requires a certain percentage of renewable energy power to be produced and consumed in the electricity market [
21,
22]. The United States introduced the “Renewable Portfolio Standard” and “Renewable Energy Certificate” policies in 1980, the United Kingdom introduced the “Renewable Obligation” policy in 2002, and Australia also introduced the “Mandatory Renewable Energy Target” policy in 2001 [
23,
24,
25]. As for China, the National Development and Reform Commission and the National Energy Administration issued the “Notice on Implementing the Renewable Portfolio Standards (Draft)” On November 15, 2018, which set RPS quotas for power consumption and held provincial governments responsible for the power sales side RPS regulation. What is more, the RPS regulation mechanism was established by government regulation agencies to punish the agents that did not fulfill their RPS obligations, and incentive indicators were set according to the binding indicators to subsidize power sales companies that outperform their RPS obligations. Taking power sales companies as the subjects of RPS responsibility presents three advantages. First, it can reduce the need for subsidy funds; second, it can alleviate, if not solve, the problem of renewable energy power abandonment; and third, the appropriate RPS quota index can promote stable and sustainable growth for the development of renewable energy in the future, and guarantee the realization of China’s non-fossil energy share target in 2020 and 2030. From the perspective of international experience and the long-term development of the renewable energy power industry, viewing the power sales companies as the subjects of RPS responsibility becomes all the more advantageous [
26].
In China’s current electricity market, the obligations of the RPS are mainly set for electricity distribution companies and power users. Therefore, this article, focused on the power sales side RPS policy mechanism, mainly sets the RPS quota targets of provinces, formulates the rewards and punishment mechanisms for power sales companies, and motivates and guides power sales companies to consume more renewable power. This policy mechanism can help solve the problem of renewable energy power abandonment while realizing the positive social benefits of renewable energy power at the same time. Therefore, a green certificate trading mechanism is constructed to guarantee the implementation of the RPS policy [
27,
28]. External environmental benefits of renewable energy power are reflected as a green certificate corresponding to 1 MW.h of renewable energy power, which can be traded in the green certificate market [
29,
30,
31]. The RPS policy and the green certificate trading mechanism can effectively promote the development of the renewable energy power industry through the combination of the market mechanism and administrative regulation [
32,
33,
34], a combination which, based on marketization, helps to create space for the continuous growth of renewable energy power. What is more, designing a reasonable RPS policy will make for a more stable power price.
At present, power sales companies in China mainly fall into two types: integrated power sales companies and independent power sales companies. Integrated power sales companies not only sell power products but also have power generation resources. In contrast, independent power sales companies do not own power generation resources and can only sell power products. In recent years, competition in the power sales market has become increasingly fierce. As of August 2018, there were more than 3600 registered power sales companies nationwide, and the number of registered power sales companies in each province is shown in
Figure 2.
The implementation of the power sales side RPS is inseparable from an effective government regulation. It is the result of strategic interactions between competitive power sales companies and government regulation agencies. Under the power sales side RPS policy mechanism, power sales companies, in order to achieve the RPS target, need to face the risk of uncertainty caused by a high proportion of renewable energy. At the same time, new methods are necessary to stimulate the sales of renewable energy power for power sales companies. For example, new power sales channels need to be developed, value-added services be provided, and cross-regional transaction contracts be signed with renewable energy generation companies. However, these methods will undoubtedly increase the operating risks and costs of the power sales companies. That is why power sales companies lack the enthusiasm to fulfill their RPS obligations and are unwilling to actively sell renewable energy power. In order to achieve the target of energy transformation and upgrading in China, the Chinese government expects power sales companies to consume more renewable energy power. Thus, government regulation is necessary, which in turn will bring greater regulation pressure and regulation costs. Based on the above analysis, we can find that during the implementation of the power sales side RPS policy, the decision-making targets between power sales companies and government regulation agencies are not consistent, and their strategic selections affect each other. This is in line with the theoretical characteristics of game theory, a theory mainly used to study how multiple agencies maximize their own interests [
35]. The strategy selections of the power sales companies and the government regulation agencies are diverse and complex, and there are both selections and abrupt changes in the dynamic evolution process. What is more, the strategic behaviors of power sales companies and government regulation agencies are characterized by a certain inertia [
36]. Previous studies, however, were mostly based on the complete rational hypothesis, ignoring the limited rationality of the relevant agents and the imitation between game agents in the process of repeated interaction, which is unable to meet the needs of multi-agents’ decision-making optimization [
37]. The evolutionary game theory based on a bounded rationality can provide a new research idea for analyzing the government regulation mechanism of the power sales side RPS policy [
38].
To systematically analyze the power sales side RPS government regulation problem, based on the evolutionary game theory, we considered the competitive relationship between integrated power sales companies and independent power sales companies based on a limited rationality [
39,
40]. We creatively constructed an evolutionary game model among the government regulation agencies, integrated power sales companies, and independent power sales companies, and simulated the dynamic strategy selection of game agents according to the system dynamics theory. What is more, the strategy selection of game agents and the strategy selection evolution processes under the static reward–penalty mechanism and the dynamic reward–penalty mechanism were also analyzed.
2. Literature Review
Since the electricity sales side in China was not opened in the past, most domestic scholars excluded the electricity sales side from the obligated subject of RPS. Research on RPS mainly focused on the power generation side, including the transaction model, implementation plan, resource allocation of the power generation side RPS market power, supervision, and management [
41,
42,
43,
44]. With the opening of the electricity sales side, according to foreign practices, it is necessary to discuss the feasibility of implementing RPS on the electricity sales side in China and the design of the RPS system.
According to the Renewable Energy Law promulgated in 2005, China will increasingly rely on renewable energy to support economic development after 2020 [
45]. In recent years, many scholars have thoroughly studied the RPS implementation issue around the world. They found that RPS policy could promote competition between power generators and the production of renewable energy power [
46], which helped to lower electricity prices, reduce the carbon emissions, and improve the efficiency of the electricity market [
47,
48]. What is more, the establishment of the green certificate market can reduce the cost of power generation companies and promote the effective allocation of resources and technology investment [
49,
50].
Some scholars also compared the effectiveness of the Feed-in Tariff (FIT) and renewable portfolio standard (RPS). FIT policy is a support mechanism of renewable energy. Through direct pricing, investors could obtain a stable income and effectively promote the development of the renewable power industry in the early stage. Like Germany, China developed its renewable energy industry rapidly at the early stage. At the same time, there were some serious problems, such as large subsidy gaps [
51]. Recently, the Chinese government has been exploring how to implement a renewable portfolio standard (RPS) policy that requires a certain fraction of electricity to be generated and consumed from renewable energy sources [
52]. The RPS policy was found to be effective in reducing carbon emissions, improving consumer surplus, and increasing the market share of renewable energy power [
53,
54,
55]. These studies showed that the policy effect of the RPS mechanism is significant. At the same time, some scholars also found that the implementation of the RPS policy would affect residents’ consumption strategy selection and investor confidence, which in turn affected the policy effects [
56,
57]. Thus, improving RPS policy transparency is the key to controlling RPS policy costs and achieving policy objectives. Policy makers should consider not only the factor of carbon emission reduction, but also factors such as economic development and electricity price [
58,
59,
60]. It can be seen that the implementation process of the RPS policy faces uncertainty. As the effect of the RPS policy is strictly dependent on government regulation [
61], how to effectively regulate the power sales companies’ strategy selection is critical.
The implementation of RPS cannot do without an effective regulation mechanism. Due to the higher generation cost and instability, power sales companies lack the incentive to consume renewable energy power, and an effective government regulation is particularly necessary. Jensen [
62] studied the price and consumption effects between the power market and the green certificate trading market. He found that the interaction between the two markets made the implementation effect of RPS policy ambiguous. Thus, the development of a reasonable and comprehensive government regulation mechanism was particularly important for the implementation of RPS policy. Tanaka [
63] and Dong [
64] respectively constructed a competitive game model and empirical analysis model. They found that traditional fossil energy power generators restrained the policy impact of the RPS by exerting market power. Thus, the regulatory authorities need to take effective regulatory measures to ensure the smooth implementation of the power sales side RPS policy.
The effect of the power sales side RPS government regulation is the result of a strategic interaction between competitive power sales companies and government regulatory agencies [
65]. Nasiri [
66] constructed a coupled constrained game model and analyzed the interaction of power producers and government regulation authorities under the RPS policy. Pineda [
67] established the Cournot game model of power generation group expansion based on the RPS policy and discussed the correlation between penalty and RPS quota through a case study. Son et al. [
68] established a game model between two types of power producers under the RPS policy and studied the best operational strategies of Korean power producers based on a scenario analysis. However, their studies are based on the complete rational hypothesis, ignoring the limited rationality of relevant game agents and the learning between game groups in the process of repeated games [
69]. In real life, due to the uncertainty of the environment and the incomplete information of the market, game agents have only a limited rationality [
70]. Yi et al. [
71] discussed the behavior strategy of electricity producers under RPS and argued that the stage descent mode of subsidy and a higher level of fine would improve the enthusiasm of electricity producers for the RPS scheme. Zhu et al. [
72] developed a system dynamics model of a tripartite evolutionary game to analyze the strategy interaction of stakeholders and to simulate the corresponding evolution process, and the results revealed some policy effects such as a reversal effect, blocking effect, and over-reliance effect. However, previous research considered only the static reward–penalty mechanism rather than the impact of the dynamic reward–penalty mechanism.
This paper systematically studied the effectiveness of the power sales side RPS government regulation mechanism. Based on the existing research, we considered the competitive relationship between integrated power sales companies and independent power sales companies, and established an evolutionary game model between the government regulation agencies, the integrated power sales companies, and the independent power sales companies to analyze the impact of strategic interactions. As the government regulation process of the power sales side RPS is a complex multi-variable, high-order, and nonlinear dynamic feedback system with obvious system dynamics characteristics [
73], we simulated and analyzed the dynamic behavior of game agents under different reward–penalty mechanisms based on the system dynamics theory. The relevant conclusions are drawn in the end.
3. Evolutionary Game Model of Power Sales Side RPS Regulation
At present, after the power sales side reform, there are mainly two types of power sales companies in China: integrated power sales companies and independent power sales companies. What is more, provincial government regulation agencies are accountable for the power sales side RPS regulation. Therefore, the main game agents of the power sales side RPS regulation are government regulation agencies, integrated power sales companies, and independent power sales companies. The probability of government regulation agencies regulating the strategy selection of power sales companies is , and that of them deregulating the strategy selection of power sales companies is . The probability of integrated power sales companies obeying the RPS regulation is , and that of them disobeying the RPS regulation is . The probability of independent power sales companies obeying the RPS regulation is , and that of them disobeying the RPS regulation is . Other assumptions are as follows:
Assumption 1. RPS policy requires all of the power sales companies to obey the regulation and fulfill their obligation. The proportion of renewable energy in the power products sold by electricity sales company should reach. Power sales companies that exceed their RPS obligations will receive rewards, with the unit reward standard being. Power sales companies that fail to fulfill their RPS obligations will get punished, the unit penalty standard being.
Assumption 2. When government regulation agencies select the regulation strategy, the average regulation cost is. When power sales companies fulfill their RPS obligation, the unit social environmental benefit is, and the total social environment benefit is. When the government regulation agencies select the deregulation strategy, the corresponding reputation losses are.
Assumption 3. The sales scale of integrated power sales companies is, and the sales scale of independent power sales companies is. Since integrated power sales companies own generation resources, they are more competitive than independent power sales companies, and the proportion of renewable energy power sold by integrated power sales companies is higher than that of independent ones. Therefore, this paper assumes that the proportion of renewable energy in the power products sold by integrated power sales companies that do not fulfill their RPS obligation is. In order to fulfill the RPS quota obligation, the proportion of renewable energy in the power products sold by integrated power sales companies that fulfill their RPS obligation, by way of purchasing the green certificate, is, and the proportion of renewable energy in the power products sold by independent power sales companies that fulfill their RPS obligation is. Meanwhile, the proportion of renewable energy in the power products sold by independent power sales companies that do not fulfill their RPS obligation is, where.
Assumption 4. The corresponding unit price difference income obtained by integrated power sales companies for the sales of power products is. Therefore, the sales revenue of integrated power sales companies is, and the sales revenue of independent power sales companies is. As integrated power sales companies have a large price gap due to the simultaneous mastery of upstream and downstream industries,.
Assumption 5. Under the market-oriented green certificate trading mechanism, power sales companies mainly fulfill their RPS obligation by purchasing green certificates. Assume that the price of the green certificate is. Since the number of green certificates that power sales companies need to purchase is, the cost of the green card for the cumulative expenditure of electricity-selling enterprises is.
Assumption 6. As power sales companies can make other, different services in addition to the purchase and sale of electricity, they can also carry out other ancillary services. Therefore, the cost for power sales companies to purchase the green certificate goes along with a certain opportunity cost. The unit opportunity cost iswhen power sales companies do not fulfill their RPS obligation by purchasing the green certificate and transfer the capital to other auxiliary services. The corresponding opportunity cost benefit is:.
Assumption 7. In order to encourage power sales companies to exceed the RPS obligation, the amount of reward provided by the government to power sales companies that exceed the RPS quota indicator is. At the same time, in order to regulate and guide the behavior of power sales companies, the government imposes a penalty amount ofon power sales companies that have not completed the RPS obligation. When both types of power sales companies fail to fulfill their quota obligations, the penalty is aggravated,.
The tripartite income matrix is shown in
Table 1.
In the government regulation evolutionary game of RPS on the power sales side, it is difficult for decision makers to make the optimal strategy choice, because of their limited information collection ability. They usually make dynamic strategic selections by means of learning and imitating those with higher returns. The dynamic replicator equation means that the frequency of individuals’ strategies changes proportionally to the frequency of the group’s strategies and to the magnitude at which individuals’ fitness exceeds the average fitness of the group.
and
respectively represent the expected returns of the government group that regulates and the one that deregulates, and
represents the government group. The overall expected return, shown as follows, is the dynamic replicator equation
of the government regulatory agency:
The replicator dynamic equation is actually a dynamic differential equation to describe the frequency of a particular strategy being adopted in a population. The evolutionary game replicator dynamic equation of the government regulatory agencies is:
The probability of integrated power sales companies obeying the regulation is
, and the probability of them disobeying the regulation is
, respectively.
and
are used to represent the expected returns of the two groups of integrated power sales companies that choose a fulfillment strategy and a non-fulfillment strategy, respectively.
represents the average expected return of integrated power sales companies; then, the dynamic replicator equation
of integrated power sales companies is as follows:
The evolutionary game replicator dynamic equation of integrated power sales companies is:
The probability of independent power sales companies obeying the regulation is
, and the probability of them disobeying the regulation is
.
and
are used to represent the expected returns of the two groups of independent power sales companies that choose a fulfillment strategy and a non-fulfillment strategy, respectively.
represents the average expected returns of independent power sales companies. Then, the dynamic replicator equation
of independent power sales companies is as follows:
The evolutionary game replicator dynamic equation of independent power sales companies is:
According to the replicator dynamic equation, we make
, and the specific expression of
is shown in formula (13):
According to , we can obtain the critical point, which is the equilibrium solution of the established multi-party evolutionary game model. There are multiple critical points in the equation group, indicating that there are multiple equilibriums in the multi-party game model. Nevertheless, whether there is a stable evolutionary equilibrium in these equilibrium solutions is not known from the mathematical derivation process. In order to more intuitively analyze the changes in the policy choices of the game evolution process, this paper used the system dynamics (SD) to establish an evolutionary game model between the government and the two sales-oriented enterprises, and analyzed the impact of different game initial values on the game evolution process.
4. System Dynamics Analysis of the Evolutionary Game Model
Although power sales companies are positively influenced by the consumption of renewable energy, they have to bear corresponding costs in fulfilling the renewable energy quota obligation. Therefore, they cannot automatically realize the optimal allocation of resources. The reward–penalty mechanism has proven to effectively guide and motivate enterprises to conduct long-term social cooperation and curb the occurrence of free-riding behavior. This mechanism includes both positive incentives, rewards, and negative incentives. Through two-way incentives, the efficiency of regulation can be improved while the cost of government regulation can be reduced. In addition, the mechanism is related to the choice of the behavior of the players involved in the game. The atmosphere is either static or dynamic. Under the static reward–penalty mechanism, reward and punishment are constant. In contrast, under the dynamic reward–penalty mechanism, the player’s behavior and strategy choices will be considered at the same time. With the competition relationship and relative execution degree between the supervised parties, the reward–penalty mechanism will be dynamically adjusted along with the relative changes of behavior of the supervised parties.
System dynamics is a science that uses computer simulation technology as a means to combine qualitative analysis with quantitative analysis to study system information feedback. In the government regulation of the RPS on the electricity sales side, more complex nonlinear interactions and feedback causality are involved. Therefore, with the help of venPLE32 software, this paper established a dynamic model of a government regulation system for an energy quota system based on a static reward–penalty mechanism and a dynamic reward–penalty mechanism. The system dynamics simulation environment was set as follows: INITIAL TIME = 0, TIME STEP = 0.0078125, and Units for Time was taken as months.
First of all, based on the reality of China’s electricity market and related data, this paper set the initial state parameters for the government regulation model of the RPS on the electricity sales side. The basic situations of the model variables are shown in
Table 2 and
Table 3:
4.1. System Dynamics Simulation of the Static Reward–Penalty Mechanism
The static reward–penalty mechanism refers to the static situation in which the competition between power sales companies is not considered. The punishment or reward measures depend on the absolute difference, and the specific expression of the static reward–penalty mechanism is shown in Formula (14):
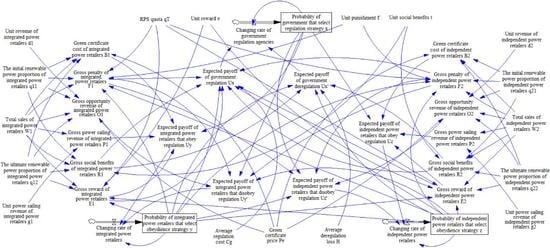
Correspondingly, the system dynamic flow diagram under the static reward–penalty mechanism is shown in
Figure 3.
The evolutionary process of government regulation authorities and the two types of power sales companies is shown in
Figure 4.
It can be obtained from the evolution process of
Figure 4 that: Under the static reward–penalty mechanism, the government regulatory authorities will actively strengthen the regulation of the RPS on the sales side in order to achieve a renewable energy development and obtain social environmental benefits. In the initial stage of policy implementation, the government’s strategic selections can play a good guiding role, in which case both types of power sales companies tend to choose to fulfill their quota obligations. As the proportion of power sales companies fulfilling quota obligations increases, the government regulatory authorities will reduce regulation costs and relax regulation. What is more, when the government strengthens regulation, power sales companies tend to fulfill their quota obligations. In contrast, as the government slackens regulation, the probability of power sales companies fulfilling their quota obligations will decrease accordingly. The reason is that fulfilling the RPS quota obligation will increase the cost of electricity-selling enterprises in spite of the external benefits it brings in. Therefore, with the relaxed government regulation, the power sales companies lack the initiative to assume the RPS quota obligation in order to maximize their own interests. Observing the deregulation of government departments, they tend to choose not to strengthen the safety regulation. When the probability of independent electricity sales enterprises fulfilling the RPS obligation drops to a certain extent, the government regulation department will gradually intensify their regulation in order to ensure the implementation effect of the electricity-sales quota system. Repeatedly, the volatility shown in
Figure 3 appears.
The volatility phenomenon in the process of the government regulation of the RPS also widely exists in social life. With the aggravation of environmental pollution caused by enterprise production, relevant government regulatory agencies often adopt strict regulatory measures in the initial stage to obtain better regulatory effects. However, as the power sales companies consume more renewable power, government regulation agencies tend to relax regulation measures. When companies notice the relaxed regulation, they will gradually loosen pollution control in order to save relevant costs and expand income, leading to an increase of environmental problems. In turn, the government regulatory authorities have to impose heavier punishments again, resulting in the volatility shown in
Figure 4. The unsustainability of this regulatory approach is very detrimental to the sustainable development of the power sales industry.
It can be seen that strict reward and punishment measures are a powerful guarantee for the smooth implementation of the RPS on the electricity sales side. A constantly adjusting and revised policy is not only unfavorable to market participants’ expectation of a long-term and stable policy, but also burdens policy implementation and regulation. At the same time, volatility in the game process easily affects the judgment of the government regulatory authorities, and even arouses doubts on the validity of established regulatory policies. This, indeed, is detrimental to decision-makers taking correct and reasonable strategic selections. However, it does not work to rely solely on increasing punishments to better implement the RPS. Though excessive punishments will enhance the authority of government regulation, it is not conducive to the healthy development of the social economy. Thus, we introduced the dynamic reward–penalty mechanism in this paper.
4.2. System Dynamics Simulation of the Dynamic Reward–penalty Mechanism
It is necessary to promote the sustainable regulation of the power sales industry. Thus, we further proposed a dynamic regulatory mechanism. The dynamic reward–penalty mechanism in this paper means that the incentives and punishments of regulatory authorities are related to the strategic selection of the two power-selling enterprise groups. It considers the competitive relationship between the power sales companies. If a group of power sales companies sell more renewable power than another group, the penalty will be lower and the rewards will be higher, with the specific expression of the dynamic reward–penalty mechanism shown in Formula (15):
Correspondingly, the system dynamics flow diagram under the dynamic reward–penalty mechanism is shown in
Figure 5.
The evolutionary stable equilibrium and the evolutionary process of government regulatory authorities and of the two types of power sales companies are shown in
Figure 6.
From the evolution process of
Figure 6, it can be obtained that under the dynamic reward–penalty mechanism, the volatility gradually decreases and finally reaches the equilibrium point of evolution and stability. The dynamic reward–penalty mechanism that considers competition effectively suppresses the volatility in the regulatory process. If the reward and punishment are adjusted in real time in line with the different proportions of the two power-selling enterprise groups fulfilling the RPS quota obligation, the evolutionary game will have just one evolutionary equilibrium, and the regulatory effect will be better with the regulation cost being lower.
Based on the above analysis, it can be seen that under the static reward–penalty mechanism, the evolution process of the strategic selections of all parties is volatile, and that there is no stable equilibrium. Given the dynamic reward–penalty mechanism of competitive relations, power sales companies must bear the vertical pressure brought by government regulation and face the horizontal pressure brought by competitors in the same industry. At the same time, the dynamic reward–penalty mechanism has a strong flexibility, whose overall incentive effect is significantly better than that of the static reward–penalty mechanism. The dynamic one can effectively suppress volatility while ensuring the regulation effect, and helps achieve a better stable equilibrium state. The sustainability of this regulatory mechanism is of far-reaching significance for the sustainable development of the power sales industry in China. Therefore, it is more effective than the static one in terms of regulation.
4.3. Stability Analysis of Equilibrium Points
In order to further verify the equilibrium point of the game model and analyze the strategy selection of government regulation agencies and the two types of electricity sales companies under the dynamic reward and punishment mechanism, the replicator dynamics equation can be rewritten as Formula (16):
When the variables are substituted into the replicated dynamic equations, it can be further expressed as Formula (17):
With the help of Matlab software, there are nine solutions to this equation:
,,, ,,,,, .
According to the method proposed by Friedman in 1991 [
39], this paper further analyzed the stability of each equilibrium point by using the Jacobian matrix. The specific expression of the Jacobian matrix is shown in Formula (18):
In the Jacobian matrix, the specific element expression is shown in Formula (19):
By substituting each equilibrium point, the characteristic value of the Jacobian matrix corresponding to each equilibrium point can be obtained, and the attributes of each equilibrium point can be further determined. The results are shown in
Table 4.
Based on the above analysis, we found that the evolutionary stable equilibrium point (ESS) of the power sales side RPS government regulation game is ; that is, under the dynamic reward and punishment mechanism, although only about 25% of government regulation agencies select a strict regulation strategy, nearly 77% of integrated power sales companies and 90% of independent power sales companies choose to actively consume renewable energy power and to select fulfilling the power sales side RPS regulation strategy.
5. Impact Analysis of Exogenous Variables
5.1. Impact of the RPS Quota Indicators
The RPS quota indicator is critical for the implementation of RPS policy. It has a significant influence on many other variables in the model and the game evolution process.
Figure 7,
Figure 8 and
Figure 9 respectively indicate that the RPS quota indicator
is 0.03, 0.09, and 0.15 in the regulatory game evolution process.
Through analysis, it is not difficult to find that when the RPS quota ratio is low, the punishment is insufficient, which makes it impossible to effectively guide the two types of electricity sales enterprises to fulfill their quota obligations. In consequence, the regulation effect is poor. With the increase of the RPS quota, the punitive punishments faced by the two types of power sales companies are aggravated, and the negative incentive effect of the punishment is enhanced. However, when the proportion of RPS quota increases, the intensity of the regulation decreases first and then rises. The main reason is that as the probability of sales companies fulfilling their quota obligations increases, the government will gradually loosen regulation and the regulation costs will gradually decrease. When the RPS quota indicator is set too high, enthusiasm of the power sales companies fulfilling their obligations diminishes, which makes the government regulation agencies increase the regulatory input to achieve the established policy objectives. Thus, when formulating RPS quota indicators, the government should comprehensively consider various influencing factors to work out appropriate quota indicators.
5.2. Impact of the Green Certificate Price
Existing research shows that in the implementation process of RPS, it is necessary to make effective use of the green certificate trading mechanism to achieve a better regulation effect. Therefore, this study also analyzed the impact of changes in the green certificates price on the regulatory effect.
Figure 10 and
Figure 11 respectively show the process of strategy selection for integrated power sales companies and independent power sales companies when
.
As the price of green certificates rises, the cost for power sales companies to fulfill RPS obligations mounts. In order to maximize their profits, power sales companies, be they integrated ones or not, prefer to be punished and are not willing to fulfill their RPS obligations. Both integrated power sales companies and independent power sales companies tend to choose not to fulfill their RPS obligations.
Figure 12 shows the evolution of the strategic selection of government regulators when the green certificate price
is 0.05, 0.1, and 0.15.
The higher the green certificate price is, the higher the proportion of government regulatory agencies selecting a regulatory strategy will be. Government regulation agencies can effectively guide the strategic selection of power sales companies through the perfect green certificate trading mechanism and the green certificate price signal, achieve established RPS policy objectives, and reduce the regulatory costs as much as possible through the market mechanism.
5.3. Impact of the Size of the Electricity Sales Market on the Evolution Process
China is in a critical period of power system reform, and the power market reform seems to be in deep water. In order to further consider the impact of the scale of the electricity sales market on the regulatory process and the regulatory effect, this paper further discusses the sales of
and
for the two types of power sales companies. The influence of electric power sales on the regulatory evolution game is shown in
Figure 13 and
Figure 14.
A comparison found that when the size of the electricity sales market doubles, the final market equilibrium will not change much, while the number of iterations required to achieve a stable equilibrium state in the sales-side quota system regulation game will be greatly reduced; that is, the size of the electricity sales market becomes larger. The shorter the time to achieve the established regulatory objectives, the better the regulatory effect. Therefore, when composing government-regulated policies for the power sale side RPS system, China should further promote power market-based transactions and expand the scale of market-oriented transactions.
6. Conclusions
Sustainable regulation in the implementation process of RPS is of far-reaching significance for China’s power sales market. In this paper, we considered the competitive relationship between power sales companies based on a limited rationality, and analyzed the effectiveness of static and dynamic regulation mechanisms. The regulation effects of the static reward–penalty mechanism and the dynamic reward–penalty mechanism were simulated with a system dynamics (SD) model. Finally, we analyzed the impact of several major external variables on the implementation of the power sales side RPS regulation. In general, we reached the following conclusions:
1. Due to the introduction of competitive factors in the regulation process of the RPS policy, the dynamic reward–penalty mechanism has a better regulatory effect than the static reward–penalty mechanism, and the former can effectively restrain evolutionary volatility. This is helpful for promulgating long-term policies, guiding power sales companies to obey the RPS regulation, promoting the implementation of the RPS policy, and ensuring the sustainable development of the power sales industry.
2. An RPS quota indicator that is too high or too low is not conducive to achieving the established policy objectives. Therefore, government regulation agencies should set a moderate and reasonable quota indicator system in the process of formulating and implementing the power sales side RPS policy.
3. An excessively high green certificate price is also not conducive to achieving the established policy objectives. It can be seen that the green certificate trading system is an important guarantee for the smooth implementation of the power sales side RPS policy, which can optimize the fulfillment cost of power sales companies through the market trading mechanism. Thus, it is important to promote the construction of the green certificate transaction market and change the renewable energy industry gradually from being policy-oriented to being market-oriented.
4. The simulation results show that the market size of power sales companies also significantly influences the implementation of the RPS regulation. The implementation of the RPS regulation is much more effective when the market size of power sales is greater. Thus, it is necessary to further promote the market-oriented reform of the power industry and expand the scale of the electricity sales market during the implementation of the RPS regulation.
However, there are still some limitations in our study, since the power sales side RPS regulation is a systematic project. An effective solution to this problem is the result of strategic interactions among many relevant stakeholders. The model in this paper only considers the interaction among government regulation agencies and the two kinds of power sales companies, and does not consider the impact of power generation companies. At the same time, with the development of neural network methods, it becomes possible to build an evolutionary game model based on neural networks theory, which is more conducive to the analysis of the implementation issues of RPS policy. Therefore, in future research, we will incorporate other stakeholders into the analytical framework, and analyze the RPS regulation of the power industry in a more comprehensive manner based on neural networks theory and evolutionary theory.


