1. Introduction
To attend academic competition is an effective way to test teaching and learning performance, and it has a positive impact on students’ scholarly motivation and study habits in education [
1]. Academic competition is a series of activities to find and solve problems through practical activities outside the classrooms, which is an effective measure to identify and train young talents [
2,
3,
4,
5].
So, attending academic competitions is very beneficial to students. The academic competitions can improve students’ study effectiveness during study activities, and enhance the students’ collective efficacy as well as their awareness of collaboration and communication.
In China, application-oriented universities attach great importance to academic competition. Tutors are assigned to train students before the competition. However, there are two difficulties during the competition organization. Students lose the chance to win the prize due to not taking part in the competition. Tutors find it hard to select potential students since the number of students is too large. To achieve good results in the competition, it is very important to select potential students. Tutor observation or practice tests can select students who have outperforming performance. These methods are biased by the tutors’ knowledge and experiences. Moreover, they are not suitable if there are too many students involved in the selection.
In this study, a prediction model is proposed to predict and analyze student performance in academic competition. By applying data mining to the students’ background data and behavior data, the model predicts the competition results and then identifies key features, which affect prediction results. This work has practical reference values to tutors on conducting and encouraging the potential students to attend the academic competitions.
2. Related Work
In recent years, it has become more and more popular to apply the machine learning methods to student performance prediction in different educational scenarios, and data sources used in the prediction have covered many subjects. A method was proposed to predict “At-risk Learners” [
6,
7,
8] or end-of-learning performance [
9] through analytics of online learning behavior data. Some researchers analyzed data in the course management system or student demographic information data to identify the factors that affect academic performance, and the research studies revealed the main factors include language family [
10], sleep habit [
11], computer usage [
12,
13], and so on. Other research focused on behavioral data collected in the classroom, which were used to analyze the correlations between test scores and different courses, and predicted a pass probability of the specific subjects [
14,
15] or degree qualified probability. Based on these analysis results, tutors can take interventions accordingly to optimize student learning efficiency. In terms of the construction of the academic performance prediction model, many researchers tend to adopt traditional machine learning methods, such as logistic regression, decision tree, artificial neural network (ANN), and support vector machine (SVM). These methods have been confirmed to be able to improve the prediction performance according to current studies. For example, Kotsiantis et al. [
16] applied six algorithms (C4.5, back propagation, naive Bayes, 3-nearest neighbor, logistic regression, and sequential minimal optimization) to train the data set to predict poor performers, they found that the naive Bayes algorithm had better performance on satisfying accuracy. Romero et al. [
17] compared the performance of different machine learning methods (decision trees, fuzzy rule induction, and neural networks) for predicting final marks of students. In the study, they applied discretization and rebalance preprocessing techniques to get better classifier models.
Ensemble learning [
18] is the process by which multiple models (like classifiers or experts) are strategically generated and integrated to solve a computational intelligence problem. It uses multiple learning algorithms to get a better prediction performance than the performance obtained from a single algorithm. It has been applied to a wide range of topics in classification, regression, feature selection, and abnormal point detection. For instance, Beemer et al. [
19] proposed an ensemble learning approach to estimate individualized treatment effects (ITE) to characterize at-risk students and to assess student success and retention under intervention strategies. The work by Ade Roshani and Deshmukh P. R. [
20] applied an incremental ensemble consisting of three classifiers (naive Bayes, K-star, and SVM) and used a voting scheme to predict the career of students. Kotsiantis et al. [
21] applied the ensemble methods to predict student success in distance learning with three different techniques (WINNOW, naive Bayes, and 1-nearest neighbor). These studies have confirmed that the ensemble model is more likely to attain higher accuracy than the single algorithm.
In summary, at present many studies have been done to predict students’ academic performance in traditional classrooms or online learning platforms. These studies presented very interesting and reasonable results. The study on the prediction in the academic competition has been of concern to researchers.
3. Contribution and Paper Structure
A lot of relevant information can be collected in an academic competition, such as a student’s demographic information, behavioral information (generated by students’ daily study, and participation performance in competitions). It is almost impossible for a tutor to discover whether they have a connection with a student by personal experience alone when faced with a sizeable amount of data. Therefore, machine learning is a practical way to solve this problem.
In this study, we collect and construct a data set about the students’ performance in academic competition. The data set contains all the information regarding participated students and their competition results (winning or losing the competition). Learning in a supervised fashion was used to discover structures in the data set, and the machine learning methods were applied to train a model that can explain the data. At the same time, we used this model to predict new data, and to identify the key features that affect students’ performance through feature importance analysis. The analysis results can be provided to tutors or managers, to be used as references for candidate selection.
Let
represent the set of
n characteristic variables for a student and
represents the student’s competition results. The
has two possible values, winning or losing the competition, which is encoded as 1 and 0, respectively. So given the perspective of machine learning, candidate selection for student performance prediction in academic competitions can be formulated as a binary classification problem by grouping students into two symmetrical classes. The relations between characteristic variables and the target variable can be described as Equation (1).
where
represents an unknown function, which is the prediction model we intend to train using the collected data,
is the error between the true target variable y’s value for each student and the predicted value from the prediction model. The goal of the binary classification problem is to train a model that can predict the output of the target variable
when given a series of input variable
. The prediction
of a new student
can be attained by
.
In this study, a novel ensemble model based on stacking is proposed to predict student performance in academic competitions. This study tries to answer two questions:
• How can we improve the model prediction performance with an ensemble strategy?
• The predictive results need to be understandable. So how can we identify significant features? What suggestions can be made for tutors/managers based on the analysis results?
In this paper,
Section 4 introduces the proposed ensemble model in detail. In
Section 5, we describe the detailed analysis flow of the proposed ensemble learning model for a real data set. The validity and robustness of the model were verified, and the feature importance analysis was conducted by the model. The experimental results are presented and discussed in
Section 5. In
Section 6, we conclude and present a brief outlook for future studies.
4. Method
Different learning algorithms yield different results on the regression or classification problems. As the learning results from different algorithms are different, it is possible to improve the final prediction performance for each algorithm, so that better results can be obtained with the combined learning algorithms when compared to the results obtained by using a single algorithm [
22]. Ensemble learning is designed to boost predictive performance by blending the predictions of multiple algorithms.
Ensemble learning has been commonly used in machine learning on a variety of classification and regression tasks to improve performance by grouping individual algorithms. Several types of ensemble methods, such as voting, averaging, bagging, boosting, and stacking, have been proposed. Stacking is an efficient heterogeneous ensemble method. It has been widely used in data mining competitions in recent years. It can be regarded as a super multi-layer perceptron. Each layer includes one or multiple models, and the next layer learns from the results of the previous layer of the model. In machine learning, many models are used to solve a binary classification problem, including regression algorithm, decision tree algorithm, kernel-based algorithm, Bayesian method algorithm, clustering algorithm, etc. The stacking can be integrated easily with different classifiers or regression models to improve robustness and generalization in a single model.
4.1. The Proposed Ensemble Model
In this study, we constructed an ensemble model using 2-layer stacking. The learning algorithms used in the first layer are called the Base-learner, and the algorithm in the second layer is called the Meta-learner respectively. The Meta-learner is used to combine the prediction results from all Base-learners.
The construction procedures of the prediction model can be described by the steps below:
Step 1. Divide the data set into training sets and test sets;
Step 2. Construct a new data set based on the output of Base-learners;
Step 3. Train the Meta-learner to output the final prediction result based on the newly constructed data set.
The 2-layer stacking model can be used to combine machine learning algorithms to boost predictive accuracy. When constructing the stacking ensemble model, the selection of the Base-learner and Meta-learner affects model performance.
The premise of using stacking to improve the classification effect is that the Base-learner should have a good prediction performance. In general, stacking will work best if the algorithms being combined are in some sense very different from one another. So, the bigger differences in the classification principle between these Base-learners, the more complementary they can be in the process of an ensemble. The classification results will be optimized accordingly. These strategies were applied to select the Base-learners in the first layer. Random forest (RF) [
23,
24,
25], SVM [
26,
27,
28], and AdaBoost [
29,
30] classifiers were chosen in this study to be the Base-learners due to their better classification performances. They are commonly adopted as predictive models for student achievement prediction at present and have good performance. The RF and AdaBoost algorithms were used for classification since they are both excellent ensemble algorithms based on decision trees, whereas RF produces multiple decision trees based on a randomly selected subset of training samples and variables. RF [
27] does not need to assume a data distribution and can handle thousands of input variables without variable deletion. However, the tree structure of RF is unstable and may overfit training data, and therefore its generalization performance is poor. The SVM is a powerful and flexible machine learning model and can perform linear or nonlinear classification. The SVM is particularly well suited for the classification of complex data with small- or medium-size data sets. Although linear SVM classifiers are efficient and perform well in many applications, it works only for the linearly separable data and it is very sensitive to outliers. The AdaBoost emphasizes adaptivity through frequently modifying the sample weights and adding weak classifiers to boosting. The AdaBoost is sensitive to noisy data and outliers, and it is less susceptible to the overfitting problem than most of the other learning algorithms. These three models have their advantages and disadvantages when they are applied to the prediction of student performance.
Appendix A of this paper provides detailed elaborations of the SVM, RF, and AdaBoost algorithms. The Base-learner in the stacking used a well-performed model in pursuit of adequate learning during data training. Therefore, the stacking is more prone to overfit the training data. To reduce the risk of overfitting, the Meta-learner tends to select simple models, such as logistic regression, lasso regression, and so on. We chose logistic regression as the Meta-learner in our study. Logistic regression is the basic model for the prediction of a dichotomous dependent random variable. Logistic regression does not have high general accuracy and is prone to underfit the training data. In addition, it is not suitable to deal with nonlinear features [
31]. However, logistic regression is a good choice for the prediction of success in a course or program [
32].
Appendix A of this paper provides a detailed elaboration of the logistic regression algorithms.
Finally, the SVM, RF, and AdaBoost classifiers were used as the Base-learners, and logistic regression was adopted as the Meta-learner in this study. An ensemble model using stacking was constructed as illustrated in
Figure 1.
The characteristic variable
x represents the student data, and the data are classified into three major types of information. The first type is the student’s background information, the second type is the student’s behavior data during the competition, and the last type is the student’s daily academic performance. These raw variables are then divided into two types, one is numerical and the other one is categorical, as listed in
Table 1.
At first, each Base-learner provides a probability that a sample belongs to each class, or . Each classification model has two attribute prediction probabilities, so six prediction probabilities are obtained in total for each student sample. Secondly, the predicted attribute probability values from the Base-learner are provided for the Meta-learner as its input. The actual class label will be used to learn and then get the final prediction model . In the end, the final class label of prediction results will be given by the .
4.2. 10 × 10-Fold Cross-Validation
In 10-fold cross-validation, the data set is randomly divided into 10 equal parts. In turn, nine of them are taken as the training set and the other one is used as the testing set. The mean value of predictive results from the 10 turns is regarded as the evaluation result of the model [
33].
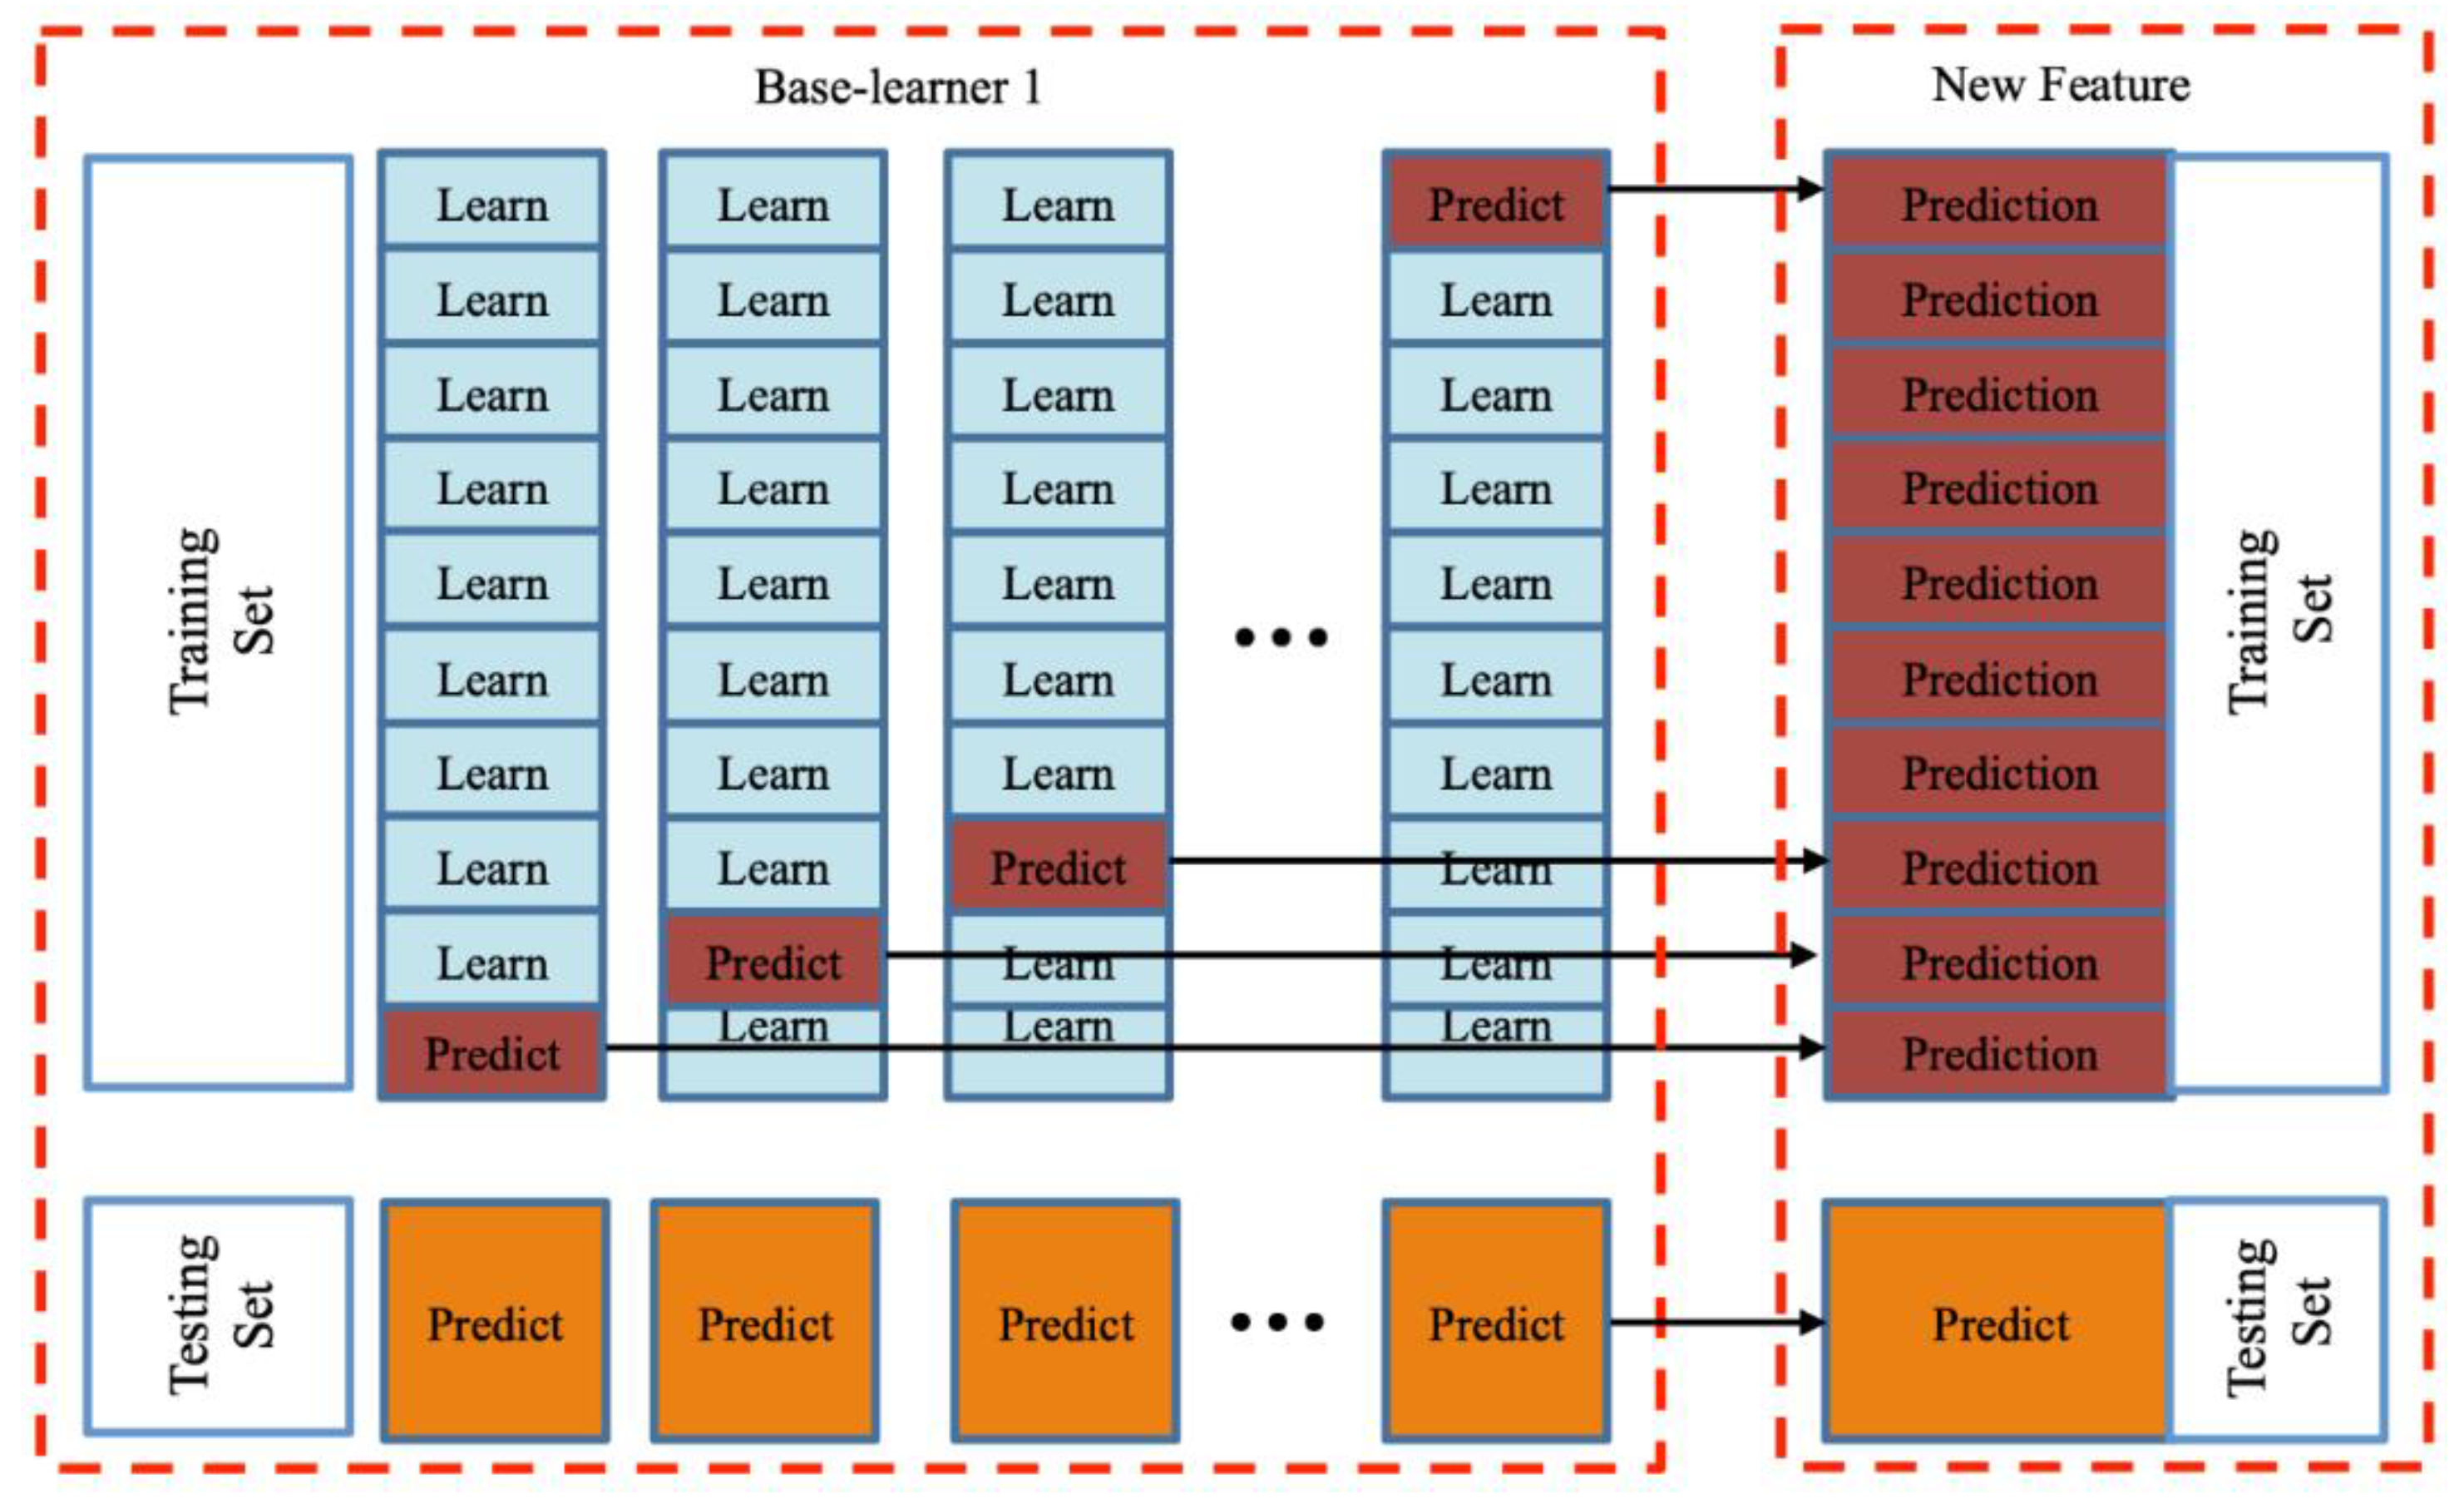
While training a Meta-learner, the test results of the training set need to be characterized by learners from the previous layer. If we train the learner and then predict it in a training set, this will cause a label leak. A label leak means that the training models and prediction results display the personal information of participants that are contained in the data set. A label leak should be avoided when the stacking is applied. To avoid label leak, we use another 10-fold cross-validation in each training set. As shown in
Figure 2, each Base-learner uses 10-fold cross-validation to generate a new feature in this study.
Given the initial sample set is
, where
yn is a class label
and
represents the characteristic variable. The sample-set is randomly divided into 10 subsets with the same size and the subsets are defined as
. We chose one of these subsets as a testing set each time, and the remaining subsets were regarded as training sets. We used the 10-fold cross-validation as shown in
Figure 2 for each original training set. Taking the
th Base-learner as an example, each round of training and testing will produce two possible results,
and
. Here the
and
are given by the
th Base-learner, and they represent the probabilities of the prediction result of the
ith sample belonging to the class with label y = 0 (losing in competition) and
(winning in competition), respectively. Once the prediction results are obtained from the three Base-learners, all the probabilities will be concatenated together to form a new feature vector.
As shown in
Figure 3, the feature vector is expressed in the form of a
matrix, represented by
L in this study. In the matrix,
is the number of samples in the training set, and each Base-learner contributes two dimensions.
5. Experiment Studies
5.1. Data Collection
Data were collected from Hankou University, and included the records of undergraduate students who had participated in at least one national academic competition from 2015 to 2018 academic year. In total, 684 competition records containing 486 students are present in the data. There are 86 academic competitions covering multiple categories, such as engineering, literature, science, art, and so on. In addition, there are some comprehensive competitions included, such as innovation and entrepreneurship competition, skill competition, etc. We regard the 1st prize, the 2nd prize, and the 3rd prize awarded in the competitions as winning in this study.
For each student, eleven variables were defined, as described in
Table 1. Ten of them are characteristic variables, and they are derived from the demographic information and the behavioral information of students. The above information was gathered from students’ daily study performance and behavior in participating competitions. These variables were taken as inputs of the prediction model. The result of the competition was defined as the target variable. Data masking was applied to the data set to mask private or sensitive information before analysis.
5.2. Data Preprocessing and Description Analysis
Data preprocessing was conducted in the following steps: At first, seven of these raw variables were categorical variables, including gender, specialty, subject category, etc. They were converted to the numerical values by integer encoding. For example, Freshman, sophomore, junior, and senior are set to 1, 2, 3, and 4, respectively. Secondly, frequent itemsets were used to substitute the missing values.
The density distributions of specialty and enrollment_c were grouped according to the results of the competition as shown in
Figure 4a. The density distributions of source_l and enrollment_c were grouped according to the gender as shown in
Figure 4b. Generally, the enrollment_c and gender of students are evenly distributed, and engineering students are prone to participate in competitions.
Table 2 shows the descriptive analysis results of the preprocessed four academic years’ data. Skewness was used to calculate the skew direction and degree of statistical data distribution, and it is a digital feature of the degree of asymmetry of statistical data distribution. As shown in
Table 2, most students chose to take part in academic competitions during sophomore and junior years. Different students have a different number of participations as shown in
Table 2. For example, a student may participate in more than one academic competition.
The frequency distributions of the
and
are shown in
Figure 5a,b, respectively. In short, both the
and
are described well by the normal distribution. In total, 159 of 486 participated students won in the national academic competitions.
5.3. Classification Performance Indicators
The models considered in this study were evaluated by five performance measures: , , , error, and (). The outputs of classifiers are summarized in four groups: The students who won the competition were correctly labeled as winner (); the students who lost the competition were incorrectly labeled as winner (); the students who lost the competition are correctly labeled as loser (); the students who won the competition are incorrectly labeled as loser ().
The
Precision and
Recall are calculated by Equations (2) and (3) as below:
Equation (2) indicates the precision metric as the fraction of students who won the competition over the students predicted as the winner. Indeed, the larger number of
FP, the lower precision of the classifier. Moreover, to investigate the ability of the classification model in predicting all winners, we used the recall metric as defined in Equation (3). In other words, the recall metric represents the fraction of the students who are correctly labeled as a winner over the whole number of winners. It is worth mentioning that more students being labeled as winner will lead to high recall and low precision. The harmonic average of precision and recall, called
, is also considered in this study and is described as:
The
F1 estimates the quality of classification for both winner and loser, simultaneously. Equation (5) below defines the measure
Error, which means the proportion of the students wrongly labeled as winner and the students wrongly labeled as losers over all participated students.
A receiver operating characteristic (ROC) curve is a graphical approach for analyzing the performance of a classifier. It uses a pair of statistics (true positive rate and false positive rate) to characterize a classification algorithm’s performance. The resulting plot can be used to compare the relative performance of different classifiers and to determine whether a classifier performs better than random guessing. The ROC curve is not affected by the changes of the sample distribution. The
value represents the area under the ROC curve. The larger the
value is, the better the classification algorithm is. The
is equivalent to the probability of the case that a randomly selected positive example is ranked higher than a randomly selected negative example [
34].
5.4. Results
In this study, an ensemble model using stacking was developed using the Python language within the Sklearn library framework in PyCharm. PyCharm is a python integrated development environment with a set of software that can help users improve their efficiency when developing in Python. The ensemble model was constructed using the RF, SVM, and AdaBoost as its three Base-learners, and logistic regression was selected as the Meta-learner. To test the effectiveness and stability of the proposed ensemble model, 10 prediction experiments were carried out. After performing the 10 rounds of the proposed ensemble model, the prediction results were obtained, as listed in
Table 3. The average value of the 10 rounds was calculated as the overall prediction performance of the proposed ensemble model. As shown in
Table 3, the
,
,
F1,
Error, and
are 0.8550, 0.8600, 0.85, 0.1460, and 0.9185, respectively.
The
values are classified in three performance levels with following thresholds:
> 0.9 (excellent), 0.7 <
< 0.9 (fair), and
< 0.7 (poor). The results shown in
Table 3 indicate that the proposed ensemble model has a better prediction performance.
To get further clarity of the prediction performance for the proposed model, a comparative study was carried out, in which several algorithms were selected for performance comparison. These selected single algorithms are commonly used in the existing studies for student performance prediction, including SVM, decision tree, logistic regression, and Bernoulli naive Bayes (BernoulliNB). The experimental results of the comparative study are summarized in
Table 4.
The results reveal that the prediction performance of the proposed ensemble model in this study is better than the other four models with a single algorithm each. The prediction results in this study are used for competition candidate selection, therefore, the model focuses on the merits of the indicators labeled as 1. The Precision of the proposed model gets the highest value of 0.8710, which is followed by the SVM model. Using the proposed model, the probability of students being correctly labeled as 1 is 87.1%. The value of Recall in the proposed model is 0.8351, which is followed by the decision tree. Among the five models, the proposed model has the best performance with the value of 0.9138. At the same time, the proposed model has the lowest error rate compared to other algorithms.
According to the comparison of ROC curves, as shown in
Figure 6, the areas under the curve (
) of all the five models are much larger than 0.5.
We performed a comparison study between the proposed ensemble model and several popular ensemble algorithms, including gradient boosting, RF, AdaBoost, and XGBoost. The average results and ROC curves of 10 rounds are listed in
Table 5 and
Figure 7, respectively.
The results in
Table 5 and
Figure 7 show that the proposed model achieves the best performance on those five indicators. Next, an independent
t-test was used to compare these models as shown in
Table 6. The resulting differences between models were assumed as statistically significant when
p < 0.05. These results show the statistically significant advantages of the proposed method compared to the other four models, particularly on
F1,
Error, and
. The proposed model is more efficient than AdaBoost on
and
.
5.5. Feature Importance Analysis
To enhance the interpretability of the model, we carried out a feature importance analysis in this study. The contribution of each variable to the prediction performance is shown in
Table 7. A feature importance analysis was applied to identify significant features based on a real data set. The Base-learners generate feature importance scores in different ways. The feature importance of the linear SVM is indeed the weight vector, which contains the coefficients, and these coefficients define an orthogonal vector to the hyperplane. The RF model measures the importance of the feature by calculating the corresponding out-of-bag (OOB) error. The AdaBoost generates feature scores by computing the normalized total reduction in the mean squared error, which is brought about by that feature with the sum of all feature importance levels equaling to one. The results of these methods are normalized, and the average value of the three normalized scores is the final level of feature importance.
Figure 8 shows the ranking of the important features computed from different models, and the features are shown in different colors.
According to the average scores shown in
Figure 8,
,
,
, and
are the top four for feature importance. The results show the student’s competition behavior and GPA play the most important roles in the model prediction performance, while the academic background is less important.
6. Discussion and Conclusions
Predicting student academic performance has long been an important research topic. In this study, we propose an ensemble model using 2-layer stacking to predict student performance in academic competition. In this model, several algorithms (SVM, RF, and AdaBoost) with accurate prediction performance were implemented as the Base-learners, and a relatively simple algorithm (logistic regression) was adopted as the Meta-learner to reduce the risk of overfitting, and we used 10 × 10-fold cross-validation to avoid label leak.
The empirical research based on the data collected from Hankou University shows that the proposed ensemble model has better prediction performance compared to other models. Through the features importance analysis, we found that the competition behavior and GPA of candidates play the most important role in predicting competition results, and academic background is not as the most important as expected. In the past, tutors and managers tended to pay more attention to students’ academic background and GPA, but ignored their behavior in participating in competitions. To a certain extent, students’ behavior in a competition can reflect students’ cognitive understanding of competition and personality psychological characteristics. For example, the total number of participants in academic competitions can reflect a student’s constancy of purpose in the competition. It is particularly important to pay more attention to the candidate’s competition behavior for competition candidate selection in the future.
In 2019, we used this model to assist the student selection for the Blue Bridge Cup (National Software Professional Talent Design and Entrepreneurship Competition sponsored by the Talent Exchange Center of the Ministry of Industry and Information Technology) in Hankou University. The Blue Bridge Cup is a programming competition that is held every year. The participants’ performance is ranked from high to low. The top 10% is the first prize, 20% is the second prize, and 30% is the third prize. About 30,000 college students from all over the country participated in the competition in 2019. It is difficult to win the prize, and in previous years the number of participants and awards of Hankou University were not positive. We imported the student data of three grades (computer major) into the model, and applied the results of prediction and feature analysis to the potential student selection Finally, 32 students participated in the competition, and 11 of them won the prize in 2019. Among them, one student was awarded the first prize, two students were awarded the second prize, and the others won the third prize in 2019. The number of winners and the proportion of winners increased significantly compared to the competition results in previous years.
Some research points should be paid more attention in the future study. First of all, the model should be applied to other universities in the future to further examine the stability and generalization of the model. Secondly, at present, it is a binary classification model. With the increase of data volume, we can research multiple classification models. More categories of competition results can be classified in the future to get more meaningful conclusions. Finally, the paper uses the traditional measures, such as , , F1, Error, and to evaluate the model performance. These are commonly used measures for classification problems in machine learning. In future work, it is necessary to find new suitable measures for specific education scenarios.


