Abstract
Blood vessel segmentation methods based on deep neural networks have achieved satisfactory results. However, these methods are usually supervised learning methods, which require large numbers of retinal images with high quality pixel-level ground-truth labels. In practice, the task of labeling these retinal images is very costly, financially and in human effort. To deal with these problems, we propose a semi-supervised learning method which can be used in blood vessel segmentation with limited labeled data. In this method, we use the improved U-Net deep learning network to segment the blood vessel tree. On this basis, we implement the U-Net network-based training dataset updating strategy. A large number of experiments are presented to analyze the segmentation performance of the proposed semi-supervised learning method. The experiment results demonstrate that the proposed methodology is able to avoid the problems of insufficient hand-labels, and achieve satisfactory performance.
1. Introduction
The analysis of retinal images is helpful for detecting many diseases including ophthalmopathy, diabetes and cardiovascular disease [1]. The automatization of this analysis process is able to reduce the costs associated with human effort and avoid the problems caused by manual work. In these retinal image analysis tasks, the automated segmentation of blood vessels is the crucial part. The task of segmenting the blood vessels aims to obtain the complete blood vessel tree in the retinal image. The blood vessel tree can be used to achieve many tasks, including retinal blood vessel quantification [1], retinal image registration [2], retinal mosaic [3] and biometric identification [4].
The automated segmentation of blood vessels is a challenging task in the intelligent analysis of retinal images because the size and shape of blood vessels vary hugely in different locations [5,6]. More and more scholars have proposed improved blood vessel segmentation methods. So far, these methods can be divided into three categories: image-processing based blood vessel segmentation methods, machine-learning based blood vessel segmentation methods and deep learning based blood vessel segmentation methods.
The image-processing based blood vessel segmentation methods usually design many segmentation rules according to the features of blood vessels, and then realize the automated segmentation of the blood vessels according to the designed rules. These methods can be divided into many sub-classes, such as matched filter response, blood vessel tracking, morphological approaches, and vessel model based approaches. The matched filtering approaches calculate the matched filter response (MFR) of the retinal image, and then segment the blood vessel tree by using the corresponding MFR [7,8,9,10,11,12,13,14]. The vessel tracking approaches utilize the vessel local profile information to track and segment the blood vessels [15,16,17,18]. The morphological approaches achieve the segmentation task of the blood vessels by using the image-processing techniques such as curvature evaluation [19,20], Gaussian filter [21], vascular centerlines detection [22] and curvelet transform [23]. The model based approaches segment the blood vessels by using the explicit vessel models such as vessel profile model [24], parametric model [25,26,27,28] and geometric model [29]. In addition, the multi-scale approaches are also used in the automated segmentation of the blood vessels and achieve good results [30,31,32,33]. More detailed description can be found in the literature [1].
Different from the image-processing based methods, the machine-learning based blood vessel segmentation methods do not need the presumed rules. Instead, they turn the segmentation problem into a classification task. These methods first extract the feature of each pixel that often consists of the intensity, color, edge, region and MFRs. Then, these features are used to train the different predictors such as k-Nearest Neighbor (k-NN) [34,35], Gaussian mixture model (GMM) [36,37], support vector machine (SVM) [38,39], ensemble method [40,41], neural network [42], random forest [43,44], Extreme Learning Machine (ELM) [45] and Conditional Random Field (CRF) [46]. These methods, by introducing the discriminative features in vascular representation, are often better than the image-processing based methods. However, it is very difficult to acquire the discriminable features of vessels generally. When the discriminable features are not known, these segmentation methods are not able to extract the blood vessel tree accurately. This limits the promotion of the blood vessel segmentation method.
The deep learning theory has greatly improved on the conventional machine learning methods [47,48]. Recently, these deep learning methods have been successfully applied in the automated segmentation of blood vessels [49,50,51,52,53,54,55,56,57,58,59,60,61,62,63,64,65,66,67]. A more detailed description can be found in the literature [68]. In 2015, Ronneberger et al. [69] proposed the U-Net deep network, which achieved very good results in medical image segmentation. In 2018, Soomro et al. [70] used the U-Net network to segment the blood vessels and achieved satisfactory results. Therefore, we used the U-Net deep network as the base network for the blood vessel segmentation in our proposed method. However, these existing methods always need sufficient hand-labeled data to achieve the accurate segmentation of blood vessels. This hand-labeled work is difficult and slow, and requires the medical experts to manually assign each pixel an accurate label. The semi-supervised learning method provides a new way to solve these problems. More and more scholars have proposed the improved semi-supervised learning methods, which have achieved satisfactory results [71]. Inspired by these methods, a new semi-supervised method is proposed for blood vessel segmentation in retinal images. In the proposed method, we applied the U-Net, which is a famous segmentation network for medical images at present, to segment the blood vessels. Then, the dataset updating strategy was introduced to update the given training dataset.
We summarize the contributions of this paper as follows: (1) we used the improved U-Net-based blood vessel segmentation method, which is able to learn the hierarchical latent features of the given retinal image automatically, and avoid the problems caused by extracting features manually. (2) We proposed a novel deep learning based, semi-supervised learning method, which would deal with the problem of the high financial and human effort costs of labeling the retinal images. This proposed semi-supervised learning method provides a new, general, high-performance learning framework for blood vessel segmentation with limited labeled data. (3) We discussed the relationship between the number of hand-labeled retinal images and segmentation accuracy, which was helpful for reducing the costs of labeling the retinal images.
This paper is organized as follows. The prior works and our contributions are introduced in Section 1. In Section 2, we introduce the proposed blood vessel segmentation method, including the parameter learning method and dataset updating strategy. In Section 3, we present the experiment contents including the experimental setup, evaluation metrics, results comparison and convergence analysis. We conclude the paper in Section 4.
2. Proposed Method
2.1. Overview
Deep learning methods have achieved satisfactory performances in medical image segmentation. However, these methods mainly depend on the number and quality of the labeled medical images. If the labeled medical images are insufficient or low-quality, it is difficult to achieve the satisfactory segmentation result. In practice, different from the natural scene image, the task of labeling these medical images is very costly in terms of finance and human effort. In order to solve this problem, we proposed a novel semi-supervised learning method to achieve the segmentation of the blood vessel tree. The main purpose of this method is to achieve satisfactory performance by using the limited labeled retinal image.
The framework of our proposed semi-supervised learning method is shown in Figure 1. It includes two parts: parameter learning and dataset updating. In the parameter learning part, we first used a small number of labeled blood vessel data to train the improved U-Net deep neural network. Then, we used the designed dataset updating strategy to update the old dataset. The above steps would be repeated until the training accuracy met the requirement. In this method, we used a small amount of labeled data and a large number of unlabeled data to achieve the task of blood vessel tree segmentation. In the next section, the detailed information of the proposed method will be introduced.
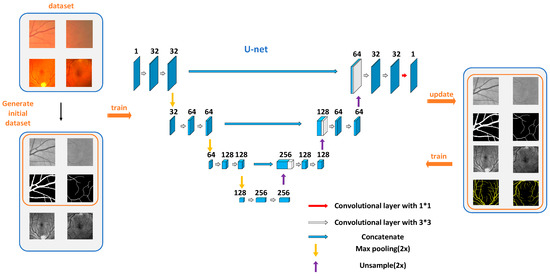
Figure 1.
The flowchart of the proposed semi-supervised method.
2.2. Parameter Learning Strategy
Blood vessel segmentation is the key to realizing an automated retinal image analysis system. In order to achieve the satisfactory segmentation results, we often need to achieve complex feature engineering and select the appropriate classifier. This task is very costly in terms of both time and human effort. In order to solve this problem, we used the U-Net deep network to segment the blood vessel tree, which was able to learn the features of the given retinal image automatically, and avoid the problem caused by complex feature engineering.
The U-Net deep network contains numerous unknown parameters. The parameter learning process aims to estimate the unknown parameters by using the given training dataset. The typical U-Net consists of two parts: encoder architecture and decoder architecture. In our paper, we used an improved U-Net to segment the retinal blood vessel tree. The detailed network structure was as follows.
In the encoder part, we extracted the latent features from the given retinal images, and down-sample the resolution by using the pooling technique. The encoder part included two 3 × 3 convolutional layers and one 2 × 2 max pooling layer. Each convolutional layer was followed by the rectified linear unit (ReLU). In the down-sampling step, the number of feature channels were doubled.
In the decoder part, we reconstructed the feature map by using the up-sampling technique, and recovered the detailed information of the object by using the skip connections technique. The decoder part consisted of one 2 × 2 up-sampling layer, two 3 × 3 convolutional layers and one 1 × 1 convolutional layer. The nearest neighbor interpolation technology was used in the 2 × 2 up-sampling layer. Each 3 × 3 convolutional layer was followed by ReLU. The 1 × 1 convolution layer aimed to map each 32-component feature vector into the target category.
In addition, in order to increase the accuracy of the parameter learning method, we used the skip connection and the dropout regularization technique [72] in the training process. The skip connection technology can protect the details of the retinal image, and the dropout technology can avoid the over-fitting problem.
Let represent the i-th input retinal image. The loss function for training the U-Net is the standard binary cross-entropy loss [35]. The formula is defined by
where is the predicted label of the i-th input image, and is the ground-truth. The U-Net model parameters can be estimated by solving the following optimization problem
The Adaptive Moment Estimation (Adam) optimization algorithm [73] was used to solve this optimization problem.
2.3. Dataset Updating Strategy
The aim of the semi-supervised learning method proposed in this paper is to obtain the satisfactory blood vessel tree by using a small amount of labeled data. In practice, we can obtain a large amount of unlabeled retinal images easily. In order to make full use of these images, we implement a dataset updating strategy, as shown in Figure 1. The dataset updating strategy aims to mark the unlabeled images automatically, and increase the number of the labeled images, which is helpful for estimating the network parameters. The specific implementation process is as follows.
Suppose that the given training dataset and . The subset is the given labeled dataset and the subset is the given unlabeled dataset. Here, the represents the n-th retinal image and the represents the n-th ground-truth label. The is the m-th retinal image without ground-truth. For convenient description, we let represent the U-Net model, and the parameter is estimated by solving Equation (2). Let represent the predicted label of . Then, we can obtain by
Next, we can update the training dataset by
The updated dataset will be used as input to recompute the U-Net model parameters . To summarize, the pseudo-code of our proposed semi-supervised learning method is shown in the Algorithm 1, as follows:
| Algorithm 1 Semi-supervised learning method for the blood vessel tree segmentation |
| Input: Training dataset , retinal image {. |
| Output: The blood vessel tree image . |
| STEP 1: Initialization: |
| ● Learning method: epoch, batch size, learning rate, weight decay rate. |
| ● Initial training set D. |
| ● Initial U-Net model. |
| STEP 2: Update the U-Net model parameters by solving Equation (2). |
| STEP 3: Predict the pseudo-label using Equation (3). |
| STEP 4: Update training dataset using Equation (4). |
| STEP 5: |
| ● while a stopping criterion is not met do |
| ● Update the U-Net model parameters using the updated training dataset ; |
| ● Return to STEP 3 |
| ● end while |
| STEP 6: Take as input and compute using Equation (3). |
3. Experimental Results
3.1. Experimental Setup
3.1.1. Datasets
In experiments, we use the famous public dataset DRIVE, which consists of 40 retinal images and their corresponding ground-truth labels and ground-truth masks. The size of the fundus image is 565 * 584. We use 20 fundus images as the training dataset to train the improved U-Net, and 20 fundus images as the test dataset to evaluate the performance of the trained U-Net. As shown in Figure 2, (a) is a given fundus image, (b) is the ground-truth label, and (c) is the ground-truth mask.
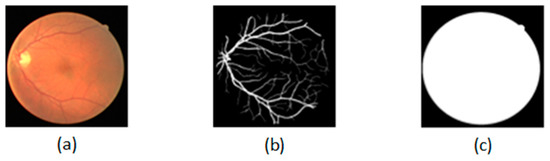
Figure 2.
Dataset: (a) is a given fundus image; (b) is the ground-truth label; (c) is the ground-truth mask.
3.1.2. Implementation Details
In the training process of U-Net, we use the fixed learning rate of 0.001, exponential decay rate of first-order moment estimation of 0.9, exponential decay rate of second-order moment estimation of 0.999 in Adam algorithm. The Adam (Adaptive Moment Estimation) algorithm is used to optimize the network parameters. The training process stops when the iteration number of the epoch is more than 100. Here we use the random initializations for the network parameters. The dropout technique is used in the improved U-Net, and the dropout rate is 0.2.
3.2. Evaluation Metrics
In experiments, we use the accuracy (ACC) to evaluate our proposed method , which has been widely used in much literature. Let represent the test dataset and represent our proposed method. It can be calculated by the following formula
where is the indicator function defined as
here is the predicted result and is the corresponding ground truth.
3.3. Performance Comparison
3.3.1. Quantitative Performance Comparison
In these experiments, we aimed to analyze the segmentation performance of the proposed method. In order to verify the effectiveness of the proposed semi-supervised method, we compared the semi-supervised method with the supervised method. The ACC comparison results between the supervised method and the semi-supervised method are shown in Table 1. In this experiment, we randomly divided the public DRIVE training dataset (20 fundus images) into A-group and B-group. The A-group included the n labeled fundus images, and the B-group included the 20-n unlabeled fundus images. As shown in the first column in Table 1, the parameter n = 4: 19. In the experiment of the supervised method, we used the n labeled fundus images (A-group) to learn the deep neural network, and assess the performance of the trained model. In the experiment of the semi-supervised method, we used the n labeled (A-group) and 20-n unlabeled (B-group) fundus images to learn the deep neural network, and then assess the performance of the trained model. In addition, in order to ensure reasonable experimental results, we gave ten experimental results. As shown in Table 1, the first row indicated the experiment number. In the corresponding column, we gave the experimental results for the different numbers of labeled images. In the last column, we also gave the mean ACC results of ten experiments.

Table 1.
ACC comparison between the supervised method and the semi-supervised method. (S-S: semi-supervised. S: supervised).
From the table, we can observe: (1) with the increase in parameter n, the segmentation accuracy of the supervised and semi-supervised methods increased. This is consistent with the fact that an increase in the numbers of labeled images is helpful to improve the accuracy of parameter estimation of a deep neural network model. (2) When n = 5:17, the accuracy of the semi-supervised method was better than that of the supervised method. These experiment results verified the effectiveness of our proposed semi-supervised method. A satisfactory segmentation result could be obtained by labeling a small number of fundus images.
For easy observation, the box plot of the experiment results obtained by the proposed semi-supervised method is shown in Figure 3. As shown in Figure 3, the characteristics of the experimental results distribution can be observed from the box plot. From top to bottom, the observed statistical characteristics included upper extreme, upper quartile, median, lower quartile and lower extreme. In Figure 3, the Y-axis was the accuracy (ACC) and the X-axis was the number of labeled images (n = 4:19). The circular sign represented outliers and the red line represented the median. The green curve represented the curve of ACC with the number of labeled images.
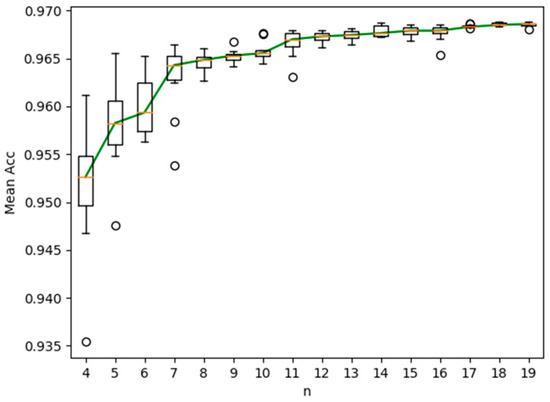
Figure 3.
Box plot of ACC obtained by the proposed semi-supervised method.
From the figure, we can observe: (1) with the increase of the number of labeled images, the segmentation accuracy increased obviously. (2) When there were more than ten labeled images, the increase of segmentation accuracy was not obvious. Therefore, we can conclude that satisfactory segmentation accuracy can be obtained by labeling ten fundus images. The proposed semi-supervised method can reduce the cost of labeling the retinal images in terms of both finance and human effort.
In order to further verify the effectiveness of this algorithm, we compared our proposed semi-supervised method with state-of-the-art methods. The ACC and AUC (area under curve) comparison results on the DRIVE dataset are shown in Table 2. In the table, we listed 46 state-of-the-art methods, including their type, year, and ACC evaluation metrics. In the second column, the symbol * represented the image-processing based method, the symbol + represented the machine learning based method, and the symbol ◊ represented the deep learning based method. In the second row, we listed the accuracy result obtained by a human observer. In the last row, we listed the accuracy result obtained by our proposed semi-supervised method by using eleven labeled fundus images. The number in brackets was the number of labeled images.
Table 2.
ACC and AUC comparison with state-of-the-art methods on the DRIVE dataset. The symbol * represents the image-processing based method, the symbol + represents the machine learning based method, and the symbol ◊ represents the deep learning based method.
From the table, we can observe: (1) The ACC and AUC results obtained by our proposed semi-supervised method outperformed the results obtained by the human observer and many state-of-the-art methods. (2) The proposed semi-supervised method only used eleven labeled fundus images, which meant that our method could save half of the cost of labeling the fundus images in terms of both finance and human effort. Therefore, we can conclude that the proposed semi-supervised method can obtain a state-of-the-art performance and avoid the problems of insufficient hand-labels.
3.3.2. Qualitative Performance Comparison
To further evaluate the proposed semi-supervised method, Figure 4 shows the qualitative performance comparison between the semi-supervised and the supervised method. The original fundus image is shown in Figure 4a and its ground truth is shown in Figure 4b. The segmentation results of the proposed semi-supervised methods by using 8, 12 and 15 labeled images are shown in Figure 4c–e, and the segmentation results of the supervised methods by using 8, 12 and 15 labeled images are shown in Figure 4g–i. For convenient observation, the local enlarged segmentation maps obtained by the proposed semi-supervised and supervised methods are shown in Figure 4f,j. From Figure 4f,j, we can see that the proposed semi-supervised method can obtain the complete retinal blood vessel tree, and the supervised method cannot obtain the complete retinal blood vessel tree. Therefore, we can conclude that the proposed semi-supervised method can achieve satisfactory segmentation performance.
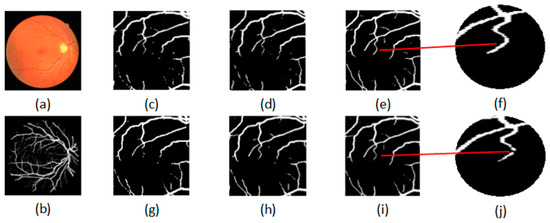
Figure 4.
Qualitative performance comparison between the semi-supervised and supervised method: (a) original image; (b) ground truth; semi-supervised methods by using (c) 8, (d) 12 and (e)15 labeled images; supervised methods by using (g) 8, (h) 12 and (i) 15 labeled images; (f) the local enlarged map of (e); (j) the local enlarged map of (i).
3.4. Convergence Analysis
This experiment aims to verify the convergence of the proposed semi-supervised method. In this experiment, we carried out ten experiments. Based on the results of these ten experiments, we drew the box plot of the loss curve with time for the proposed semi-supervised method, as shown in Figure 5. The box plot was used to reflect the statistical characteristics of the loss curve. In the figure, the Y-axis was the loss and the X-axis was the number of epochs. Similar to Figure 3, the circular sign represented outliers and the red line represented the median. The green curve represented the loss curve with time. From the figure, we can observe: (1) With the increase of the epoch, the loss of the proposed semi-supervised method decayed rapidly. (2) When the number of epochs was more than ten, the change of loss curve tended to be stable. This verified the convergence of the proposed semi-supervised segmentation method.
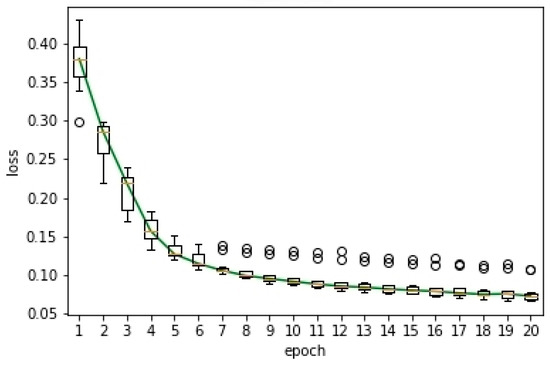
Figure 5.
Box plot of the loss curve.
4. Conclusions
In this paper, we propose a new deep learning based semi-supervised learning method for blood vessel tree segmentation in the retinal image. The proposed method is able to combine the deep neural network with the semi-supervised learning strategy, which deals with the costly problem of labeling the retinal images, in terms of both finance and human effort. On the DRIVE datasets, the proposed semi-supervised method only uses eleven labeled fundus images and outperforms the results obtained by the human observer and many state-of-the-art methods, which means that our method can save half of the cost of labeling the fundus images in terms of both finance and human effort. In addition, a large number of experimental results show that the proposed semi-supervised method can effectively accomplish the blood vessel segmentation task and has good convergence. In the future, we plan to investigate the use of more improved training methods for semi-supervised learning. In addition, we are also interested in the use of the semantic priors of the blood vessel for further improvement.
Author Contributions
Conceptualization, D.C. and Y.A.; methodology, D.C. and Y.A.; software, Y.A.; validation, Y.A. and D.C.; formal analysis, D.C.; investigation, D.C. and Y.A.; resources, S.L.; data curation, Y.A. and S.L.; writing—original draft preparation, D.C.; writing—review and editing, D.C. and Y.A.; visualization, Y.A.; supervision, S.L. and D.C.; All authors have read and agreed to the published version of the manuscript.
Funding
This work was supported by the National Natural Science Foundation of China under Grant 61773104 and National Key R&D Program of China under Grant 2017YFB0306400.
Conflicts of Interest
The authors declare no conflict of interest.
References
- Fraz, M.M.; Remagnino, P.; Hoppe, A.; Uyyanonvara, B.; Rudnicka, A.R.; Owen, C.G.; Barman, S. Blood vessel segmentation methodologies in retinal images—A survey. Comput. Methods Programs Biomed. 2012, 108, 407–433. [Google Scholar] [CrossRef] [PubMed]
- Zana, F.; Klein, J. A multimodal registration algorithm of eye fundus images using vessels detection and Hough transform. IEEE Trans. Med. Imaging 1999, 18, 419–428. [Google Scholar] [CrossRef] [PubMed]
- Ruggiero, C.; Benvenuti, S.; Giacomini, M. Mathematical Modeling of Retinal Mosaic Formation by Mechanical Interactions and Dendritic Overlap. IEEE Trans. NanoBiosci. 2007, 6, 180–185. [Google Scholar] [CrossRef]
- Mariño, C.; Penedo, M.G.G.; Penas, M.; Carreira, M.J.; Gonzalez, F. Personal authentication using digital retinal images. Pattern Anal. Appl. 2006, 9, 21–33. [Google Scholar] [CrossRef]
- Kirbas, C.; Quek, F. A review of vessel extraction techniques and algorithms. ACM Comput. Surv. 2004, 36, 81–121. [Google Scholar] [CrossRef]
- Li, Q.; Feng, B.; Xie, L.; Liang, P.; Zhang, H.; Wang, T. A Cross-Modality Learning Approach for Vessel Segmentation in Retinal Images. IEEE Trans. Med. Imaging 2015, 35, 109–118. [Google Scholar] [CrossRef]
- Chaudhuri, S.; Chatterjee, S.; Katz, N.; Nelson, M.; Goldbaum, M. Detection of blood vessels in retinal images using two-Dimensional matched filters. IEEE Trans. Med. Imaging 1989, 8, 263–269. [Google Scholar] [CrossRef]
- Jiang, X.; Mojon, D. Adaptive local thresholding by verification-Based multithreshold probing with application to vessel detection in retinal images. IEEE Trans. Pattern Anal. Mach. Intell. 2003, 25, 131–137. [Google Scholar] [CrossRef]
- Al-Rawi, M.; Qutaishat, M.; Arrar, M. An improved matched filter for blood vessel detection of digital retinal images. Comput. Biol. Med. 2007, 37, 262–267. [Google Scholar] [CrossRef] [PubMed]
- Cinsdikici, M.; Aydın, D. Detection of blood vessels in ophthalmoscope images using MF/ant (matched filter/ant colony) algorithm. Comput. Methods Programs Biomed. 2009, 96, 85–95. [Google Scholar] [CrossRef]
- Zhang, B.; Zhang, L.; Zhang, K.; Karray, F. Retinal vessel extraction by matched filter with first-Order derivative of Gaussian. Comput. Biol. Med. 2010, 40, 438–445. [Google Scholar] [CrossRef] [PubMed]
- Amin, M.A.; Yan, H. High speed detection of retinal blood vessels in fundus image using phase congruency, Soft Computing–A Fusion of Foundations. Soft Comput. 2010, 15, 1217–1230. [Google Scholar] [CrossRef]
- Odstrcilik, J.; Kolar, R.; Kubena, T.; Cernosek, P.; Budai, A.; Hornegger, J.; Gazarek, J.; Svoboda, O.; Jan, J.; Angelopoulou, E. Retinal vessel segmentation by improved matched filtering: Evaluation on a new high-Resolution fundus image database. IET Image Process. 2013, 7, 373–383. [Google Scholar] [CrossRef]
- Azzopardi, G.; Strisciuglio, N.; Vento, M.; Petkov, N. Trainable COSFIRE filters for vessel delineation with application to retinal images. Med. Image Anal. 2015, 19, 46–57. [Google Scholar] [CrossRef] [PubMed]
- Liu, I.; Sun, Y. Recursive tracking of vascular networks in angiograms based on the detection-Deletion scheme. IEEE Trans. Med. Imaging 1993, 12, 334–341. [Google Scholar] [CrossRef]
- Zhou, L.; Rzeszotarski, M.; Singerman, L.; Chokreff, J. The detection and quantification of retinopathy using digital angiograms. IEEE Trans. Med. Imaging 1994, 13, 619–626. [Google Scholar] [CrossRef]
- Quek, F.; Kirbas, C. Vessel extraction in medical images by wave-Propagation and traceback. IEEE Trans. Med. Imaging 2001, 20, 117–131. [Google Scholar] [CrossRef]
- Zhao, J.; Yang, J.; Ai, D.; Song, H.; Jiang, Y.; Huang, Y.; Zhang, L.; Wang, Y. Automatic retinal vessel segmentation using multi-Scale superpixel chain tracking. Digit. Signal Process. 2018, 81, 26–42. [Google Scholar] [CrossRef]
- Zana, F.; Klein, J.-C. Segmentation of vessel-Like patterns using mathematical morphology and curvature evaluation. IEEE Trans. Image Process. 2001, 10, 1010–1019. [Google Scholar] [CrossRef]
- Luiz, C.N. An unsupervised coarse-to-fine algorithm for blood vessel segmentation in fundus images. Expert Syst. Appl. 2017, 78, 182–192. [Google Scholar]
- Mendonça, A.M.; Campilho, A. Segmentation of retinal blood vessels by combining the detection of centerlines and morphological reconstruction. IEEE Trans. Med. Imaging 2006, 25, 1200–1213. [Google Scholar] [CrossRef] [PubMed]
- Fraz, M.M.; Barman, S.; Remagnino, P.; Hoppe, A.; Basit, A.; Uyyanonvara, B.; Rudnicka, A.R.; Owen, C.G. An approach to localize the retinal blood vessels using bit planes and centerline detection. Comput. Methods Programs Biomed. 2012, 108, 600–616. [Google Scholar] [CrossRef]
- Miri, M.S.; Mahloojifar, A. Retinal Image Analysis Using Curvelet Transform and Multistructure Elements Morphology by Reconstruction. IEEE Trans. Biomed. Eng. 2010, 58, 1183–1192. [Google Scholar] [CrossRef] [PubMed]
- Lam, B.S.Y.; Gao, Y.; Liew, A.W.-C. General Retinal Vessel Segmentation Using Regularization-Based Multiconcavity Modeling. IEEE Trans. Med. Imaging 2010, 29, 1369–1381. [Google Scholar] [CrossRef]
- Espona, L.; Carreira, M.J.; Ortega, M.; Penedo, M.G. A snake for retinal vessel segmentation. Pattern Recognit. 2007, 4478, 178–185. [Google Scholar]
- Espona, L.; Carreira, M.J.; Penedo, M.G. Retinal vessel tree segmentation using a deformable contour model. Pattern Recognit. 2008, 5197, 683–690. [Google Scholar]
- Zhao, Y.; Rada, L.; Chen, K.; Harding, S.; Zheng, Y. Automated Vessel Segmentation Using Infinite Perimeter Active Contour Model with Hybrid Region Information with Application to Retinal Images. IEEE Trans. Med. Imaging 2015, 34, 1797–1807. [Google Scholar] [CrossRef] [PubMed]
- Zhao, Y.Q.; Wang, X.H.; Wang, X.F.; Shih, F.Y. Retinal vessels segmentation based on level set and region growing. Pattern Recognit. 2014, 47, 2437–2446. [Google Scholar] [CrossRef]
- Zhang, Y.; Hsu, W.; Lee, M.L. Detection of Retinal Blood Vessels Based on Nonlinear Projections. J. Signal Process. Syst. 2008, 55, 103–112. [Google Scholar] [CrossRef]
- Martinez-Perez, M.E.; Hughes, A.; Thom, S.; Bharath, A.A.; Parker, K. Segmentation of blood vessels from red-Free and fluorescein retinal images. Med. Image Anal. 2007, 11, 47–61. [Google Scholar] [CrossRef]
- Martinez-Perez, M.E.; Hughes, A.D.; Thorn, S.A.; Parker, K.H. Improvement of a retinal blood vessel segmentation method using the Insight Segmentation and Registration Toolkit (ITK). Eng. Med. Biol. Soc. 2007, 2007, 892–895. [Google Scholar]
- Vlachos, M.; Dermatas, E. Multi-Scale retinal vessel segmentation using line tracking. Comput. Med. Imaging Graph. 2010, 34, 213–227. [Google Scholar] [CrossRef] [PubMed]
- Nguyen, U.T.; Bhuiyan, A.; Park, L.A.; Ramamohanarao, K. An effective retinal blood vessel segmentation method using multi-Scale line detection. Pattern Recognit. 2013, 46, 703–715. [Google Scholar] [CrossRef]
- Niemeijer, M.; Staal, J.; Van Ginneken, B.; Loog, M.; Abramoff, M. Comparative study of retinal vessel segmentation methods on a new publicly available database. Int. Soc. Opt. Eng. 2004, 5370, 648–656. [Google Scholar] [CrossRef]
- Staal, J.; Abramoff, M.; Niemeijer, M.; Viergever, M.; Van Ginneken, B. Ridge-Based Vessel Segmentation in Color Images of the Retina. IEEE Trans. Med. Imaging 2004, 23, 501–509. [Google Scholar] [CrossRef]
- Soares, J.; Leandro, J.J.G.; Cesar, R., Jr.; Jelinek, H.; Cree, M.J. Retinal vessel segmentation using the 2-D Gabor wavelet and supervised classification. IEEE Trans. Med. Imaging 2006, 25, 1214–1222. [Google Scholar] [CrossRef]
- Roychowdhury, S.; Koozekanani, D.D.; Parhi, K.K.; Roychowdhury, S. Blood Vessel Segmentation of Fundus Images by Major Vessel Extraction and Sub-Image Classification. IEEE J. Biomed. Health 2014, 19. [Google Scholar] [CrossRef]
- Ricci, E.; Perfetti, R. Retinal Blood Vessel Segmentation Using Line Operators and Support Vector Classification. IEEE Trans. Med. Imaging 2007, 26, 1357–1365. [Google Scholar] [CrossRef]
- Xu, L.; Luo, S. A novel method for blood vessel detection from retinal images. Biomed. Eng. Online 2010, 9, 14. [Google Scholar] [CrossRef]
- Lupaşcu, C.A.; Tegolo, D.; Trucco, E. Fabc: Retinal Vessel Segmentation Using AdaBoost. IEEE Trans. Inf. Technol. Biomed. 2010, 14, 1267–1274. [Google Scholar] [CrossRef]
- Fraz, M.M.; Remagnino, P.; Hoppe, A.; Uyyanonvara, B.; Rudnicka, A.R.; Owen, C.G.; Barman, S. An Ensemble Classification-Based Approach Applied to Retinal Blood Vessel Segmentation. IEEE Trans. Biomed. Eng. 2012, 59, 2538–2548. [Google Scholar] [CrossRef] [PubMed]
- Marin, D.; Aquino, A.; Gegundez_Arias, M.; Bravo, J.M. A New Supervised Method for Blood Vessel Segmentation in Retinal Images by Using Gray-Level and Moment Invariants-Based Features. IEEE Trans. Med. Imaging 2010, 30, 146–158. [Google Scholar] [CrossRef] [PubMed]
- Cheng, E.; Du, L.; Wu, Y.; Zhu, Y.J.; Ling, H. Discriminative vessel segmentation in retinal images by fusing context-Aware hybrid features. Mach. Vis. Appl. 2014, 25, 1779–1792. [Google Scholar] [CrossRef]
- Khowaja, S.A.; Khuwaja, P.; Ismaili, I.A. A framework for retinal vessel segmentation from fundus images using hybrid feature set and hierarchical classification. Signal Image Video Process. 2018, 13, 379–387. [Google Scholar] [CrossRef]
- Zhu, C.; Zou, B.; Zhao, R.; Cui, J.; Duan, X.; Chen, Z.; Liang, Y. Retinal vessel segmentation in colour fundus images using Extreme Learning Machine. Comput. Med. Imaging Graph. 2017, 55, 68–77. [Google Scholar] [CrossRef]
- Orlando, J.I.; Prokofyeva, E.; Blaschko, M.B. A Discriminatively Trained Fully Connected Conditional Random Field Model for Blood Vessel Segmentation in Fundus Images. IEEE Trans. Biomed. Eng. 2017, 64, 16–27. [Google Scholar] [CrossRef]
- Lecun, Y.; Bengio, Y.; Hinton, G. Deep learning. Nature 2015, 521, 436–444. [Google Scholar] [CrossRef]
- Bengio, Y.; Goodfellow, J.; Courville, A. Deep Learning; The MIT Press: Cambridge, MA, USA, 2016. [Google Scholar]
- Hu, K.; Zhang, Z.; Niu, X.; Zhang, Y.; Cao, C.; Xiao, F.; Gao, X. Retinal vessel segmentation of color fundus images using multiscale convolutional neural network with an improved cross-Entropy loss function. Neurocomputing 2018, 309, 179–191. [Google Scholar] [CrossRef]
- Ngo, L.; Han, J.-H. Multi-Level deep neural network for efficient segmentation of blood vessels in fundus images. Electron. Lett. 2017, 53, 1096–1098. [Google Scholar] [CrossRef]
- Dharmawan, D.A.; Li, D.; Ng, B.P.; Rahardja, S. A New Hybrid Algorithm for Retinal Vessels Segmentation on Fundus Images. IEEE Access 2019, 7, 41885–41896. [Google Scholar] [CrossRef]
- Lahiri, A.; Ayush, K.; Biswas, P.K. Generative Adversarial Learning for Reducing Manual Annotation in Semantic Segmentation on Large Scale Miscroscopy Images: Automated Vessel Segmentation in Retinal Fundus Image as Test Case. In Proceedings of the IEEE Conference on Computer Vision and Pattern Recognition Workshops(CVPRW), Honolulu, HI, USA, 21–26 July 2017. [Google Scholar]
- Lu, J.; Xu, Y.; Chen, M.; Luo, Y. A Coarse-to-Fine Fully Convolutional Neural Network for Fundus Vessel Segmentation. Symmetry 2018, 10, 607. [Google Scholar] [CrossRef]
- Wang, S.; Yin, Y.; Cao, G.; Wei, B.; Zheng, Y.; Yang, G. Hierarchical retinal blood vessel segmentation based on feature and ensemble learning. Neurocomputing 2015, 149, 708–717. [Google Scholar] [CrossRef]
- Samuel, P.M.; Veeramalai, T. Multilevel and Multiscale Deep Neural Network for Retinal Blood Vessel Segmentation. Symmetry 2019, 11, 946. [Google Scholar] [CrossRef]
- Wang, C.; Zhao, Z.; Ren, Q.; Xu, Y.; Yu, Y. Dense U-net Based on Patch-Based Learning for Retinal Vessel Segmentation. Entropy 2019, 21, 168. [Google Scholar] [CrossRef]
- Lin, Y.; Zhang, H.; Hu, G.; Zhang, H. Automatic Retinal Vessel Segmentation via Deeply Supervised and Smoothly Regularized Network. IEEE Access 2018, 7, 57717–57724. [Google Scholar] [CrossRef]
- Zhang, J.; Cui, Y.; Jiang, W.; Wang, L. Blood Vessel Segmentation of Retinal Images Based on Neural Network. Intell. Tutoring Syst. 2015, 9218, 11–17. [Google Scholar] [CrossRef]
- Maji, D.; Santara, A.; Mitra, P.; Sheet, D. Ensemble of Deep Convolutional Neural Networks for Learning to Detect Retinal Vessels in Fundus Images. Mach. Learn. 2016, arXiv:1603.04833. [Google Scholar]
- Liskowski, P.; Krawiec, K. Segmenting Retinal Blood Vessels With Deep Neural Networks. IEEE Trans. Med. Imaging 2016, 35, 2369–2380. [Google Scholar] [CrossRef]
- Fu, H.; Xu, Y.; Wong, D.W.K.; Liu, J. Retinal vessel segmentation via deep learning network and fully-Connected conditional random fields. In Proceedings of the 2016 IEEE 13th International Symposium on Biomedical Imaging (ISBI), Prague, Czech Republic, 13–16 April 2016. [Google Scholar]
- Yao, Z.; Zhang, Z.; Xu, L.Q. Convolutional neural network for retinal blood vessel segmentation. In Proceedings of the 2016 9th International Symposium on Computational Intelligence and Design (ISCID), Hangzhou, China, 10–11 December 2016. [Google Scholar]
- Fu, H.; Xu, Y.; Lin, S.; Wong, D.; Liu, J. DeepVessel: Retinal Vessel Segmentation via Deep Learning and Conditional Random Field. Comput. Vis. 2016, 9901, 132–139. [Google Scholar] [CrossRef]
- Tan, J.H.; Acharya, U.R.; Bhandary, S.; Chua, K.C.; Sivaprasad, S. Segmentation of optic disc, fovea and retinal vasculature using a single convolutional neural network. J. Comput. Sci. 2017, 20, 70–79. [Google Scholar] [CrossRef]
- Guo, S.; Kang, H.; Zhang, Y.; Wang, K.; Li, T. BTS-DSN: Deeply supervised neural network with short connections for retinal vessel segmentation. Int. J. Med. Inform. 2019, 126, 105–113. [Google Scholar] [CrossRef] [PubMed]
- Yan, Z.; Yang, X.; Cheng, K.-T. A Three-Stage Deep Learning Model for Accurate Retinal Vessel Segmentation. IEEE J. Biomed. Health 2019, 23, 1427–1436. [Google Scholar] [CrossRef] [PubMed]
- Lu, Z.; Chen, D. Weakly Supervised and Semi-Supervised Semantic Segmentation for Optic Disc of Fundus Image. Symmetry 2020, 12, 145. [Google Scholar] [CrossRef]
- Soomro, T.A.; Afifi, A.J.; Zheng, L.; Soomro, S.; Gao, J.; Hellwich, O.; Paul, M. Deep Learning Models for Retinal Blood Vessels Segmentation: A Review. IEEE Access 2019, 7, 71696–71717. [Google Scholar] [CrossRef]
- Ronneberger, O.; Fischer, P.; Brox, T. U-Net: Convolutional Networks for Biomedical Image Segmentation. In Proceedings of the International Conference on Medical Image Computing and Computer-Assisted Intervention, Munich, Germany, 5–9 October 2015. [Google Scholar]
- Soomro, T.A.; Afifi, A.J.; Gao, J.; Hellwich, O.; Paul, M.; Zheng, L. Strided U-Net Model: Retinal Vessels Segmentation using Dice Loss. In Proceedings of the 2018 Digital Image Computing: Techniques and Applications (DICTA), Canberra, Australia, 10–13 December 2018. [Google Scholar]
- Van Engelen, J.E.; Hoos, H.H. A survey on semi-Supervised learning. Mach. Learn. 2019, 109, 373–440. [Google Scholar] [CrossRef]
- Hinton, G.E.; Srivastava, N.; Krizhevsky, A.; Sutskever, I.; Salakhutdinov, R. Dropout: A Simple Way to Prevent Neural Networks from Overfitting. J. Mach. Learn. Res. 2014, 15, 1929–1958. [Google Scholar]
- Kingma, D.P.; Ba, J. Adam: A Method for Stochastic Optimization. In Proceedings of the International Conference on Learning Representations, San Diego, CA, USA, 7–9 May 2015. [Google Scholar]


© 2020 by the authors. Licensee MDPI, Basel, Switzerland. This article is an open access article distributed under the terms and conditions of the Creative Commons Attribution (CC BY) license (http://creativecommons.org/licenses/by/4.0/).