1. Introduction
The efficiency of airplane boarding methods has been discussed in the scientific literature from different points of view. Most of the literature focuses on reducing the time to complete boarding of an airplane under given conditions: the presence of jet bridges [
1,
2,
3,
4,
5,
6], the possibility of having different pre-boarding areas in which the passengers can gather in an ordered manner (e.g., the flying carpet [
7], classical pre-boarding areas [
8]), the presence of apron buses [
9,
10,
11,
12], boarding through both doors of the airplane [
6,
13,
14]), offering passengers traveling together the possibility of boarding as a group [
15,
16,
17,
18,
19], creating a friendly environment while passengers are boarding [
20]. Most of the computer simulations of airplane boarding consider the situation in which the airplane is fully loaded with passengers [
1,
4,
21,
22,
23,
24,
25], while a few papers have addressed the issue of partially boarded airplanes [
12,
21,
26,
27].
COVID-19 is a disease caused by severe respiratory syndrome coronavirus 2 (SARS-CoV-2). The terrible health impacts of COVID-19 have led to many countries requiring their residents to stay at their homes for a period of time. Much of the world has recognized the need for social distancing to mitigate the scourge of the pandemic. This applies to airplane boarding and seat assignments as well. While airlines are considering their passengers’ safety while traveling during the COVID-19 pandemic, the improvement or adaptation of the boarding methods to fit the new social distancing norms should also be considered, as well as the resulting costs and efficiencies for the airlines.
According to the news media, a series of rules for social distancing have been imposed or have been discussed as possible ideas to increase airplane passenger safety during the pandemic. Some of the airlines have already changed their practices, while additional changes are being considered as possible strategies.
The International Air Transport Association (IATA) Medical Advisory Group has recently released a document with recommendations for restarting aviation safely in the presence of COVID-19 among some of the general public [
28]. Among the recommended safety norms are: Symptom screening, use of masks and personal protective equipment (PPE), physical distancing, cleaning and disinfection, COVID-19 testing, antibody testing, immunity passports, and a series of measures created to assist contact tracing and crew members’ safety [
28]. In terms of physical distancing, the IATA report recommends an ideal distance among passengers which can range from 1–2 m, as well as modifying the airport check-in, security, immigration, departure lounge, and boarding processes, to ensure social distancing. Among the measures strictly related to physical distancing while boarding the airplane, the IATA Medical Advisory Group report underlined the following [
28]: management of the boarding process, which will ensure a limited number of passengers passing each other, limit of carry-on luggage, sequential boarding starting from passengers with seats in the rear of the airplane and window seats. Furthermore, the IATA Medical Advisory Group report underlines the fact that: “some airlines are currently, while load factors are low, also achieving a degree of distancing by leaving every second seat empty, or similar”. [
28]. However, this measure is cataloged as “questionable”, considering the in-flight transmission of the virus. Another option presented by the IATA Medical Advisory Group report suggests the “benefit in leaving empty seats in the region where the crew is seated (in their jump seats) face to face with passengers.” [
28].
As a result, the general recommendation of the IATA Medical Advisory Group for the airlines is the use of a multi-layered approach, based on a combination of the abovementioned safety norms, which can achieve “high-levels of risk reduction” [
28], with some of the norms potentially including aspects related to physical distancing.
The European Union Aviation Safety Agency (EASA) states, in a recent report that it is the duty of the airplane operators to ensure, as much as possible, sufficient physical distance among passengers [
29], while the World Health Organization (WHO) has asserted that social distancing is one of the most important measures for mitigating the impact of the COVID-19 pandemic [
30].
The Civil Aviation Administration of China (CAAC) guidelines report discusses a potential “cabin area division” to impose social distancing [
31]. In this approach, the CAAC recommends that the cabin area be divided into four spaces: clean area, buffer zone, quarantine area, and the passenger sitting area—all of them separated by disposable curtains. The principles for governing the cabin separation are: the clean area will be in the front half of the first class (and/or business class) cabin and will be dedicated exclusively for the use of crew members; the buffer zone will be formed in the rear half of first class; the quarantine area will be formed in the last three rows of the airplane and designated for use in an emergency, and the passenger seating area will be formed by the remaining seats of the cabin [
31].
Airlines and airports have adopted several approaches in response to the current pandemic: passengers assigned to the back seats board first (implemented by Delta Air Lines [
32] and by the “Henri Coandă” Airport [
33]); passengers assigned to the seats in the front rows (one row at a time) board first while entering an airplane from the rear door (implemented by GoAir [
34]), and boarding is based on passengers’ seat numbers (trialed by EasyJet and Gatwick Airport [
35]); blocking middle-seats (mooted by Alaska Airlines, Wizz Air, and later by EasyJet [
36]).
As a part of COVID-19 restrictions, Delta Air Lines boards passengers in a back-to-front sequence by row, first boarding those passengers seated closest to the rear of the airplane to reduce the chance of boarding passengers passing other (seated) passengers in the process of finding their seats [
37,
38]. That is, for an airplane with 30 rows, passengers seated in row 30 are the first called to board, followed by row 29 and continuing in this manner until row 1 is reached. Additionally, Delta leaves middle seats empty in the main cabin and for first-class passengers, and on airplanes without middle seats, Delta Air Lines blocks the aisle or the window seats to preserve social distance [
39,
40]. The wearing of a face mask or a face covering is mandatory for all Delta travelers [
39].
Southwest Airlines has announced changes to its usual boarding process to ensure social distancing during the COVID-19 pandemic, such as boarding their airplanes in groups of ten passengers, and the passengers are only lined up on one side of the Southwest’s boarding poles while wearing masks [
41]. This airline asks their passengers to eat before boarding, since drinks and snacks are no longer served to all passengers on board [
41]. The only beverage offered by the company is canned water, which is provided upon request [
42].
American Airlines follows the same “no snacks, no food” policy to all passengers, including first-class, and “no middle seat” for economy-class passengers [
42].
As for United Airlines, the rules have changed only slightly for the food policy, as the company continues to offer snacks to its passengers but with no refill of beverages [
42]. Even in the case of this airline company, the middle seat is blocked [
42].
It is important to recognize that such policies are fluid. As with the rest of the world, airlines are continually re-evaluating their boarding practices as scientists continue to learn more about COVID-19 and everybody learns more about people’s behavioral changes in response to changing knowledge about COVID-19 and the dictates imposed by governments.
All of the discussed safety practices come with advantages and disadvantages. For example, blocking out the middle seat on an Airbus 320 or a Boeing 737 airplane, which are often configured to pack as many passengers in the limited space as possible, results in a maximum load of 66.7% capacity [
36], which is below the average global load factor of 84%, reported by the IATA 2019 report [
43]. Furthermore, as an empty middle seat keeps the passengers at an average 45 cm distance from each other, the 2 m recommended distance is not met [
36]. To follow 2 m distancing among passengers, there should be, at most, two persons seated in each row. Furthermore, considering the passengers in adjacent rows, with a row having a width of 75–80 cm, and taking into account the 2 m recommendation, there should be at least two empty rows between any other pairs of rows containing the maximum of two passengers.
In this context, this paper tests the classical boarding methods used by airlines worldwide for boarding their passengers under the same initial conditions and discusses their efficiency both in terms of costs (determined by the time needed to complete the boarding) and in terms of passenger health (determined by the risk for an infected passenger to spread the virus to another passenger). We consider new norms related to social distancing. In particular, we leave the middle seat empty on each side of the aisle. Furthermore, as passengers walk down the aisle toward their seats we assume that there is a minimum distance between each pair of adjacent walking/standing passengers of 1 m, 1.5 m, or 2 m (aisle distancing), according to the scenario tested to preserve social distancing.
The remainder of the paper is organized as follows:
Section 2 presents a short literature review of the classical airplane boarding methods that have been used by the airlines.
Section 3 discusses the scenarios and assumptions tested, as well as the metrics used for evaluating the performances of the methods under those scenarios. These scenarios could be implemented by the airlines during the COVID-19 outbreak, considering social distancing and passenger health.
Section 4 presents the agent-based model used for the simulations and underlines the primary moving assumptions for the agents.
Section 5 provides and analyzes a series of simulations for the different scenarios presented in
Section 3. The paper closes with a section on concluding remarks and further research directions. A series of videos presenting simulations made using the agent-based model accompanies the paper.
2. Literature Review
According to the research literature on airplane boarding methods, there are more than 20 methods that have been created and tested under different assumptions [
44]. The boarding methods can be characterized as random, by group or by seat. Within the “random” category, the entire group of passengers is called to board as a single group. In the “by group” methods, the degree of granularity is increased, and the passengers are divided into different groups based on a certain set of rules, with each group called to board in turn. The “by seat” methods increase granularity further and consider each individual passenger to be boarded as a one-person group.
All the new boarding methods are in the categories of either “by group” or “by seat” methods. Among the most well-known “by group” methods, one can name: outside-in (also known as “WilMA” or the window–middle–aisle boarding method), back-to-front, reverse pyramid, modified optimal method, and the rotating zone [
5,
10,
45,
46]. From the “by seat” methods, the most well-known is the method developed by Steffen [
2]. The rules accompanying some of these methods are highlighted as follows.
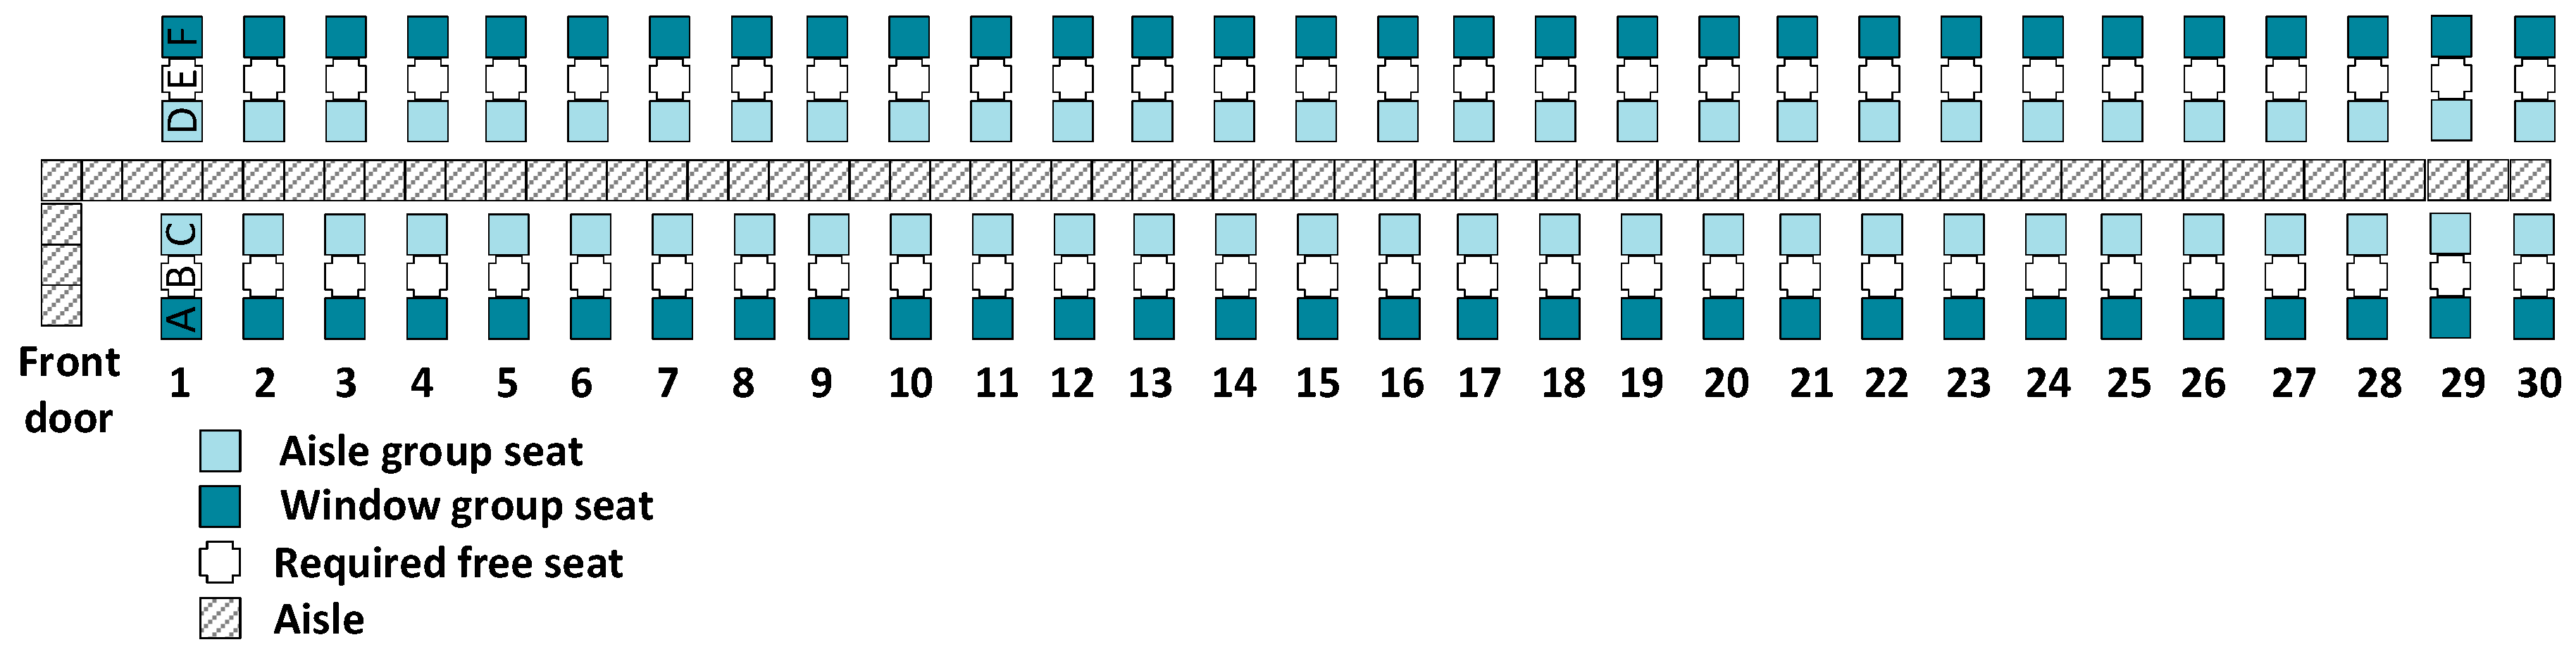
According to the WilMA method, the passengers are divided into three boarding groups based on the positions of their assigned seats in the airplane. The first group to board is composed of the passengers having seats near the window, the second boarding group includes the passengers assigned to middle seats, and the third group comprises the passengers with seats adjacent to the aisle. At the time boarding begins, all passengers of the first group are called to board in a random sequence within the group. Once the last passenger belonging to the first group has proceeded to board, the second group is called for boarding. Similar to the previous group, the passengers belonging to this group board in a random sequence within the group. Lastly, the third group to board contains all the passengers assigned to aisle seats [
2,
5,
21,
47]. With all of the “by group” methods, the sequence of passengers boarding within a particular group is assumed to be random.
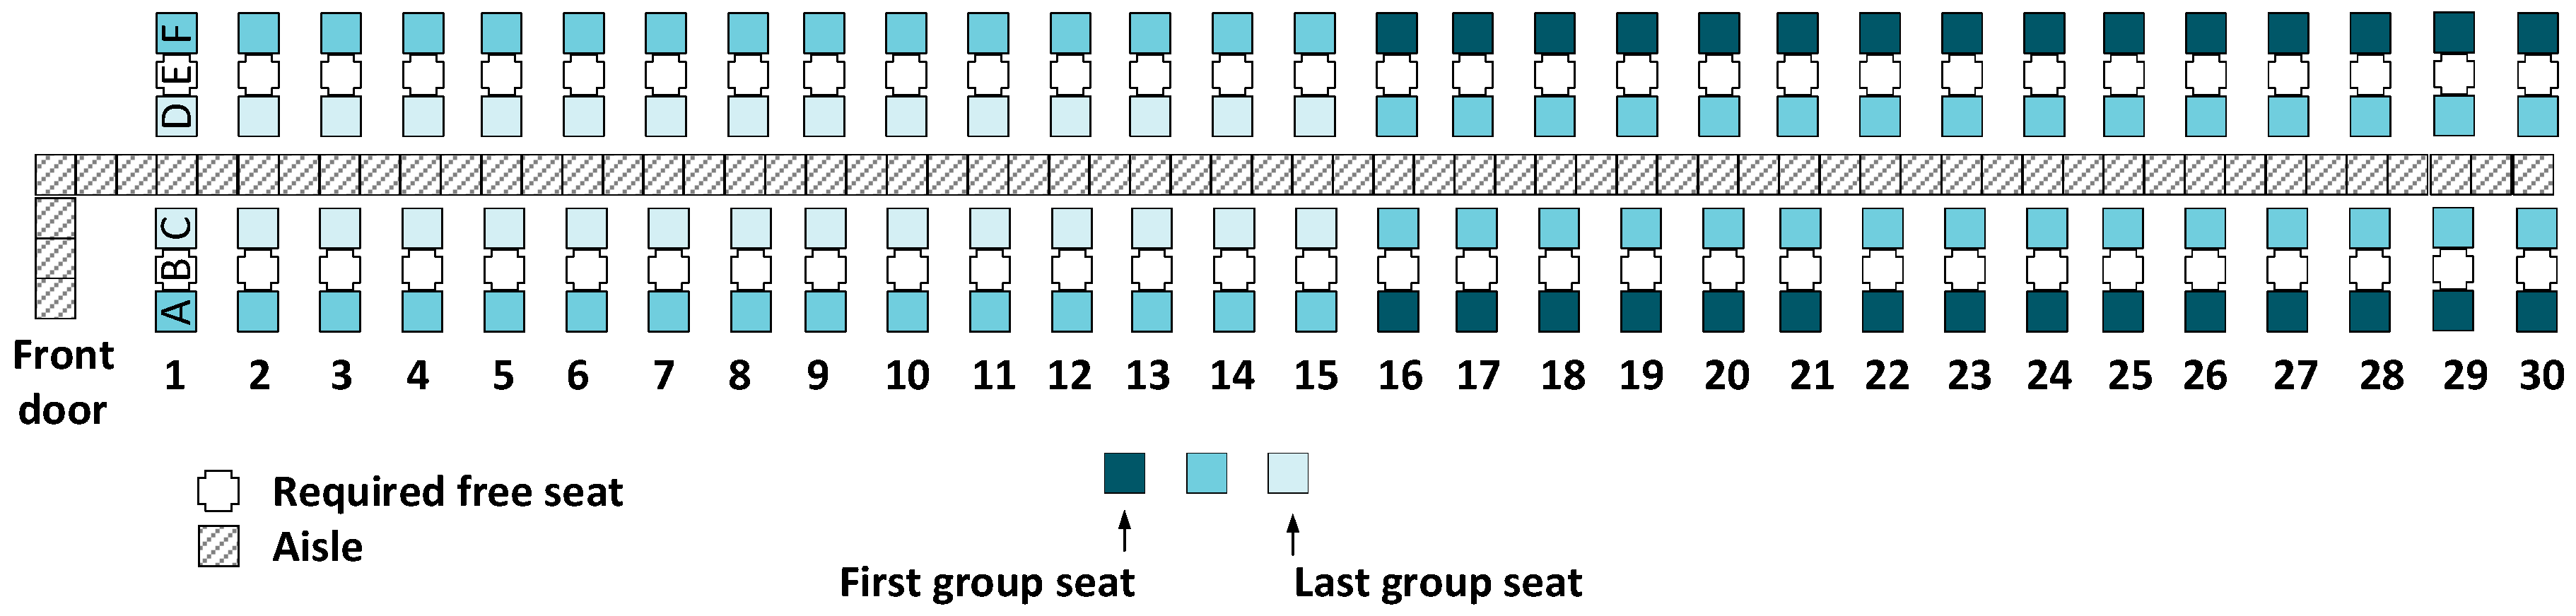
The back-to-front by group boarding method divides passengers into a specified number of groups (often five groups with each boarding group containing passengers seated in 1/5 of the rows). The boarding process begins with passengers who have seats in the rear rows of the airplane and continues through to the final boarding group of those passengers who have seats in the front rows of an airplane [
44].
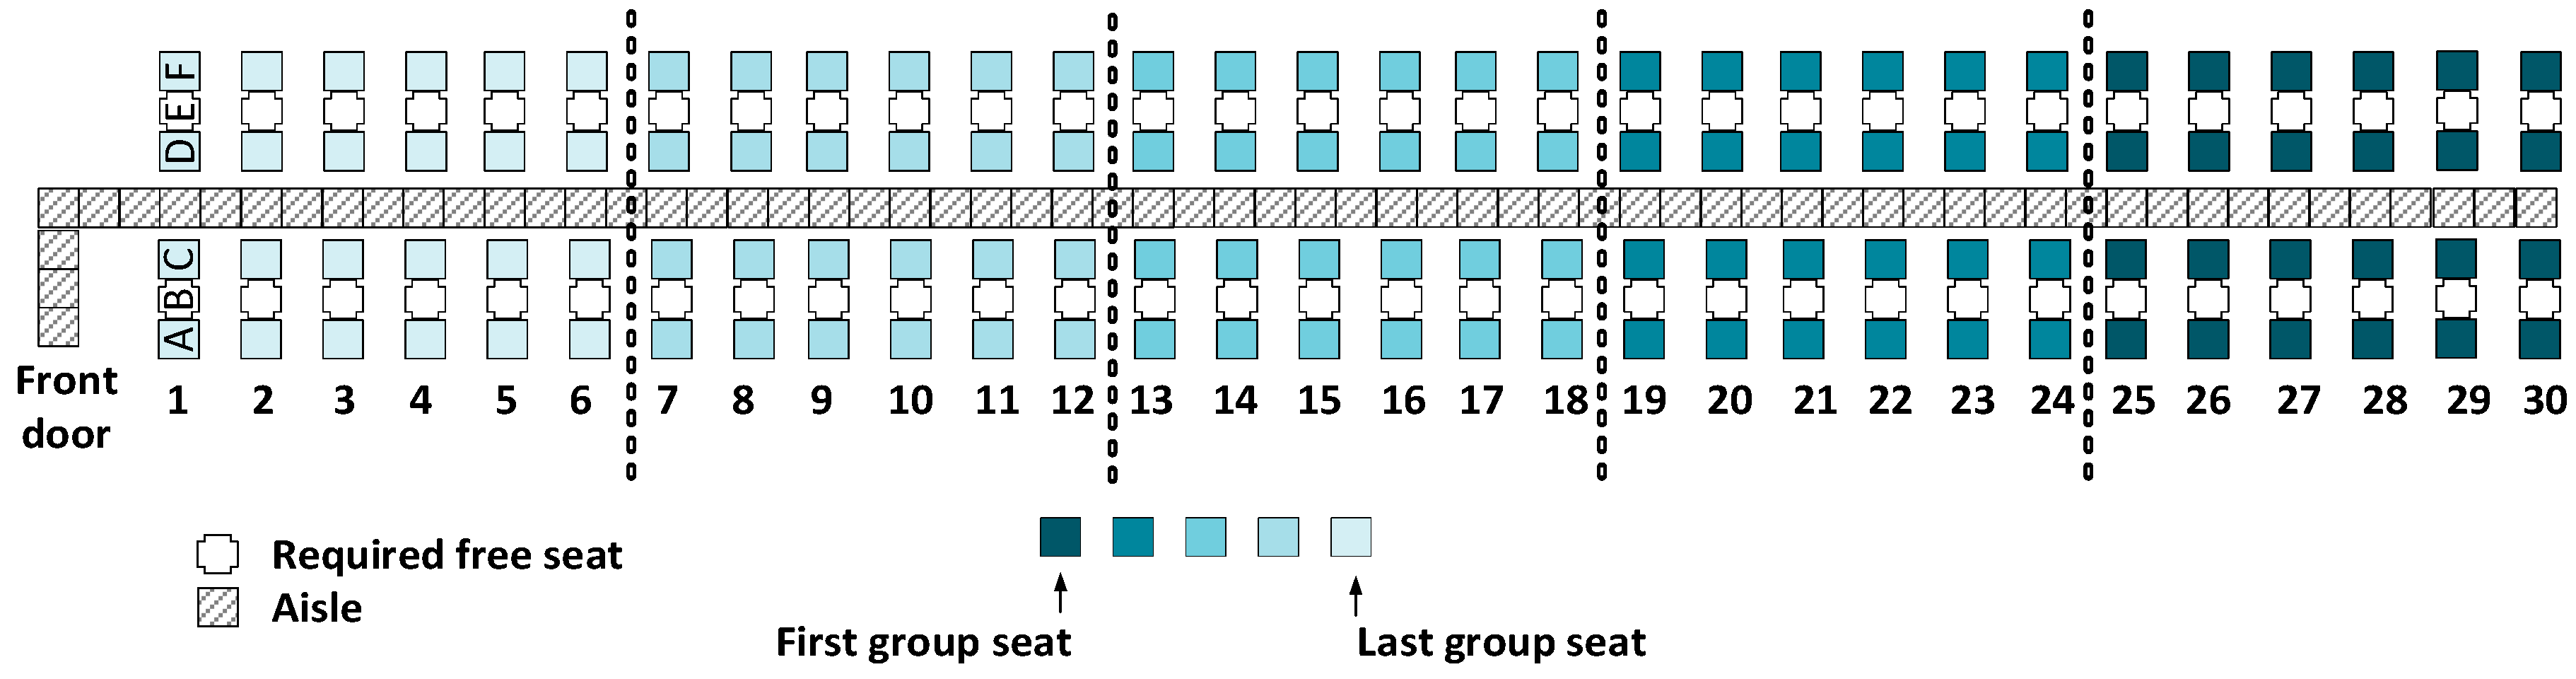
In the case of the reverse pyramid boarding method, the passengers are divided into several groups (for example, five groups) which load diagonally starting with a first boarding group comprising 2/3 of the seats located near the windows in the middle–rear side of the airplane and ending with a group formed by the passengers with aisle seats located in the middle–front part of the airplane [
4,
13,
48].
The modified optimal method features four groups. Passengers are assigned to the groups based on their seat locations in odd or even rows, on one side or the other side of the airplane’s aisle [
9].
The rotating zone method considers the existence of five groups determined by dividing the airplane into five zones. The first boarding group includes the passengers assigned to seats in the front rows of the airplane, the second group comprises passengers with seats located in the rear rows of the airplane. The third and the fourth groups include passengers assigned to seats located in the rows in the middle–front and middle–rear part of the airplane [
49].
The “by seat” method, developed by Steffen [
2], implies the call of the passengers one-by-one to board an airplane. The first passenger to board is the one that has the seat in the rear of the airplane near the window. The second passenger to board is the one that has a seat two rows in front of the first passenger, also near the window. The last passenger to board is the one with a seat in the first row of the airplane near the aisle [
2].
As presented above, we observe that the rules apply consistently in all the boarding methods to seats on both sides of the aisle, preserving a symmetry with respect to the aisle.
Considering the methods used in practice, we note that a series of European companies, such as Air France, EasyJet, KLM, Lufthansa, Ryanair, Tarom, and WizzAir, have embraced the random, with assigned seat boarding methods that allows the passengers to line up in no particular order to board an airplane and to proceed to their seats once they arrive inside the cabin [
27], while Southwest Airlines, an American airline company, uses the random boarding method without assigned seats. This method, also known as the open seating method, allows every passenger to select (determine) their seat upon arriving inside the cabin [
50]. Other companies, such as United Airlines, Air Canada, Air China, Alaska, American Airlines, Delta, British Airways, Frontier, Japan Airlines, Korean Air, Spirit, Virgin Atlantic, and JetBlue, favor “by group” boarding methods: WilMA, back-to-front by group, back-to-front by row, and modified reverse pyramid half zone.
One “by seat” method was tested on selected flights by KLM in 2013 [
50]. Another “by seat” method was tested by EasyJet for a two-month trial at Gatwick Airport [
51,
52,
53]. The latter method is similar to the Steffen method, except with passengers boarding back-to-front by column in every row rather than the Steffen approach of every other row. To the best of our knowledge, no “by seat” method has been adopted in practice aside from the KLM and EasyJet tests.
Apart from the elements mentioned in the Introduction related to the conditions considered over time for proposing or simulating different boarding methods, the approaches used for the evaluation of these methods have varied in the scientific literature. Over time, the following approaches have been used: cellular Discrete-Event System Specification (Cell-DEVS) modeling [
54], cell-based computer simulation [
21], computer simulation [
3,
8,
47,
48,
55], Markov Chain Monte Carlo optimization algorithm and computer simulation [
2], Discrete-Event simulation [
3], linear programming [
24,
48,
56], genetic algorithm [
4], grid-based simulation model [
57], stochastic modeling [
58,
59,
60], agent-based modelling [
11,
44,
61], empirical tests of the performance of the considered boarding methods [
22], and simulated annealing [
15].
Various factors have been considered, related but not limited to: the number of rows or airplane type [
1,
4,
21,
22,
62], airplane occupancy [
1,
3,
22,
25,
46,
47,
63], seat selection [
21,
49], using one or both airplane doors for boarding [
1,
2,
3,
4,
5,
8,
9,
10,
13,
17,
24,
45,
56,
63,
64], passenger movement [
2,
49], passengers’ personal characteristics [
46,
62,
63], the presence of carry-on hand luggage [
1,
2,
17,
56,
63], seat and aisle interferences [
20,
65,
66], and group behavior [
16,
17,
18,
19].
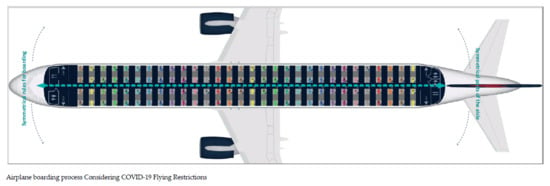
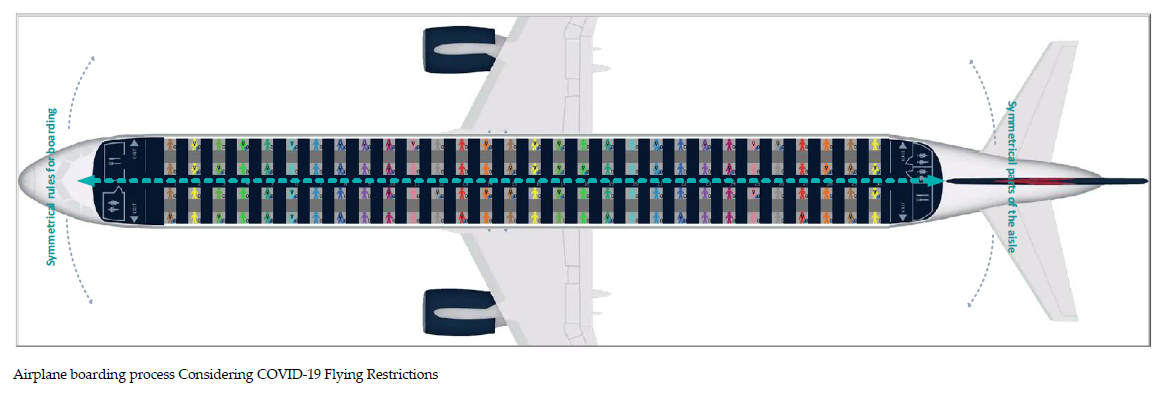
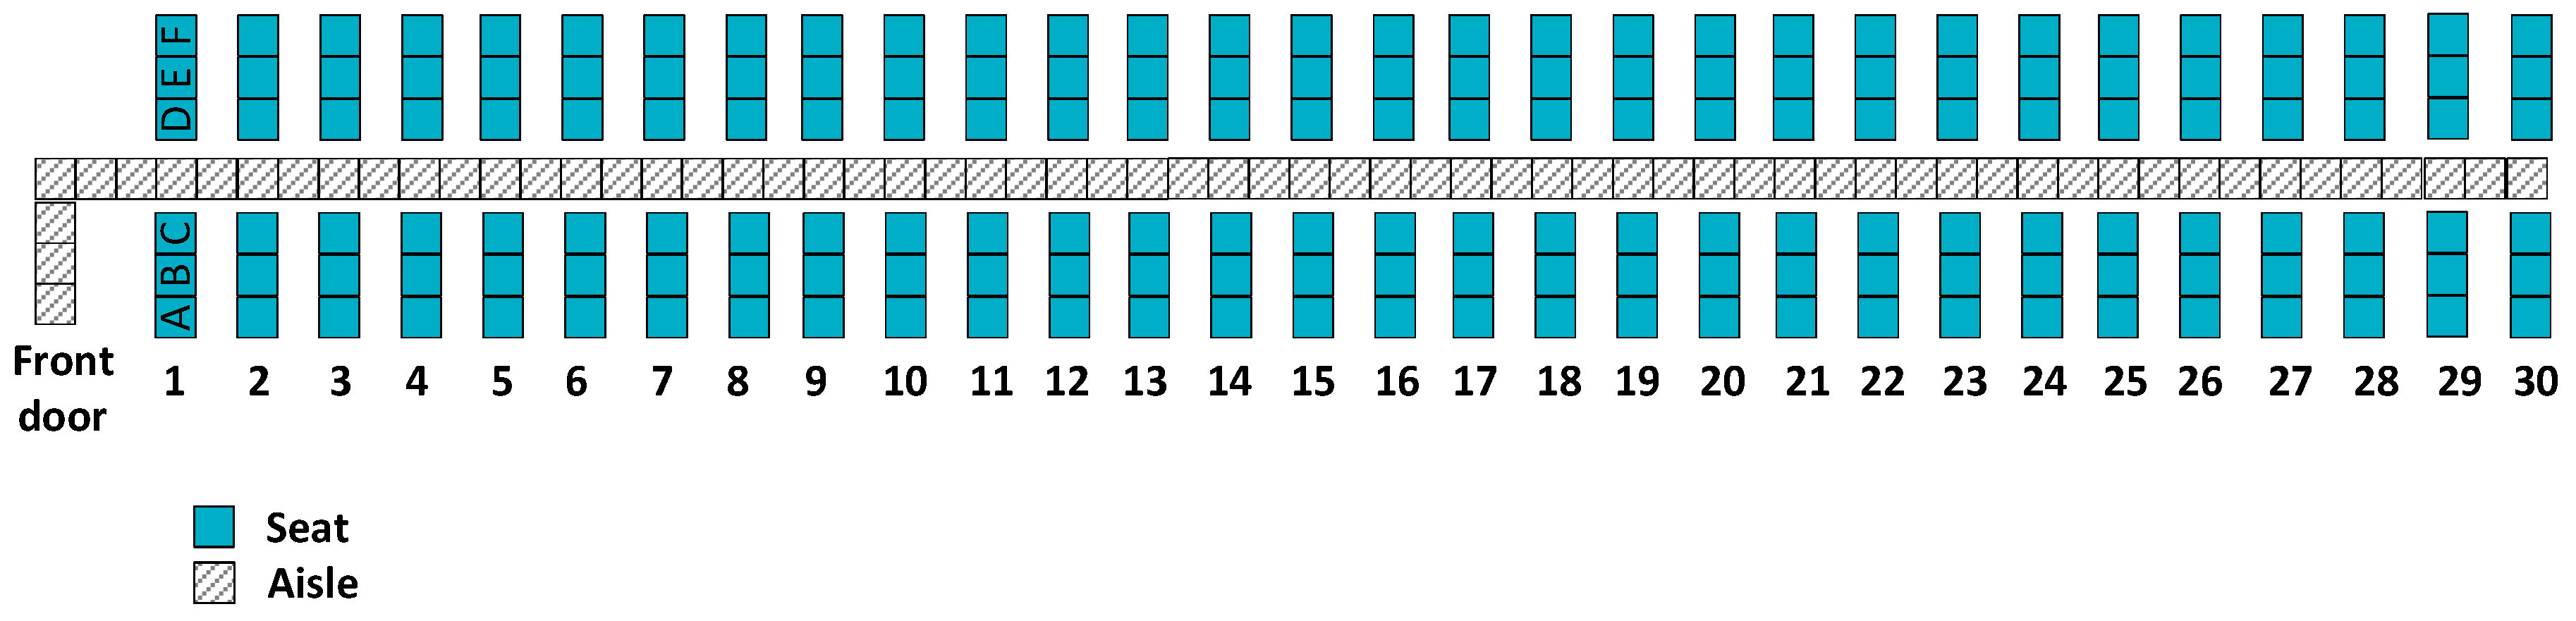
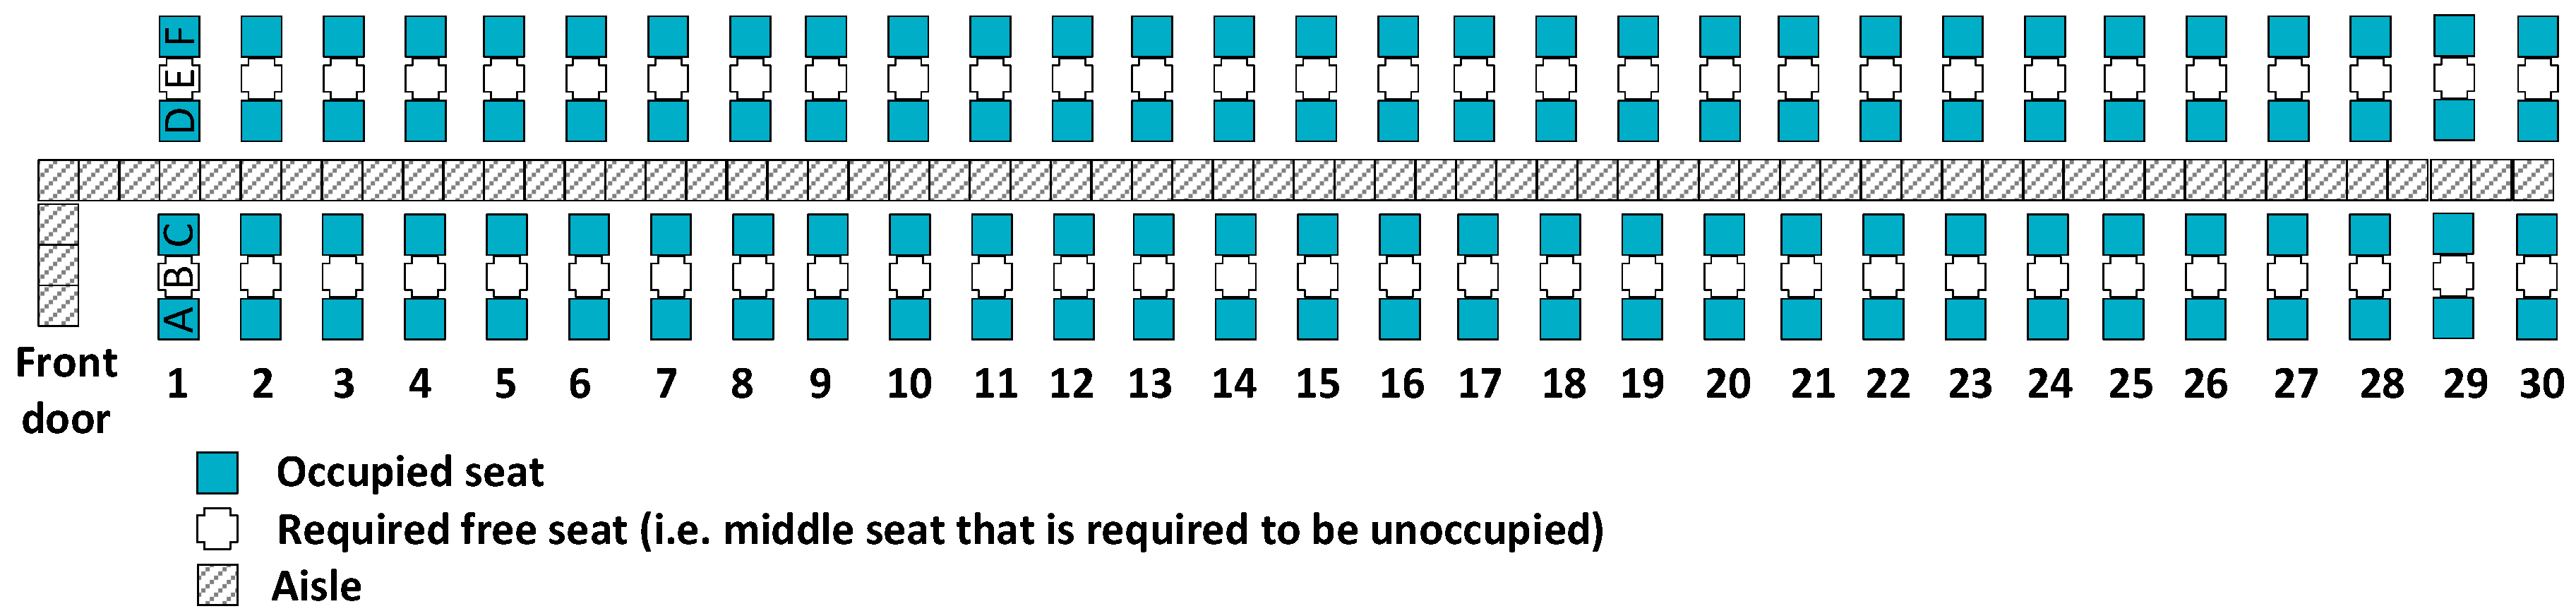
In this paper, we use a single-door Airbus A320 configuration with one aisle, thirty rows, and three seats on each side of the aisle, as suggested by [
14,
67] and depicted in
Figure 1. All seats are considered economy class.
4. Agent-Based Model Implementation
In the following section, we discuss the agent-based model implemented to simulate the passenger boarding process in terms of agents and their interactions. Compared to other modeling techniques, the agent-based model provides the needed basis for imitating the details of a mechanism or a real process without involving too much statistical or mathematical modeling. As Manzo [
68] noticed, the “enormous flexibility made possible by agent-based simulation” represents “its originality in comparison to other methods of computer simulation conceived as a support for statistical and mathematical analysis” (Manzo [
68], p. 435). Glen et al. [
69] have shown in recent research that the agent-based models are “unique in their ability to integrate combinations of heterogeneous processes and investigate their respective dynamics, especially in the context of spatial phenomena” (Glen et al. [
69], p. 1), while Currie et al. [
70] mention in a recent paper that agent-based modeling is appropriate for incorporating variability in human behavior into the model and for observing to which extent some small changes in the analyzed situation and interactions among agents can influence different levels of the outputs.
We chose the NetLogo platform for creating the agent-based model due to the advantages it offers over other agent-based modeling platforms, such as: a visual interface, fast access to documentation, easy installation, integrated graphics, real-time user access on an agent’s state, execution speed, free use of the platform, and the existence of a community which supports the development of models in various economic areas [
44,
71,
72,
73,
74].
To present the inside of the airplane cabin, the “patches” agents were used, each of them possessing different characteristics in accordance with their purpose, either to represent the aisle, seats, or the spaces between the seat rows. The “patches” are small square pieces of ground, each of them measuring 0.4 m × 0.4 m, as suggested by [
14,
75]. A series of properties were assigned to each patch, as stated in [
9].
The boarding passengers were represented using the “turtles” agents, each of them having its own speed, which can range between 0–1 patch/tick (the “tick” is the time moment in NetLogo and it corresponds to 1.2 s [
9]), based on their individual properties, which might depend on various factors, such as age, weight, and mobility. The turtle agent can carry different pieces of luggage inside the aircraft (one small bag, 2 small bags, one large bag, one large and one small bag, or no bag—as detailed in
Table 1) which reduces its speed between 0.6–0.9 patch/tick. Additionally, to store the luggage in the overhead compartment, each agent needs a luggage storage time, which is determined based on the formula suggested by [
76] and used in [
1,
9,
11,
19,
24]:
where:
Tstore is the time to store the luggage
NbinLarge is the number of large bags in the bin prior to the passenger’s arrival
NbinSmall is the number of small bags in the bin prior to the passenger’s arrival
NpassengerLarge is the number of large bags carried by the passenger
NpassengerSmall is the number of small bags carried by the passenger
Trow is the time for a passenger to walk from one row to the next (when not delayed by another passenger in front)
At time zero, the first agent enters the cabin using the front door of the airplane and proceeds to its assigned seat. Depending on the selected boarding method, agents having seats in different parts of the airplane are called for boarding with respect to the selected boarding method rules. In the case of random without assigned seats, the passenger’s preference for a particular part of the airplane (front/middle/aisle) or a particular type of seat (near window/aisle) was determined through a fitness function, which considers all these aspects. The fitness function is based on the results gathered through a questionnaire in a previous study [
27].
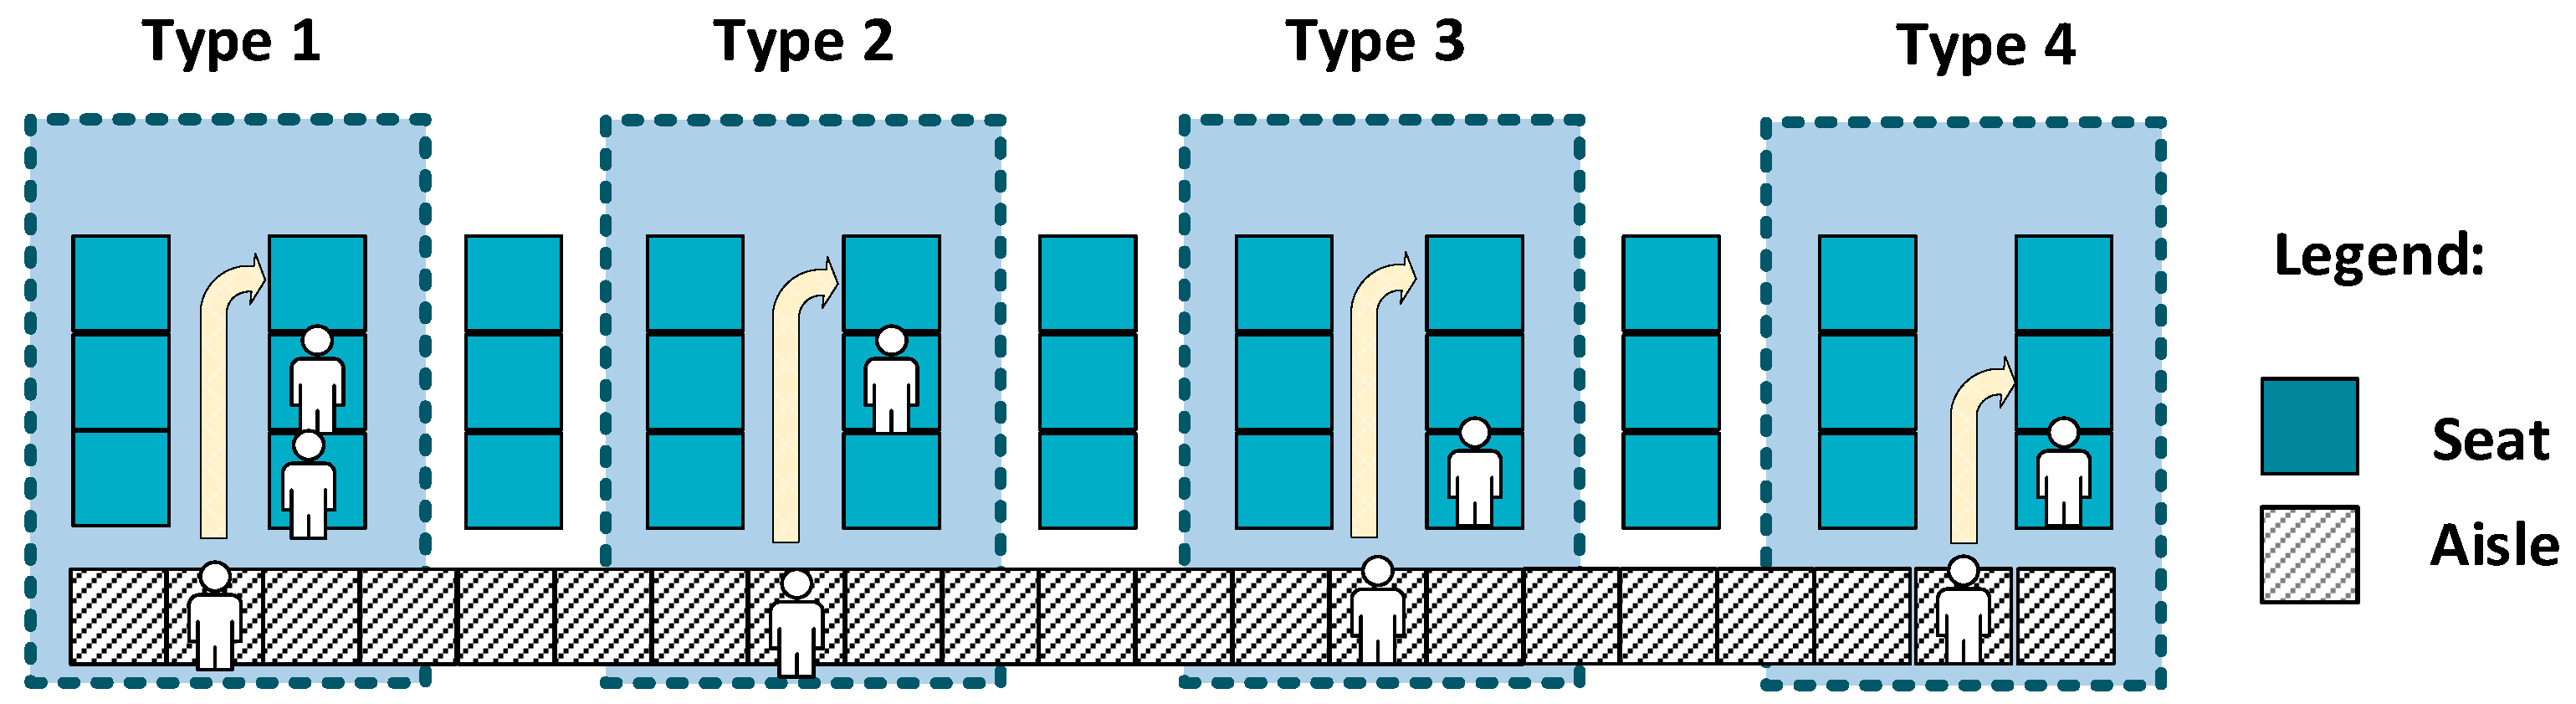
Upon entering the cabin, the agents advance down the aisle to their assigned seats, keeping the imposed distance from another passenger in the aisle (1 m, 1.5 m, or 2 m). When it arrives near its assigned seat, if an agent has one or two pieces of luggage, it needs to first store the luggage, blocking the aisle for any passengers behind it—those other passengers will wait for the agent to store the luggage, while preserving the social aisle distance imposed (1 m, 1.5 m, or 2 m). After the luggage is stored, the agent proceeds to its seat. If the seat is near the window and the aisle seat located in the same row is already occupied by another agent, the agent faces a type 3 seat interference and waits for the agent seated in the aisle seat to free its path and then proceeds to its assigned seat. In the time during which the seat interference takes place, none of the passengers located in the aisle behind the passenger engaged in the seat interference can overpass the agent; they can only advance in the aisle within the limits permitted by the aisle distancing, namely keeping an imposed distance of 1 m, 1.5 m, or 2 m. According to the literature, the time associated with a type 3 interference is 10 s, with a range of 9–13 s, as determined in the field trial conducted by Schultz [
14]. The simulation ends when all of the agents have taken their assigned seats.
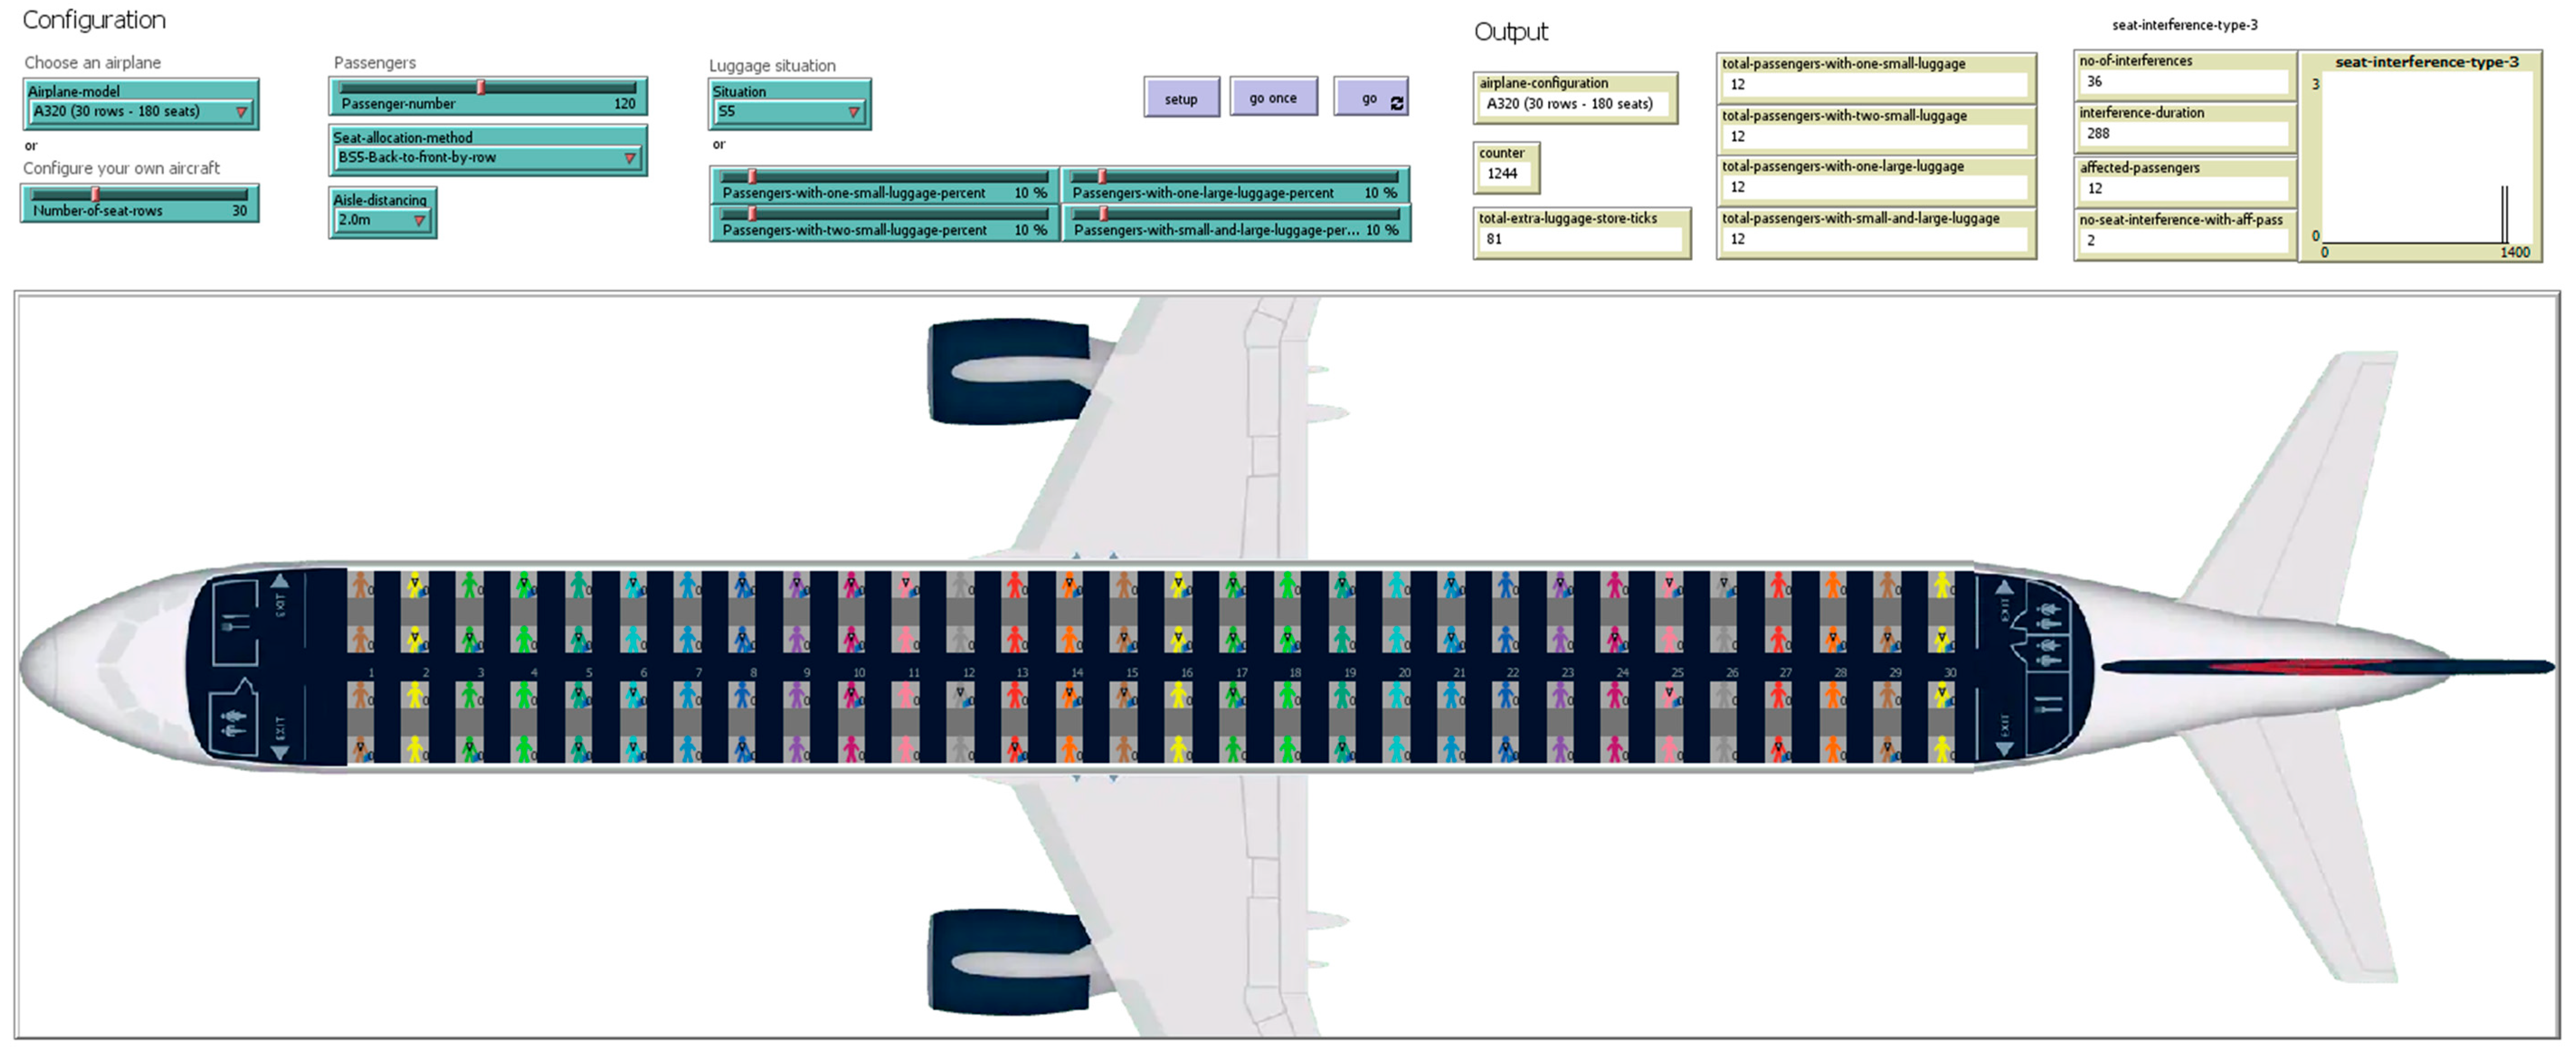
The agent-based model graphical user interface (GUI) is presented in
Figure 8.
5. Numerical Simulation Results
We used the BehaviourSpace [
72] tool provided by NetLogo to run 10,000 simulations for each of the considered scenarios. Below, we present the average values for each scenario.
Section 5.1,
Section 5.2 and
Section 5.3 present the average performance metrics with (social) aisle distancing of 1 m, 1.5 m, and 2 m, respectively, while
Section 5.4 discusses the results across all of the aisle distancing scenarios.
5.1. Simulation Results for Aisle Distancing of 1 m
Considering an aisle distancing of 1 m, the average times to complete boarding are shown in
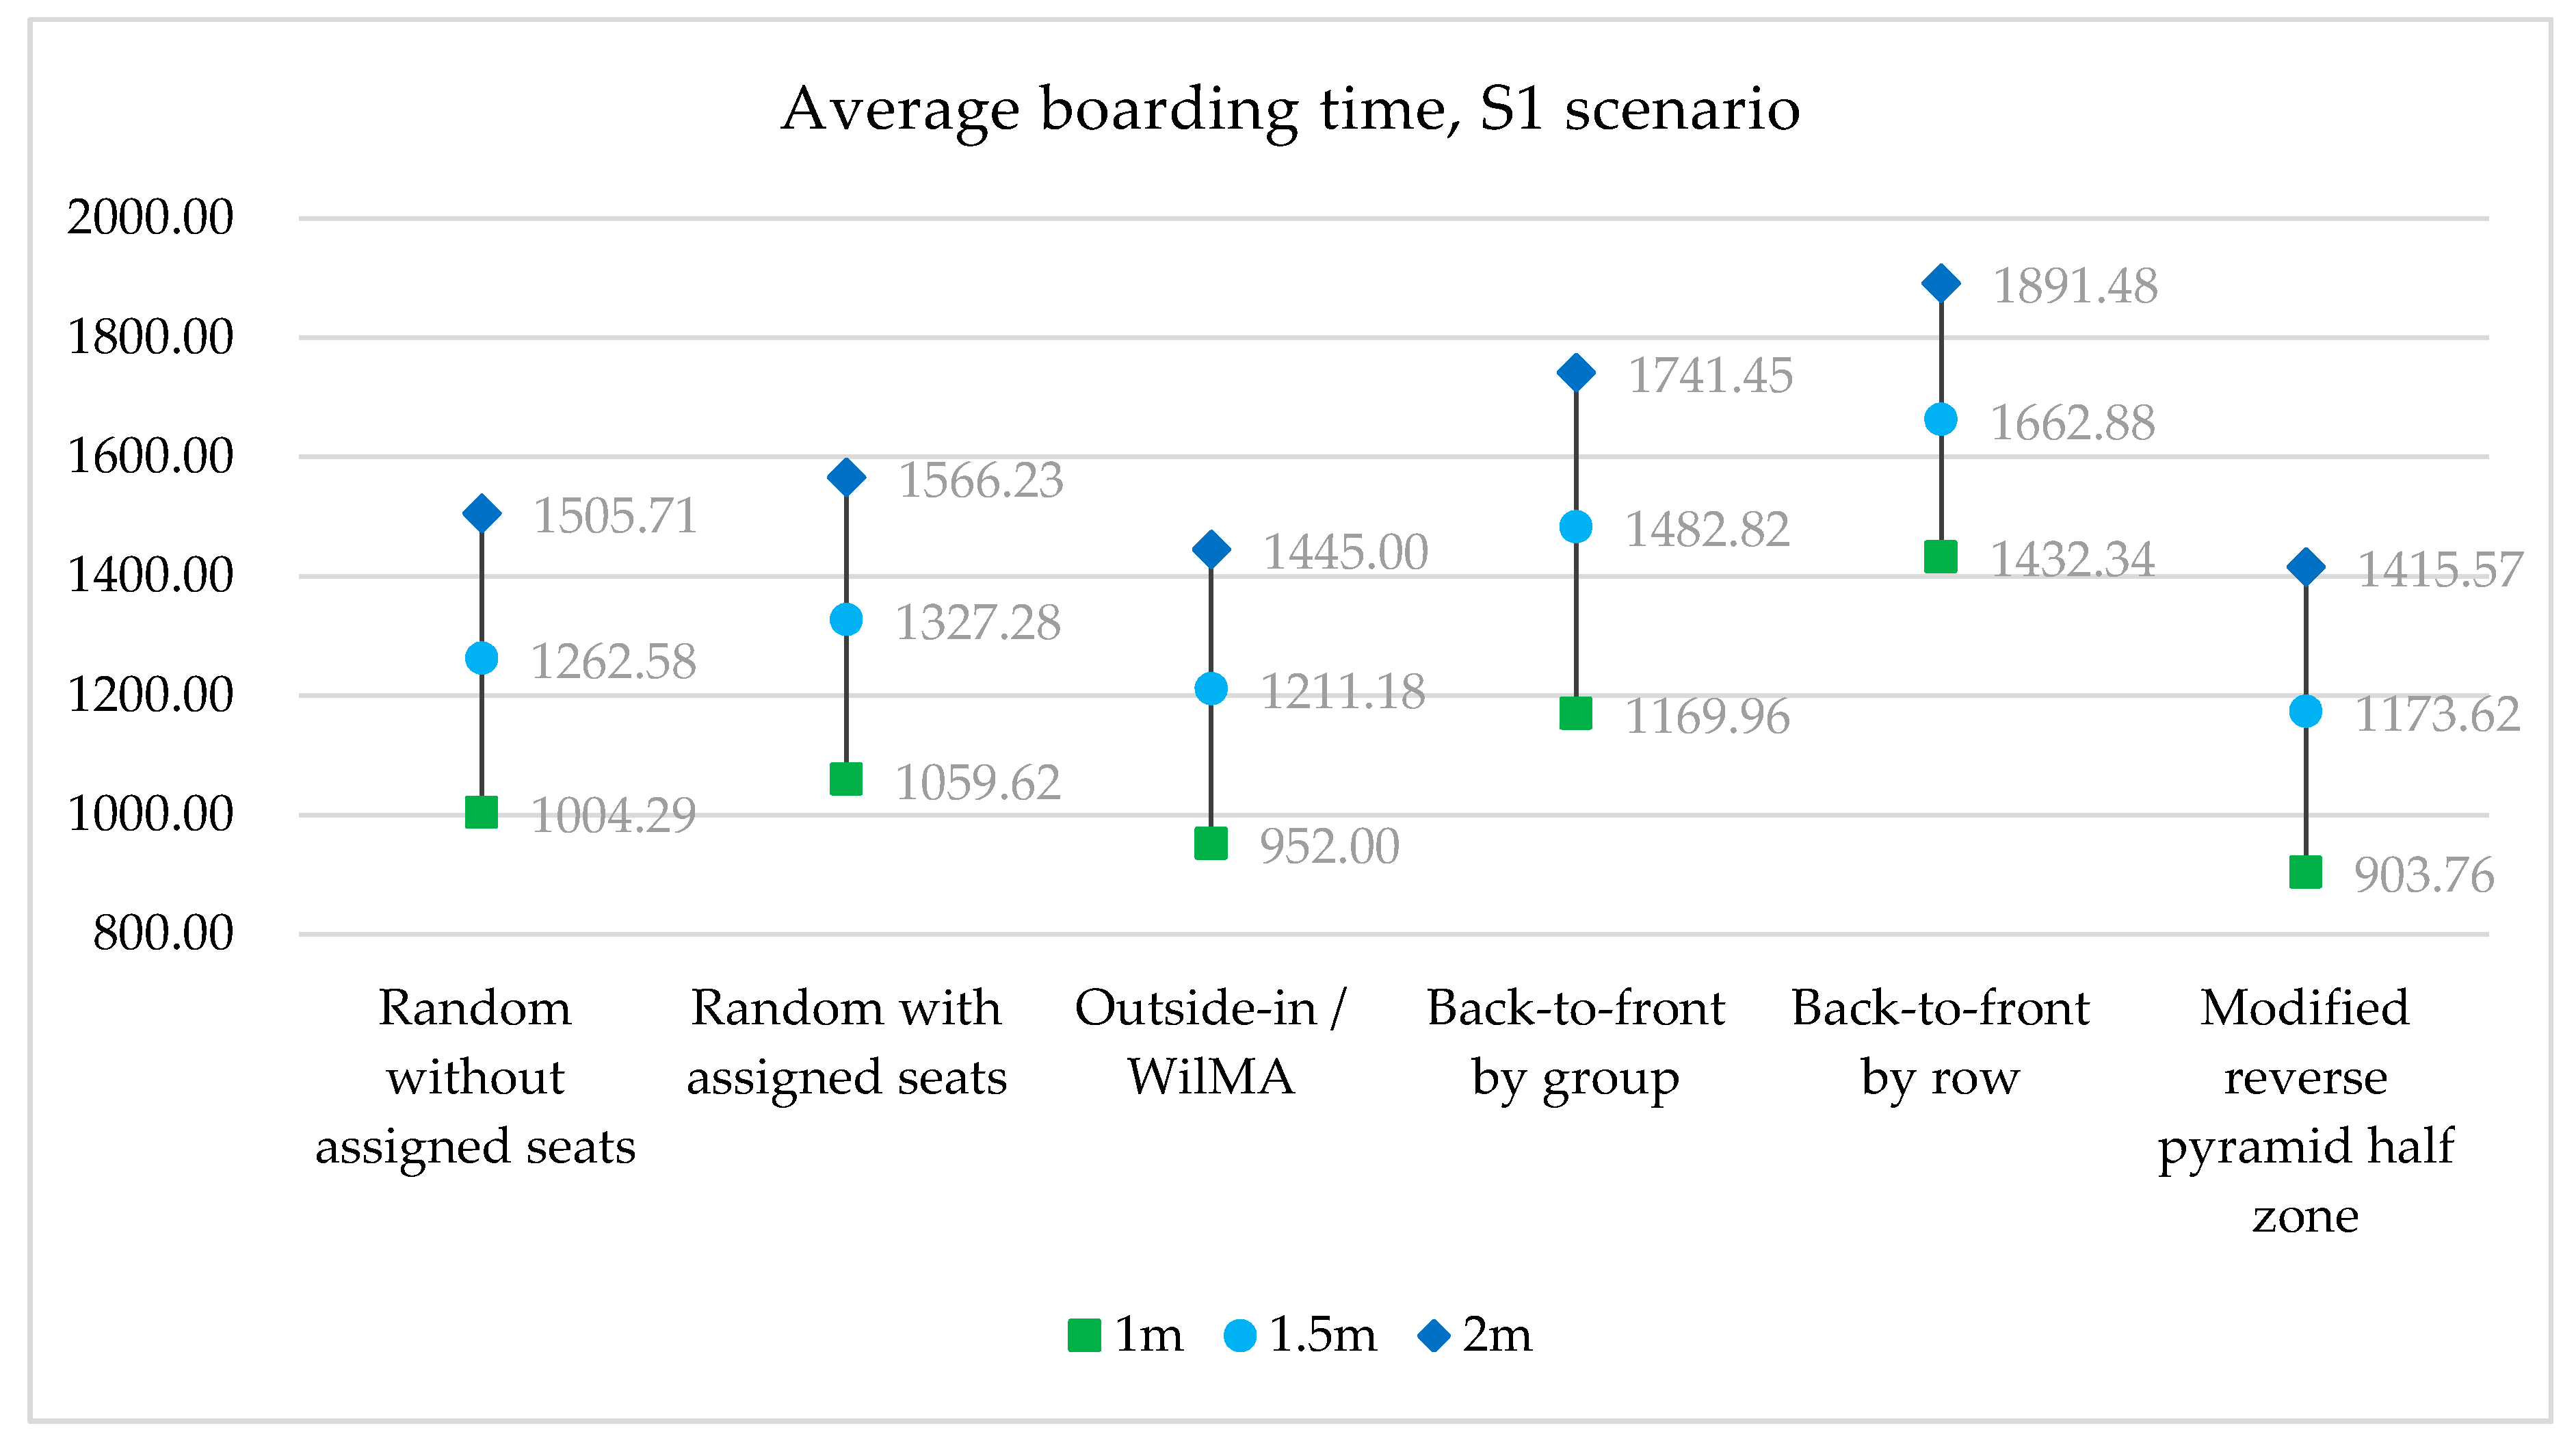
Table 3. The method providing the fastest boarding time was the modified reverse pyramid half zone, with an average boarding time ranging between 8 min 38 s and 15 min 3 s, depending on the types and quantities of passengers’ carry-on luggage. The second-fastest boarding method was WilMA, ranging between 9 min 8 s and 15 min 52 s. Random without assigned seats and random with assigned seats yielded comparable results, while the method with the largest boarding time was back-to-front by row, which offered a boarding time between 12 min 59 s and 23 min 52 s. For the S1 luggage situation, the back-to-front by row method resulted in a boarding time that was 58.58% longer than that resulting from the modified reverse pyramid half zone method.
The number of type 3 seat interferences is depicted in
Table 4. We observed that two of the methods, namely WilMA and the modified reverse pyramid half zone, had zero for this metric. This result was expected, because with these two methods, the passengers with window seats were the ones taking their assigned seats first, followed by the passengers with aisle seats. A reduced value for this criterion was obtained in the case of random without assigned seats as, considering the passengers’ preferences presented in [
27], we observed that the window seats are preferred to the aisle seats. As for the remaining methods—random with assigned seats, back-to-front by group, and back-to-front by row—the average number of seat interferences was essentially the same and ranged between 29 and 31 interferences, as shown in
Table 4. Tiny differences in numerical results can stem from the random variability inherent in stochastic simulation models.
The average total extra luggage storage duration for each of the considered scenarios showed no significant difference among the six considered boarding methods, as presented in
Table 5. This is not surprising because the rules for each of the methods ignore passenger safety during luggage storage in the overhead compartment. As a result, no boarding method tested was superior with respect to this metric.
Table 6 shows the aisle seat risks of the six methods. This pertains to the risk of aisle seated passengers becoming infected by later boarding passengers traversing their row. The best performing method according to this type of risk was back-to-front by row, with a total duration of 984 s for S1 luggage situation, 757 s less than the second-best method based on this metric—modified reverse pyramid half zone. In considering the boarding rules of the back-to-front by row method, we observed that this risk was generated in the row in which the boarding passenger sits, as all the other rows traversed by a boarding passenger were empty. The modified reverse pyramid half zone method produced the second-smallest values for this risk on all the luggage situations as the boarding was done on two halves of the airplane with respect to the number of rows, which reduced the passengers’ aisle seat risk for half of the aisles at a time. The worst performing method for this metric was the random with assigned seats boarding method, with durations of up to 986.76% times higher than the best performing method—back-to-front by row.
For the window seat risk, the back-to-front by row method continued to have the smallest duration, with a value of 714 s for S1 luggage situation, as shown in
Table 7. The second-best method was back-to-front by group with durations up to 32.23% higher than the best-performing method—back-to-front by row. As both WilMA and random without assigned seats favor the occupancy of the window seats first, these methods had high values for this metric. The highest values were recorded by random without assigned seats, which were up to 2377.98% higher than those obtained for the best performing method, according to this criterion, as shown in
Table 7.
5.2. Simulation Results for Aisle Distancing of 1.5 m
We conducted a series of simulations for the S1–S7 luggage scenarios, while imposing an aisle distance for the passengers of 1.5 m.
With respect to the average boarding time, we observed that the boarding methods relative performance hierarchy established for 1m aisle distancing was the same in this case, as shown in
Table 8. The method with the smallest boarding time was, again, the modified reverse pyramid half zone. The boarding times for this method ranged between 11 min 26 s and 19 min and 34 s.
The average total numbers of seat interferences for 1.5 m aisle distance, as shown in
Table 9 were essentially the same as those resulting from the 1 m aisle distancing, presented in
Table 4. The tiny differences of this magnitude stem from the variability of stochastic simulation.
Furthermore, the average total extra luggage storage duration did not change significantly across the boarding methods, as shown in
Table 10. When compared to the 1m aisle distance situation, as shown in
Table 5, the absolute difference was less than two seconds.
The aisle seats risk determined for the 1.5 m aisle distancing, as shown in
Table 11, provided the same hierarchy (relative performance results) for the boarding methods, as determined for 1 m aisle distancing, as shown in
Table 6. The best performing method (back-to-front by row) provided a duration that was 9.76 times smaller than the worst performing method (random with assigned seats).
The window seats risk calculated for the 1.5 m aisle distancing situation, as shown in
Table 12, did not provide any new information in terms of the boarding methods performance hierarchy when compared to the 1 m aisle distancing, provided in
Table 7. The best performing method according to this metric was back-to-front by row, which resulted in a duration up to 706 s, as shown in
Table 12.
If one compares the values for the window seats risk, recorded for both 1 m and 1.5 m aisle distancing, as shown in
Table 7 and
Table 12, we observe that the increase in aisle distancing by 0.5 m contributes to a decrease in risk for five of the six methods, with a decrease of up to 252 s. The only exception is the back-to-front by row method, where the values for this risk had almost the same values (within a 7–8 s variation range), regardless of aisle distancing.
5.3. Simulation Results for Aisle Distancing of 2 m
The 2 m aisle distance resulted in higher boarding times for all the boarding methods, as shown in
Table 13. Depending on the quantity of luggage, the average boarding time took up to 31 min 31 s in the case of back-to-front by row. Again, in this case, the best-performing method was the modified reverse pyramid half zone, with an average boarding time of up to 23 min 36 s.
In terms of the number of total seat interferences, no meaningful changes were observed comparing the 2 m aisle distancing, as shown in
Table 14, with those of the 1 m and 1.5 m aisle distancing.
Furthermore, the average total extra luggage storage durations were, again, consistent across the boarding methods with respect to the imposed aisle distancing, as shown in
Table 15.
Again, in this case, the aisle seats risk was lower for the back-to-front by row method when compared to the other considered boarding methods, as shown in
Table 16. We further observed that the increasement of 0.5 m aisle distancing (from 1.5 m to 2 m) produced a reduction of up to 288 s in the duration associated with this risk for five of the six boarding methods.
The window seats risk in the case of 2 m aisle distancing, as shown in
Table 17, provided the same hierarchy for the boarding methods, as established for 1m and 1m aisle distancing, as shown in
Table 7 and
Table 12).
As for the duration of the window seats risk, when compared to the duration of the same risk in the case of 1.5 aisle distancing, the duration was reduced by up to 271 s. Furthermore, when compared to the 1m aisle distancing situation, the reduction in duration was up to 424 s, illustrating once more that increasing aisle distancing can reduce the window seats risk. This reduction was highly visible for the boarding methods which did not perform well for the window seats risk metric, such as: random without assigned seats, WilMA, and even random with assigned seats. For the best performing method, back-to-front by row, the value of aisle distancing did not make a meaningful difference in the window seats risk.
5.4. Simulation Results Summarized across All Aisle Distancing 1 m, 1.5 m, and 2 m
It is interesting to analyze the influence of (social) aisle seat distancing on aisle seat risk and window seat risk. For the back-to-seat by row method, there was no influence other than insignificant differences that arose due to the randomness of stochastic simulation. For the other five boarding methods, the greater the value of aisle distancing, the smaller the resulting aisle and seat risks. We observe those relationships from the close examination of the differences in aisle seat risks from
Table 6,
Table 11, and
Table 16, as the aisle distancing changed from 1 m to 1.5 m to 2 m, and from
Table 7,
Table 12, and
Table 17, examining the analogous impact on window seat risks from the aisle distancing changing from 1 m to 1.5 m to 2 m. However, the clearest way to see the relationships is to examine
Table 18, which contains the total seat risk durations (summing over both aisle seat risk and window seat risk), with 1 m aisle distancing minus the total seat risk durations with 2 m aisle distancing.
It is important to recall that the seat risk durations stem from passengers advancing towards the row of their seat and (if infected) spreading the virus to previously boarding passengers already seated in the rows the advancing passenger enters. For the back-to-front by row method, this risk is only generated in the row in which the passenger sits, because all the other rows ahead of a boarding passenger are empty. Consequently, we would expect no meaningful change in the total seat risk duration of the back-to-front row method as aisle distancing changes from 1 m to 2 m. This is consistent with the results illustrated in
Table 18.
For the other five methods, consider what happened when aisle distancing changed from 1 m to 2 m. Suppose passenger X follows passenger Y down the aisle. Suppose further that Y hinders the progress of X. This could be because Y is walking at a slower speed than X. More commonly, X would be delayed while Y stores luggage into an overhead bin and sits in a row prior to the row where X will sit. Once Y has left the aisle, X may walk without interference for at least 1 m (with 1 m aisle distancing) and for at least 2 m (with 2 m aisle distancing). In the latter case, X may proceed for the next 2 m at a faster speed on average (because of no interference) than in the former case (because of potential interference in the second of those two meters). We see the ramifications in
Table 18, where for five of the methods the average total seat risk duration was consistently less with 2 m aisle distancing than with 1 m aisle distancing for all but the S7 (no luggage) scenario. Consequently, even though aisle distancing was designed, as illustrated in the example, to reduce the risk of virus spread between passengers X and Y, an additional benefit is that increased aisle distancing reduces the health risk to previously boarded passengers sitting in rows that X passes.
Looking at all the performance metrics in
Table 19 (where the methods performing better according to a specific criterion are highlighted using dark grey, while the methods performing worse are highlighted using light grey), we see the relative performances of the six boarding methods that apply to all of the conditions of aisle distancing (1 m, 1.5 m, and 2 m). We observed that the modified reverse pyramid half zone is the best method for both the boarding time and total number of seat interferences metrics, while back-to-front by row performs the worst, based on those two metrics.
For the health metric related to total extra luggage storage duration, no hierarchy is established as all of the six boarding methods have results in similar values.
As for the aisle and window seats risks metrics, the best performing method was back-to-front by row, followed by either modified reverse pyramid half zone (for the aisle seats risk criterion) or back-to-front by group (for the windows seats risk criterion). WilMA, random with assigned seats, and random without assigned seats ranked lowest in the hierarchy, according to these two risk metrics.
Considering the varying values for the aisle distancing and the S1 luggage situation, in
Figure 9 we observe that, when the aisle distancing increased from 1 m to 1.5 m, the average boarding time increased with values between 16.09–29.86%, with an average degradation across all methods of 25.15%.
If the aisle distance doubled, from 1 m to 2 m, the decrement in average boarding time ranged between 32.06% (in the case of back-to-front by row) to 56.63% (in the case of the modified reverse pyramid half zone), with an average of 47.84%. As a result, we observed that each increment in aisle distancing of 0.5 m increased the boarding time by about a quarter.
5.5. Discussions
The new social distancing rules imposed by the occurrence of the COVID-19 coronavirus affect humans’ everyday lives, from spare time to work-related activities. In this context, the classical boarding methods used for passengers boarding airplanes have been adjusted to reduce the risk of COVID-19 infections due to social interaction.
In this paper, a series of measures, related to airplane boarding taken or mooted by the airlines in during this pandemic, are evaluated in terms of boarding time and passenger health risk. We used an agent-based model in NetLogo to implement the passenger boarding processes under the new social distancing assumptions and for testing six of the classical boarding methods used in practice by the airlines.
As a result, we observed that the method providing the best boarding time was the modified reverse pyramid half zone, followed by WilMA, and random without assigned seats. The method with the largest boarding time was back-to-front by row. The aisle distance was determined to have an impact on the time to complete the boarding of the airplane. On average, every additional 0.5 m imposed for aisle distance between boarding passengers resulted in an approximate 25% increase in boarding time.
Another metric, one concerning passengers’ health, addressed seat interferences. Both the modified reverse pyramid half zone and WilMA boarding methods ensured no interferences among the passengers who had seats in the same row.
As for the extra luggage storage duration—a metric of the duration of time that passengers may be touching the luggage of other passengers, risking exposure due to touching a surface (luggage or otherwise) that may contain COVID-19 droplets—we observed that there was no best method, as all of the considered methods performed the same for this metric. This result was expected, as none of the rules of these boarding methods account for this health risk.
The aisle seats risk and the window seats risk were calculated to evaluate the classical boarding methods based on the health risk of passengers proceeding towards their seats infecting passengers already seated in earlier rows. Combining the results for both of these risk metrics, we observed that the best performing method was back-to-front by row, followed by back-to-front by group, and modified reverse pyramid half zones. We note that that Delta Air Lines boards passengers in a back-to-front by row sequence [
37,
38] as a part of COVID-19 restrictions for ensuring passenger safety during air transport.
As a result, the six classical boarding methods analyzed in the paper come with advantages and disadvantages in terms of boarding time and passenger safety during the COVID-19 pandemic, and the airlines have the difficult task of making a tradeoff between the economic benefits they from a fast boarding process and the various health impacts of them on their passengers.


