
Hemispheric Asymmetry in Visual Processing: An ERP Study on Spatial Frequency Gratings


Abstract
:1. Introduction
1.1. The Role of the Right vs. Left Hemisphere in Global and Local Processing
1.2. Object-Based vs. Space-Based Hemispheric Asymmetry
1.3. The Spatial Frequency Hypothesis
2. Materials and Methods
2.1. Participants
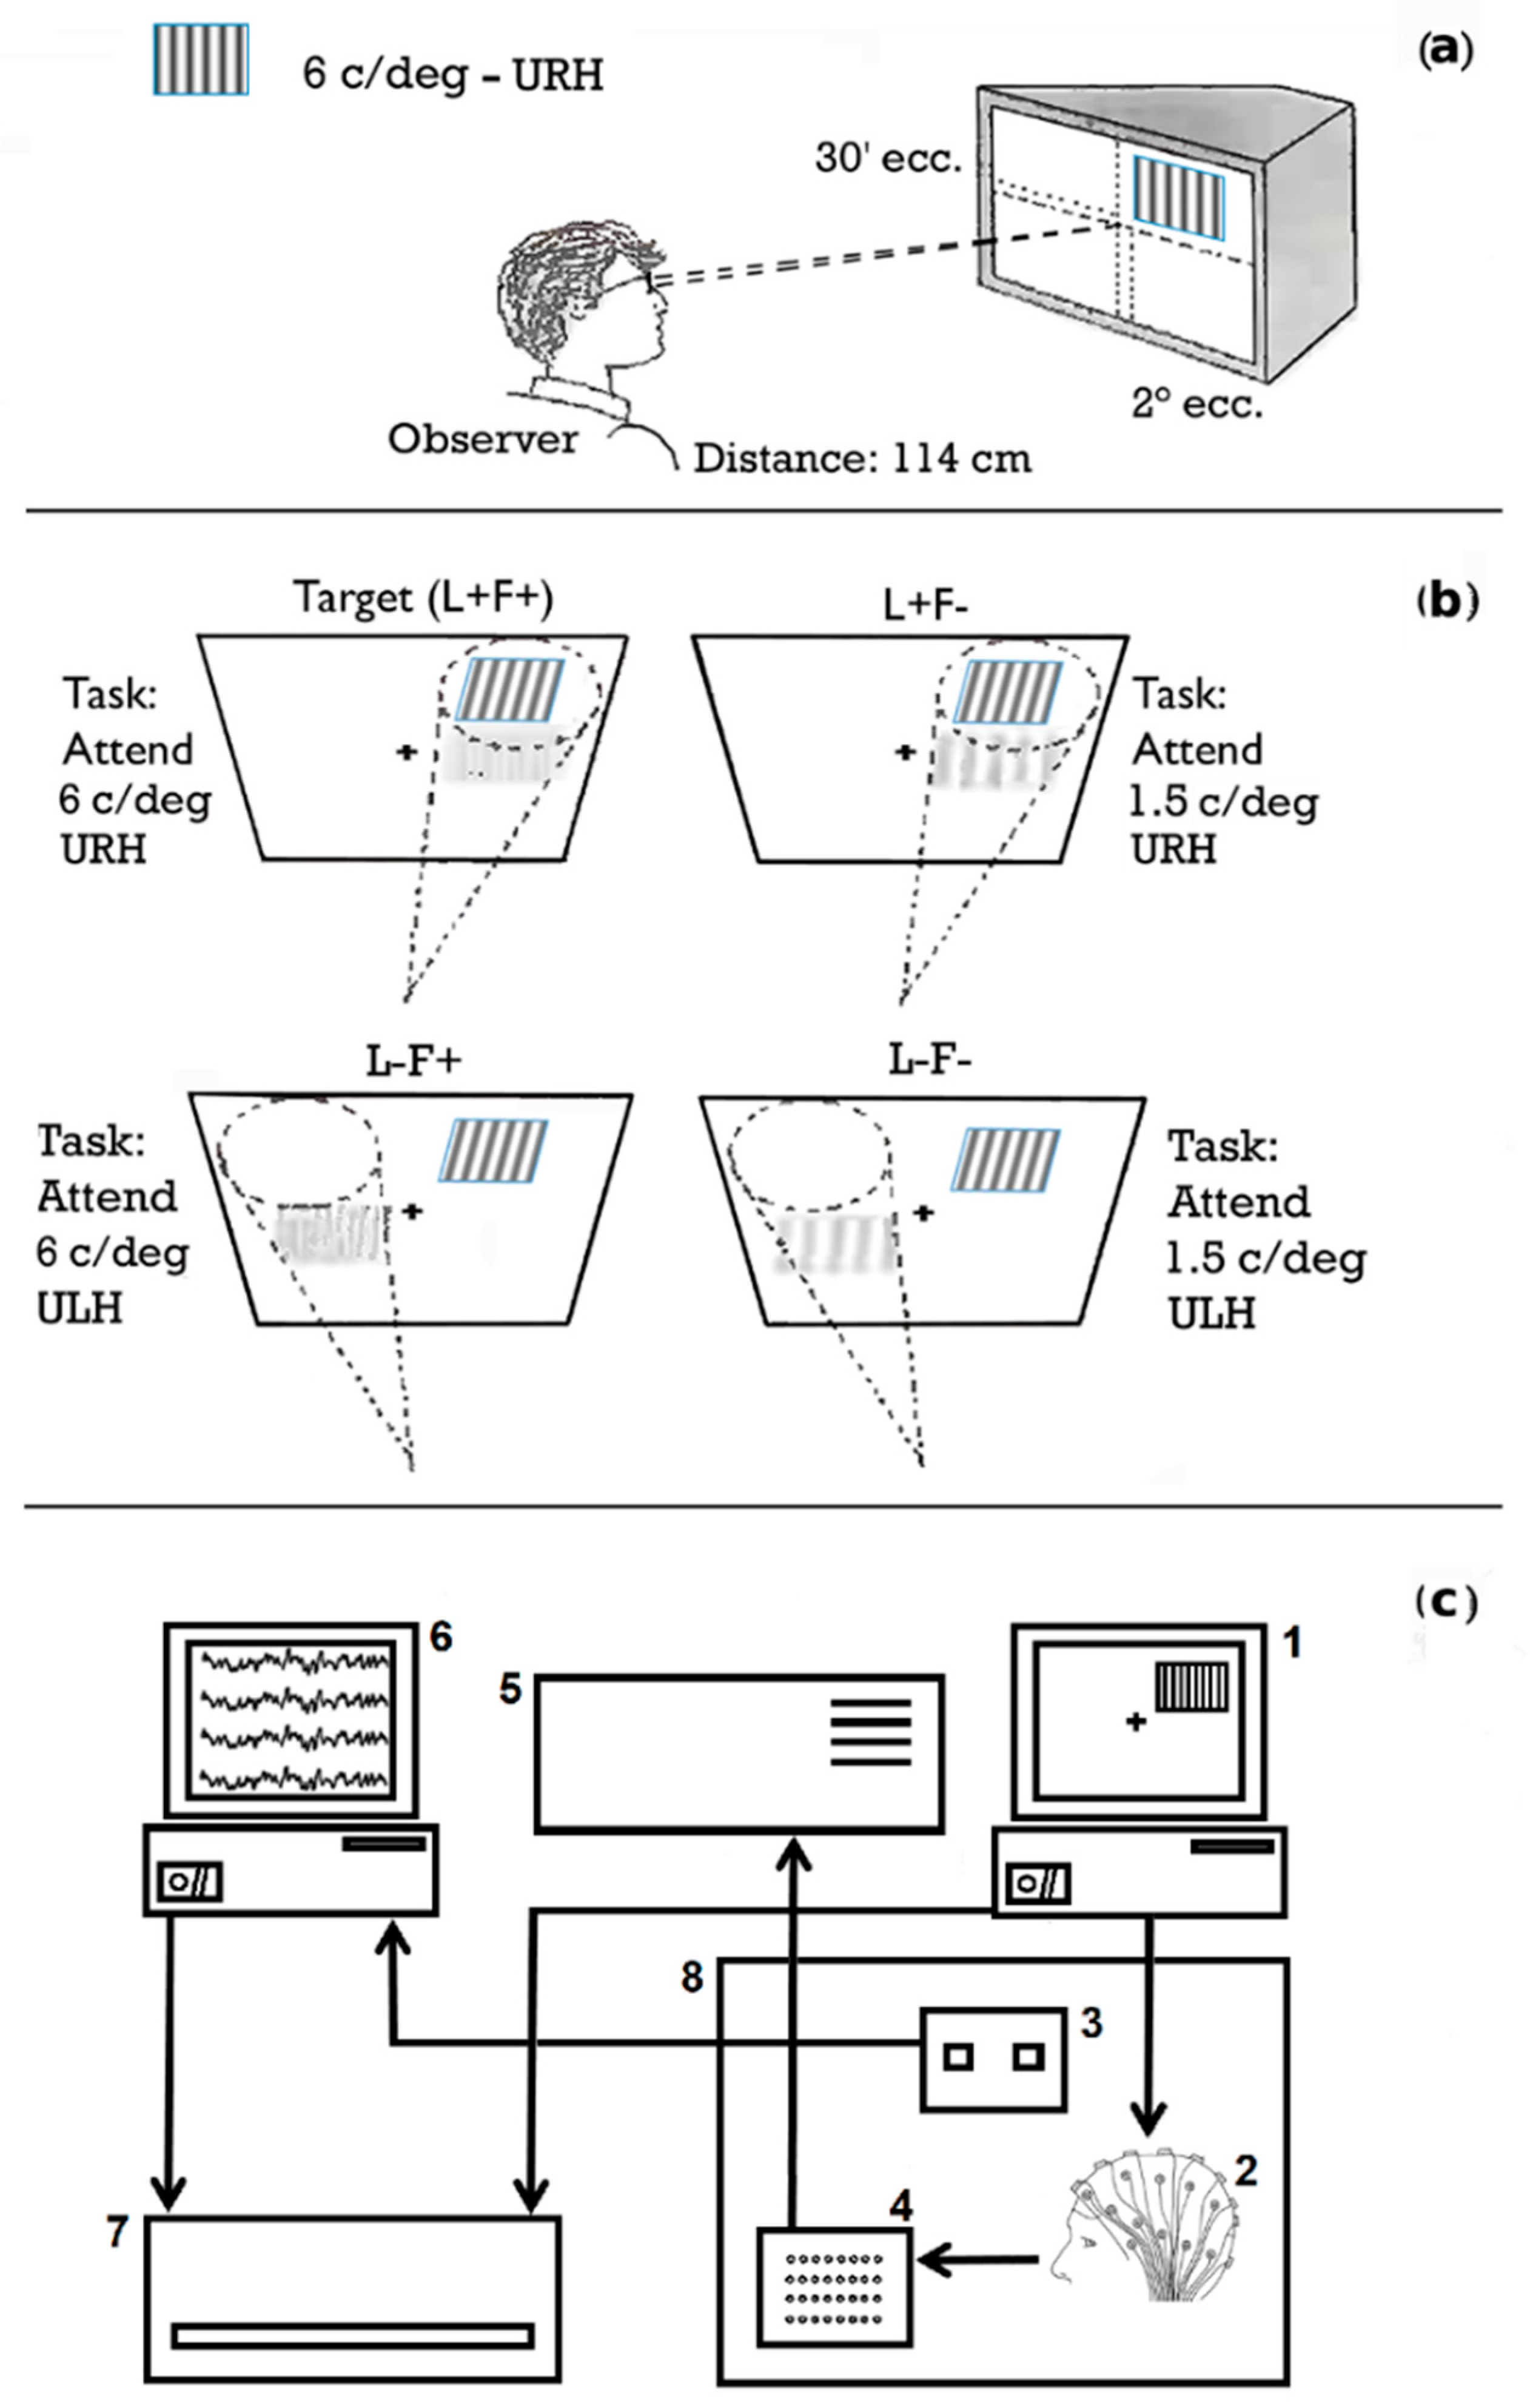
2.2. Stimuli
2.3. Procedure
2.4. EEG Recordings
2.5. Statistical Analysis
3. Results
3.1. Behavioral Data
3.2. Electrophysiological Data
3.2.1. C1 Component
3.2.2. P1 Component
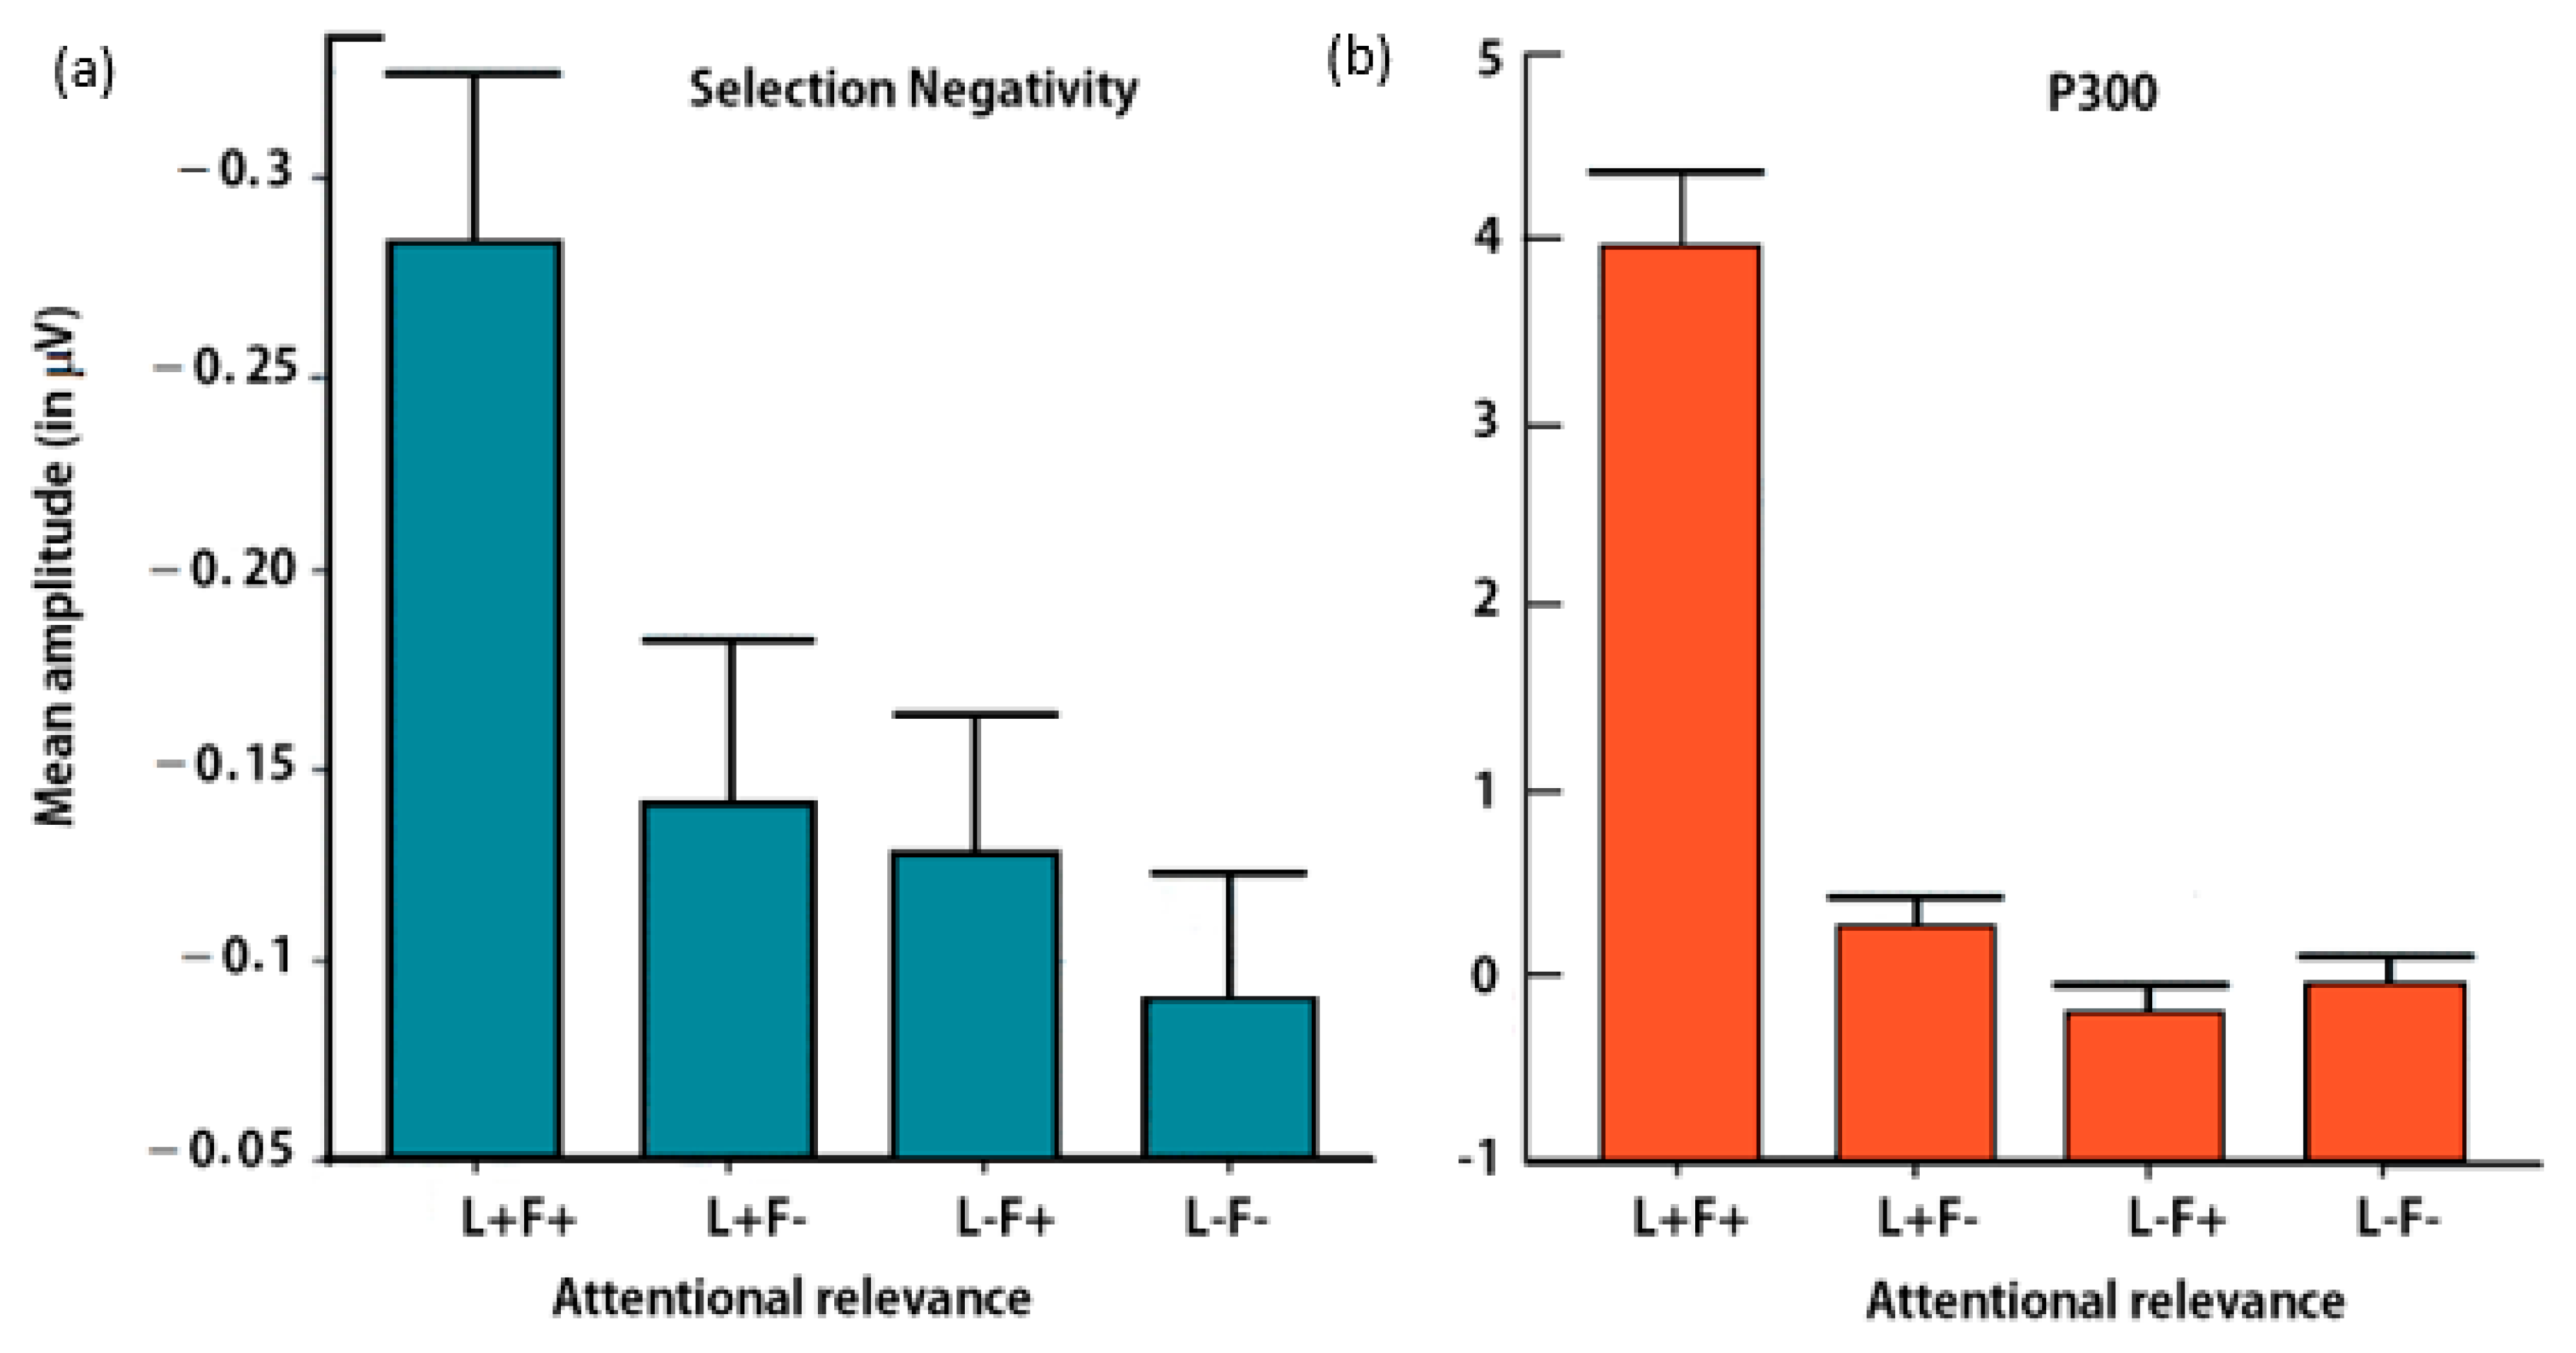
3.2.3. Selection Negativity (SN)
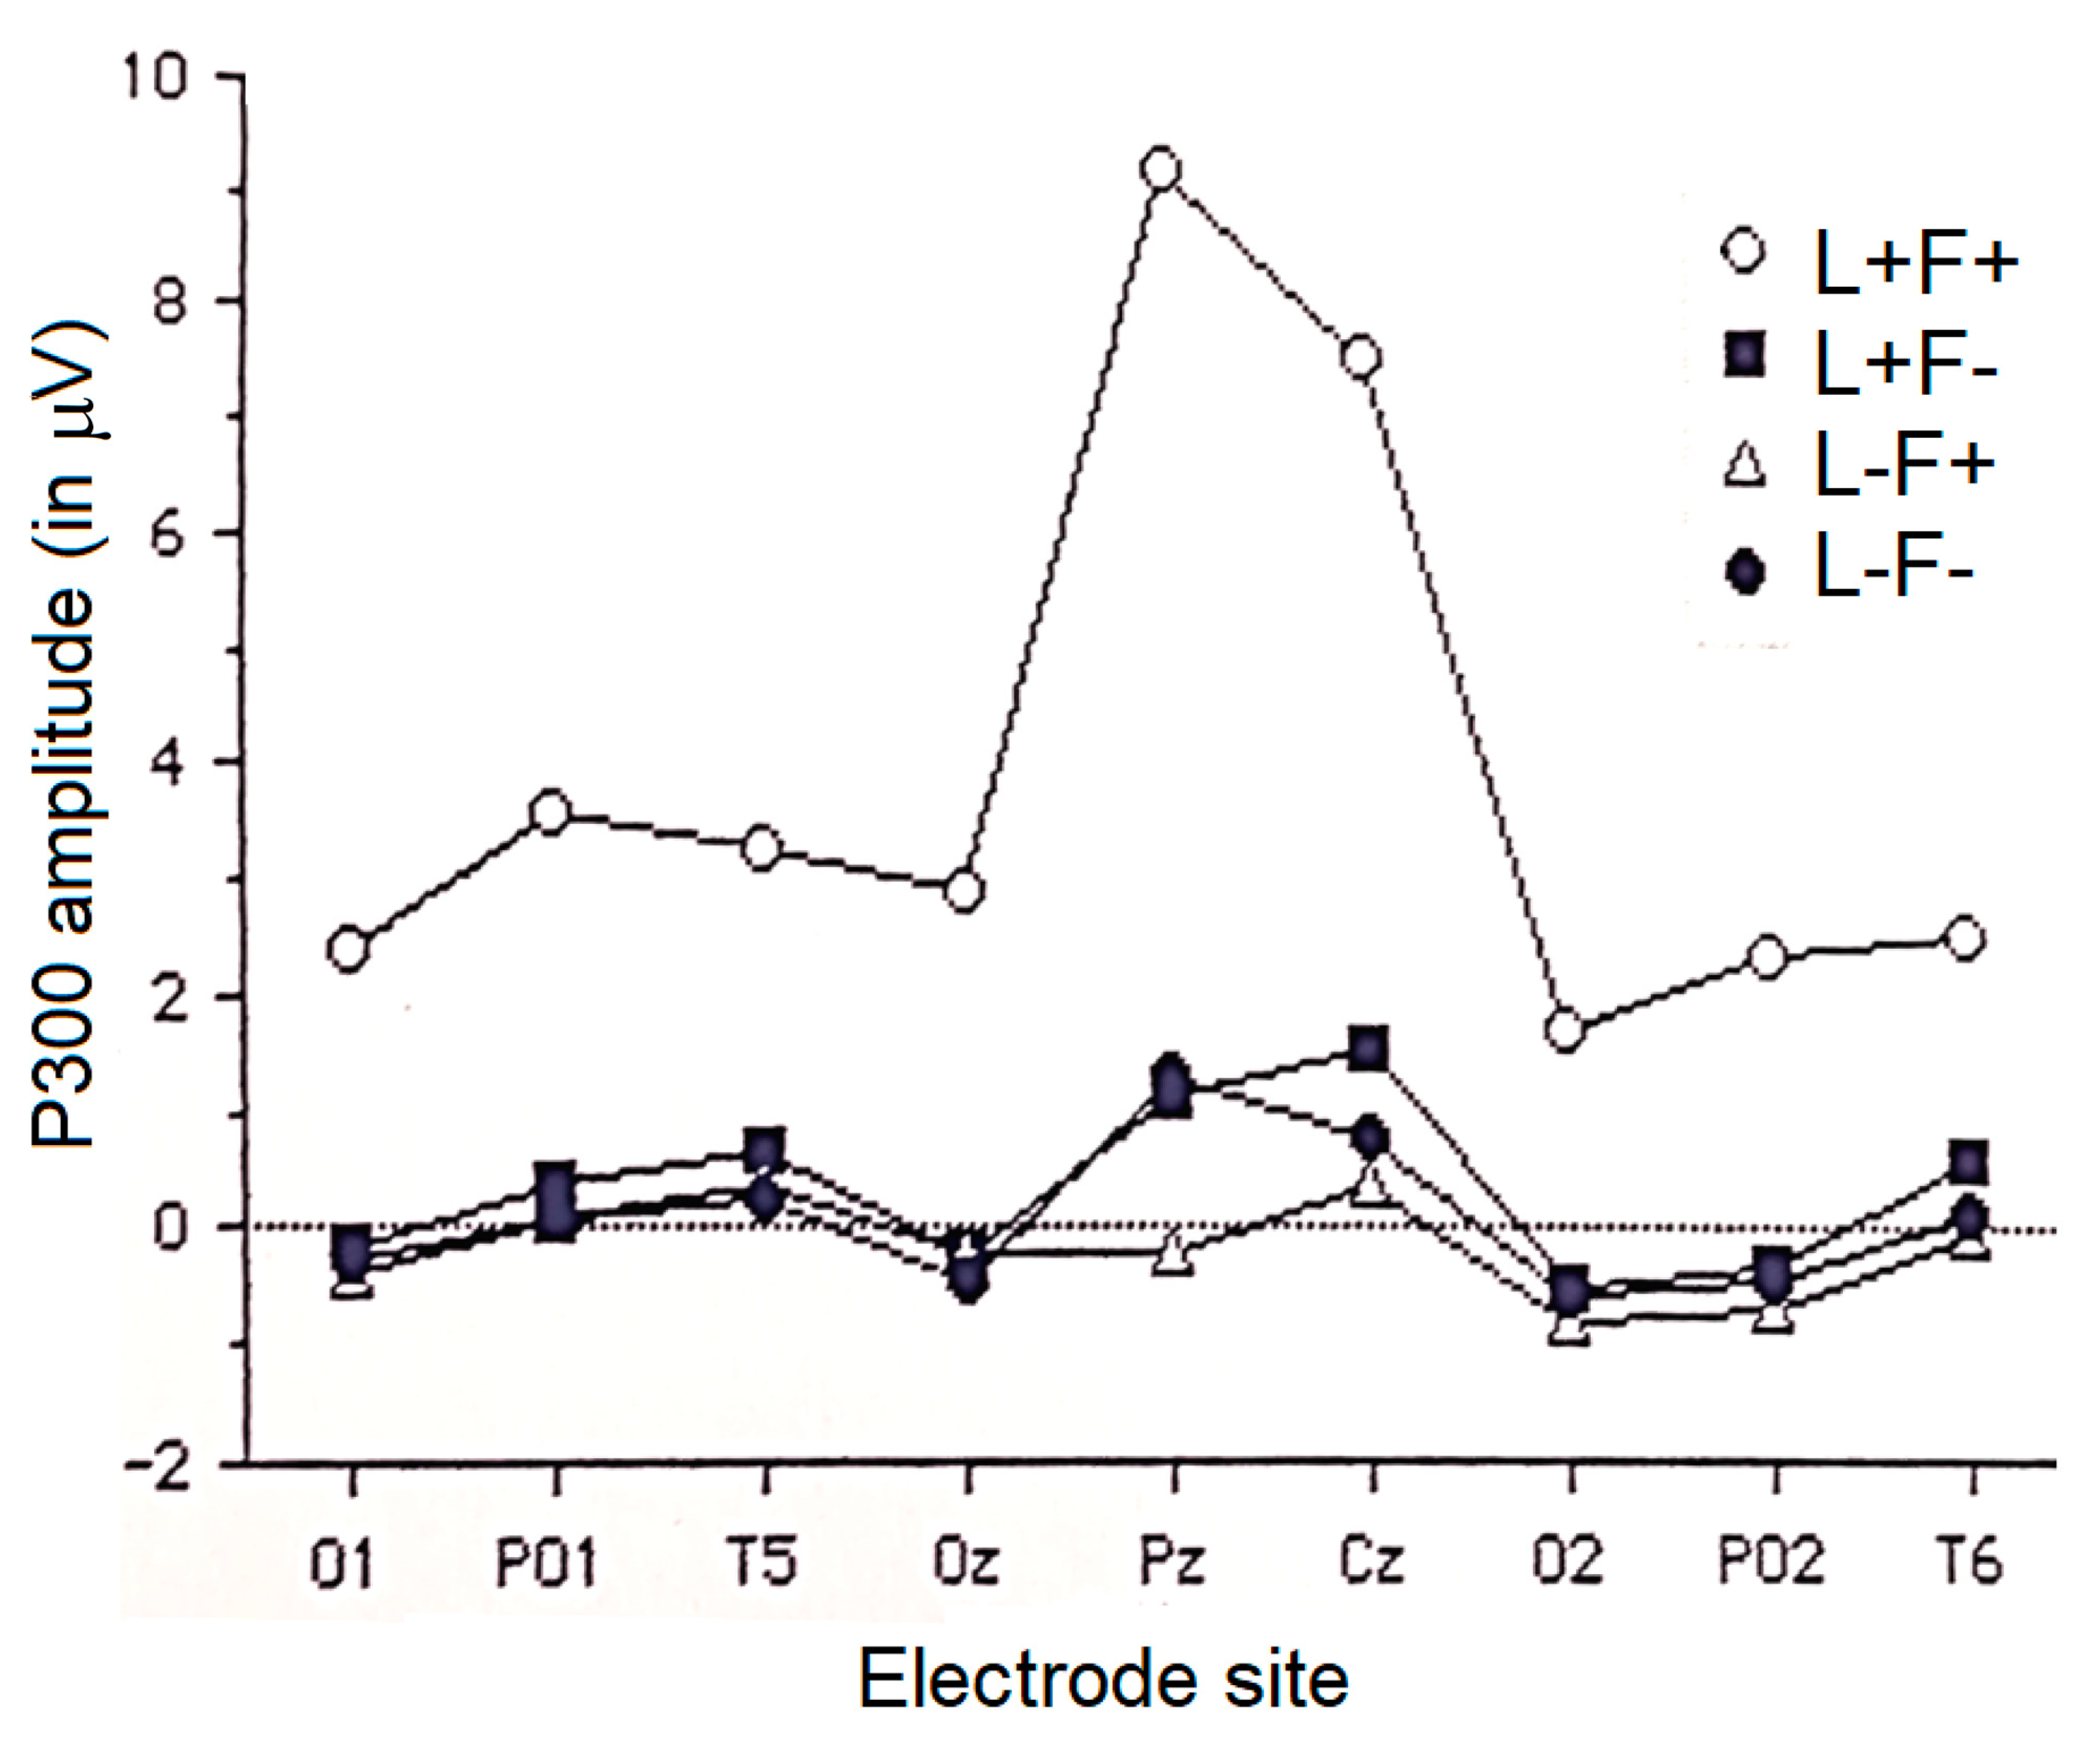
3.2.4. P300 Component
4. Discussion
Author Contributions
Funding
Institutional Review Board Statement
Informed Consent Statement
Data Availability Statement
Acknowledgments
Conflicts of Interest
Study Limits
References
- Christian, S. Cerebral Asymmetries in Sensory and Perceptual Processing, 1st ed.; Elsevier: Amsterdam, The Netherlands, 1997; ISBN 9780444825100. [Google Scholar]
- Hellige, J.B.; Laeng, B.; Michimata, C. Processing asymmetries in the visual system. In The Two Halves of the Brain: Information Processing in the Cerebral Hemispheres; Hugdahl, K., Westerhausen, R., Eds.; MIT Press: Cambridge, MA, USA, 2010; pp. 379–415. [Google Scholar]
- Hugdahl, K. Hemispheric asymmetry: Contributions from brain imaging. Wiley Interdiscip. Rev. Cogn. Sci. 2011, 2, 461–478. [Google Scholar] [CrossRef] [PubMed]
- Gable, P.A.; Poole, B.D.; Cook, M.S. Asymmetrical hemisphere activation enhances global-local processing. Brain Cognit. 2013, 83, 337–341. [Google Scholar] [CrossRef] [PubMed]
- Van Kleeck, M.H. Hemispheric differences in global versus local processing of hierarchical visual stimuli by normal subjects: New data and a meta-analysis of previous studies. Neuropsychologia 1989, 27, 1165–1178. [Google Scholar] [CrossRef]
- Yamaguchi, S.; Yamagata, S.; Kobayashi, S. Cerebral asymmetry of the “top-down” allocation of attention to global and local features. J. Neurosci. 2000, 20, RC72. [Google Scholar] [CrossRef]
- Yovel, G.; Levy, J.; Yovel, I. Hemispheric asymmetries for global and local visual perception: Effects of stimulus and task factors. J. Exp. Psychol. Hum. Percept. Perform. 2001, 27, 1369–1385. [Google Scholar] [CrossRef] [PubMed]
- Johannes, S.; Wieringa, B.M.; Matzke, M.; Münte, T.F. Hierarchical visual stimuli: Electrophysiological evidence for separate left hemispheric global and local processing mechanisms in humans. Neurosci. Lett. 1996, 210, 111–114. [Google Scholar] [CrossRef]
- Proverbio, A.M. Left and Right Hemisphere Role for Selective and Sustained Attention: An Electrophysiological Approach. Ph.D. Thesis, University of Padua, Padua, Italy, 1993. [Google Scholar]
- Proverbio, A.M.; Zani, A.; Avella, C. Hemispheric asymmetries for spatial frequency discrimination in a selective attention task. Brain Cognit. 1997, 34, 311–320. [Google Scholar] [CrossRef]
- Robertson, L.C.; Lamb, M.R. Neuropsychological contributions to theories of part/whole organization. Cognit. Psychol. 1991, 23, 299–330. [Google Scholar] [CrossRef]
- Robertson, L.C.; Lamb, M.R.; Knight, R.T. Effects of lesions of temporal-parietal junction on perceptual and attentional processing in humans. J. Neurosci. 1988, 8, 3757–3769. [Google Scholar] [CrossRef] [Green Version]
- Navon, D. Forest before trees: The precedence of global features in visual perception. Cognit. Psychol. 1977, 9, 353–383. [Google Scholar] [CrossRef]
- Christie, J.; Ginsberg, J.P.; Steedman, J.; Fridriksson, J.; Bonilha, L.; Rorden, C. Global versus local processing: Seeing the left side of the forest and the right side of the trees. Front. Hum. Neurosci. 2012, 22, 28. [Google Scholar] [CrossRef] [PubMed] [Green Version]
- Proverbio, A.M.; Minniti, A.; Zani, A. Electrophysiological evidence of a perceptual precedence of global vs. local visual information. Cognit. Brain Res. 1998, 6, 321–334. [Google Scholar] [CrossRef]
- Fink, G.R.; Halligan, P.W.; Marshall, J.C.; Frith, C.D.; Frackowiak, R.S.; Dolan, R.J. Where in the brain does visual attention select the forest and the trees? Nature 1996, 382, 626–628. [Google Scholar] [CrossRef] [PubMed] [Green Version]
- Proverbio, A.M.; Zani, A. Electrophysiological indexes of illusory contours perception in humans. Neuropsychologia 2002, 40, 479–491. [Google Scholar] [CrossRef]
- Baas, J.M.; Kenemans, J.L.; Mangun, G.R. Selective attention to spatial frequency: An ERP and source localization analysis. Clin. Neurophysiol. 2002, 113, 1840–1854. [Google Scholar] [CrossRef]
- Georgopoulos, A.P.; Whang, K.; Georgopoulos, M.A.; Tagaris, G.A.; Amirikian, B.; Richter, W.; Kim, S.; Uǧurbil, K. Functional magnetic resonance imaging of visual object construction and shape discrimination: Relations among task, hemispheric lateralization, and gender. J. Cognit. Neurosci. 2001, 13, 72–89. [Google Scholar] [CrossRef]
- Proverbio, A.M.; Burco, F.; Del Zotto, M.; Zani, A. Blue piglets? Electrophysiological evidence for the primacy of shape over color in object recognition. Cognit. Brain Res. 2004, 18, 288–300. [Google Scholar] [CrossRef]
- Milham, M.P.; Banich, M.T.; Webb, A.; Barad, V.; Cohen, N.J.; Wszalek, T.; Kramer, A.F. The relative involvement of anterior cingulate and prefrontal cortex in attentional control depends on nature of conflict. Cognit. Brain Res. 2001, 12, 467–473. [Google Scholar] [CrossRef]
- Orlandi, A.; Proverbio, A.M. Left-Hemispheric Asymmetry for Object-Based Attention: An ERP Study. Brain Sci. 2019, 9, 315. [Google Scholar] [CrossRef] [Green Version]
- Corbetta, M.; Shulman, G.L. Spatial neglect and attention networks. Ann. Rev. Neurosci. 2011, 34, 569–599. [Google Scholar] [CrossRef] [Green Version]
- Nobre, A.C.; Sebestyen, G.N.; Gitelman, D.R.; Mesulam, M.M.; Frackowiack, R.S.; Frith, C.D. Functional localization of the system for visuospatial attention using positron emission tomography. Brain 1997, 120, 515–533. [Google Scholar] [CrossRef] [PubMed] [Green Version]
- Pardo, J.V.; Fox, P.T.; Raichle, M.E. Localization of a human system for sustained attention by positron emission tomography. Nature 1991, 349, 61–64. [Google Scholar] [CrossRef] [PubMed]
- Proverbio, A.M.; Zani, A.; Avella, C. Differential activation of multiple current sources of foveal VEPs as a function of spatial frequency. Brain Topogr. 1996, 9, 59–68. [Google Scholar] [CrossRef]
- Martınez, A.; Di Russo, F.; Anllo-Vento, L.; Hillyard, S.A. Electrophysiological analysis of cortical mechanisms of selective attention to high and low spatial frequencies. Clin. Neurophysiol. 2001, 112, 1980–1998. [Google Scholar] [CrossRef]
- Dos Santos, N.A.; Andrade, S.M.; Fernandez Calvo, B. Detection of spatial frequency in brain-damaged patients: Influence of hemispheric asymmetries and hemineglect. Front. Hum. Neurosci. 2013, 7, 92. [Google Scholar] [CrossRef] [PubMed] [Green Version]
- Zani, A.; Proverbio, A.M. ERP signs of early selective attention effects to check size. Electroencephalogr. Clin. Neurophysiol. 1995, 95, 277–292. [Google Scholar] [CrossRef]
- Harter, M.R.; Previc, F.H. Size-specific information channels and selective attention: Visual evoked potentials and behavioural measures. Electroencephalogr. Clin. Neurophysiol. 1978, 45, 628–640. [Google Scholar] [CrossRef]
- Harter, M.R.; White, C.T. Evoked cortical response to checkerboard patterns: Effect of check-size as a function of visual acuity. Electroencephalogr. Clin. Neurophysiol. 1970, 28, 48–54. [Google Scholar] [CrossRef]
- Harter, M.R.; Aine, C.; Schroeder, C. Hemispheric differences in the neural processing of stimulus location and type: Effects of selective attention on visual evoked potentials. Neuropsychologia 1982, 20, 421–438. [Google Scholar] [CrossRef]
- Mauguiere, F.; Giard, M.H.; Ibanez, V.; Pernier, J. Sequential spatial maps of visual potentials evoked by checkerboard-pattern reversal: Effect of the retinal field stimulated on response topography. Rev. Electroencephalogr. Neurophysiol. Clin. 1985, 15, 129–137. [Google Scholar] [CrossRef]
- Hudnell, H.K.; Boyes, W.K.; Otto, D.A. Stationary pattern adaptation and the early components in human visual evoked potentials. Electroencephalogr. Clin. Neurophysiol. 1990, 77, 190–198. [Google Scholar] [CrossRef]
- Blumhardt, L.D.; Barret, G.; Halliday, A.M.; Kriss, A. The effect of field size on the pattern reversal visual evoked response. Clin. Vis. Sci. 1989, 4, 27–40. [Google Scholar]
- Bodis-Wollner, I.; Brannan, J.R.; Nicoll, J.; Frkovic, S.; Mylin, L.H. A short latency cortical component of the foveal VEP is revealed by hemifield stimulation. Electroencephalogr. Clin. Neurophysiol. 1992, 84, 201–208. [Google Scholar] [CrossRef]
- Proverbio, A.M.; Del Zotto, M.; Zani, A. Electrical neuroimaging evidence that spatial frequency-based selective attention affects V1 activity as early as 40–60 ms in humans. BMC Neurosci. 2010, 11, 59. [Google Scholar] [CrossRef] [PubMed] [Green Version]
- Reuter-Lorentz, P.A.; Kinsbourne, M.; Moscovitch, M. Hemispheric control of spatial attention. Brain Cognit. 1990, 12, 240–266. [Google Scholar] [CrossRef]
- Palmer, T.; Tzeng, O.J. Cerebral asymmetry in visual attention. Brain Cognit. 1990, 13, 46–58. [Google Scholar] [CrossRef]
- Papera, M.; Richards, A. Attentional gain and processing capacity limits predict the propensity to neglect unexpected visual stimuli. Psychophysiology 2016, 53, 634–649. [Google Scholar] [CrossRef] [Green Version]
- Jeffreys, D.A.; Axford, J.G. Source locations of pattern-specific components of human visual evoked potentials. I. Component of striate cortical origin. Exp. Brain Res. 1972, 16, 1–21. [Google Scholar] [CrossRef]
- Zani, A.; Proverbio, A.M. Selective attention to spatial frequency gratings affects visual processing as early as 60 msec. poststimulus. Percept. Mot. Skills 2009, 109, 140–158. [Google Scholar] [CrossRef]
- Zani, A.; Proverbio, A.M. Is that a belt or a snake? Object attentional selection affects the early stages of visual sensory processing. Behav. Brain Funct. 2012, 8, 6. [Google Scholar] [CrossRef] [Green Version]
- Zani, A.; Proverbio, A.M. Endogenous attention to object features modulates the ERP C1 component. Cogn. Neurosci. 2018, 9, 66–67. [Google Scholar] [CrossRef]
- Czigler, I.; Balázs, L.; Lénárt, A. Attention to features of separate objects: An ERP study of target-shooters and control participants. Int. J. Psychophysiol. 1998, 31, 77–87. [Google Scholar] [CrossRef]
- Orlandi, A.; Proverbio, A.M. ERP indices of an orientation-dependent recognition of the human body schema. Neuropsychologia 2020, 146, 107535. [Google Scholar] [CrossRef]
- Proverbio, A.M.; Esposito, P.; Zani, A. Early involvement of the temporal area in attentional selection of grating orientation: An ERP study. Brain Res. Cogn. Brain Res. 2002, 13, 139–151. [Google Scholar] [CrossRef]
- Sergent, J. The cerebral balance of power: Confrontation or cooperation? J. Exp. Psychol. Hum. Percept. Perform. 1982, 8, 253–272. [Google Scholar] [CrossRef]
- Proverbio, A.M.; Zani, A.; Adorni, R. The left fusiform area is affected by written frequency of words. Neuropsychologia 2008, 46, 2292–2299. [Google Scholar] [CrossRef]
- Fink, G.R.; Canário, N.; Jorge, L.; Castelo-Branco, M. Distinct mechanisms drive hemispheric lateralization of object recognition in the visual word form and fusiform face areas. Brain Lang. 2020, 210, 104860. [Google Scholar]
- Hildesheim, F.E.; Debus, I.; Kessler, R.; Thome, I.; Zimmermann, K.M.; Steinsträter, O.; Sommer, J.; Kamp-Becker, I.; Stark, R.; Jansen, A. The Trajectory of Hemispheric Lateralization in the Core System of Face Processing: A Cross-Sectional Functional Magnetic Resonance Imaging Pilot Study. Front. Psychol. 2020, 11, 507199. [Google Scholar] [CrossRef]
- Zani, A.; Proverbio, A.M. Attention modulation of short latency ERPs by selective attention to conjunction of spatial frequency and location. J. Psychophysiol. 1997, 11, 21–32. [Google Scholar]


Publisher’s Note: MDPI stays neutral with regard to jurisdictional claims in published maps and institutional affiliations. |
© 2021 by the authors. Licensee MDPI, Basel, Switzerland. This article is an open access article distributed under the terms and conditions of the Creative Commons Attribution (CC BY) license (http://creativecommons.org/licenses/by/4.0/).
Share and Cite
Proverbio, A.M.; Zani, A. Hemispheric Asymmetry in Visual Processing: An ERP Study on Spatial Frequency Gratings. Symmetry 2021, 13, 180. https://doi.org/10.3390/sym13020180
Proverbio AM, Zani A. Hemispheric Asymmetry in Visual Processing: An ERP Study on Spatial Frequency Gratings. Symmetry. 2021; 13(2):180. https://doi.org/10.3390/sym13020180
Chicago/Turabian StyleProverbio, Alice Mado, and Alberto Zani. 2021. "Hemispheric Asymmetry in Visual Processing: An ERP Study on Spatial Frequency Gratings" Symmetry 13, no. 2: 180. https://doi.org/10.3390/sym13020180