Article

An Approach on Image Processing of Deep Learning Based on Improved SSD

Harbin Institute of Technology, Harbin 150001, China
*
Author to whom correspondence should be addressed.
Symmetry 2021, 13(3), 495; https://doi.org/10.3390/sym13030495
Submission received: 9 February 2021 / Revised: 8 March 2021 / Accepted: 13 March 2021 / Published: 17 March 2021

Abstract

:
Compared with ordinary images, each of the remote sensing images contains many kinds of objects with large scale changes, providing more details. As a typical object of remote sensing image, ship detection has been playing an essential role in the field of remote sensing. With the rapid development of deep learning, remote sensing image detection method based on convolutional neural network (CNN) has occupied a key position. In remote sensing images, the objects of which small scale objects account for a large proportion are closely arranged. In addition, the convolution layer in CNN lacks ample context information, leading to low detection accuracy for remote sensing image detection. To improve detection accuracy and keep the speed of real-time detection, this paper proposed an efficient object detection algorithm for ship detection of remote sensing image based on improved SSD. Firstly, we add a feature fusion module to shallow feature layers to refine feature extraction ability of small object. Then, we add Squeeze-and-Excitation Network (SE) module to each feature layers, introducing attention mechanism to network. The experimental results based on Synthetic Aperture Radar ship detection dataset (SSDD) show that the mAP reaches 94.41%, and the average detection speed is 31FPS. Compared with SSD and other representative object detection algorithms, this improved algorithm has a better performance in detection accuracy and can realize real-time detection.

1. Introduction

Remote sensing image is the record of all kinds of objects on the ground by artificial satellite. Over the past 50 years, space information technology which is represented by satellite remote sensing technology, has provided an efficient means to obtain data from a large boundary. As a crucial research direction in the field of remote communication, remote sensing image object detection technology is an intelligent data analysis method to achieve automatic identification and localization for remote sensing objects, which is widely concerned in civil and military fields [1]. With the rapid development of high-resolution technology, the quality of remote sensing images obtained by remote sensing satellites is getting better and better, which is of great significance to resource exploration, urban traffic management, military object recognition, environmental monitoring and so on. As a typical object of remote sensing image, ship detection plays a significant role in port traffic planning, marine safety management, maritime disaster relief and national defense security.
Due to the prominent capability of feature representation, deep learning algorithms begin to replace the traditional machine learning algorithms. At present, deep learning has been applied to many fields, including object detection [2], driverless car [3], machine translation [4], emotion recognition [5] and speech recognition [6]. Particularly, in the field of object detection, a variety of deep learning-based object detection algorithms aiming to resolve practical problems rush out, which are applied to fall detection [7], medical image segmentation [8], defect detection [9], face recognition [10], remote sensing object detection [11] and so on. Remote sensing technology has developed rapidly in recent years, tremendously increasing the quality and quantity of remote sensing images captured by remote sensing devices. As an important application in the field of object detection, the massive growth of data promotes the rapid deployment of remote sensing object detection algorithm based on deep learning.
Object detection for ship in remote sensing image is an extraordinarily challenging task. Firstly, remote sensing image has high resolution, containing many object categories, of which the object scale changes greatly. The huge consumption of time and memory will impose strict requirements for algorithm and hardware. Then, convolutional neural network (CNN) is a multilayer structure, consisting of several convolutional layers. With the gradual increase of network depth, the feature information of small object will become less abundant. There are commonly a large number of small remote sensing objects, leaving a poor detection performance for small objects. Lastly, extensive complex backgrounds in remote sensing images will cause some false positives. As shown in Figure 1 [12], the ships in remote sensing image are small and sometimes there are complex backgrounds around them.
Considering the above problems, how to improve the accuracy of ship detection has become a big challenge. This paper proposes an efficient ship detection algorithm for SAR remote sensing images based on improved SSD. The main innovation of this algorithm includes the following two points:
(1)
We add a feature pyramid network to SSD, introducing context information to Conv4_3 and Conv7 which are large scale feature maps and are responsible for detection of small objects. We use bilinear as upsampling method and element-wise sum as fusion method, designing a future fusion model to improve detection accuracy.
(2)
Then, in order to further improve the ability of feature extraction and raise the significant channel-wise feature as well as reduce insignificant channel-wise feature, a SE module is added, enabling model to perform dynamic channel-wise feature recalibration.
The rest of this paper is organized as follows. Section 2 gives a brief review of some typical object detection algorithms as well as research status for remote sensing ship detection. Section 3 details our improved method for ship detection. Section 4 introduces the experimental results and analyzes them in detail. Section 5 describes the conclusion of this paper and shows the highlights of this paper.

2. Related Work

The task of remote sensing object detection is to locate the researched object (e.g., aircrafts, vehicles, storage tanks, houses, ships, playgrounds, flyovers, etc.) in aerial or satellite images. As an application of data analysis technology, remote sensing object detection depends on all kinds of remote sensing data to a great extent. The remote sensing data is of large amounts, which is extremely hard for efficient data processing and analysis relying on previous machine learning models such as support vector machine (SVM), decision trees, naive Bayesian classification, logistic regression, clustering algorithms and so on. The past few years witnessed the development and decline of traditional object detection algorithms based on classical machine learning model. Traditional object detection algorithms mainly include Viola–Jones (V-J) object detection algorithm [13], Support Vector Machine (SVM) using Histogram of Oriented Gradients (HOG) features algorithm [14], Deformable Parts Model (DPM) algorithm [15] and so on. The traditional remote sensing object detection algorithm is based on the sliding window strategy to perform region selection, which requires manual feature extraction and selection including haar-like features and HOG features. As the extracted features need to be designed manually, and the selection of regional proposal has no pertinence, the time complexity and space complexity of traditional object detection are very high. Through massive growth of remote sensing images in the quantity and quality, huge computational costs leave traditional object detection algorithm unable to meet the requirement of practical application.
With the development of computer technology, especially parallel computing technology, deep learning-based object detection algorithms are playing a dominate role in the field of remote sensing object detection. Deep learning model is an effective tool to solve large-scale operations, which can accurately obtain the nonlinear relationship between the data by means of multilayer learning and has gradually become the preferred method for remote sensing image recognition and analysis. Deep learning-based object detection algorithms have a strong ability of feature expression to process remote sensing images, which can be divided into two categories of one-stage and two-stage according to whether region proposals come into being. There are two kinds of typical one-stage algorithms: You Only Look Once (YOLO) [16,17,18,19] and Single Shot Multibox Detector (SSD) [20,21,22,23,24]. Two-stage object detection algorithms mainly include R-CNN [25], SPP Net [26], Fast-RCNN [27], Faster R-CNN [28], HyperNet [29], R-FCN [30], MS-CNN [31] and Mask R-CNN [32]. As a series of regional proposals will be generated, two-stage object detection algorithms perform detection more precisely and have a slower detection speed in the meantime.
In order to improve the practical application effect while analyzing and processing remote sensing image, many researchers focus on the shortcomings of current object detection algorithms based on deep learning, making some structural refinement to algorithms according to characteristics of remote sensing technology. X. Nie et al. improved Mask R-CNN, proposing a ship detection method. This method added channel-wise and spatial attention mechanisms as well as a bottom-up architecture to improve detection accuracy [33]. Sun X et al. proposed a ship detection model based on YOLO using spinning object detection technology. After the refinement of the rotation matrix, this method restructures the loss function as well as the rotated IOU calculation formula. Then, through lightweight processing, the model partly reduces the redundant parameters increased by the augmented dimensions of output feature maps [34]. J. Qu et al. proposed DFSSD to increase detection accuracy for small objects in remote sensing images [35]. Different from the original SSD, in this algorithm, the random clipping procedures of data preprocessing layers are discarded, and a feature pyramid network (FPN) is added to enhance information of low-level feature map. Besides, the regular convolution in the third-level feature map is replaced with dilated convolution to extend the receptive field. Yin R et al. proposed AF-SSD [36]. This model utilizes MobileNet as the network backbone and designs a light encoding–decoding module to enhance the information of low-level features. In the meanwhile, a cascade architecture including spatial and channel attention modules is added to increase detection accuracy for objects with low-contrast and few-texture.
In the field of ship detection, many ship datasets come from Synthetic Aperture Radar (SAR) imagery, which has been regarded as a significant data collection method for monitoring maritime activities. Zhang T et al. proposes a ship detection model based on grid convolutional neural network (G-CNN) [37]. This model divides the SAR image into several grid cells and detects ship objects on three different scales feature maps. Wei S et al. proposed a ship detection method based on a high-resolution ship detection network (HR-SDNet) for high-resolution SAR imagery [38]. This method connects high-to-low resolution subnetworks in parallel and can maintain high resolution and utilizes Soft-NMS to improve the detection performance of the dense ships. Chen C et al. proposed a ship detection network combined with an attention mechanism and introduced a loss function that incorporates the generalized intersection over union (GIoU) loss to reduce the scale sensitivity of the network [39].
With the large proportion of small objects and the complex background in remote sensing image including ships, it is necessary to improve detection accuracy of remote sensing objects detection. The above research optimizes the algorithm from the perspective of improving accuracy detecting small objects. Moreover, at the same time as improving the accuracy, it should be guaranteed that the loss of speed and the increase of memory cannot be too huge considering the application of embedded device. There still remains plenty of scope for improvement in improving the accuracy of the remote sensing object detection model. Based on SSD algorithm which has an excellent performance in accuracy as well as speed, through the inspection of FPN [40], attention mechanism in computer vision [41,42,43,44] and other related relevant literature along with the studies at home and abroad, we proposed an efficient object detection algorithm for remote sensing image.

3. Methods

3.1. SSD

As a kind of one-stage algorithms, Single Shot MultiBox Detector (SSD) directly performs prediction using convolutional neural network (CNN). CNN are composed of many convolution layers. Related research has proved that with the increase of network layers depth, the information extracted from convolution layers is more and more abstract. Utilizing the characteristic that different depth convolution layer extracts different information features, SSD has achieved great results in object detection.

3.1.1. Multiscale Prediction

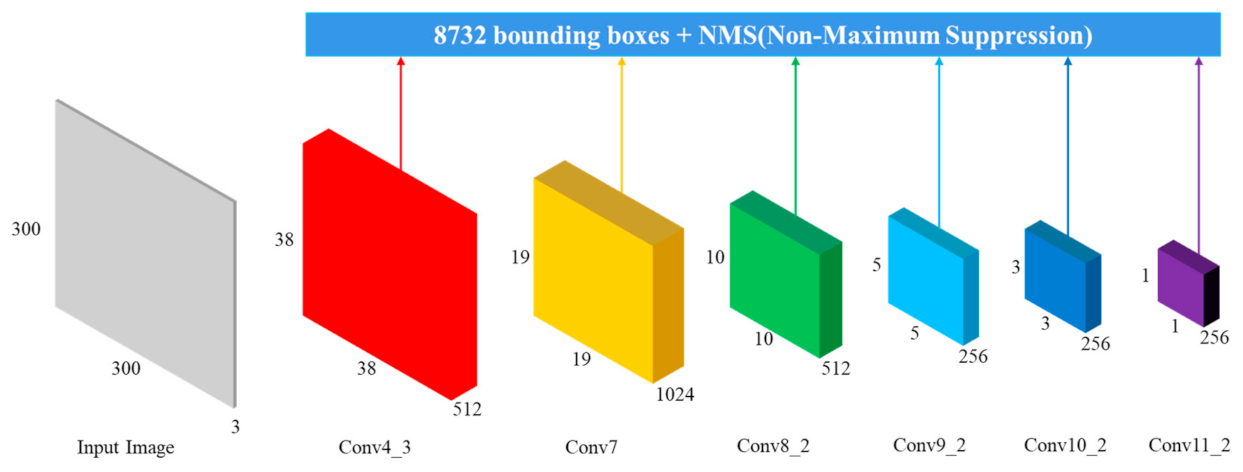
SSD is composed of VGG and extra feature layer. As shown in Figure 2, there are six feature layers to perform a prediction, of which Conv4_3 is from Visual Geometry Group Network (VGG), the remaining five feature layers are added on the base of VGG.
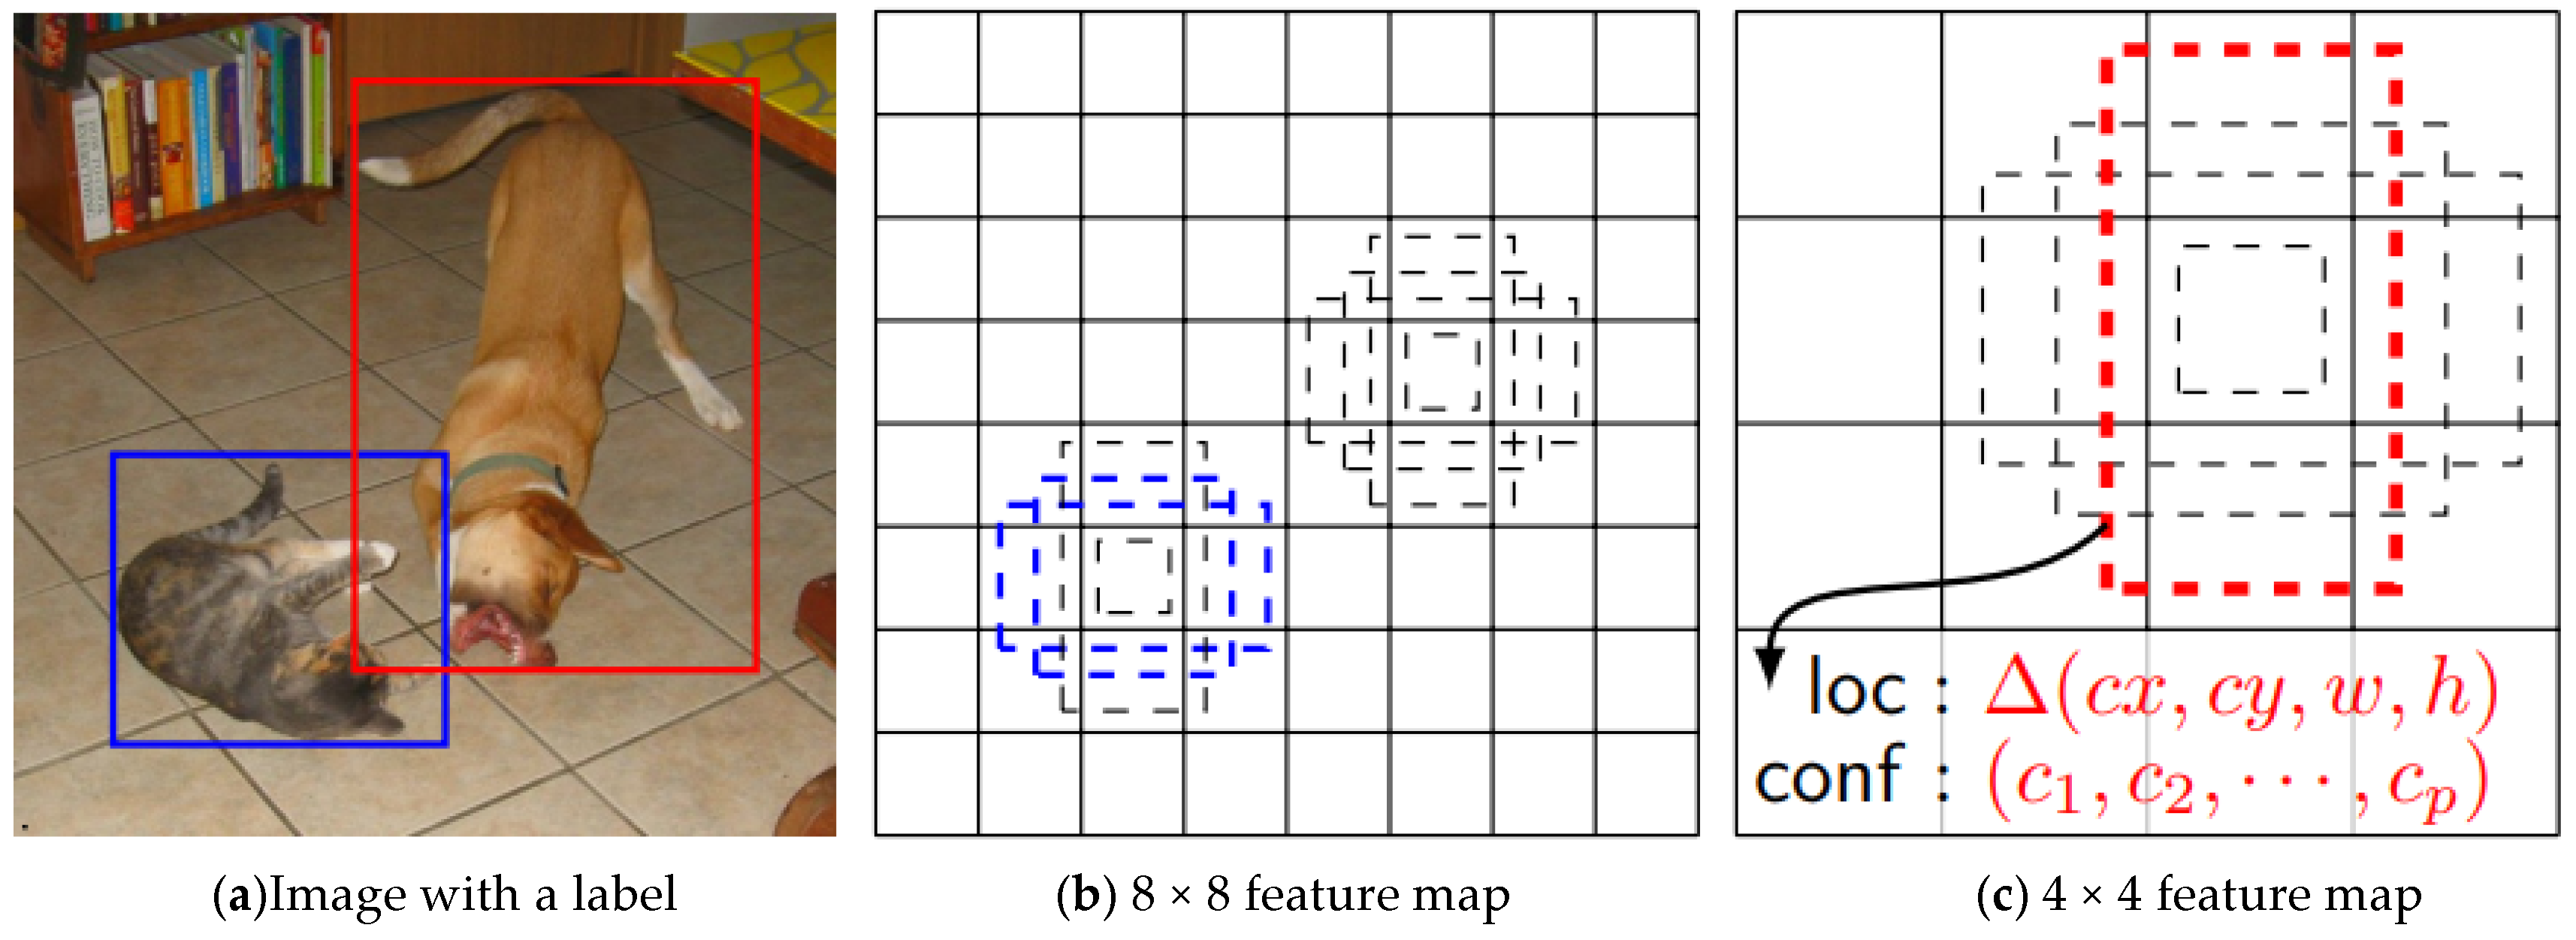
During prediction, each feature map will produce default boxes with different scale. Figure 3b,c show feature maps of different scales. Each feature map is divided into several grids. (b) and (c) are divided into 64 and 16 grids, respectively. While predicting, the grid will generate several default boxes with different scales. As the proportion of default boxes accounted for in (b) is much smaller than that of (c), the default boxes in (b) can easily cover small scale objects. With the increase of network layers depth, the scale of feature maps will gradually become small. As a result, shallow feature maps can predict small objects precisely, and deep feature maps can predict large objects precisely, which is called multiscale prediction in SSD. The default boxes will further adjust the scale according to the loss function to generate the outputting prediction box.
The scale of priors increases linearly with the depth of network layers, which varies from 0.2 to 0.9. The default box size of each feature map is calculated according to Equation (1); the parameters are shown in Table 1. The aspect ratio of the default boxes is set to 1, 2, 3, 1/2, 3/1. The height and width of each default box can be calculated according to Equation (2).
s k = s m i n + s m a x s m i n 5 k 1 , k 1 , 6
w k a = s k a r   h k a = s k / a r
where s k means the default box scale of k-th feature map, a r means the respect ratio of default boxes, w k a means the default box width of k-th feature map when the aspect ratio is a , h k a means the default box height of k-th feature map when the aspect ratio is a . Particularly, when a r = 1 , an extra square default box will be added, the scale is s k = s k s k + 1 .
The output value consists of category confidence and bounding box position (height, width and center point coordinates). When the number of classes is 20, there will eventually be 8732 bounding boxes generating.

3.1.2. Loss Function

The loss function of the SSD algorithm is composed of confidence loss and localization loss. The loss function is defined as follows:
L x ,   c , l , g = 1 N L c o n f x , c + α L l o c x , l , g
where N refers to the number of positive samples among all default boxes, x i j p 0 ,   1 , x i , j p = 1 means that i-th default box matches with j-ground truth and the ground truth is positive, c refers to prediction of category confidence, l refers to prediction of bounding box position, g means the location parameter of ground truth, d means the coordinate of the default box.
The position error function is defined as follows:
L l o c x , l , g = i P o s N m c x , c y , w , h x i j k smooth L 1 l i m g ^ j m
g ^ j c x = g ^ j c x d i c x / d i w   g ^ j c y = g ^ j c y d i c y / d i h
g ^ j c x = log g j w / d i w   g ^ j c x = log g j h / d i h
smooth L 1 x = 0.5 x 2 ,   i f x < 0   x 5   o t h e r w i s e
The confidence error function is denoted as follows:
L c o n f x , c = i P o s N x i j p log c ^ i p i N e g log c ^ i 0
c ^ i p = exp c i p p exp c i p

3.2. Improved SSD

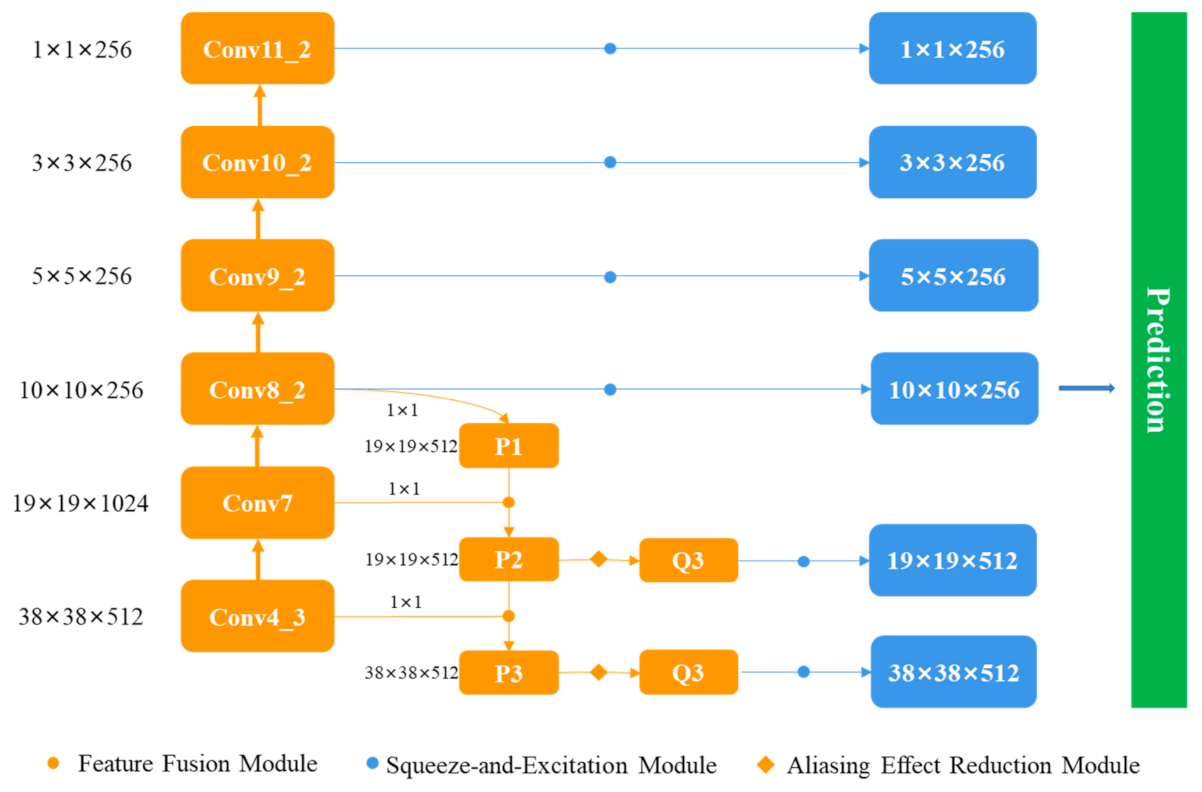
Based on SSD, we add some improvements including introducing attention mechanism and feature fusion module. The overall structure we improved is shown in Figure 4. Firstly, we add a feature pyramid network to SSD, introducing context information to Conv4_3 and Conv7 which are large scale feature maps and are responsible for detection of small objects. Then, in order to improve the ability of feature extraction and raise the significant channel-wise feature as well as reduce insignificant channel-wise feature, a SE module is added.

3.2.1. Feature Fusion Module

In SSD, there are six different feature maps to generate default boxes and perform prediction, during which the feature maps in low-level layer are superior to locate small targets, and the feature maps in high-level layer are superior to locate large targets. As the network becomes deep, the feature maps will be abundant in semantic characteristic as well as deficient in spatial characteristic.
Based on the characteristics of the multiscale training for SSD, it is crucial to connect the information of different level feature maps. The low-level feature map lacks semantic information, for which the feature information of high-level feature map can be introduced to low-level feature map by means of upsampling. Thus, to enhance the semantic feature extraction capability, there should be some context information to be introduced into the high-level feature maps.
Feature pyramid network (FPN) can fully connect the information of different scale feature maps, balancing special information and semantic information of each feature map. As is shown in Figure 5, FPN is composed of three parts: down-top part, top-down part and connection part. Down-top part is the forward propagation of CNN, during which semantic information will be gradually enhanced. The top-down part is the upsampling process; the size of upper feature map will be doubled by the method of bilinear. In order to solve the problem that the channels of connected feature maps are different, there will be a 1 × 1 conv operation to ensure that the channels of different feature maps are consistent before the connection with upper feature map. Then, two feature maps with the same size and channel will be connected; the connected method is element-wise sum.
Based on the research of FPN and FSSD, we design a feature fusion model to enhance the ability of small object feature extraction. In this module, the feature map will be connected together with the upper feature map. The size of the upper feature map will be doubled by the method of upsampling, which mainly includes bilinear and deconvolution. There are two common connected methods, including concatenation and element-wise sum. According to the experimental results in FSSD [24], we choose bilinear as upsampling method and element-wise sum as fusion method.
X f = Φ f T i X i   i C
X p = Φ p X f   p P
where X i means different feature maps. T i means the transformation function of each source feature map before being added together. Φ f is the feature fusion function. Φ p is the function to generate pyramid features.
We add this feature fusion module to Conv4_3 and Conv7. As Conv7 will be introduced the information of Conv8_2, Conv8_2 will also be pretreated. In the preprocess of pretreatment, the channel of each source layer will be changed by conv 1 × 1. Then, bilinear interpolation is used to resize two different feature maps to the same size. Particularly, in order to reduce the amount of calculation, we set the channel of Conv7 from 1024 to 512. In the process of feature fusion, different feature maps have different characteristics. As a result, the element-wise sum of feature maps will result in the aliasing effect, reducing detection accuracy. As shown in Figure 6, we proposed an aliasing effect reduction module, removing extra information.

3.2.2. SE Module

In the field of computer vision, attention mechanism is weight allocation mechanism. The weights that are originally evenly allocated will be redistributed according to the importance of each weight. The important weights are given more values, and the unimportant weights are given less values. As a kind of attention mechanism, Squeeze-and-Excitation Networks (SENet) judges the importance of channel by considering the relationship between channels. The architecture of SE module is as shown in Figure 7. F t r is a transfer function mapping the input X to the feature maps U ( U R H × W × C ). SE module is added to recalibrate the feature. The features U are firstly performed by a squeeze operation, a channel descriptor will be generated suppress the spatial dimensions (H × W) to 1 × 1. The descriptor can reweight distribution of channel-wise feature. Then an excitation operation will be performed, engendering a weight matrix with dimension is 1 × 1 × C. These weights in the weight matrix will be applied to the feature maps U to recalibrate the feature.
Specifically, as shown in Figure 7, SE module is composed of three parts: squeeze part, excitation part and reweight part.
The squeeze part is an average pooling, squeezing the size of feature map to 1 × 1. The squeeze part can be described as follows:
z c = F s q u c = 1 H × W i = 1 H j = 1 W u c i , j
where i , j means abscissa and ordinate of the feature map (H × W), z c is a one-dimensional array.
The excitation part can regenerate the weight of each channel according to the parameter of W . The squeeze part can be described as follows:
s = F e x z c , W = σ g z c , W = S i g m o i d W 2 δ W 1 z c
where W 1 and W 2 is the weight matrix of two fully connected layers, respectively. δ refers to Relu function. s is the weight coefficient of different channels, whose dimension is C × 1 × 1.
In the reweight operation, s is regarded as the importance of each feature maps channel, and the weight of the original channel will change according to following equation.
U = F s c a l e u c , s = s × u c
where F s c a l e u c , s refers to channel-wise multiplication between the scalar s and the feature map u c .
We added SE modules to all six feature maps, enhancing the weight of contributing channels and suppressing the invalid features to improve the detection accuracy.

4. Experiment

We carry out some comparative experiments to test the effectiveness of our model based on SSDD dataset.

4.1. Dataset

We use SAR ship detection dataset (SSDD) as our experimental dataset. SSDD is the first dataset for ship detection in SAR image. This dataset is obtained by downloading the public SAR image on the Internet, clipping the object area to about 500 × 500 pixels. The data with resolution of 1 m–15 m is shot by RadarSat-2, TerraSAR-X and Sentinel-1 sensors. The background environment includes sea area and coastal area. Table 2 shows the statistics of the ships number per image in the SSDD: NoS means the number of ships, NoI means the number of images; there are 1160 images and 2456 ships, with 2.12 ships per image.

4.2. Evaluation Index

There are some evaluation indexes while experimenting. The intersection over union (IoU) measures the overlap degree of two regions and is calculated by Equation (15).
I o U = area of overlap area of union
In object detection, there is a threshold to judge whether the prediction is correct. Positive is defined as a bounding box whose prediction score is larger than the threshold (α) and negative is defined as a bounding box whose prediction score is smaller than the threshold. When IoU is greater than threshold, the detection box is a true positive (TP). Furthermore, if less than threshold, it is called a false positive (FP). The false negative (FN) means that the model predicts there is no object in the image, but the image actually contains the object. In this way, a confusion matrix is constructed as Table 3.
Then, precision and recall can be defined as follows:
p r e c i s i o n = T P T P + F P
r e c a l l = T P T P + F N
It is impossible to reach the highest level for the value of precision and recall at the same time. By changing the threshold, making recall as horizontal axis and precision as vertical axis, the P-R (precision-recall) curve can be obtained. According to P-R curve, AP (Average Precision) and mAP (mean Average Precision) can be calculated, which are more convincing to evaluate the model. Their calculations are as follows:
A P = 0 0 p r d r
m A P = A P N
where N means the number of all classes. In our experiment, as the category is just ship, mAP is equal to AP.

4.3. Experimental Results

We set training batch size to 16, total train epoch to 200 and initial learning rate to 0.001. When reaching 100-th and 150-th epoch, learning rate will decay to 0.0001 and 0.00001. Our experimental environment is shown in Table 4.
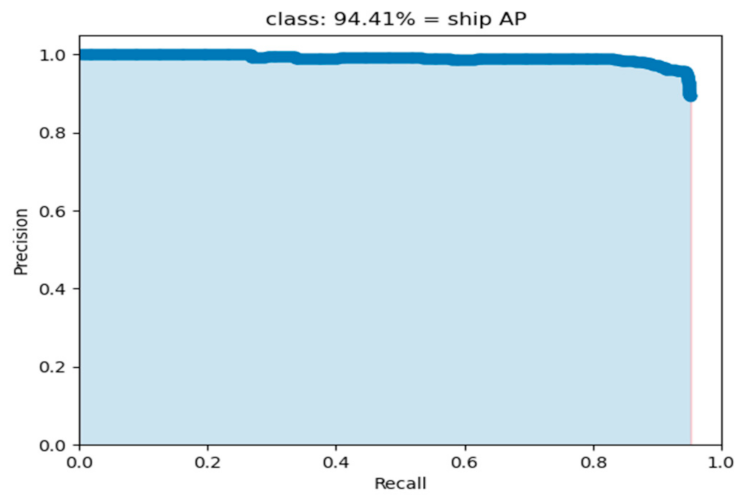
Some detection results are shown in Figure 8. Figure 8a represents detection result in complex background and Figure 8b represents detection results under multiobject condition. Figure 9 is P-R curve of detection and shows the improved model’s mAP can reach 94.41%.
In order to concretely display the results comparison of the improved model and the original SSD, some comparisons of detection boxes are shown in Figure 10. In Figure 10, the left side is our model’s result, and the right side is SSD’s result. As we can see, the prediction box score of our model is higher than that of SSD. Our improved model has an excellent performance under condition of multiobject and complex background.
We also compare detection results between our model and other state-of-art object detection algorithms. The parameters for comparison include mAP, memory and detection speed. The comparison of experimental results is as shown in Table 5 and Figure 11. As Faster R-CNN belongs to two-stage algorithms, it has the highest detection accuracy among these models and lowest detection speed, which is hard to practically apply. Our model has the second highest detection accuracy, which is 2.34% and 0.41% higher than SSD and YOLOV4. As we add feature fusion module and SE module, the model size and floating point operations per second (FLOPs) will be increased. As a result, our model’s memory is 174 MB and detection speed is 31 FPS, which can also meet the requirements of real-time detection.

5. Conclusions

Aiming at the problem that the accuracy of ship detection still has space for further improvement, we proposed an efficient ship detection algorithm for SAR remote sensing images based on improved SSD. Firstly, we add a feature pyramid network to SSD, introducing context information to Conv4_3 and Conv7 which are large scale feature maps and are responsible for detection of small objects. Then, in order to further improve the ability of feature extraction and raise the significant channel-wise feature as well as reduce insignificant channel-wise feature, a SE module is added, enabling model to perform dynamic channel-wise feature recalibration. The experimental results based on SSDD dataset show that our improved model has an excellent performance in accuracy compared to other state-of-art object detection algorithms. Meanwhile, the detection speed of our model is 31 FPS, higher than the speed for real-time detection.

Author Contributions

G.L. contributed to the conception of the study. L.J. performed the experiment and the analysis with constructive discussions; L.J. and G.L. performed the data analyses and wrote the manuscript. All authors have read and agreed to the published version of the manuscript.

Funding

This research received no external funding.

Institutional Review Board Statement

For studies not involving humans or animals.

Informed Consent Statement

For studies not involving humans.

Data Availability Statement

The study used the open data.

Conflicts of Interest

The authors declare no conflict of interest.

References

  1. Hua, X.; Wang, X.; Rui, T.; Zhang, H.; Wang, D. A fast self-attention cascaded network for object detection in large scene remote sensing images. Appl. Soft Comput. 2020, 94, 106495. [Google Scholar] [CrossRef]
  2. Pathak, A.R.; Pandey, M.; Rautaray, S. Application of deep learning for object detection. Procedia Comput. Sci. 2018, 132, 1706–1717. [Google Scholar] [CrossRef]
  3. Fayjie, A.R.; Hossain, S.; Oualid, D.; Lee, D.J. Driverless car: Autonomous driving using deep reinforcement learning in urban environment. In Proceedings of the 2018 15th International Conference on Ubiquitous Robots (UR), Honolulu, HI, USA, 26–30 June 2018; IEEE: Piscataway, NJ, USA, 2018; pp. 896–901. [Google Scholar]
  4. Costa-Jussà, M.R. From feature to paradigm: Deep learning in machine translation. J. Artif. Intell. Res. 2018, 61, 947–974. [Google Scholar] [CrossRef]
  5. Trigueros, D.S.; Meng, L.; Hartnett, M. Face recognition: From traditional to deep learning methods. arXiv 2018, arXiv:1811.00116. [Google Scholar]
  6. Zhang, Z.; Geiger, J.; Pohjalainen, J.; Mousa, A.E.D.; Jin, W.; Schuller, B. Deep learning for environmentally robust speech recognition: An overview of recent developments. ACM Trans. Intell. Syst. Technol. (TIST) 2018, 9, 1–28. [Google Scholar] [CrossRef]
  7. Chen, W.; Jiang, Z.; Guo, H.; Ni, X. Fall Detection Based on Key Points of Human-Skeleton Using OpenPose. Symmetry 2020, 12, 744. [Google Scholar] [CrossRef]
  8. Wang, Z.; Zou, N.; Shen, D.; Ji, S. Non-local U-Nets for biomedical image segmentation. In Proceedings of the AAAI Conference on Artificial Intelligence, New York, NY, USA, 7–12 February 2020; Volume 34, pp. 6315–6322. [Google Scholar]
  9. Qiu, L.; Wu, X.; Yu, Z. A high-efficiency fully convolutional networks for pixel-wise surface defect detection. IEEE Access 2019, 7, 15884–15893. [Google Scholar] [CrossRef]
  10. Zhu, Y.; Jiang, Y. Optimization of face recognition algorithm based on deep learning multi feature fusion driven by big data—Science Direct. Image Vis. Comput. 2020, 104, 104023. [Google Scholar] [CrossRef]
  11. Ding, P.; Zhang, Y.; Deng, W.J.; Jia, P.; Kuijper, A. A light and faster regional convolutional neural network for object detection in optical remote sensing images. ISPRS J. Photogramm. Remote Sens. 2018, 141, 208–218. [Google Scholar] [CrossRef]
  12. Li, J.; Qu, C.; Peng, S. Ship detection in SAR images based on an improved Faster R-CNN. In Proceedings of the 2017 SAR in Big Data Era: Models, Methods and Applications (BIGSARDATA), Beijing, China, 13–14 November 2017. [Google Scholar]
  13. Viola, P.; Jones, M. Rapid object detection using a boosted cascade of simple features. In Proceedings of the 2001 IEEE Computer Society Conference on Computer Vision and Pattern Recognition, Kauai, HI, USA, 8–14 December 2001; IEEE: Piscataway, NJ, USA, 2001. [Google Scholar]
  14. Dalal, N.; Triggs, B. Histograms of oriented gradients for human detection. In Proceedings of the 2005 IEEE Computer Society Conference on Computer Vision and Pattern Recognition, San Diego, CA, USA, 20–26 June 2005; IEEE: Piscataway, NJ, USA, 2005; Volume 1, pp. 886–893. [Google Scholar]
  15. Felzenszwalb, P.; McAllester, D.; Ramanan, D. A discriminatively trained, multiscale, deformable part model. In Proceedings of the 2008 IEEE Conference on Computer Vision and Pattern Recognition, Anchorage, AK, USA, 23–28 June 2008; IEEE: Piscataway, NJ, USA, 2008; pp. 1–8. [Google Scholar]
  16. Redmon, J.; Divvala, S.; Girshick, R.; Farhadi, A. You only look once: Unified, real-time object detection. In Proceedings of the IEEE conference on computer vision and pattern recognition, Las Vegas, NV, USA, 27–30 June 2016; pp. 779–788. [Google Scholar]
  17. Redmon, J.; Farhadi, A. YOLO9000: Better, faster, stronger. In Proceedings of the IEEE conference on computer vision and pattern recognition, Honolulu, HI, USA, 21–26 July 2017; pp. 7263–7271. [Google Scholar]
  18. Redmon, J.; Farhadi, A. Yolov3: An incremental improvement. arXiv 2018, arXiv:1804.02767. [Google Scholar]
  19. Bochkovskiy, A.; Wang, C.Y.; Liao, H.Y.M. Yolov4: Optimal speed and accuracy of object detection. arXiv 2020, arXiv:2004.10934. [Google Scholar]
  20. Liu, W.; Anguelov, D.; Erhan, D.; Szegedy, C.; Reed, S.; Fu, C.Y.; Berg, A.C. Ssd: Single shot multibox detector. In Proceedings of the European conference on computer vision, Amsterdam, The Netherlands, 8–16 October 2016; Springer: Cham, Switzerland, 2016; pp. 21–37. [Google Scholar]
  21. Fu, C.Y.; Liu, W.; Ranga, A.; Tyagi, A.; Berg, A.C. Dssd: Deconvolutional single shot detector. arXiv 2017, arXiv:1701.06659. [Google Scholar]
  22. Shen, Z.; Liu, Z.; Li, J.; Jiang, Y.-G.; Chen, Y.; Xue, X. Dsod: Learning deeply supervised object detectors from scratch. In Proceedings of the IEEE International Conference on Computer Vision, Venice, Italy, 22–29 October 2017; pp. 1919–1927. [Google Scholar]
  23. Jeong, J.; Park, H.; Kwak, N. Enhancement of SSD by concatenating feature maps for object detection. arXiv 2017, arXiv:1705.09587. [Google Scholar]
  24. Li, Z.; Zhou, F. FSSD: Feature fusion single shot multibox detector. arXiv 2017, arXiv:1712.00960. [Google Scholar]
  25. Girshick, R.; Donahue, J.; Darrell, T.; Malik, J. Rich feature hierarchies for accurate object detection and semantic segmentation. In Proceedings of the IEEE conference on computer vision and pattern recognition, Columbus, OH, USA, 23–28 June 2014; pp. 580–587. [Google Scholar]
  26. He, K.; Zhang, X.; Ren, S.; Sun, J. Spatial pyramid pooling in deep convolutional networks for visual recognition. IEEE Trans. Pattern Anal. Mach. Intell. 2015, 37, 1904–1916. [Google Scholar] [CrossRef] [Green Version]
  27. Girshick, R. Fast r-cnn. In Proceedings of the IEEE International Conference on Computer Vision, Santiago, Chile, 7–13 December 2015; pp. 1440–1448. [Google Scholar]
  28. Ren, S.; He, K.; Girshick, R.; Sun, J. Faster r-cnn: Towards real-time object detection with region proposal networks. In Proceedings of the Advances in Neural Information Processing Systems, Montreal, QC, USA, 7–12 December 2015; pp. 91–99. [Google Scholar]
  29. Kong, T.; Yao, A.; Chen, Y.; Sun, F. Hypernet: Towards accurate region proposal generation and joint object detection. In Proceedings of the IEEE Conference on Computer Vision and Pattern Recognition, Las Vegas, NV, USA, 27–30 June 2016; pp. 845–853. [Google Scholar]
  30. Dai, J.; Li, Y.; He, K.; Sun, J. R-FCN: Object detection via region-based fully convolutional networks. In Proceedings of the 30th International Conference on Neural Information Processing Systems, Morehouse Lane, Red Hook, NY, USA, 20–22 December 2016; pp. 379–387. [Google Scholar]
  31. Cai, Z.; Fan, Q.; Feris, R.S.; Vasconcelos, N. A unified multi-scale deep convolutional neural network for fast object detection. In Proceedings of the European Conference on Computer Vision, Amsterdam, The Netherlands, 8–16 October 2016; Springer: Cham, Switzerland, 2016; pp. 354–370. [Google Scholar]
  32. He, K.; Gkioxari, G.; Dollár, P.; Girshick, R. Mask r-cnn. In Proceedings of the IEEE International Conference on Computer Vision, Venice, Italy, 22–29 October 2017; pp. 2961–2969. [Google Scholar]
  33. Nie, X.; Duan, M.; Ding, H.; Hu, B.; Wong, E.K. Attention Mask R-CNN for Ship Detection and Segmentation From Remote Sensing Images. IEEE Access 2020, 8, 9325–9334. [Google Scholar] [CrossRef]
  34. Sun, X.; Jiang, H.; Huo, T.; Yang, W. A fast multi-target detection method based on improved YOLO. In Proceedings of the MIPPR 2019: Automatic Target Recognition and Navigation, Wuhan, China, 2–3 November 2019; p. 11429. [Google Scholar]
  35. Qu, J.; Su, C.; Zhang, Z.; Razi, A. Dilated Convolution and Feature Fusion SSD Network for Small Object Detection in Remote Sensing Images. IEEE Access 2020, 8, 82832–82843. [Google Scholar] [CrossRef]
  36. Yin, R.; Zhao, W.; Fan, X.; Yin, Y. AF-SSD: An Accurate and Fast Single Shot Detector for High Spatial Remote Sensing Imagery. Sensors 2020, 20, 6530. [Google Scholar] [CrossRef] [PubMed]
  37. Zhang, T.; Zhang, X. High-speed ship detection in SAR images based on a grid convolutional neural network. Remote Sens. 2019, 11, 1206. [Google Scholar] [CrossRef] [Green Version]
  38. Wei, S.; Su, H.; Ming, J.; Wang, C.; Yan, M.; Kumar, D.; Shi, J.; Zhang, X. Precise and robust ship detection for high-resolution SAR imagery based on HR-SDNet. Remote Sens. 2020, 12, 167. [Google Scholar] [CrossRef] [Green Version]
  39. Chen, C.; He, C.; Hu, C.; Pei, H.; Jiao, L. A deep neural network based on an attention mechanism for SAR ship detection in multiscale and complex scenarios. IEEE Access 2019, 7, 104848–104863. [Google Scholar] [CrossRef]
  40. Lin, T.Y.; Dollár, P.; Girshick, R.; He, K.; Hariharan, B.; Belongie, S. Feature pyramid networks for object detection. In Proceedings of the IEEE Conference on Computer Vision and Pattern Recognition, Honolulu, HI, USA, 21–26 July 2017; pp. 2117–2125. [Google Scholar]
  41. Hu, J.; Shen, L.; Sun, G. Squeeze-and-excitation networks. In Proceedings of the IEEE Conference on Computer Vision and Pattern Recognition, Salt Lake City, UT, USA, 18–23 June 2018; pp. 7132–7141. [Google Scholar]
  42. Wang, X.; Girshick, R.; Gupta, A.; He, K. Non-local neural networks. In Proceedings of the IEEE Conference on Computer Vision and Pattern Recognition, Salt Lake City, UT, USA, 18–23 June 2018; pp. 7794–7803. [Google Scholar]
  43. Woo, S.; Park, J.; Lee, J.Y.; Kweon, I.S. Cbam: Convolutional block attention module. In Proceedings of the European Conference on Computer Vision (ECCV), Munich, Germany, 8–14 September 2018; pp. 3–19. [Google Scholar]
  44. Fu, J.; Liu, J.; Tian, H.; Li, Y.; Bao, Y.; Fang, Z.; Lu, H. Dual attention network for scene segmentation. In Proceedings of the IEEE/CVF Conference on Computer Vision and Pattern Recognition, Long Beach, CA, USA, 16–20 June 2019; pp. 3146–3154. [Google Scholar]
Figure 1. Examples of ship in remote sensing image. The samples are from the SAR ship detection dataset (SSDD) dataset. Left side is the description of the sample under multiobject condition; right side is the description of the sample in complex background.
Symmetry 13 00495 g001
Figure 2. The architecture of SSD.
Symmetry 13 00495 g002
Figure 3. The default boxes in the feature map [20].
Symmetry 13 00495 g003
Figure 4. Our improved model.
Symmetry 13 00495 g004
Figure 5. The architecture of feature pyramid network (FPN).
Symmetry 13 00495 g005
Figure 6. Aliasing effect reduction module.
Symmetry 13 00495 g006
Figure 7. Squeeze-and-excitation module.
Symmetry 13 00495 g007
Figure 8. Detection results of SSDD dataset. (a) represents detection result in complex background and (b) represents detection results under multiobject condition.
Symmetry 13 00495 g008
Figure 9. P-R curve (the threshold changed from 0.05 to 0.95).
Symmetry 13 00495 g009
Figure 10. Comparison of experimental results between our model and SSD.
Symmetry 13 00495 g010aSymmetry 13 00495 g010b
Figure 11. The comparison of experimental results with histogram.
Symmetry 13 00495 g011
Table 1. Parameter setting of default boxes [20].
Feature MapSizeDefault Box ScaleMapping Value (Scale × Input Size)
Conv4_338 × 380.260 × 60
Conv719 × 190.34102 × 102
Conv8_210 × 100.48144 × 144
Conv9_25 × 50.62186 × 186
Conv10_23 × 30.76228 × 228
Conv11_21 × 10.9270 × 270
Table 2. The number of ships (NoS) and number of images (NoI) in SSDD [12].
NoS1234567891011121314
NoI725183894745161584115330
Table 3. Confusion matrix.
PositiveNegative
IoU ≥ αTPTN
IoU < αFPFN
Table 4. Experimental environment configuration and parameter settings.
ItemVersion
CPUIntel(R) Core (TM) i7-8700
GPUNVIDIA GeForce GTX 1070 8G
Operating systemWindows10
Python3.6.10
Pytorch1.4.0
Torchvision0.5.0
CUDA10.1
Table 5. The comparison of experimental results.
NetworksmAPMemory/MBSpeed/FPS
Our model94.41%20131
SSD92.25%17445
YOLOV494.02%24642
Faster R-CNN97.62%2383
Publisher’s Note: MDPI stays neutral with regard to jurisdictional claims in published maps and institutional affiliations.