Article

Vibration Analysis and Parameter Optimization of the Longitudinal Axial Flow Threshing Cylinder

College of Engineering, Northeast Agricultural University, Harbin 150030, China
*
Author to whom correspondence should be addressed.
Symmetry 2021, 13(4), 571; https://doi.org/10.3390/sym13040571
Submission received: 23 February 2021 / Revised: 17 March 2021 / Accepted: 26 March 2021 / Published: 29 March 2021
(This article belongs to the Section Computer)

Abstract

:
The longitudinal axial flow threshing cylinder of the full feeding rice combine harvester is widely used in China and works with violent vibration. To explore the source of the excitation affecting the vibration and to reduce the vibration, a finite element modal analysis and multipoint input and multipoint output (MIMO) modal test were performed to solve the natural vibration characteristics. By analyzing the excitation frequency, we concluded that the main reason for the resonance was the coupling between the rotation frequency of the threshing cylinder and the first natural frequency. To avoid the influence of resonance and realize a lightweight design, we proposed a combination of size optimization and topology optimization. The second rotation orthogonal combination test was designed to analyze the first natural frequency, maximum stress, and maximum deformation of the threshing cylinder, and the threshing cylinder was reconstructed as a central symmetrical structure to balance the rotational inertia force. The field experiment results showed that the amplitudes of the optimized threshing cylinder were significantly lower than those of the original threshing cylinder. This study provides ideas for solving the vibration characteristics of rotating parts and provides an important reference for the design of vibration reduction and weight reduction of key parts in the field of agricultural machinery.

Graphical Abstract

1. Introduction

The threshing cylinder is an important working part installed in combine harvesters, which has the functions of threshing, conveying, and separating stalks [1]. As the threshing cylinder is a high-speed rotating part, to avoid the influence of unbalanced inertia forces in the process of rotation, its overall mass distribution must be in a centrosymmetric structure. According to the layout form, the distribution of the cylinder is mainly divided into tangential flow and axial flow.
At present, according to the number of layouts, these cylinders have evolved into a variety of combination forms, such as tangential flow + transverse axial flow, tangential flow + longitudinal axial flow, tangential flow + double longitudinal axial flow, etc., which are developing toward the direction of a high decontamination rate and low loss rate [2]. Due to the complete threshing and clean separation, longitudinal axial flow threshing cylinders are widely used in China’s full feeding rice combine harvesters.
However, in the process of threshing, the longitudinal axial flow threshing cylinder often vibrates violently due to its large size and high speed. The periodic centrifugal force caused by vibration causes local deformation of the cylinder, resulting in an increase in the grain breakage rate and loss rate. The vibration radiation transfer on the bearing frame becomes the main excitation source of the combine vibration, which seriously affects the stability of the working parts and the reliability of the whole machine [3,4,5].
To obtain the vibration characteristics of the structures, modal analysis is typically used. With the development of computer technology, the modal parameters of each working part can be effectively solved with the help of multi-software synergistic simulation interface technology. Tang et al. [6] analyzed the first sixth-order natural frequencies and modal shapes of the combined harvester racks using ANSYS, which provided a basis for reducing the vibration of the racks under multi-source excitation.
Li et al. [7] obtained the optimal arrangement mode of the array structure of grain loss sensors through modal analysis, which improved the loss monitoring accuracy while avoiding vibration interference. Although simulation analysis can shorten the design cycle of key components, the vibration characteristics obtained from the solution produces certain errors. Therefore, the data obtained from a modal test with a vibration data acquisition system are more accurate. Yao et al. [8] obtained the vibration characteristics of the header frame of a corn combine harvester through a free modal test and compared the results of ANSYS free modal analysis. They concluded that there were errors between them.
Lee et al. [9] obtained the actual natural frequency and modal shapes of the cutting tool support structure (CTSS) system through modal analysis and an impact test, determined how the cutting tool vibrates when chatter occurs, and the relationship between the motion and acoustic emission signal. Resonance occurs when the external excitation frequency is equal or close to the natural frequency of the structure obtained by solving [10], and the resonance of the combine harvester is extremely harmful to the key work components and the whole machine.
Li et al. [11] found that the rotation of threshing cylinder is the main factor leading to the vibration of the header frame by analyzing the influencing factors for multiple excitation sources’ effects on the vibration of the header frame. The theory and research methods provide an effective reference for solving structural resonance problems under complex excitation. In addition, vibration is transmitted to all directions through the rack, which severely affects the driving comfort. Driving comfort research is mostly reflected in the automotive field [12,13,14].
The agricultural machinery field focuses on the research and development of key working parts. At present, while meeting the function, increasing attention has been paid regarding the driving comfort of agricultural machinery. Li et al. [15] showed that the cutter driveline acted as a primary source of excitation to directly influence the driving seat Y-direction vibration, which was effectively reduced by adding a weight bearing device to the driveline shaft or by installing a rubber nut to the driving seat.
The methods of reducing vibration are typically to increase the isolation device and optimize the excitation source structure. Ahmad’s [16] studies showed that the engine was the main excitation source affecting the vibration of the tractor’s complete body and found that the transmission of unbalanced engine inertia force on the complete body could be effectively reduced by fitting a spacer between the tractor engine and chassis [17,18]. The optimal excitation source structure is mainly divided into size optimization, shape optimization, and topology optimization [19].
Anthony et al. [20] reduced the vibration transmission of a two-dimensional cantilever truss structure through size optimization, which laid a foundation for the application of size optimization to reduce vibration in various fields. The object of shape optimization was mainly thin slab structures with convex table distributions focused on enhancing the local stiffness [21].
Topology optimization takes material distribution as the optimization object, and finds the best distribution scheme in the design space of uniformly distributed materials. There is more design space and degrees of freedom compared with size optimization and shape optimization, which is a hot research direction of structural optimization [22]. Through topology optimization, the structural form of the vibration isolation system can be changed to reduce the vibration transmission [23,24].
At the same time, the structural form of the optimization target can be changed to make it far away from the excitation source frequency, avoid resonance, and effectively reduce the vibration amplitude [25,26,27]. In the field of agricultural machinery, most of the machines are heavy working parts, and the power consumption is large. The above related research is still based on weight gain optimization, which cannot meet the requirements of reducing vibration and mass at the same time. Topology optimization is rarely used in the vibration research of key components in the field of agricultural machinery.
At present, the vibration problem has become a bottleneck that affects the progress of the combine harvester in the direction of high efficiency, reliability, and comfort, and most of the traditional studies are mainly focused on optimizing the static working parts, and rarely involve the optimal design of the rotating parts.
In this paper, a certain type of combine harvester in China has many excitation sources and a vibrating threshing drum as a carrier for vibration reduction research. Parametric modeling and finite element free modal analysis of longitudinal axial threshing cylinder were carried out. On this basis, the free modal was identified using the Poly Max least square complex frequency domain algorithm, and the modal parameters were obtained by testing, which verified the accuracy of the finite element model.
Secondly, the natural frequencies and excitation frequencies of the threshing cylinder were analyzed by resonance analysis, and an optimal scheme for changing the natural frequency was obtained by a quadratic rotation orthogonal combination test by combining size optimization and topology optimization. Finally, a field experiment was conducted to verify the optimized effect. This study can provide the basis for obtaining the vibration characteristics of the structure and can provide an important reference for vibration reduction and weight reduction of the key components in the field of agricultural machinery.

2. Materials and Methods

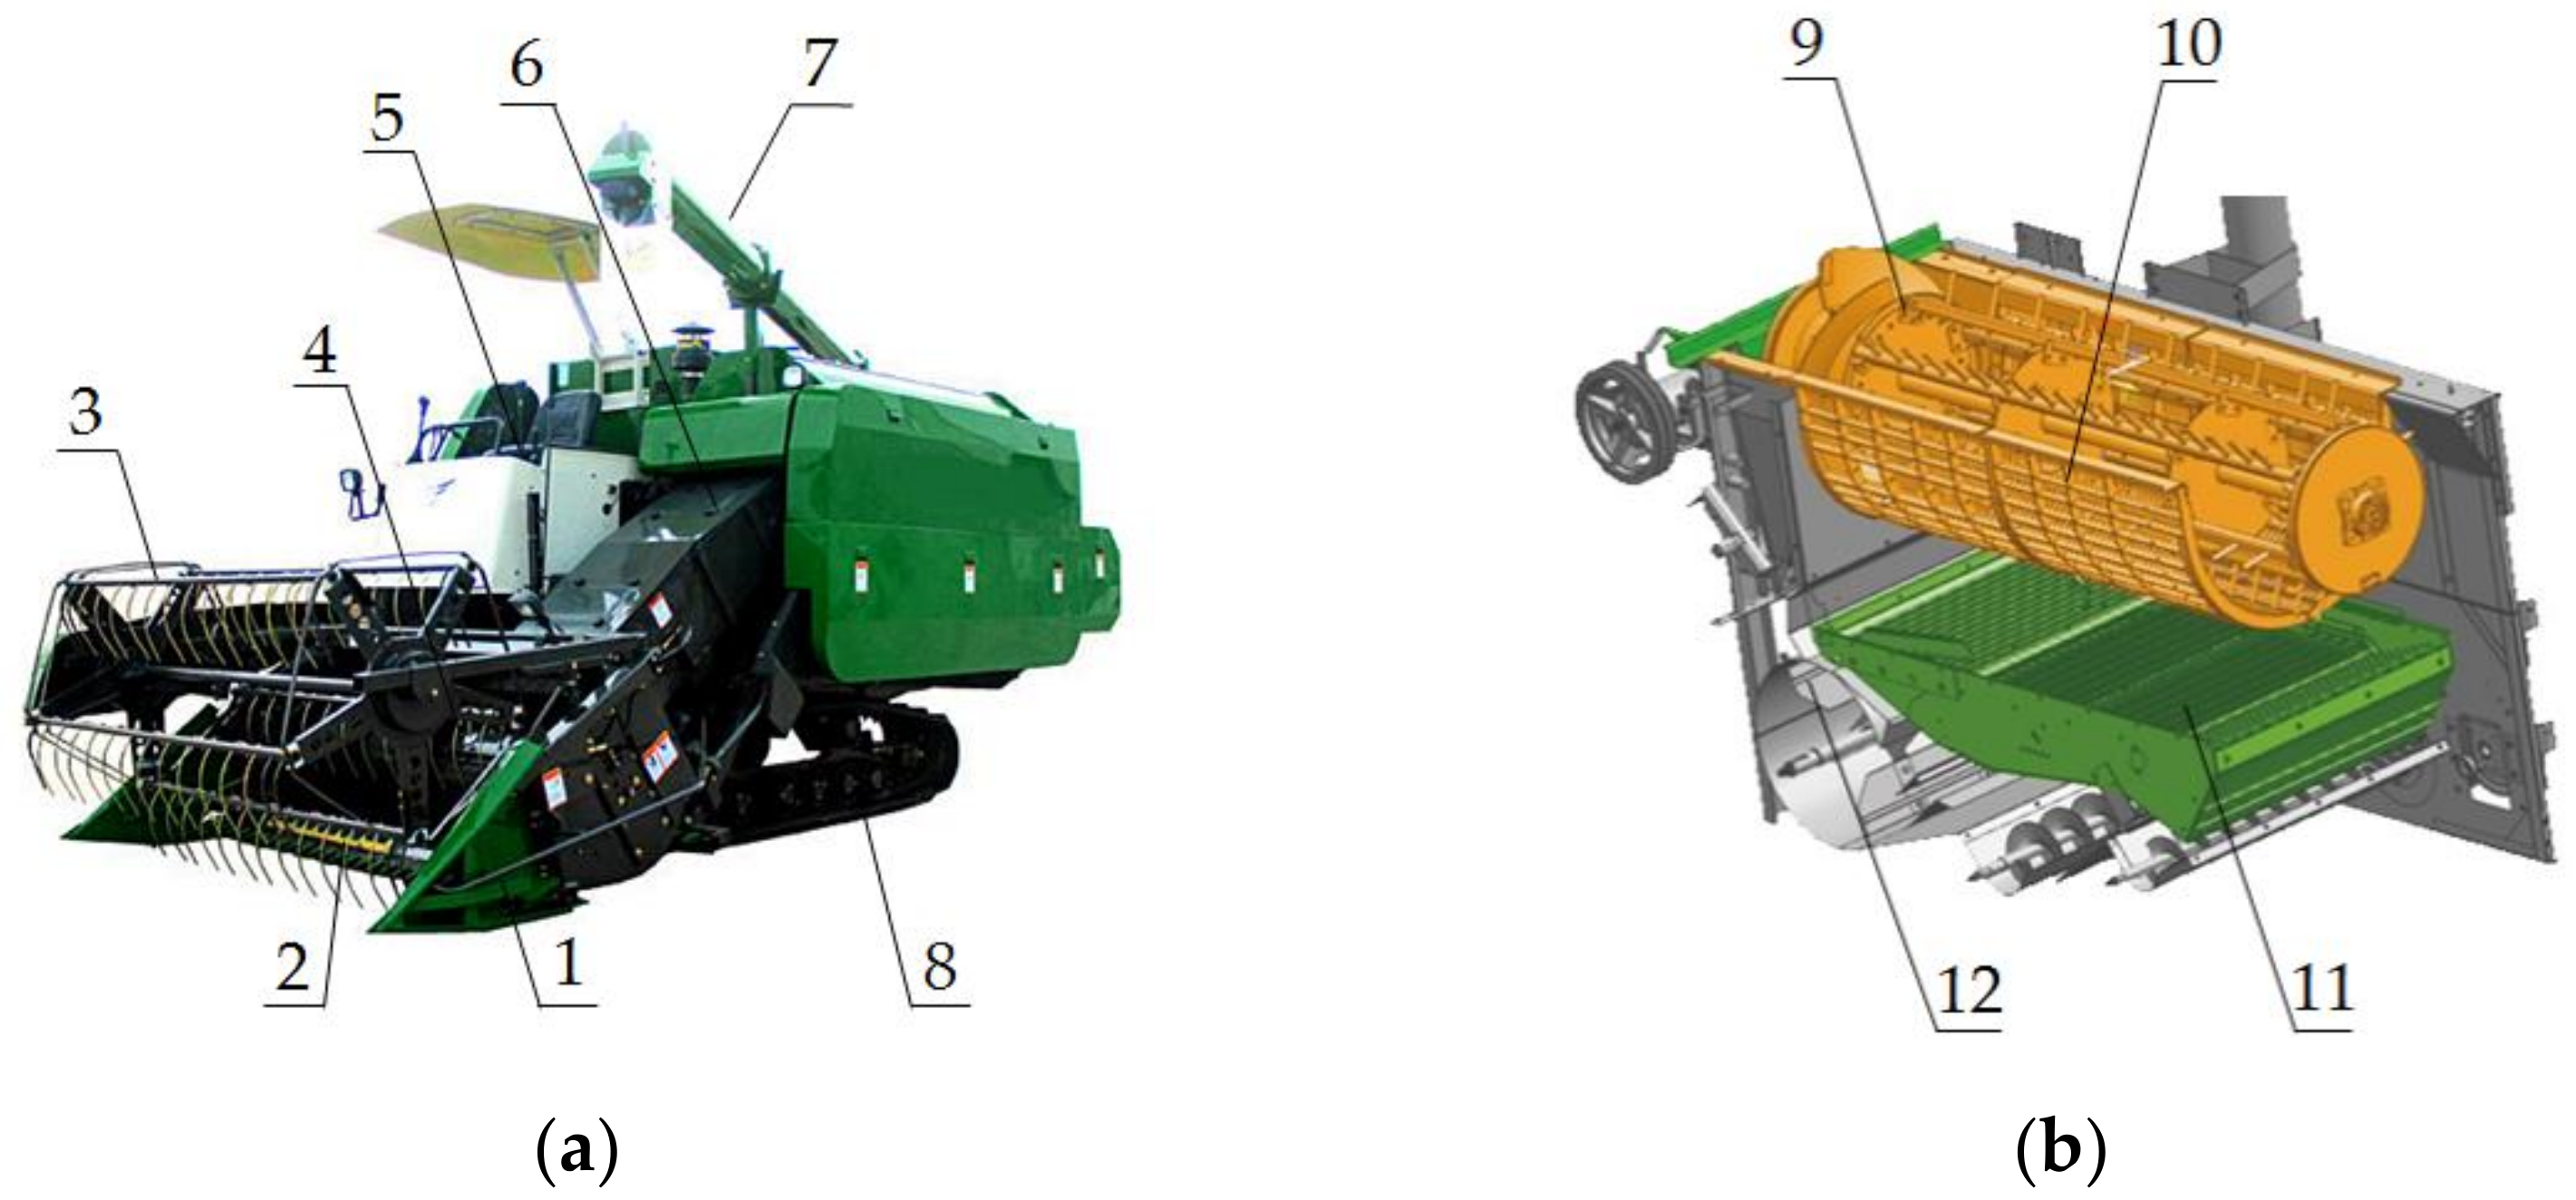
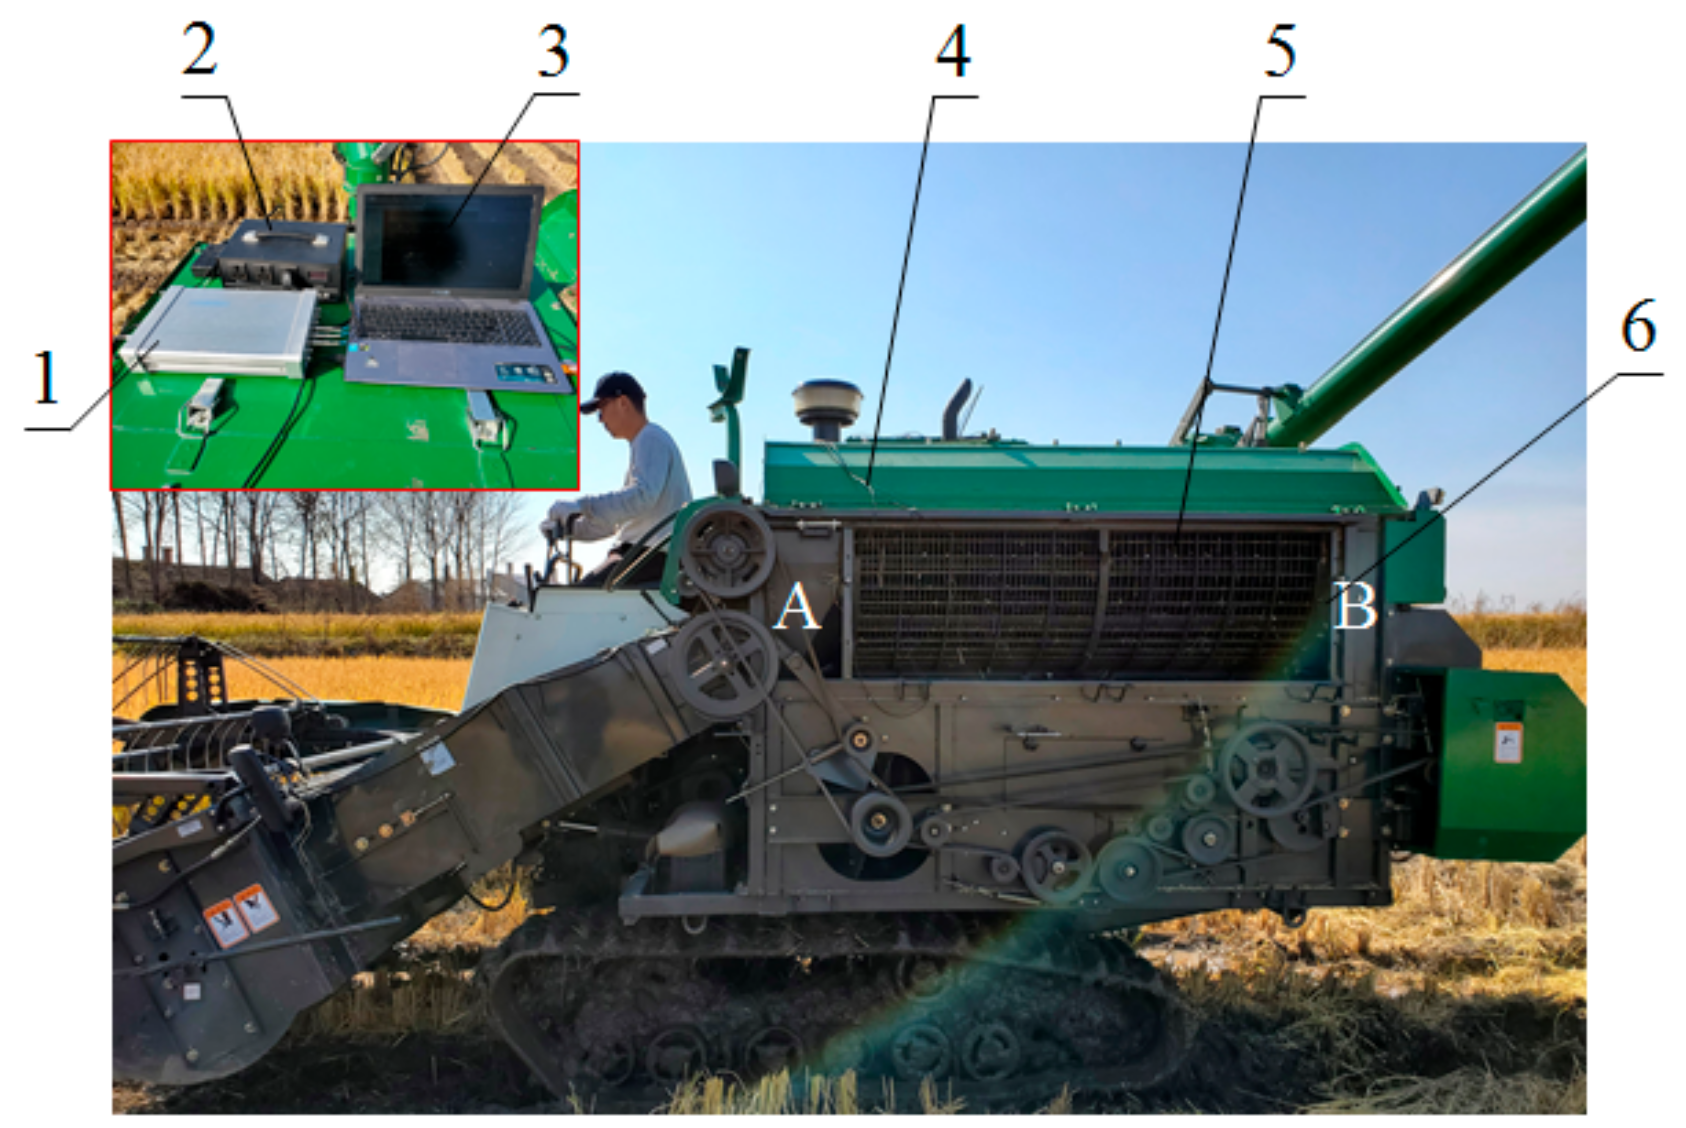
2.1. Structure and Working Process of a Full Feeding Rice Combine Harvester

A longitudinal axial flow threshing cylinder is mounted on a CF805N fully fed rice combine harvester (Jiamusi Changfa Jialian Agricultural Equipment Co., Ltd., Heilongjiang, China) and is widely used in many rice growing areas in China. The structure of the machine is shown in Figure 1. It is mainly composed of a header assembly composed of a divider, cutter, reel, and screw pusher; a threshing system composed of a threshing cylinder and concave plate; a cleaning system composed of a sieve and fan; a grain unloading system; cab; tilt conveyor; and a power chassis. The main technical parameters are shown in Table 1 [28].
During the harvesting operation, the divider separates the rice to be cut from the uncut rice, and the reel guides the rice to be cut to the cutter, so that the cut rice is laid on the header frame, and the tilt conveyor transports it as it is concentrated by the screw pusher to the threshing device. The threshed grains and chaff are sent to the cleaning device composed of the sieve and fan for cleaning. Then, the clean grains enter into the grain tank by the grain unloading system, and the stalks and sundries are discharged out of the machine, to complete the whole harvesting process of rice cutting, conveying, threshing, and cleaning.
In this work, we studied the threshing cylinder mounted on the CF805N full feeding rice combine harvester, its type being pin tooth. This cylinder is mainly composed of a screw feeding blade, barrel, separating bar, nail tooth, axis, and fixing plate. The structural parameters are shown in Table 2. Q235A structural steel is used for each part. The front end is a screw feeding blade, which can lead the grain from the tilt conveyor into the threshing chamber for threshing.
The solid design of the separating bar can not only be used as the fixed support of nail teeth but can also fully separate grains and stems. This bar is equipped with nail teeth with equal spacing, which can rub the grain through the rotation of the threshing cylinder and concave plate, and can also disturb the grain layer, making the grain easier to penetrate and reducing the entrainment loss. The fixing plate plays a supporting and fixing role for the separating bar. Using 3D modeling software CATIA V5R20, we established a three-dimensional solid model of a threshing cylinder, as shown in Figure 2.

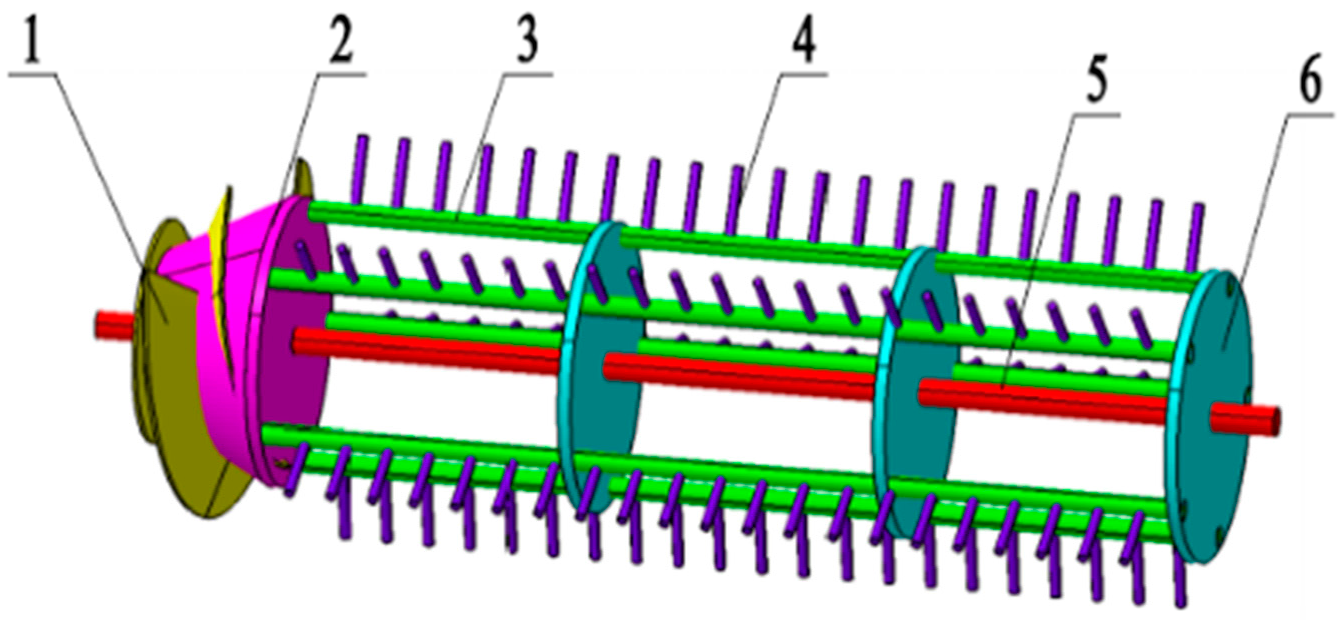
2.2. Modal Analysis and Test of Threshing Cylinder

The finite element modal analysis can solve the vibration characteristics of the threshing cylinder, in which the finite element free modal analysis can obtain the vibration characteristics of the threshing drum in the unconstrained state, that is, the inherent characteristics in the ideal state [29]. Through the establishment of the threshing cylinder finite element model and simulation analysis in ANSYS Workbench, the natural frequencies and modal shapes of a threshing cylinder in the free state can be effectively solved.
The accuracy of the finite element model can be verified by comparing the modal shapes and frequencies obtained from the solution with those from the multipoint input and multipoint output (MIMO) free modal test. The threshing cylinder has rotation constraints when it works; therefore, based on the established finite element model, the finite element constrained modal analysis was performed to make the vibration characteristics of the threshing cylinder more accurate.

2.2.1. Free Modal Analysis of Finite Elements

The establishment of the finite element model is necessary before the free modal analysis. Due to the many parts and complex shapes of a threshing cylinder, including the interference of the mesh number, element type, mesh quality, and other factors [30], in order to obtain an accurate finite element model, it is necessary to consider the simplification of the model. Therefore, the local features, such as bolt holes, fillets, and chamfers, far smaller than the mesh size were ignored. The welding flanging, which has little influence on the structure and the change of material properties due to the welding joint, was ignored. The structure was simplified as a rigid connection model.
The material was defined as Q235A structural steel by its elastic modulus E = 210 GPa, Poisson’s ratio u = 0.3, density ρ = 7850 kg/m3, and yield strength σs = 235 Mpa. The three-dimensional solid model of the threshing cylinder was saved in the STP format into the finite element analysis software ANSYS Workbench. The meshing was performed using the ANSYS mesh module, and the grid quality was controlled by the sizing command. In view of the thin plate structure of the screw feeding blade, the Shell 63 grid element was selected as the element type.
In view of the fixed plate with large relative surface area and the separation bar structure with large mass, the Mass 21 element was selected as the element type. To ensure the calculation accuracy and improve the calculation efficiency, the Solid 45 grid element was selected as the other element types. Based on the size of the solid model and the size of the grid, the cell size was set to 5 mm, and the total numbers of cells and nodes were 367,044 and 747,797, respectively.
A low order frequency is harmful to the structure; therefore, the influence of a high order vibration frequency on the threshing cylinder was not considered [31]. The modal analysis of a threshing cylinder in the free state showed that the six degrees of freedom of movement and rotation of the model were unconstrained, and the simulation results showed that the first six rigid body modes had zero natural frequency [32,33]. In this study, the first six non-zero modal frequencies and modes were extracted for analysis, and the modal frequencies and corresponding modal shapes were obtained using the Block Lanczos method.

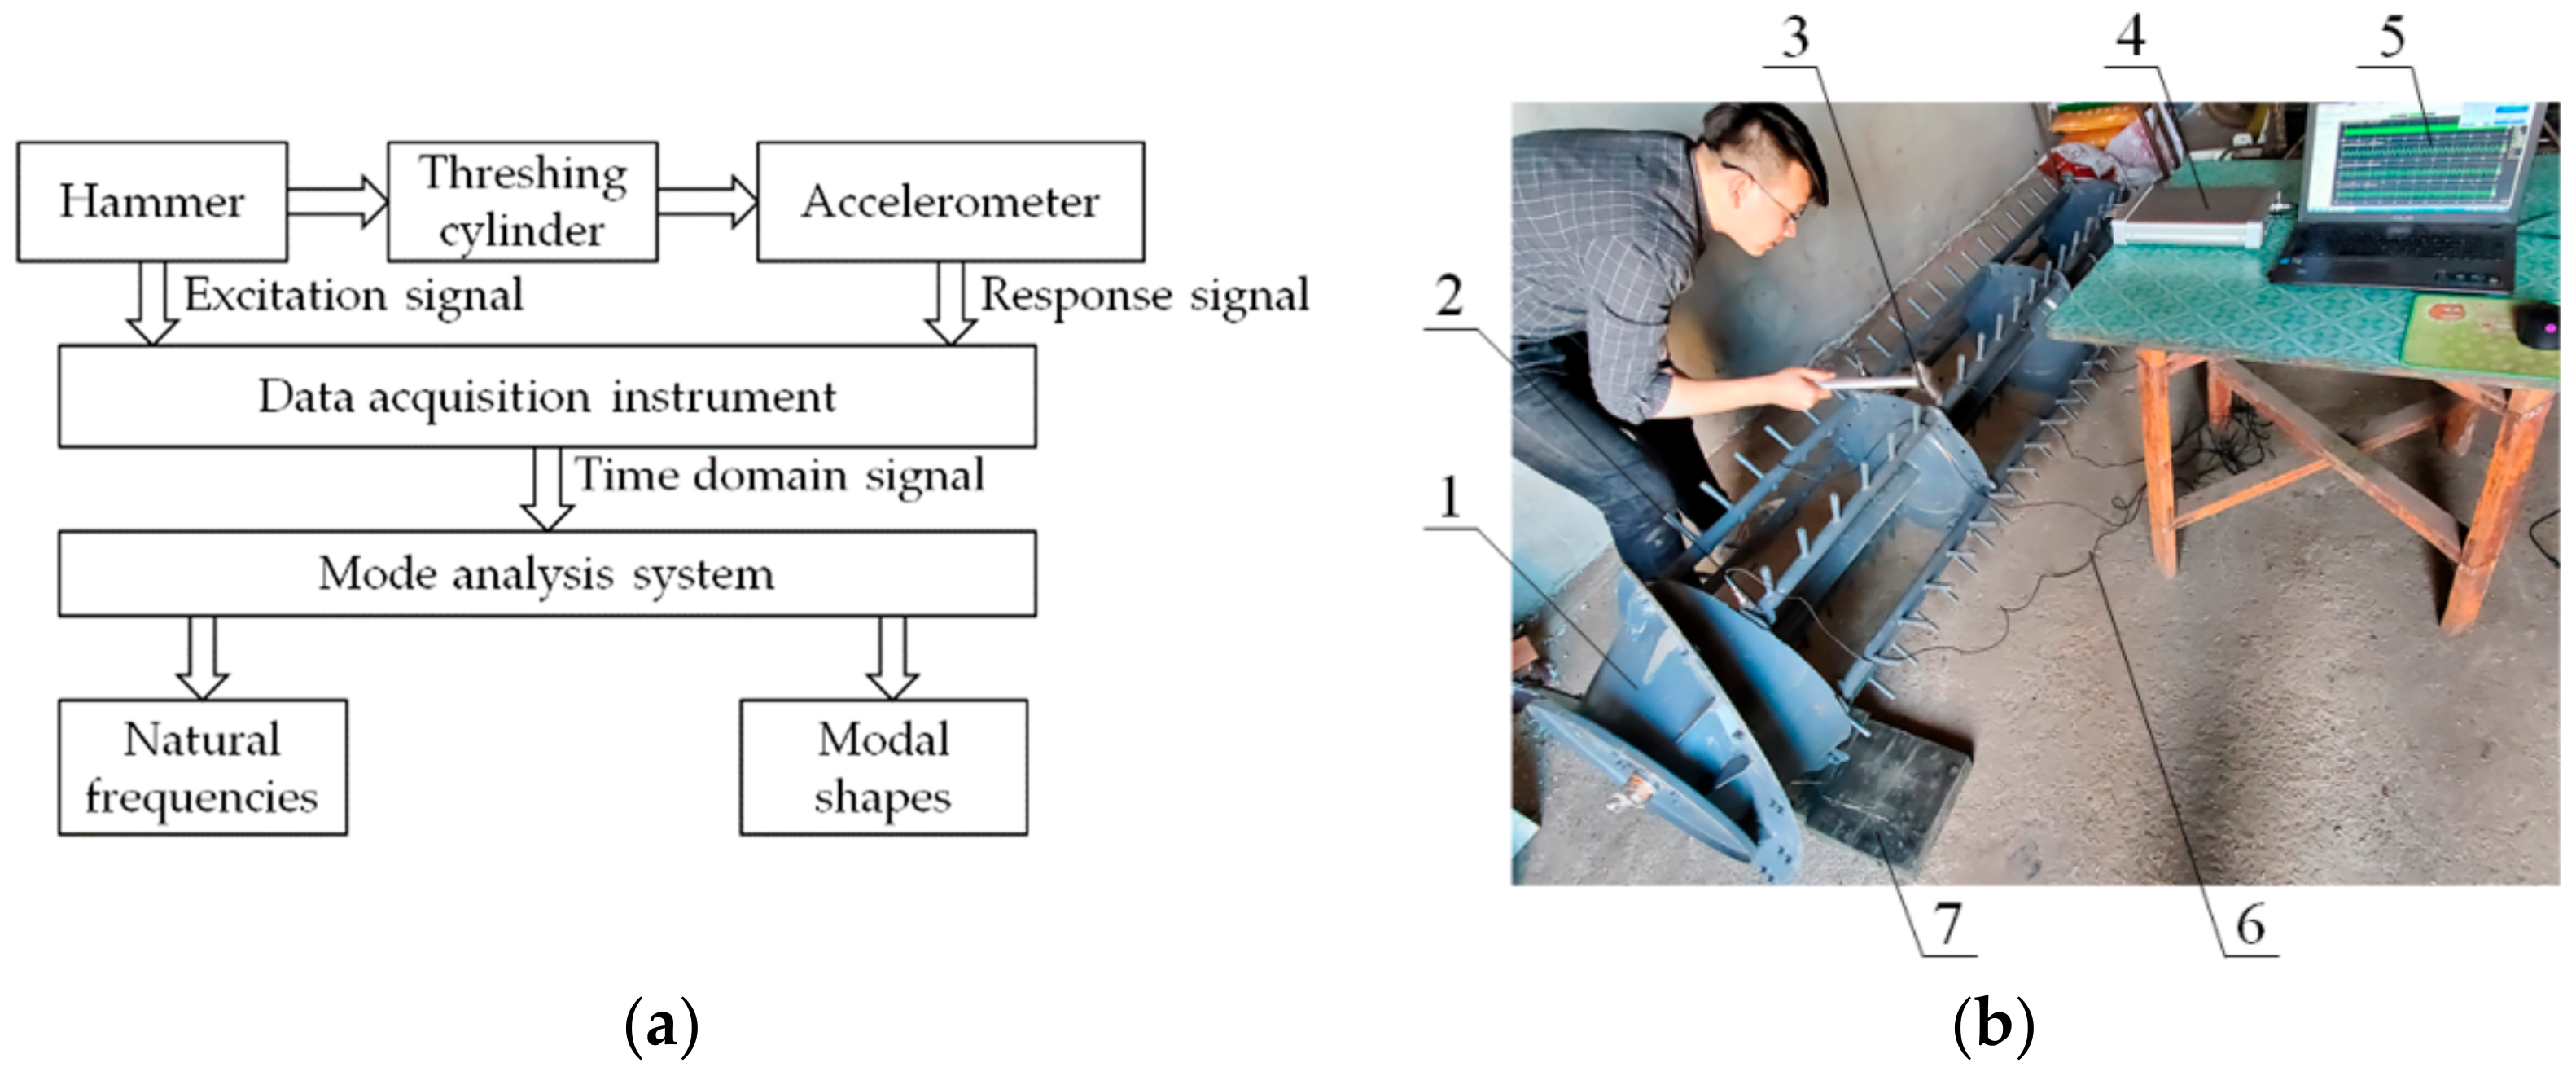
2.2.2. Free Modal Test

Compared with the constrained modal test, the free modal test is easier to realize without the coupling interference of other key components. Compared with the results of free modal analysis, the vibration characteristics obtained from the free modal test can verify the accuracy of the threshing cylinder model, and then the constraint modal analysis can be applied to the threshing cylinder according to the actual working state to replace the constraint modal test to avoid the dynamic coupling between the working parts, so that the vibration characteristics obtained from the solution are more accurate and reliable [34].
The data of the threshing cylinder were collected using the MIMO modal test method, and the natural frequency and modal shape of the structure were identified using the frequency response function (FRF) calculation, impulse response function solution, and Poly Max least square complex frequency domain modal identification.
The Poly Max least square complex frequency domain modal identification algorithm belongs to the multiple degrees of freedom time domain recognition method, which plays a crucial role in the free modality test of the threshing cylinder. This algorithm can identify highly dense modes when the FRF data are seriously polluted by noise [35].
Under the external excitation force, the vibration differential equation is as follows [36]:
[ M ] { x ¨ } + [ C ] { x ˙ } + [ K ] { x } = { f }
where [ M ] , [ C ] , and [ K ] are the mass, damping, and stiffness matrices, respectively; { f } is the excitation force vector; { x } is the displacement; { x ˙ } is the velocity; and { x ¨ } is the acceleration.
It is the modal matrix and the modal coordinate. The decoupling equation of Equation (1) in modal coordinates is as follows:
Introducing equation { x } = { φ } { q } , where { φ } is the modal matrix, and { q } is the modal coordinate, the decoupling equation of Equation (1) in modal coordinates is as follows:
{ q ¨ } + 0 2 ε ω n 0 { q ˙ } + 0 ω n 2 0 { q } = [ φ ] T { f } .
In Equation (2), the r order modal equation is as follows:
( K r ω 2 M r + j ω C r ) q r = F r
where F r = Φ r T { f } , F r is the r-order modal force, q r is the r-order modal coordinate, and M r , K r , and C r are the modal mass, stiffness, and damping, respectively.
Assuming that the exciting force f p ( ω ) is located at point p, the modal force is shown in Equation (4).
F r = φ p r f p ( ω ) .
The response of a point l on the structure is shown in Equation (5).
x l ( ω ) = r = 1 N φ l r q r .
Then:
q r = φ p r φ p ( ω ) K r ω 2 M r + j ω C r
x l ( ω ) = r = 1 N φ l r φ p r φ p ( ω ) K r ω 2 M r + j ω C r .
The FRF frequency response function between the response point l and the excitation point p is obtained.
H ( ω ) = x l ( ω ) f p ( ω ) = r = 1 N φ l r φ p r M r [ ( ω r 2 ω 2 ) + 2 j ε r ω r ω ]
where ε r = C r 2 M r ω r , ω r 2 = K r M r , and ω r and ε r are the r order natural frequency and the critical damping ratio, respectively.
Based on the frequency response function, the mathematical model was obtained by Poly Max fitting.
H ( ω ) n × m = P ( ω ) n × m X ( ω ) m × m 1
where H ( ω ) n × m is the frequency response function of m inputs and n outputs, and P ( ω ) and X ( ω ) are the weighted matrices of the outputs and inputs, respectively.
Let:
P ( ω ) = r = 0 p Z r [ β r ]
X ( ω ) = r = 0 p Z r [ α r ]
Z = e j ω Δ t
where Z is a polynomial basis function; e is the natural base; j is a plural unit; [ α r ] m × n and [ β r ] m × n are the unknown denominator and the polynomial coefficients of the molecular matrix, respectively; p is the order of the model; and Δ t is the sampling time.
The measured FRF can be expressed as:
H ( ω ) = r = 0 p Z r [ α r ] ( r = 0 p Z r [ β r ] ) 1 .
We supposed that α r and β r are real numbers, which can be expressed as:
[ α ] = α 0 α 1 α p , [ β ] = β 0 β 1 β p .
In Equation (13), for the measured H ( ω ) , a sufficient number of equations can be listed according to any different sampling frequency ω k , and [ α r ] , [ β r ] (r = 0, 1, …, p) can be estimated by the least squares method.
The eigenvalues of the unitary matrix constructed by [ α r ] were decomposed to obtain the pole pr and all coefficients α r and β r . The corresponding modal shapes can be obtained by substituting them into Equation (9).
The test equipment included a computer, INV3018C 8-channel 24-bit high precision data acquisition instrument (Beijing Dongfang Institute, Beijing, China), LC-2D force hammer (Beijing Dongfang Institute), AY100I piezoelectric acceleration sensor (Beijing Dongfang Institute), and DASP-10 modal analysis system (Beijing Dongfang Institute). The specific parameters are shown in Table 3.
To avoid introducing additional mass effects and to decompose repetitive modal shapes easily, the multipoint input and multipoint output (MIMO) method was adopted in this experiment. In the test, an LC-2D force hammer was used to excite the measuring points of the threshing cylinder, and each measuring point was excited three times to take the average value. AY100I piezoelectric acceleration sensors were used to measure the multi-point pickup response.
The excitation signal and response signal were transmitted to a INV3018C 8-channel 24-bit high precision data acquisition instrument at the same time. The collected signal was analyzed with a DASP-10 modal analysis system. The FRF frequency response function calculation, impulse response function solution, Poly Max modal identification, and other steps were used to obtain the minimum order system matrix to calculate the natural frequencies and modal shapes of the structure.
In the free modal test, to ensure that the rigid body mode was less than 1/3 of the first-order elastic body mode, the threshing cylinder was placed on the ground paved with rubber blocks [37]. The modal test is shown in Figure 3.

2.2.3. Constrained Modal Analysis of Finite Element

By comparing and analyzing the frequency spectrum of the finite element free modal analysis and modal test [38,39,40], or comparing the natural frequency and modal characteristics in the results, the accuracy of the finite element model could be effectively verified, which laid the foundation for solving the finite element constrained mode. When the threshing cylinder rotates at high speed, its natural frequencies and modal shapes will be different from when it stops.
The constrained modal analysis can better reflect the vibration characteristics of the threshing cylinder in the actual working state [41]. When the threshing cylinder works, the x, y, and z directions of both ends of the shaft are fixed, and only rotate in the circumferential direction. Based on the accurate threshing cylinder model, a rotational motion of 1300 r/min was applied on the shaft, and the natural frequencies and corresponding modal shapes under the constraint state were solved.

2.3. Analysis of Excitation Source

The working parts of a combine are complex and diverse. When the frequencies of the excitation source are close to or equal to the natural frequencies of the constraint mode, resonance occur. Resonance makes the threshing cylinder produce periodic centrifugal force, leading to local deformation and fatigue failure. Due to the large axial size of a threshing cylinder, the noise and vibration caused by the threshing cylinder spreads to other working parts over a large range, which makes the effects radiate on the whole combine and seriously affects the working reliability and driving comfort. Therefore, it is of great significance to explore the main excitation source frequency of threshing cylinders for optimization.
A threshing cylinder includes rotary mechanical parts, and its main excitation source is its own rotation. At the same time, the rotary working parts arranged on the frame close to the threshing cylinder are also an excitation source of the threshing cylinder. The formula for calculating the excitation frequency of rotating parts is shown in Equation (15).
f = n 60
where f is the excitation frequency, Hz; and n is the operating speed, r/min.
In addition to its own rotation frequency, the engine also has a combustion excitation frequency and inertial force excitation frequency. The combustion excitation frequency is caused by the combustion of the mixture in the engine cylinders, which makes the pulse torque output by the crankshaft periodically change, resulting in a fluctuation of the reaction torque on the engine, resulting in periodic torsional vibration of the engine. The calculation formula of the combustion excitation frequency is shown in Equation (16).
f = 2 n i 60 c
where n is the engine speed, r/min; i is the number of engine cylinders; and c is the number of engine strokes.
The excitation frequency of the inertial force is caused by the combined moment of inertial excitation force produced by the reciprocating mass and unbalanced rotating mass. The calculation formula of the inertia force excitation frequency is shown in Wquation (17).
f = Q n 60
where Q is the proportional coefficient (first-order unbalanced inertia force Q = 1; second-order unbalanced inertia force Q = 2).

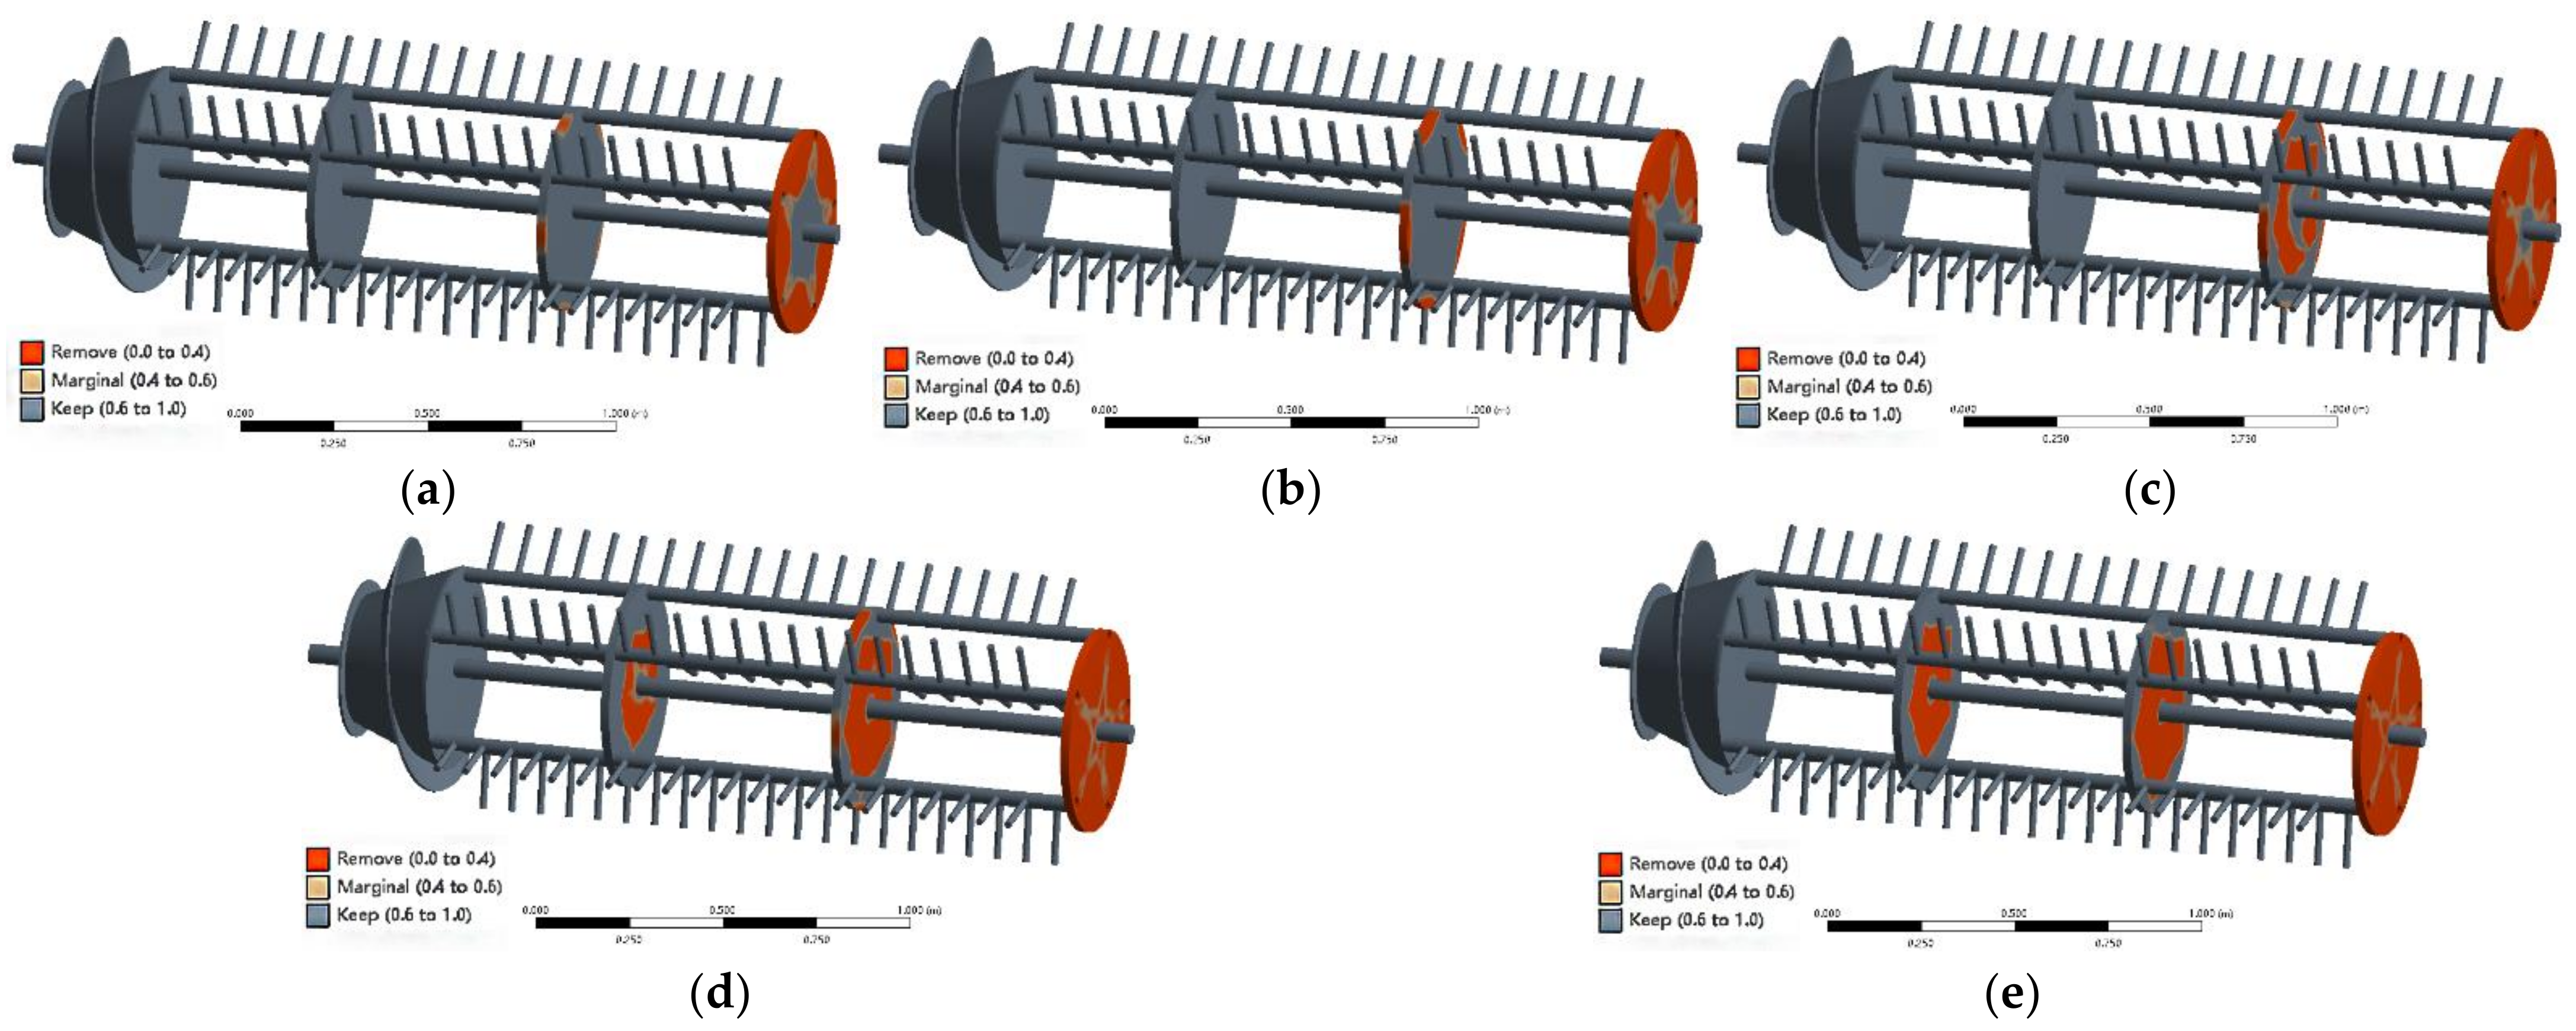
2.4. Optimization Design of Threshing Cylinder

2.4.1. Optimization Method

In analyzing the specific structure of a threshing cylinder, we proposed a combination of size optimization and topology optimization to improve the first natural frequency of the threshing cylinder to avoid the range of excitation frequency. To reduce the vibration and mass, the separation bar was hollow and the fixed plate was topologically optimized.
The separating bar was hollow directly in CATIA, and the model was imported into ANSYS Workbench to optimize the design of the fixed plate. The finite element model was established by defining the material properties and meshing. The three fixed plates of the threshing cylinder were set as the optimization area. Taking the different mass fraction of the optimization region as the constraint condition, the topology optimization was carried out in the topology optimization module.
To obtain a reasonable and reliable topological shape of threshing cylinder, and to control the checkerboard phenomenon, avoid the small force transmission path, and material accumulation, which made the optimization configuration more complex, three times of the size of meshing was taken as the minimum member size, and six times the size of meshing was taken as the maximum size; that is, the minimum member size was 15 mm, and the maximum member size was 30 mm.

2.4.2. Test Design

To combine the two methods of size optimization and topology optimization to achieve the best performance of a threshing cylinder, two factors and five levels of a quadratic rotation orthogonal combination test scheme were designed, in which the separation bar was hollow with different diameters, and the fixed plate was topologically optimized by deleting different mass fraction materials. The first natural frequency, maximum stress, and maximum deformation of the threshing cylinder were taken as performance indexes.
According to the design requirements of the threshing cylinder key parts, size, and test level, the hollow diameters of the separating bar were set as 8, 10, 15, 20, and 22 mm, respectively, and the removal mass fractions of the fixed plate were set as 23.8%, 30%, 45%, 60%, and 66.2%, respectively. To balance the inertia force when the threshing cylinder rotated, it was necessary to hollow the four separating bars with the same size parameters, and the fixed plate after mass reduction should be a center symmetric structure. The coding table of test factor level is shown in Table 4.

2.5. Characteristic Analysis of Optimized Threshing Cylinder

2.5.1. Finite Element Analysis of Optimized Threshing Cylinder

To verify the performance of the optimized threshing cylinder, the finite element analysis, including modal analysis, static analysis, and fatigue analysis was carried out.
In the process of test design and verification analysis, it was necessary to solve the vibration characteristics and static characteristics of the threshing cylinder. The threshing cylinder model was imported into ANSYS Workbench for modal analysis and static analysis. As the performance index of the test was to improve the first natural frequency, the modal analysis verification only solved the first natural frequency and the corresponding modal shapes under the optimized constraint state.
In the process of static analysis, when the threshing cylinder works and rotates, it is mainly affected by the torque M transmitted by the engine to the threshing cylinder, the force F exerted by crops on the nail teeth, the gravity G of the threshing drum, and the supporting force FN at both ends of the bearing (ignoring the effect of air resistance and bearing friction), and the force is shown in Figure 4.
Among them, the optimized threshing cylinder mass was 123.26 kg, and then G = 1207.94 N; and FN = 603.97 N.
M = 9550 P n
where p is the threshing cylinder power, kW. The power of the threshing cylinder feeding is 8 kW/(kg/s). The combined harvester maximum feeding capacity is 4 kg/s, and then P = 32 kW. n is the threshing cylinder rotation rate, r/min; n = 1300 r/min. Then, M =235 N·m.
Due to the difference of the force F between the crop and the nail teeth in different areas under the condition of a uniform feeding rate, the force of rice grain and straw on the threshing cylinder cannot be measured directly by the instrument. The discrete element simulation software EDEM 2018 was used to simulate the force of rice grain and straw and the threshing cylinder in the threshing chamber. The force acting on the nail teeth was obtained by EDEM simulation, and then the force was loaded on the threshing cylinder.
Longjing 29, a rice variety widely cultivated in Northeast China, has an average grain size of 5.86 mm in length, 2.10 mm in width, and 2.14 mm in thickness. The average length of straw is 837 mm, and the diameter is 4.86 mm. The straw and grain were scanned using a Reeyee X5 three-dimensional laser scanner (Jiangsu Weibo), and the discrete element model was established by filling with a multi-sphere combination, as shown in Figure 5. Figure 5a is the filling model of a single grain, and Figure 5b is the filling model of intercepting part of straw.
To simulate different grain sizes and straw lengths, the size of the generated material was normally distributed around the size of the model. According to the relevant references [42,43], the virtual simulation parameters were set as shown in Table 5. To ensure the continuity of the virtual simulation, the fixed time step was set as 4.2 × 10⁻⁶ s, which is 10% of the Rayleigh time step. The total simulation time was 5 s, and the data auto-iteration save time was 0.01s. The EDEM discrete element method was used to simulate the force between crops and the threshing cylinder. Different forces were loaded on the nail teeth in ANSYS, and a rotation speed of 1300 r/min was applied to the threshing cylinder. The EDEM simulation of a threshing cylinder is shown in Figure 6.
The threshing cylinder bears the complex combined action of bending and torsion. With the rotation of the cylinder, the action of bending and torsion presents a certain period of alternation. Even though the maximum stress under static analysis is far less than the allowable stress of the material, fatigue failure or even sudden fracture still occurs under alternating action.
On the basis of static analysis, the “fatigue tool” module in ANSYS was used for analysis. In consideration of the sudden change of torque caused by the impact load caused by the uneven change of feeding amount during the rotating of the cylinder, the unstable load cycle adopted the “rain flow cycle calculation” [44]. The “fatigue coefficient” was set as 0.85, the “mean stress theory” was set as “morrow”, the “stress component” was set as “singed von mises”, the scale of “rainflow matrix” and “damage matrix” was 32 × 32, and the “infinite life” was set as 1 × 10⁶.

2.5.2. Comparative Analysis of Field Experiment

To further test the vibration characteristics of a threshing cylinder under field working conditions, the field experiment of a threshing cylinder of a fully fed rice combine harvester was carried out in Qing’an County, Suihua City, Heilongjiang Province in October 2020, and the vibration of the threshing cylinder before and after optimization was detected and analyzed, as shown in Figure 7. As the threshing cylinder is a rotating part, we were unable to directly measure the vibration characteristics during work. The severe vibration of the threshing cylinder is transmitted to other parts of the combine through the frame, and the vibration transmitted on the support in direct contact with the threshing cylinder can be collected to indirectly reflect its optimization effect [45].
Longjing 29 is a new rice variety. Its natural attributes include an average plant height of 837 mm, ear length of 160 mm, 1000 grain weight of 23.6 g, stem moisture content of 30.6%, grain moisture content of 16.2%, and yield of 8210.8 kg/hm2. The selected experimental field was flat. The forward distance of each test was 100 m, and 20 m was reserved in front of the test area to ensure that the harvester entered the threshing cylinder with a stable feeding rate (16.2 t/h) before each test. The 50-s test data in the test area were recorded by the signal acquisition instrument, and the sampling frequency was set at 2.56 khz. Each test was repeated three times.
Before each test, the machines and tools were cleaned, and the grain was unloaded to maintain the parameters of the working parts as unchanged and eliminate the interference of other factors. Measuring point A was arranged on the front support of the driving shaft of the threshing cylinder, and measuring point B was arranged on the rear support of the threshing cylinder. The INV9832-50 acceleration sensor (Beijing Dongfang Institute) was used to collect the vibration characteristics in the X (forward) direction, Y (left and right) directions, and Z (vertical) direction.

3. Results and Discussion

3.1. Threshing Cylinder Vibrational Characteristic Analysis

3.1.1. The Results of the Finite Element Free Modal Analysis

The free modal frequency and the corresponding modal shapes obtained using the Block Lanczos method are shown in Figure 8.
It can be seen from Figure 8 that the first-order modal shape was mainly characterized by the overall bending, and its maximum deformation occurred at the position of the first fixed plate and connected separating bar, with the maximum deformation of 7.91 mm. The position of the maximum deformation of the second-order modal shape was the same as that of the first mode. The third-order modal shape shows the bending of the separating bar and the deformation of the nail teeth.
As the relative size of the nail teeth was small, the maximum deformation was 4.67 mm. The maximum deformation of the fourth-order modal shape was 5.89 mm at the position of the second fixed plate and its connecting separating bar. The position of the maximum deformation of the fifth-order modal shape was the same as that of the fourth mode. The sixth-order modal shape was torsion.

3.1.2. Comparison between Free Modal Analysis and Free Modal Test

According to the MIMO modal test method, the results were compared with the results of the finite element free modal analysis, as shown in Table 6.
It can be seen from Table 6 that, compared with the free modal test, the modal shapes of the finite element free modal analysis were the same; however, there were certain errors between the modal frequencies, and the maximum error was 4.65%. The main reasons for the errors were as follows.
(1) When establishing the finite element model, the threshing cylinder was simplified to an extent, including ignoring certain connecting holes and chamfers, and approximating the whole part as a rigid connection, which is the main reason for the calculation frequency error;
(2) In the finite element free modal analysis, the size and quality of the mesh affects the results of the modal frequency. In the free mode test, the structure discretization, iterative calculation, signal acquisition, and processing also produced inevitable errors;
(3) The threshing cylinder was padded with a rubber block to ensure that the rigid body mode was less than 1/3 of the first elastic body mode, which is approximate to the free state but not absolutely the free state;
(4) The threshing cylinder had a large volume and complex structure, and the impact force of the hammer was relatively small, which led to a part of the energy transfer from the excitation point to the response point and serious attenuation. However, within the allowable error range, the established finite element parametric model was accurate and reliable, which laid the foundation for further finite element constrained modal analysis of the threshing cylinder.

3.1.3. The Results of the Finite Element Constrained Modal Analysis

On the basis of the established threshing cylinder finite element model, the rotational constraint of 1300 r/min was applied, and the natural frequencies of the sixth-order constraint mode and the corresponding modal shapes are shown in Figure 9.
It can be seen from the analysis in Figure 9 that the natural frequencies and modal shapes of the constrained mode and the free mode were different. The first-order modal shape was overall bending; the maximum deformation occurred at the position of the first fixed plate and its connecting separating bar, and the maximum deformation was 11.86 mm. The position of the maximum deformation of the second-order modal shape was the same as that of the first mode. The third-order modal shape showed the bending of the separating bar and the deformation of the nail teeth.
The fourth-order modal shape was overall bending. The results showed that there was a significant difference between the fifth-order constrained modal shape and the free modal shape, which was characterized by the overall bending. The maximum deformation occurred at the position of the second fixed plate and its connecting bar, and the maximum deformation was 12.70 mm. The sixth-order modal shape was torsion. The lower modal frequency and mode shape had the greatest influence on the structure. If resonance occurs, the separation bars and fixed plates should be considered the key optimization objects.

3.2. Resonance Analysis of Threshing Cylinder

The normal working speed of the threshing cylinder was 1300 r/min. According to Equation (15), the excitation frequency range was 21.67 Hz.
The excitation frequencies of the other rotating parts are shown in Table 7.
The engine was a vertical in-line four-cylinder four-stroke diesel engine with a rated speed of 2200–2400 r/min. According to Equation (16), the engine combustion excitation frequency was 73.33–80 Hz.
In addition, the engine crankshaft was symmetrically arranged, the first-order unbalanced inertial force did not exist, and the second-order inertial force was superimposed, as Q = 2. According to Equation (17), the excitation frequency of the inertial force was 73.33–80 Hz.
Compared with the natural frequency of the constraint mode and the frequency of the excitation source, the natural frequency corresponding to the first-order modal shapes of the threshing cylinder was close to its own rotation excitation frequency, which is prone to resonance. This resonance results in the overall bending of the threshing cylinder; therefore, it is necessary to optimize the structure to ensure its natural frequency is far away from the excitation frequency of its own rotation, thus, effectively avoiding resonance and reducing the impact of the vibration.

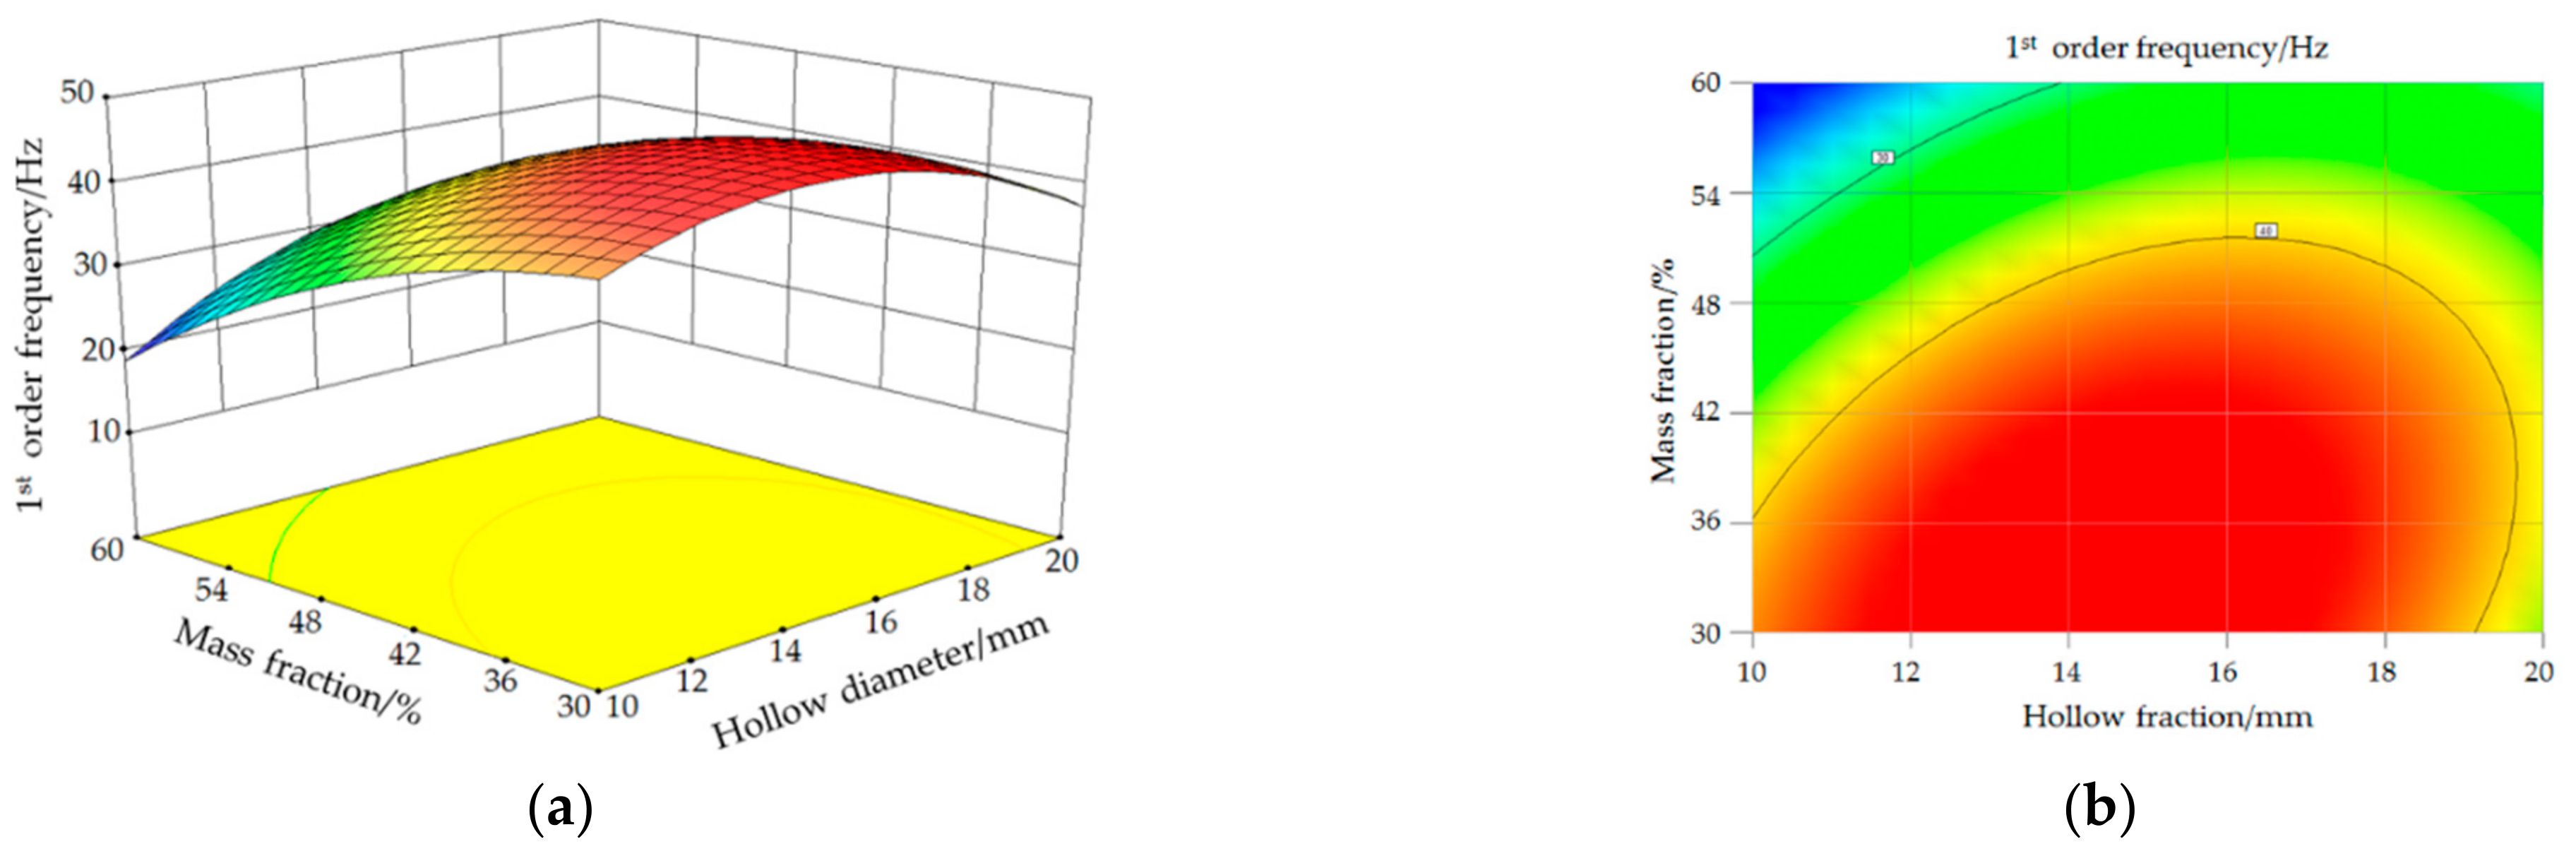
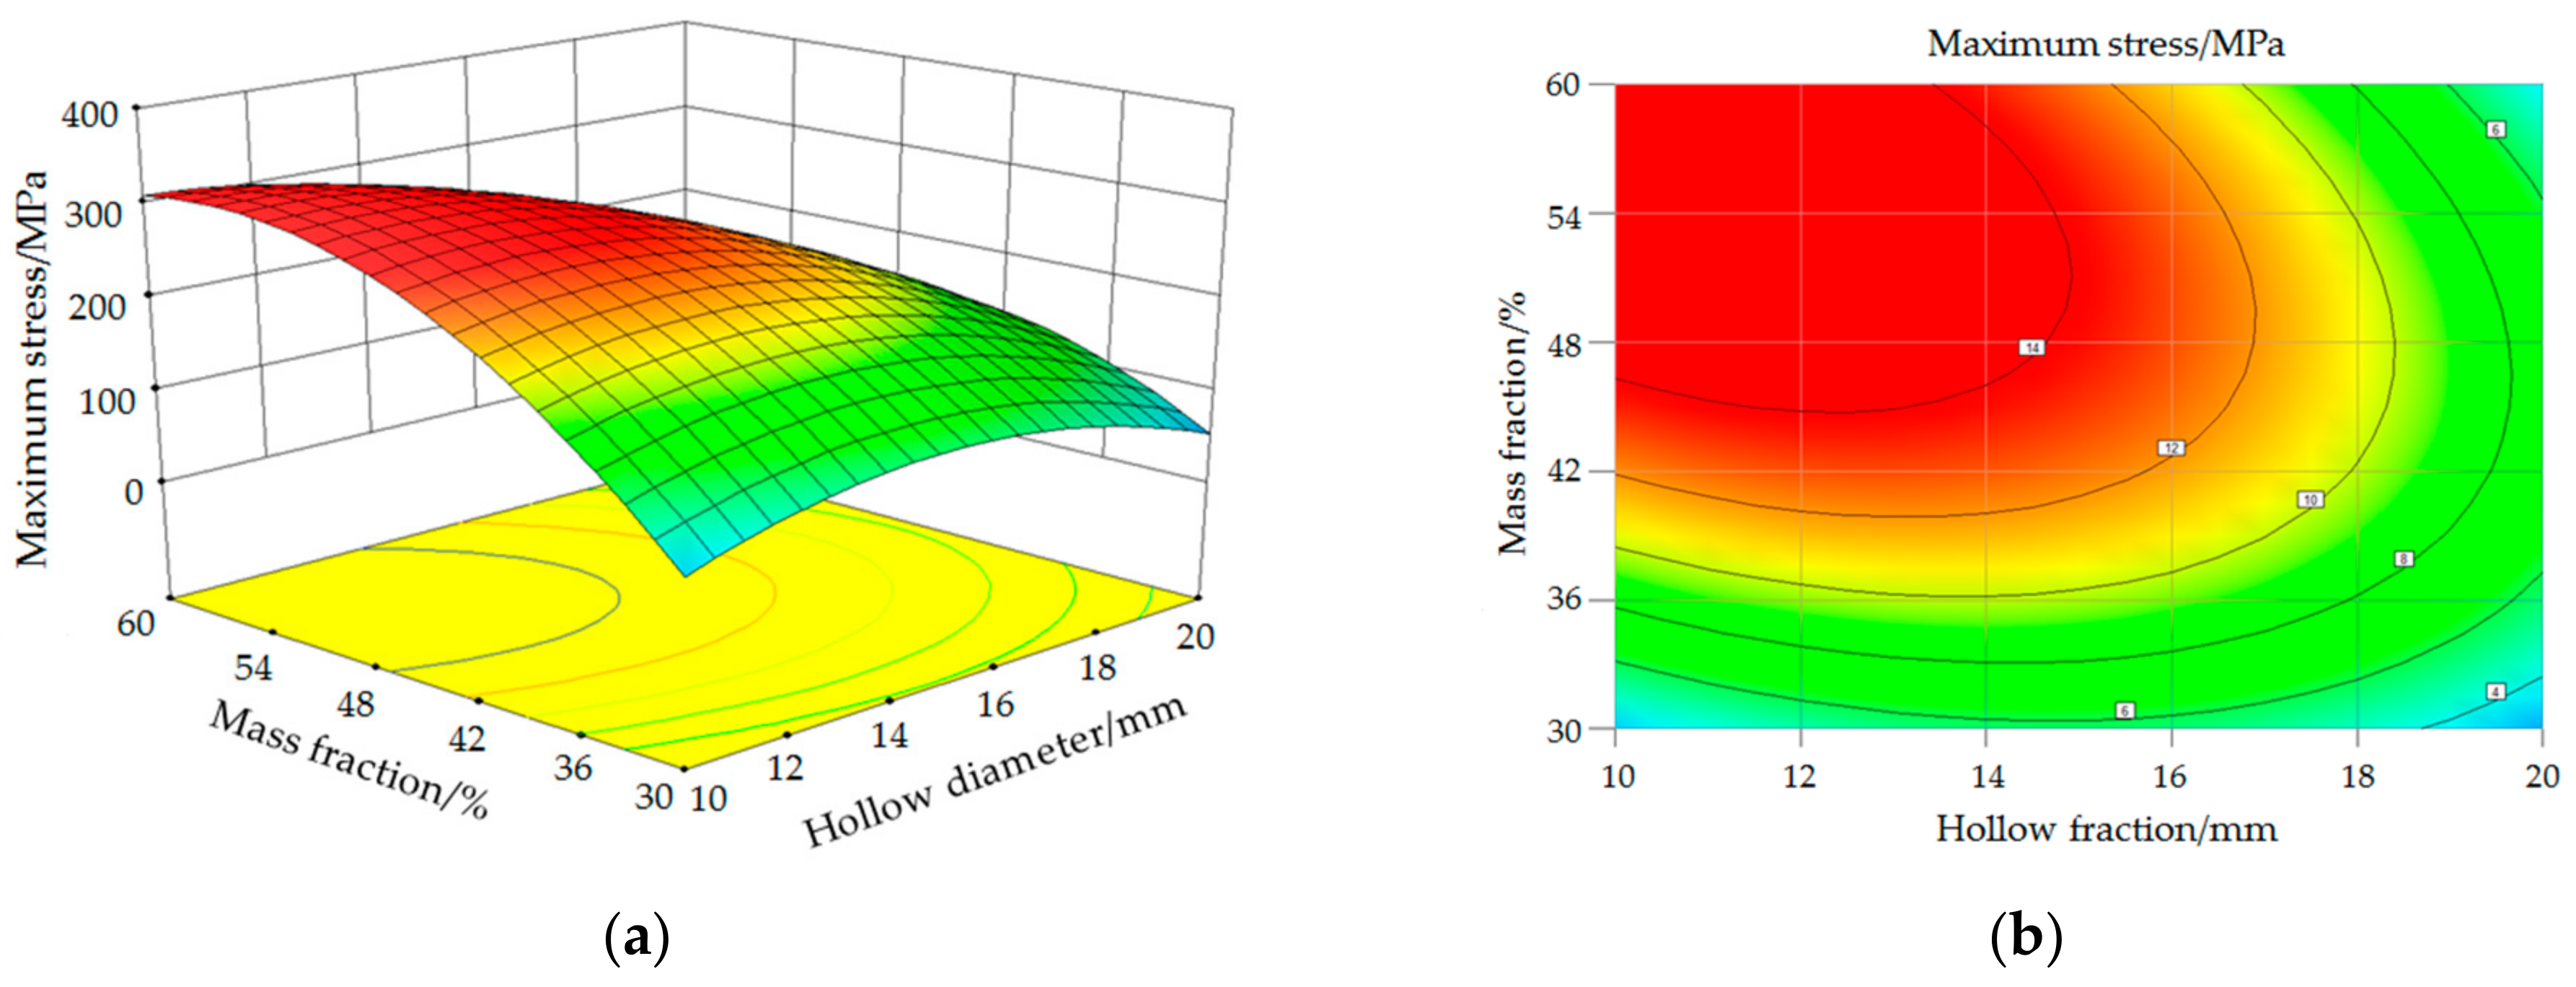
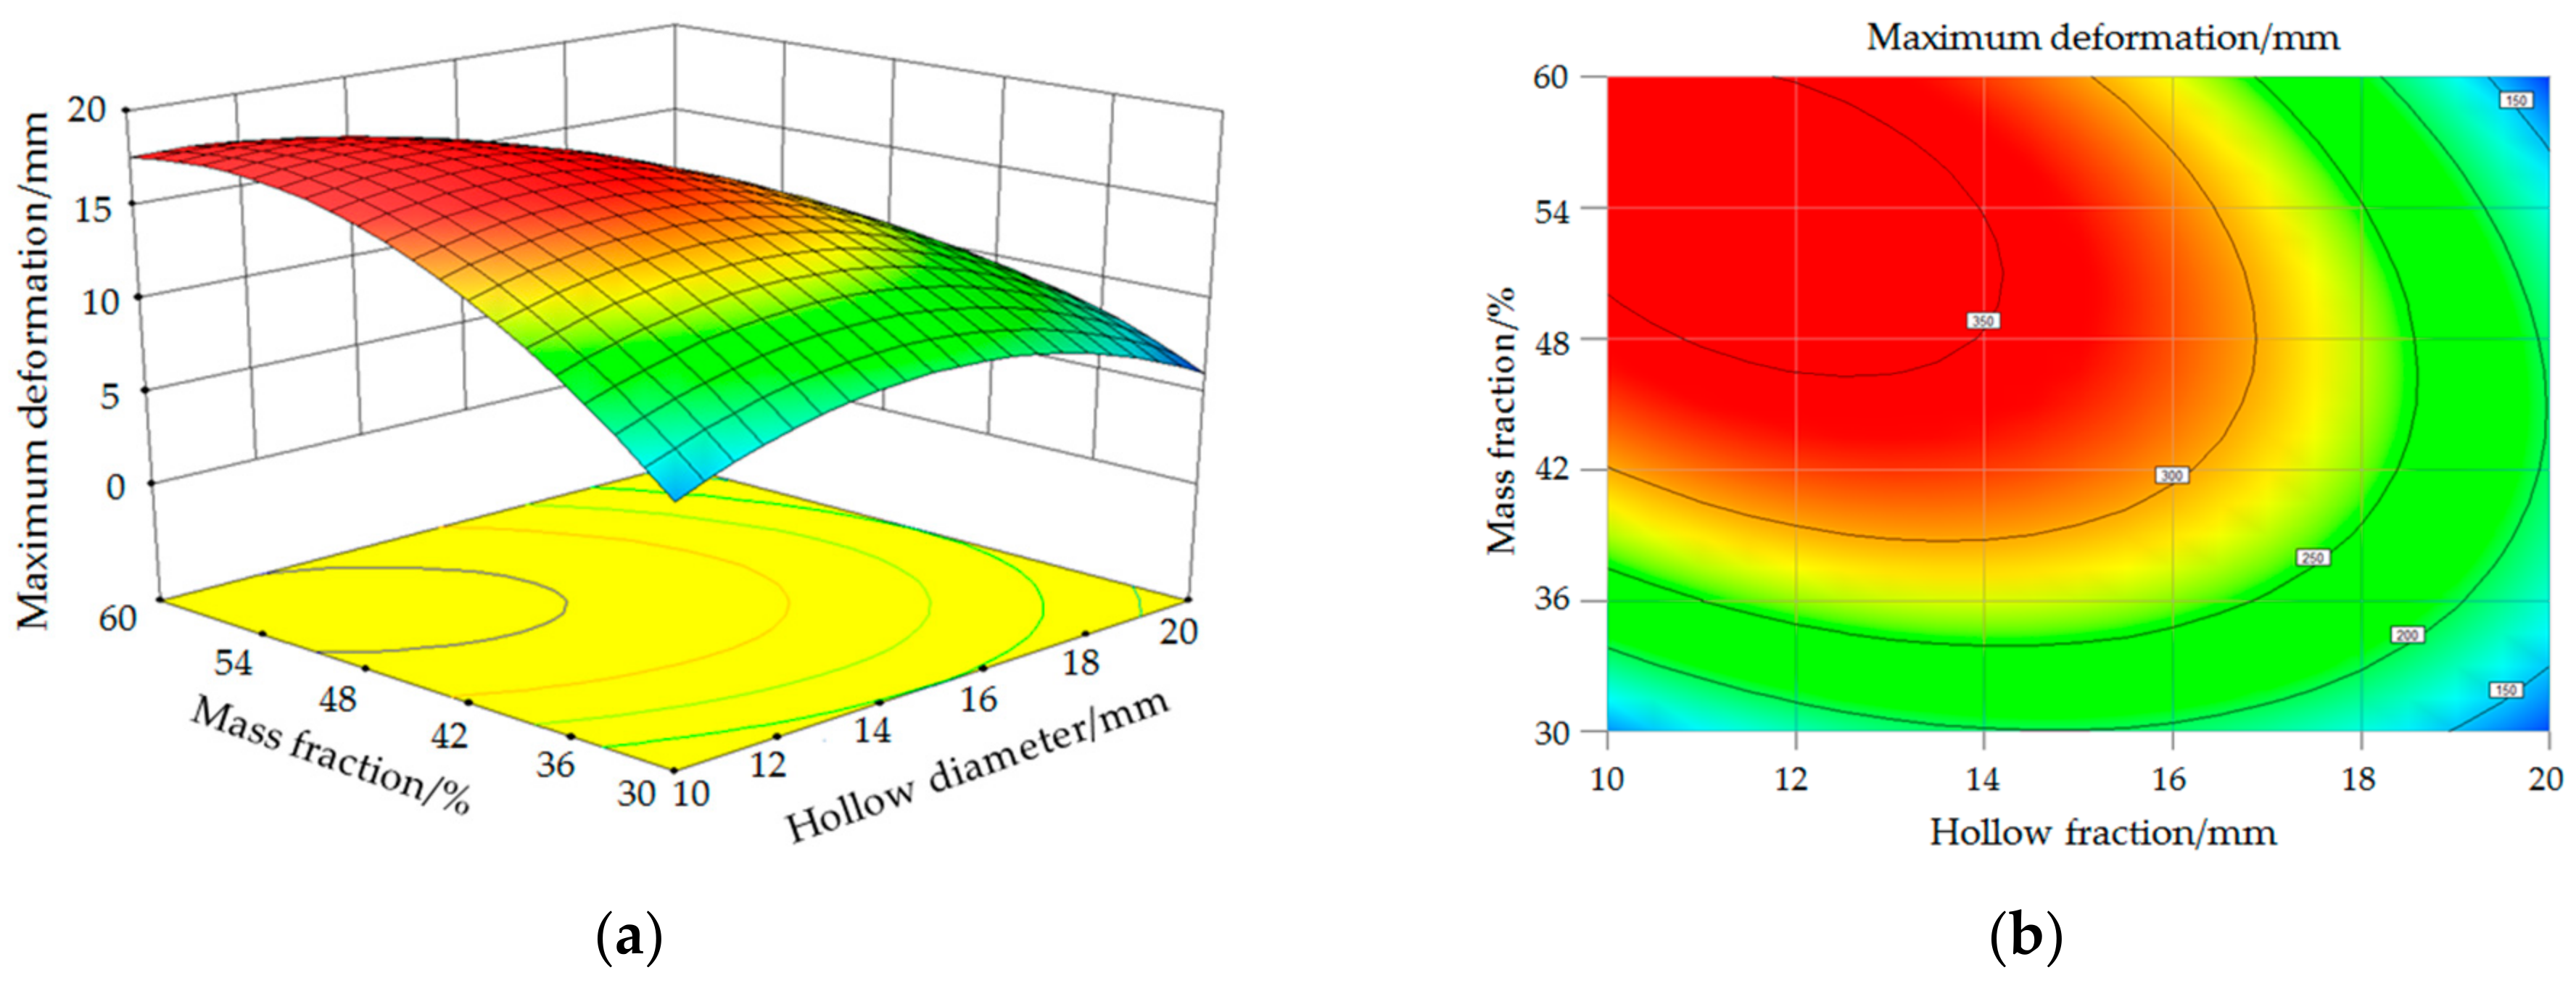
3.3. Analysis of the Results of Optimization Design

According to the level coding table of test factors in Table 4, the optimal state of the threshing cylinder fixed plate under different levels is shown in Figure 10.
The quadratic rotation orthogonal combination scheme was designed, and 16 groups of simulation tests were carried out using ANSYS Workbench. Each group of experiments was repeated three times. The average value of the three results was taken as the test result. Design Expert software was used to design the test scheme and analyze the results, as shown in Table 8.
The quadratic polynomial regression models of hollow diameter x1, mass fraction x2, first-order natural frequency y1, maximum stress y2, and maximum deformation y3 were established, respectively. The regression equation is shown in Equation (19).
y 1 = 43.77 + 1.76 x 1 7.55 x 2 + 3.92 x 1 x 2 7.14 x 1 2 4.63 x 2 2 y 2 = 330.19 62.31 x 1 + 52.23 x 2 54.40 x 1 x 2 69.16 x 1 2 78.85 x 2 2 y 3 = 13.27 3.05 x 1 + 3.36 x 2 2.82 x 1 x 2 2.82 x 1 2 4.19 x 2 2 .
The analysis of variance of the test results is shown in Table 9. The results showed that the regression equation model of the first natural frequency, maximum stress, and maximum deformation were p < 0.0001, which indicates that the three regression equation models were significant, and the fitting degree of the regression model was good in the test range.
To intuitively analyze the relationship between the test indexes and factors, the corresponding response surface and contour map were obtained using Design Expert software, as shown in Figure 11, Figure 12 and Figure 13. The response surface and contour map of the influence of the hollow diameter and mass fraction (representing the mass fraction of the removed optimization region) on the first-order natural frequency are shown in Figure 11.
The first natural frequency first increased, then decreased with the increase in the hollow diameter of the separating bar, and then decreased with the increase in the mass fraction of the fixed plates. The response surface changed quickly along the direction of the mass fraction of the fixed plates and changed relatively slowly along the direction of the separating bar. The results show that the influence of the mass fraction of the fixed plates on the first natural frequency was more significant than that of the hollow diameter.
The response surface and contour map of the influence of the hollow diameter and mass fraction on the maximum stress are shown in Figure 12. The maximum stress of the material represents the strength of the threshing cylinder. The maximum stress increased with the increase in the mass fraction of the fixed plates and the hollow diameter of the separating bar. The response surface changed quickly along the direction of the mass fraction of the fixed plates and changed relatively slowly along the direction of the separating bar. The results show that the influence of mass fraction of fixed plates on the strength was more significant than that of the hollow diameter.
The response surface and contour map of the influence of the hollow diameter and mass fraction on the maximum deformation are shown in Figure 13. The maximum deformation of the material represents the stiffness of the threshing cylinder. The maximum deformation increased with the increase in the mass fraction of the fixed plates and the hollow diameter of the separating bar. The response surface changed quickly along the direction of the mass fraction of the fixed plates and changed relatively slowly along the direction of the separating bar. The results show that the influence of the mass fraction of fixed plates on the stiffness was more significant compared with the hollow diameter.

3.4. Analysis of Results of Threshing Cylinder Characteristics after Optimization

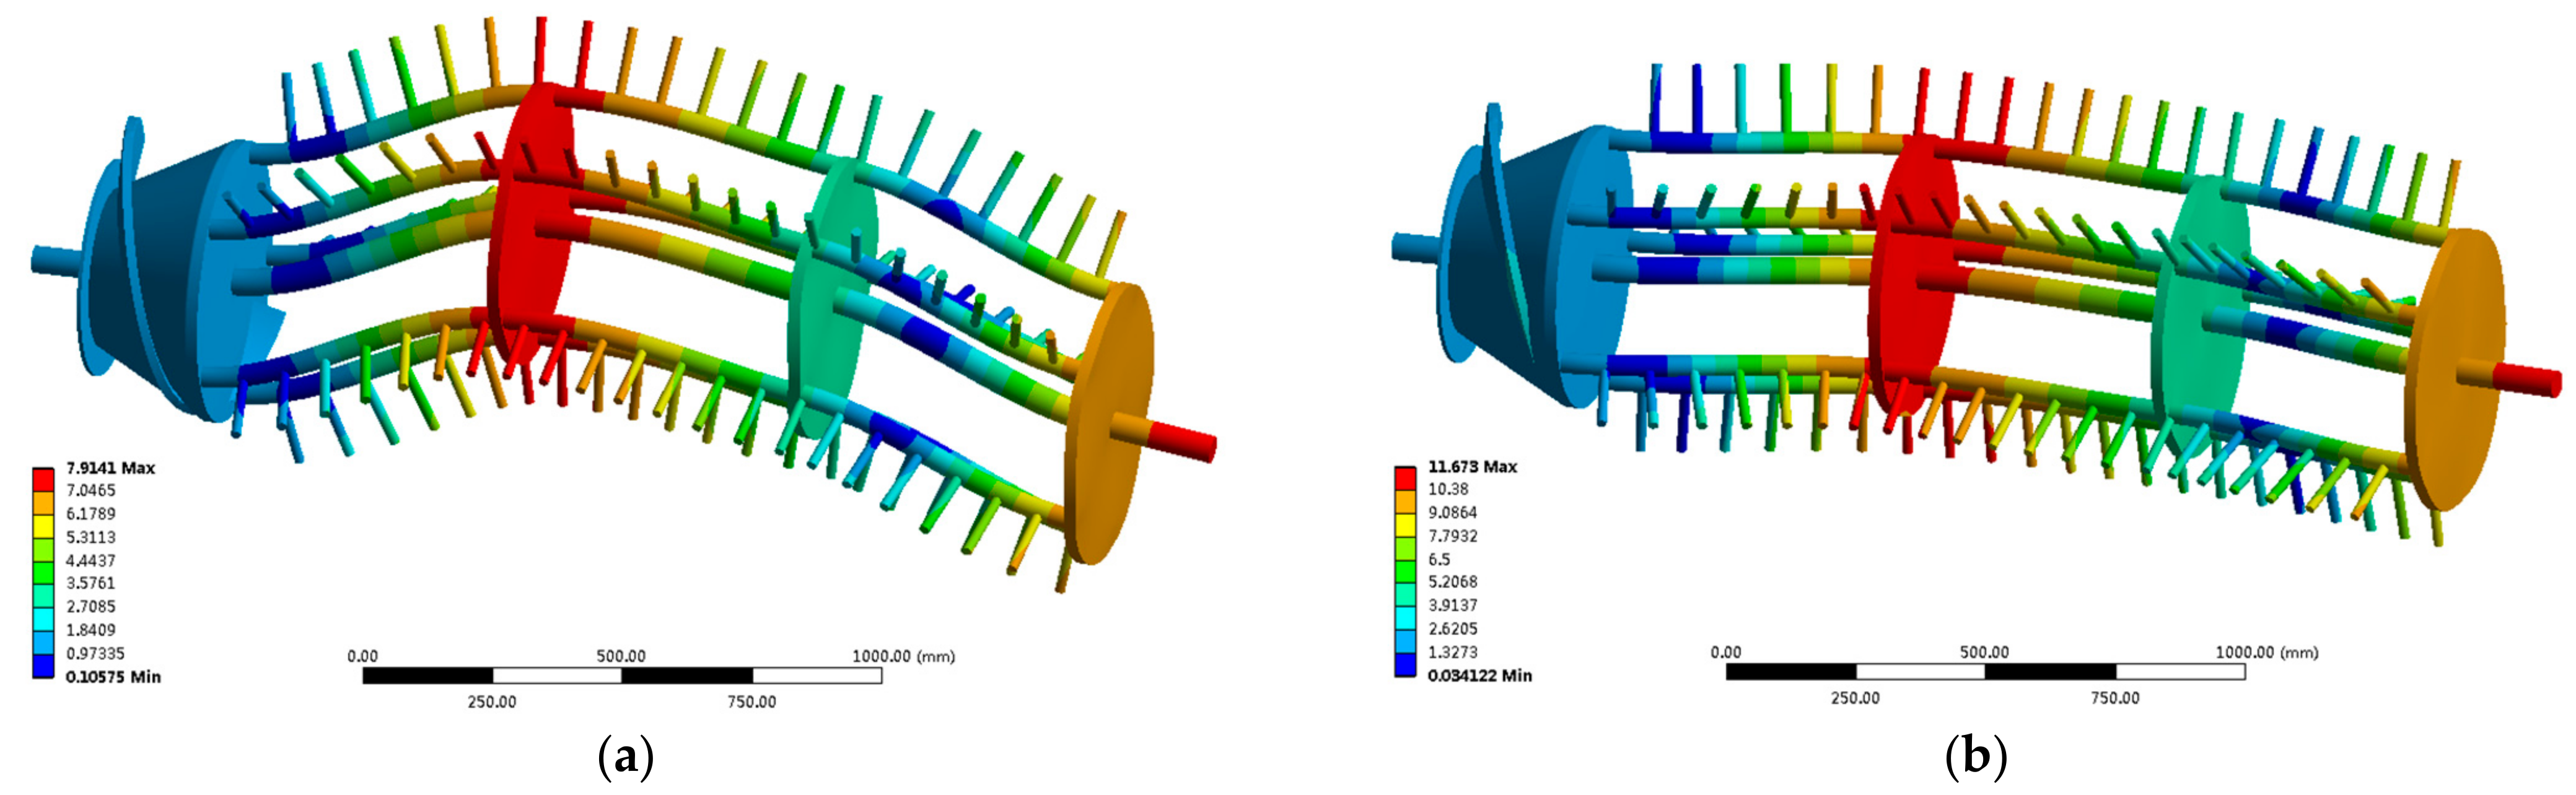
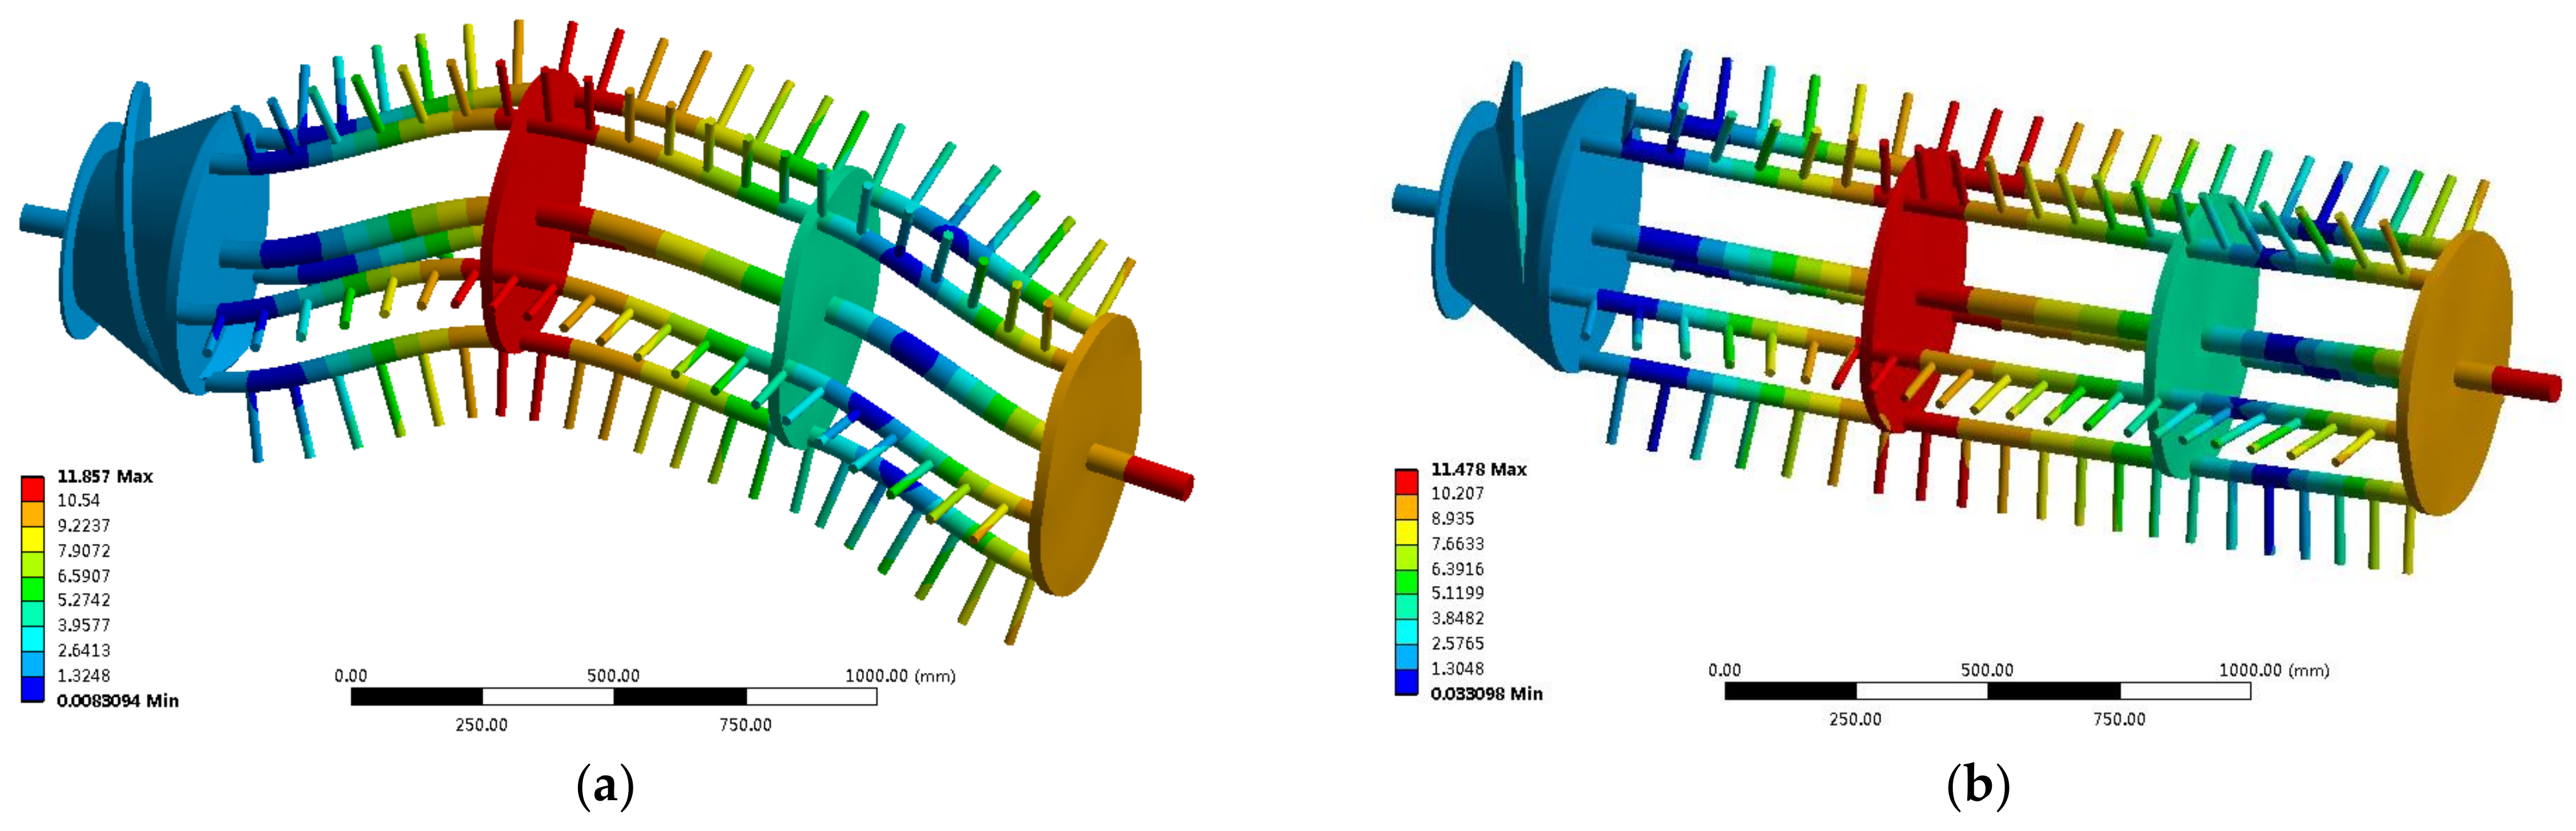
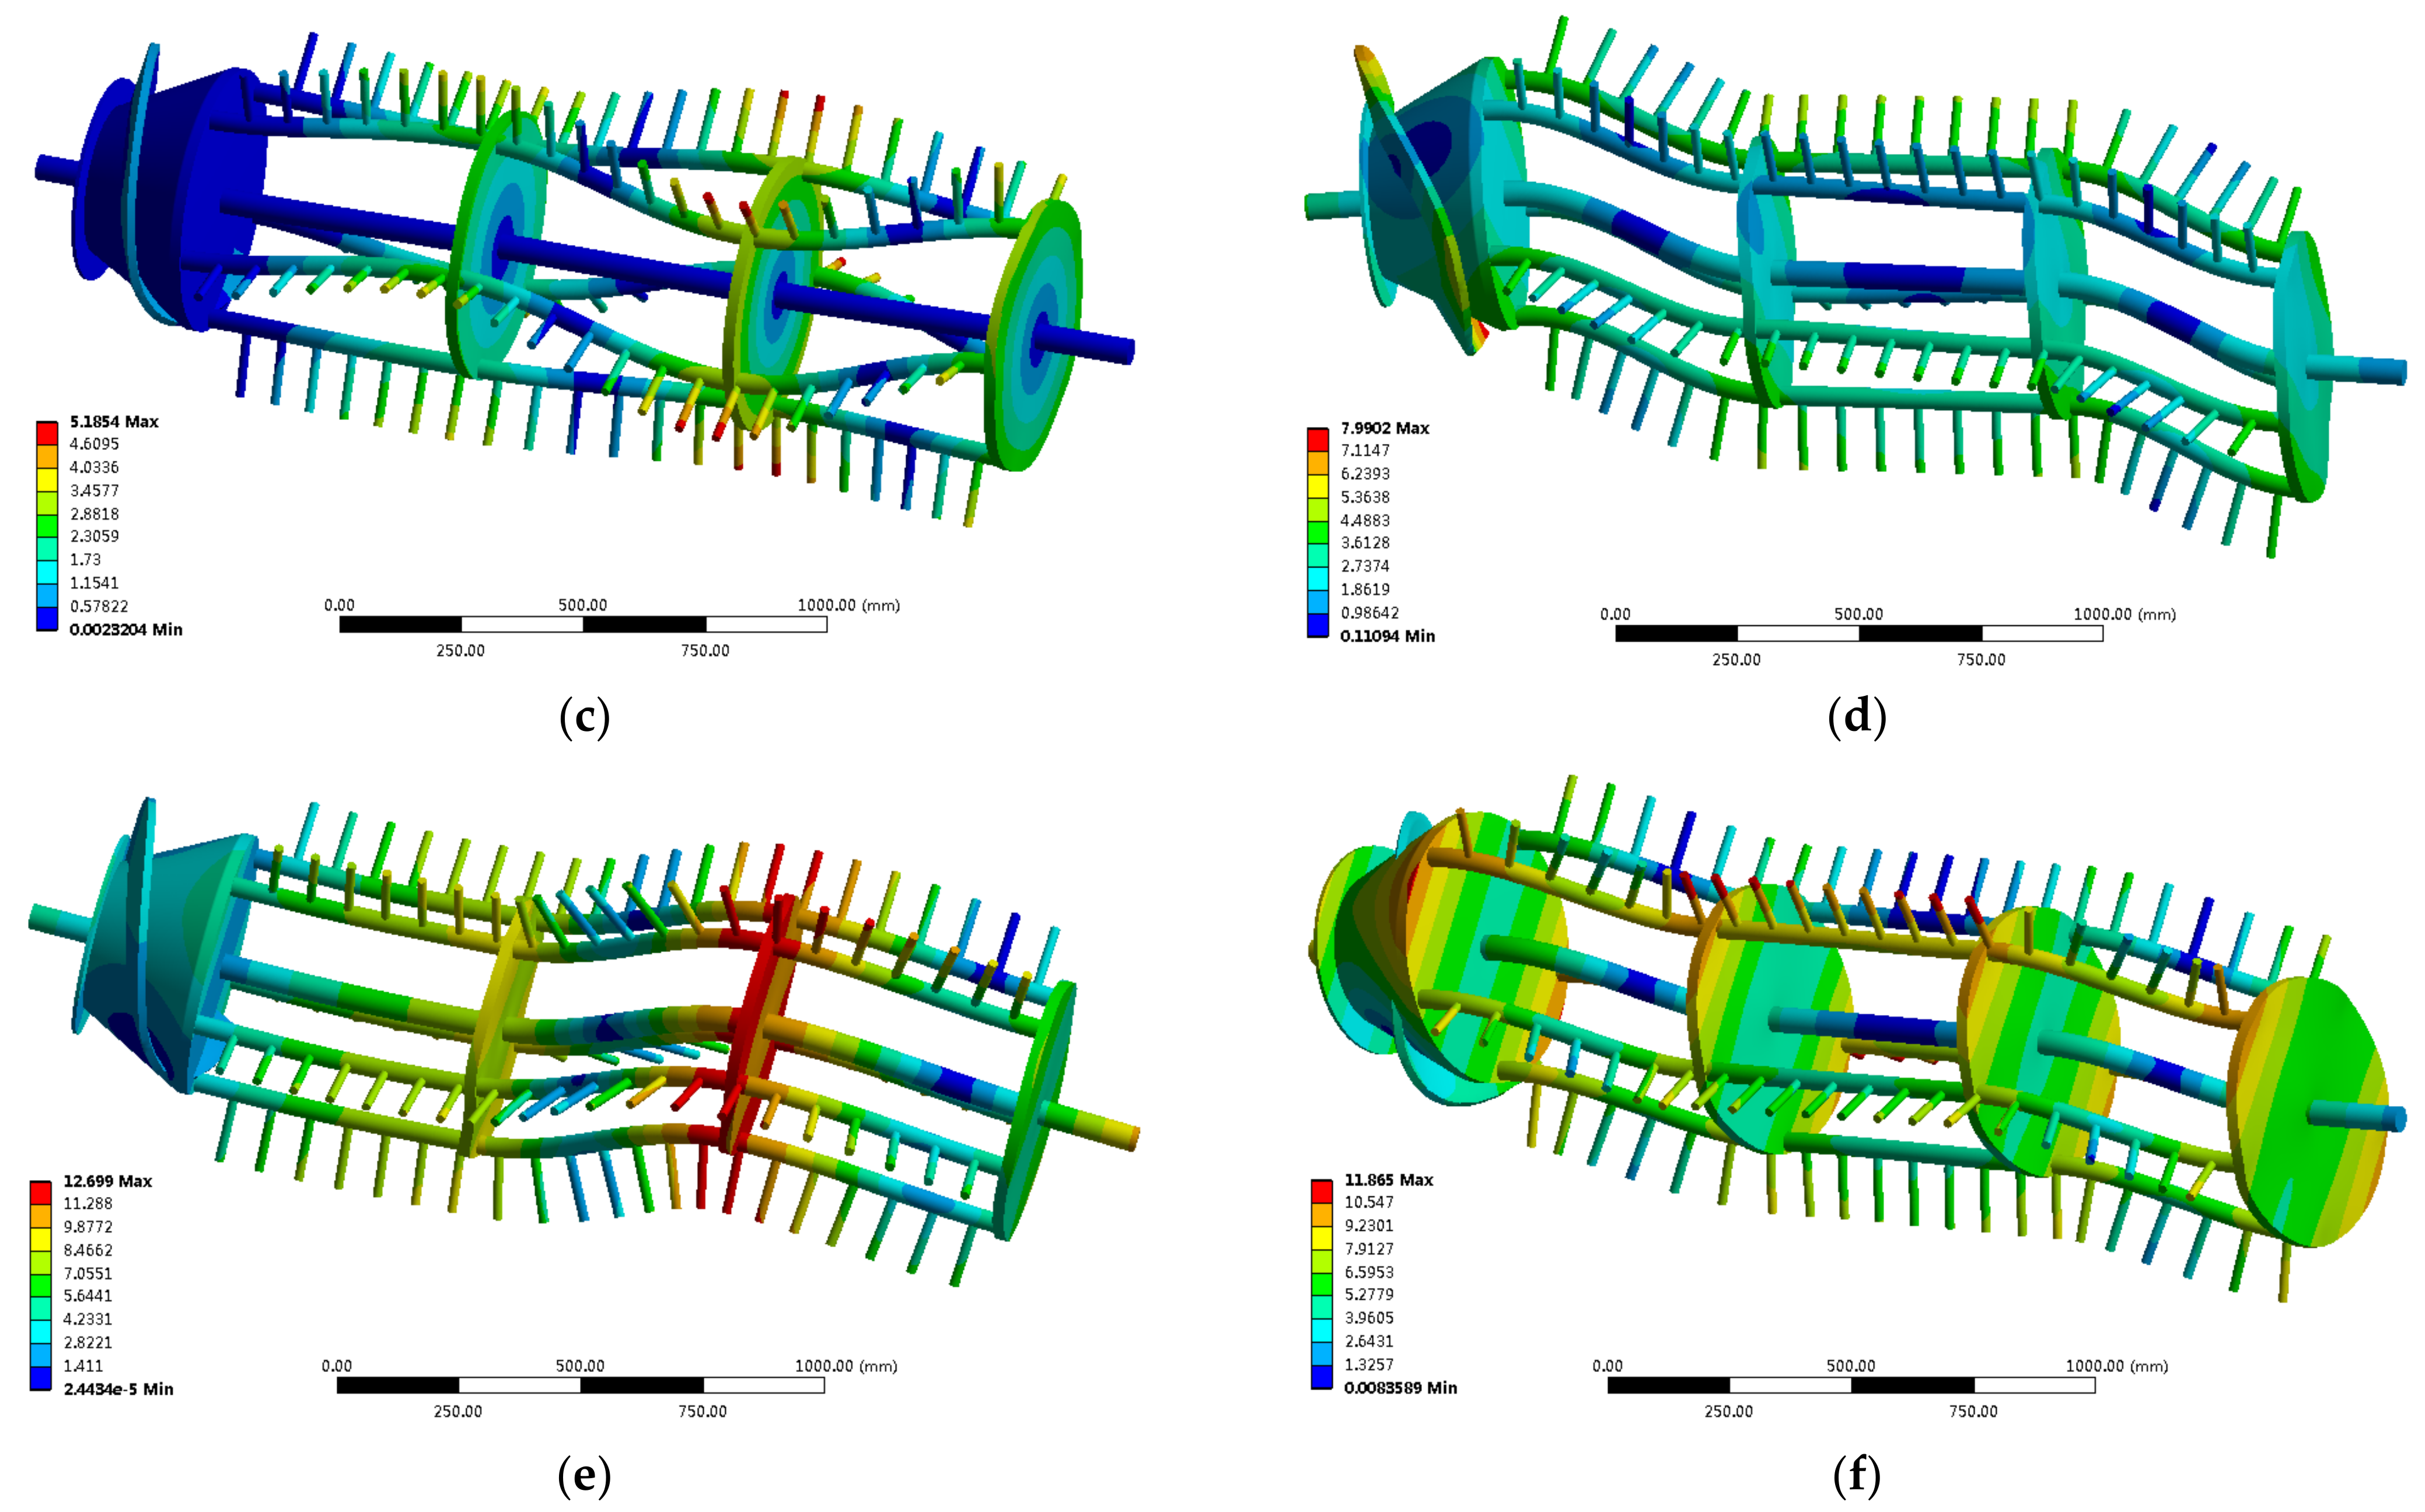
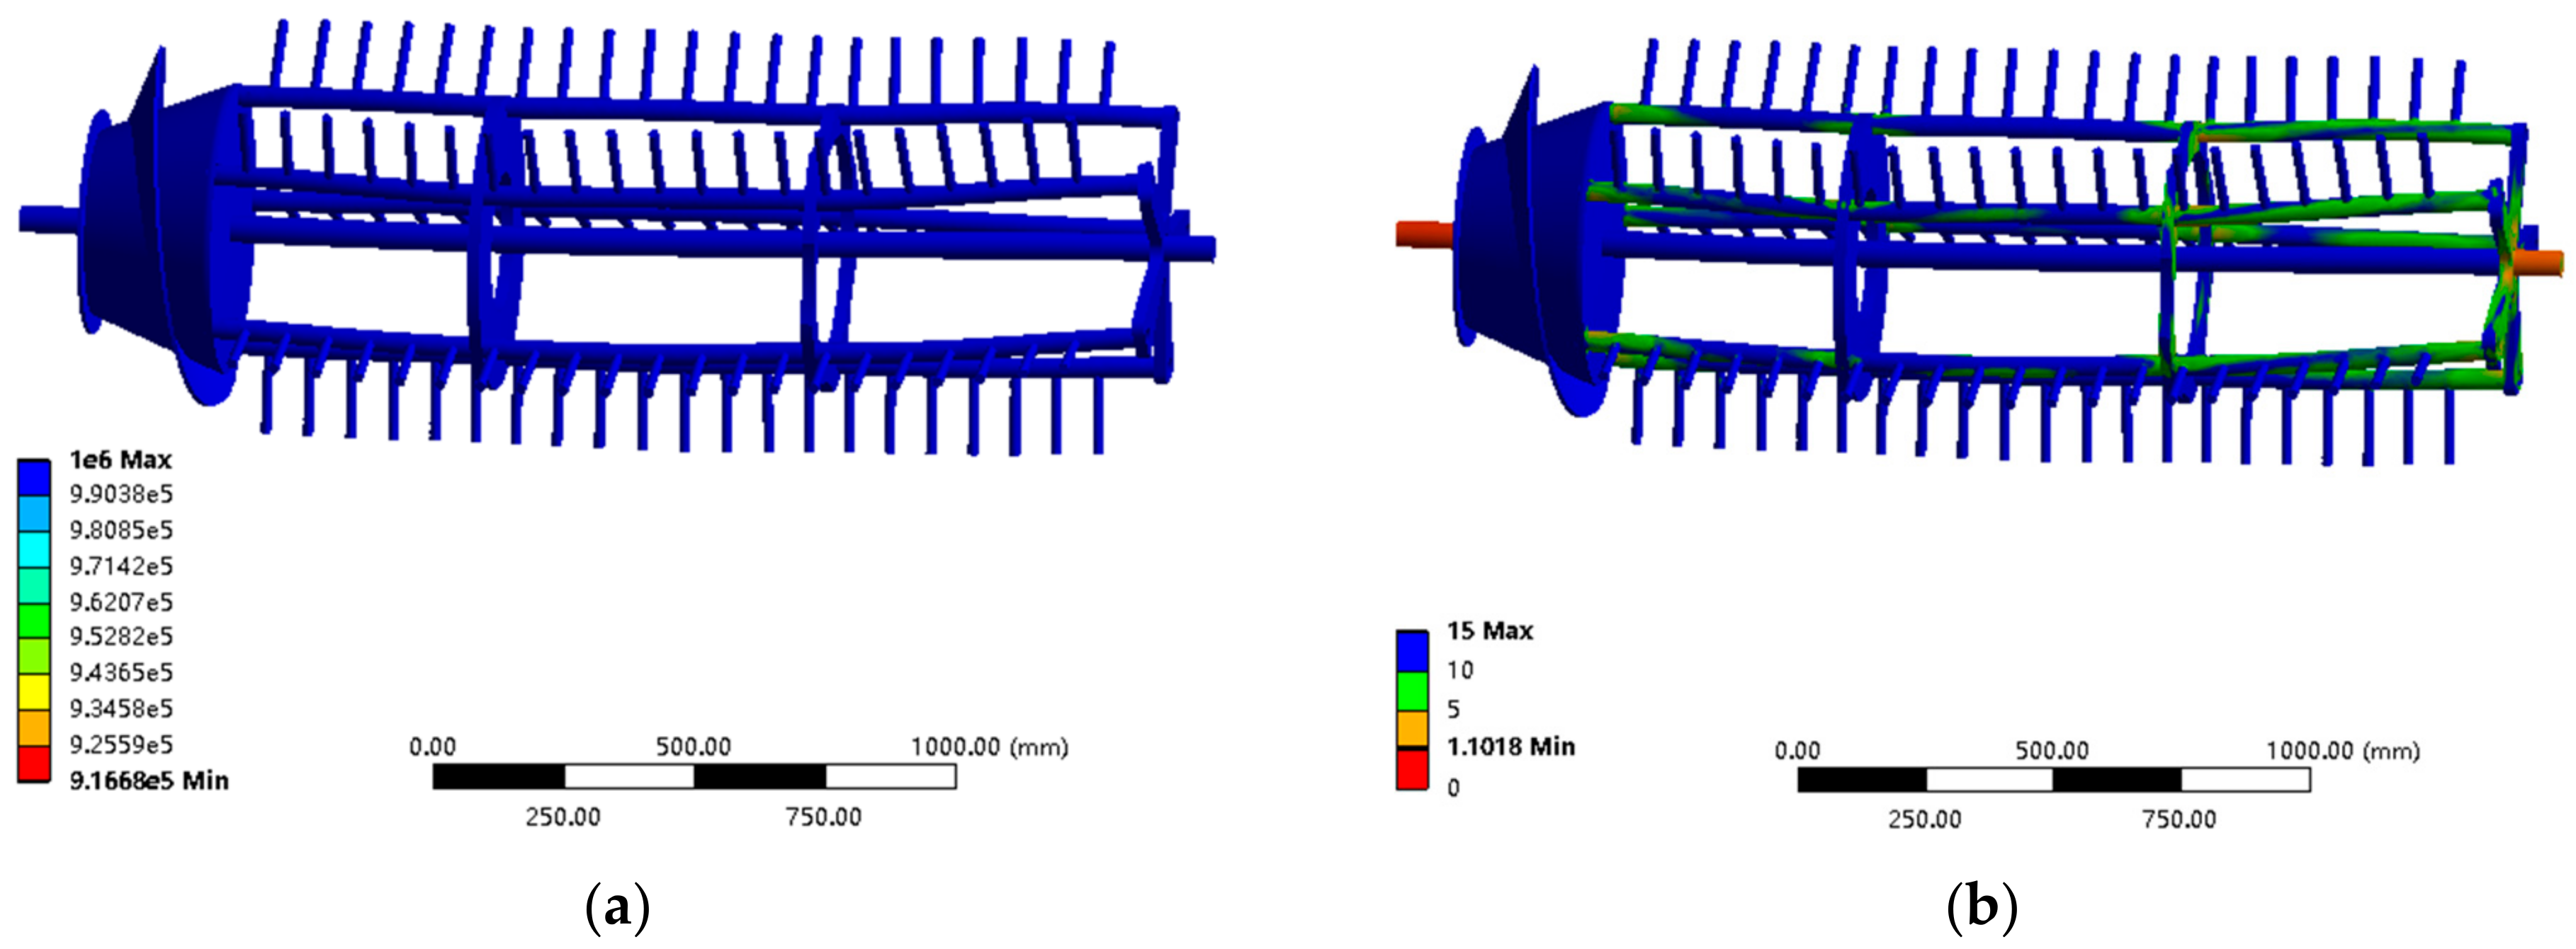
3.4.1. Finite Element Analysis Results of Threshing Cylinder after Optimization

To improve the first-order natural frequency of the threshing cylinder, the best combination of hollow diameter of separating bar and mass fraction of fixed plates was explored, and the test factors were optimized. The test factors and performance indexes should meet certain conditions, and the hollow diameter and mass fraction should be maximized within the optimization range to reduce the overall mass and lighten the threshing cylinder.
The first-order natural frequency of the threshing cylinder should be maximized so that it is far away from the excitation frequency of its own rotation and less than the excitation frequency of the engine to avoid resonance. In addition, the maximum stress should be minimized and less than the allowable stress of Q235 A structural steel to meet the strength requirements. The maximum deformation should be minimized and less than the threshing clearance to meet the stiffness requirements. The parameterized mathematical model was established as follows:
max y 1 min y 2 min y 3 s . t max x 1 max x 2 8   mm x 1 22   mm 23.8 % x 2 66.2 % 21.67   Hz < y 1 < 36.67   Hz 0 < y 2 < 235   MPa 0 < y 3 < 10   mm .
The multi-objective parameter optimization module of the Design Expert data analysis software was used to optimize the mathematical model. The results showed that the optimal combination of parameters was as follows: The hollow diameter of the separating bar was 22 mm, the mass fraction of the fixed plate was 57.62%, the first natural frequency predicted by the model was 28.23 Hz, the maximum stress was 70.22 MPa, and the maximum deformation was 1.93 mm.
To balance the inertia force in the process of rotation, the optimized key parts must be symmetrical with the rotation center of the threshing cylinder. At the same time, to reduce the stress concentration and facilitate processing, the optimized threshing drum model was reconstructed. MATLAB software was used for the image noise, gray, and binary processing to extract the contour curve of the remaining material after the optimization of the fixed plate, and the least squares method was used to fit the curve [46] to realize an accurate reconstruction of the model.
The hollow diameter of the separating bar was 22 mm. The middle parts of the first fixed plate and the second fixed plate were simplified as 261- and 430-mm circles, respectively, and the middle part of the mounting hole of the second fixed plate was a 210-mm arc. Taking the rotation center of the third fixed plate as the origin, the coordinates were established, and five conic curves with contour y = 0.0082 x 2 + 57 were evenly distributed, as shown in Figure 14.
To verify the vibration characteristics, strength, and stiffness of the reconstructed threshing cylinder, modal analysis and static analysis were carried out as shown in Figure 15.
It can be seen from Figure 15 that the maximum deformation of the first-order modal shapes of the threshing cylinder was after reconstruction occurred at the tail of the separating bar. The maximum deformation at resonance was 0.16 mm, and the corresponding first natural frequency was 26.06 Hz. This is far away from the self-rotating excitation frequency that can effectively avoid resonance. The maximum stress was 57.61 Mpa, which is far less than the allowable stress and can effectively meet the strength requirements. The maximum deformation was 2.68 mm, which appeared in the middle of the nail teeth and met the stiffness requirements.
In addition, the overall weight of the threshing cylinder was reduced from 168.82 to 123.26 kg, realizing a lightweight design. The maximum stress and deformation of the reconstructed threshing cylinder were different from the predicted values. Due to the consideration of the dynamic balance state of the threshing cylinder during rotation, the feasibility of the machining process and the avoidance of the stress concentration, the middle parts of the first fixed plate and the second fixed plate were simplified as circles of different sizes.
To avoid the fatigue failure of the reconstructed threshing cylinder under the action of repeated alternating stress, fatigue analysis of the reconstructed threshing cylinder was carried out, as shown in Figure 16.
According to the analysis of Figure 16a, the minimum life of the reconstructed threshing cylinder was 9.17 × 10⁶ cycles, and the fatigue fracture did not occur in the optimized area first. According to the analysis of Figure 16b, the most vulnerable part of the threshing cylinder was the end of threshing cylinder shaft, and the minimum safety factor was 1.1; therefore, the overall design was safe. In conclusion, the reconstructed threshing cylinder met the design requirements.
For the structural vibration reduction optimization research, vibration isolation devices, such as vibration isolators, were often used to block the vibration transmission of the excitation source [47,48], or attachments were added to the rotating parts to balance the inertial force to reduce the impact of vibration [49]; alternatively, the structural form of the excitation source was changed to make its natural frequency far away from the excitation frequency range, to avoid resonance [50].
In addition to using the combination of size optimization and topology optimization to optimize the threshing cylinder and change the natural frequency to reduce the impact of resonance, the rotation speed of the threshing cylinder can also be changed to change the rotating excitation frequency so that it is far away from the natural frequency of the structure and resonance can be avoided. However, the rotation speed of the threshing cylinder should match the feeding rate and engine power. When the feed rate was small and the rotation speed of threshing cylinder was high, the impact of nail teeth on the grain was intensified and the grain breakage rate increased.
When the feed rate was large and the rotation speed of the threshing cylinder was small, there was no sufficient impact and rubbing between grains and grains or grains and nail teeth, which led to more undeleted panicle entrainment in the stalk and out of the machine, resulting in greater entrainment loss and also increasing the load of the cleaning system [51]. Therefore, to reduce the impact of resonance by changing the rotation speed of the threshing cylinder, we must weigh the influence of various factors, and we cannot ignore the working performance of a combine harvester to reduce the vibration.
In the later stage, the matching relationship between the rotation speed of the threshing cylinder and the feed rate were explored, and the material movement law in the threshing system under different rotation conditions and the influence on crushing rate, impurity content, entrainment loss, and cleaning loss are discussed. Based on the above research, we can also develop high-precision cleaning loss and entrainment loss monitoring sensors, which can provide a reliable theoretical basis for the development of a large-scale, efficient, and intelligent threshing system.

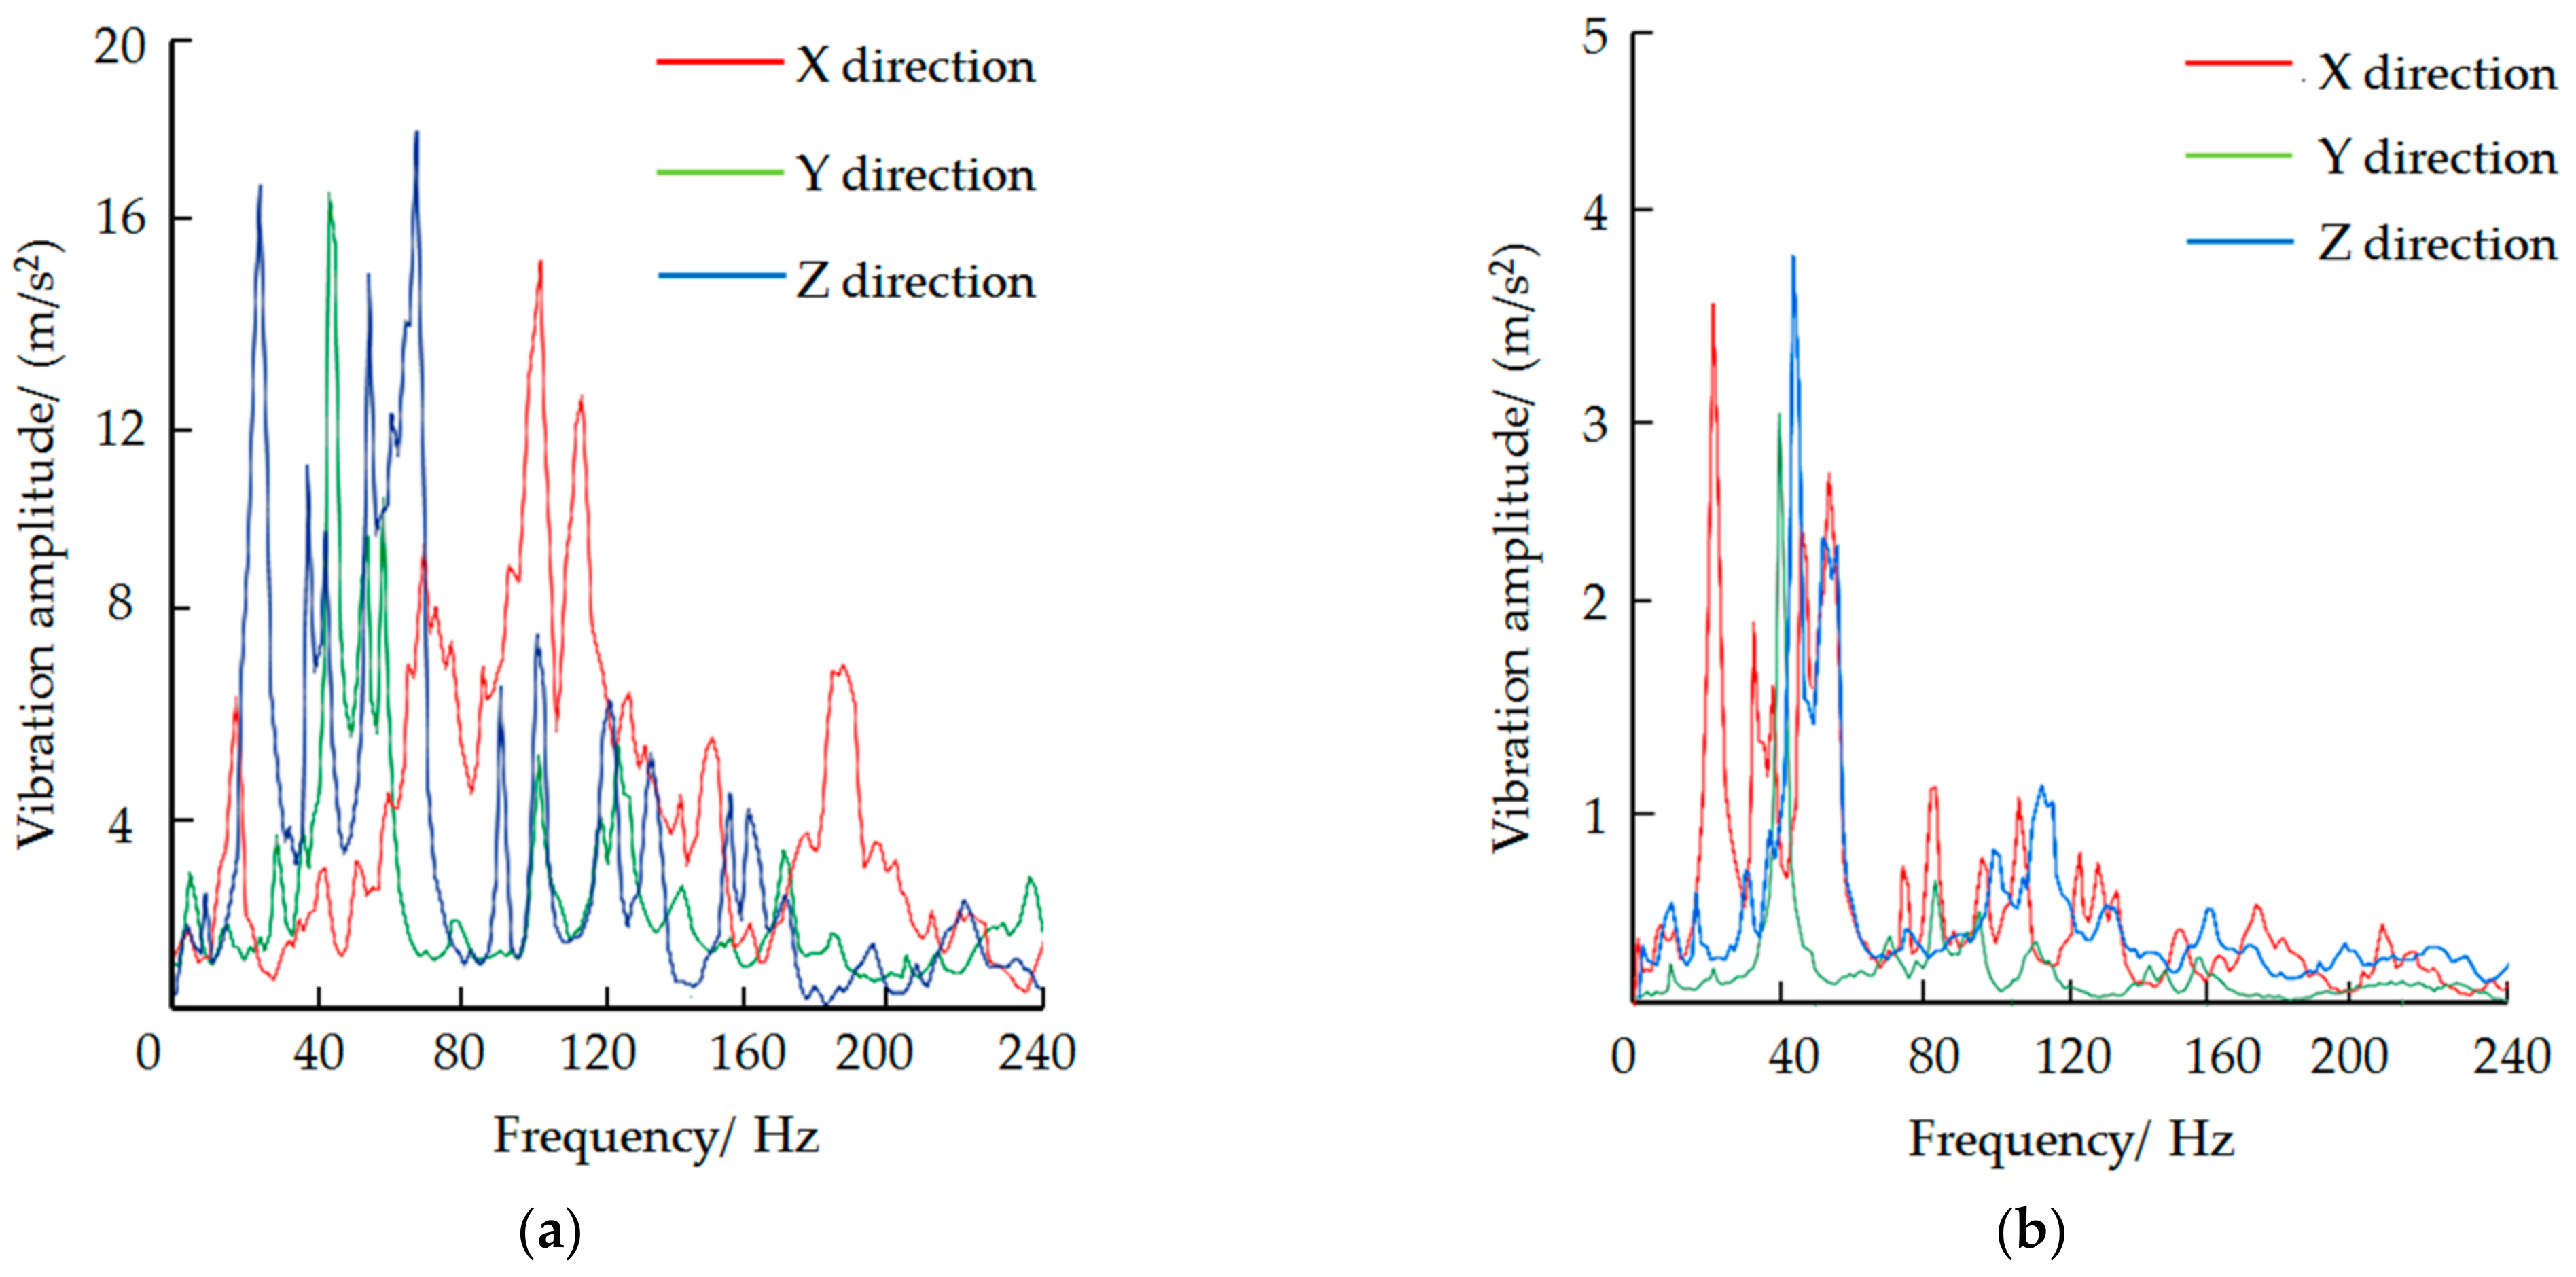
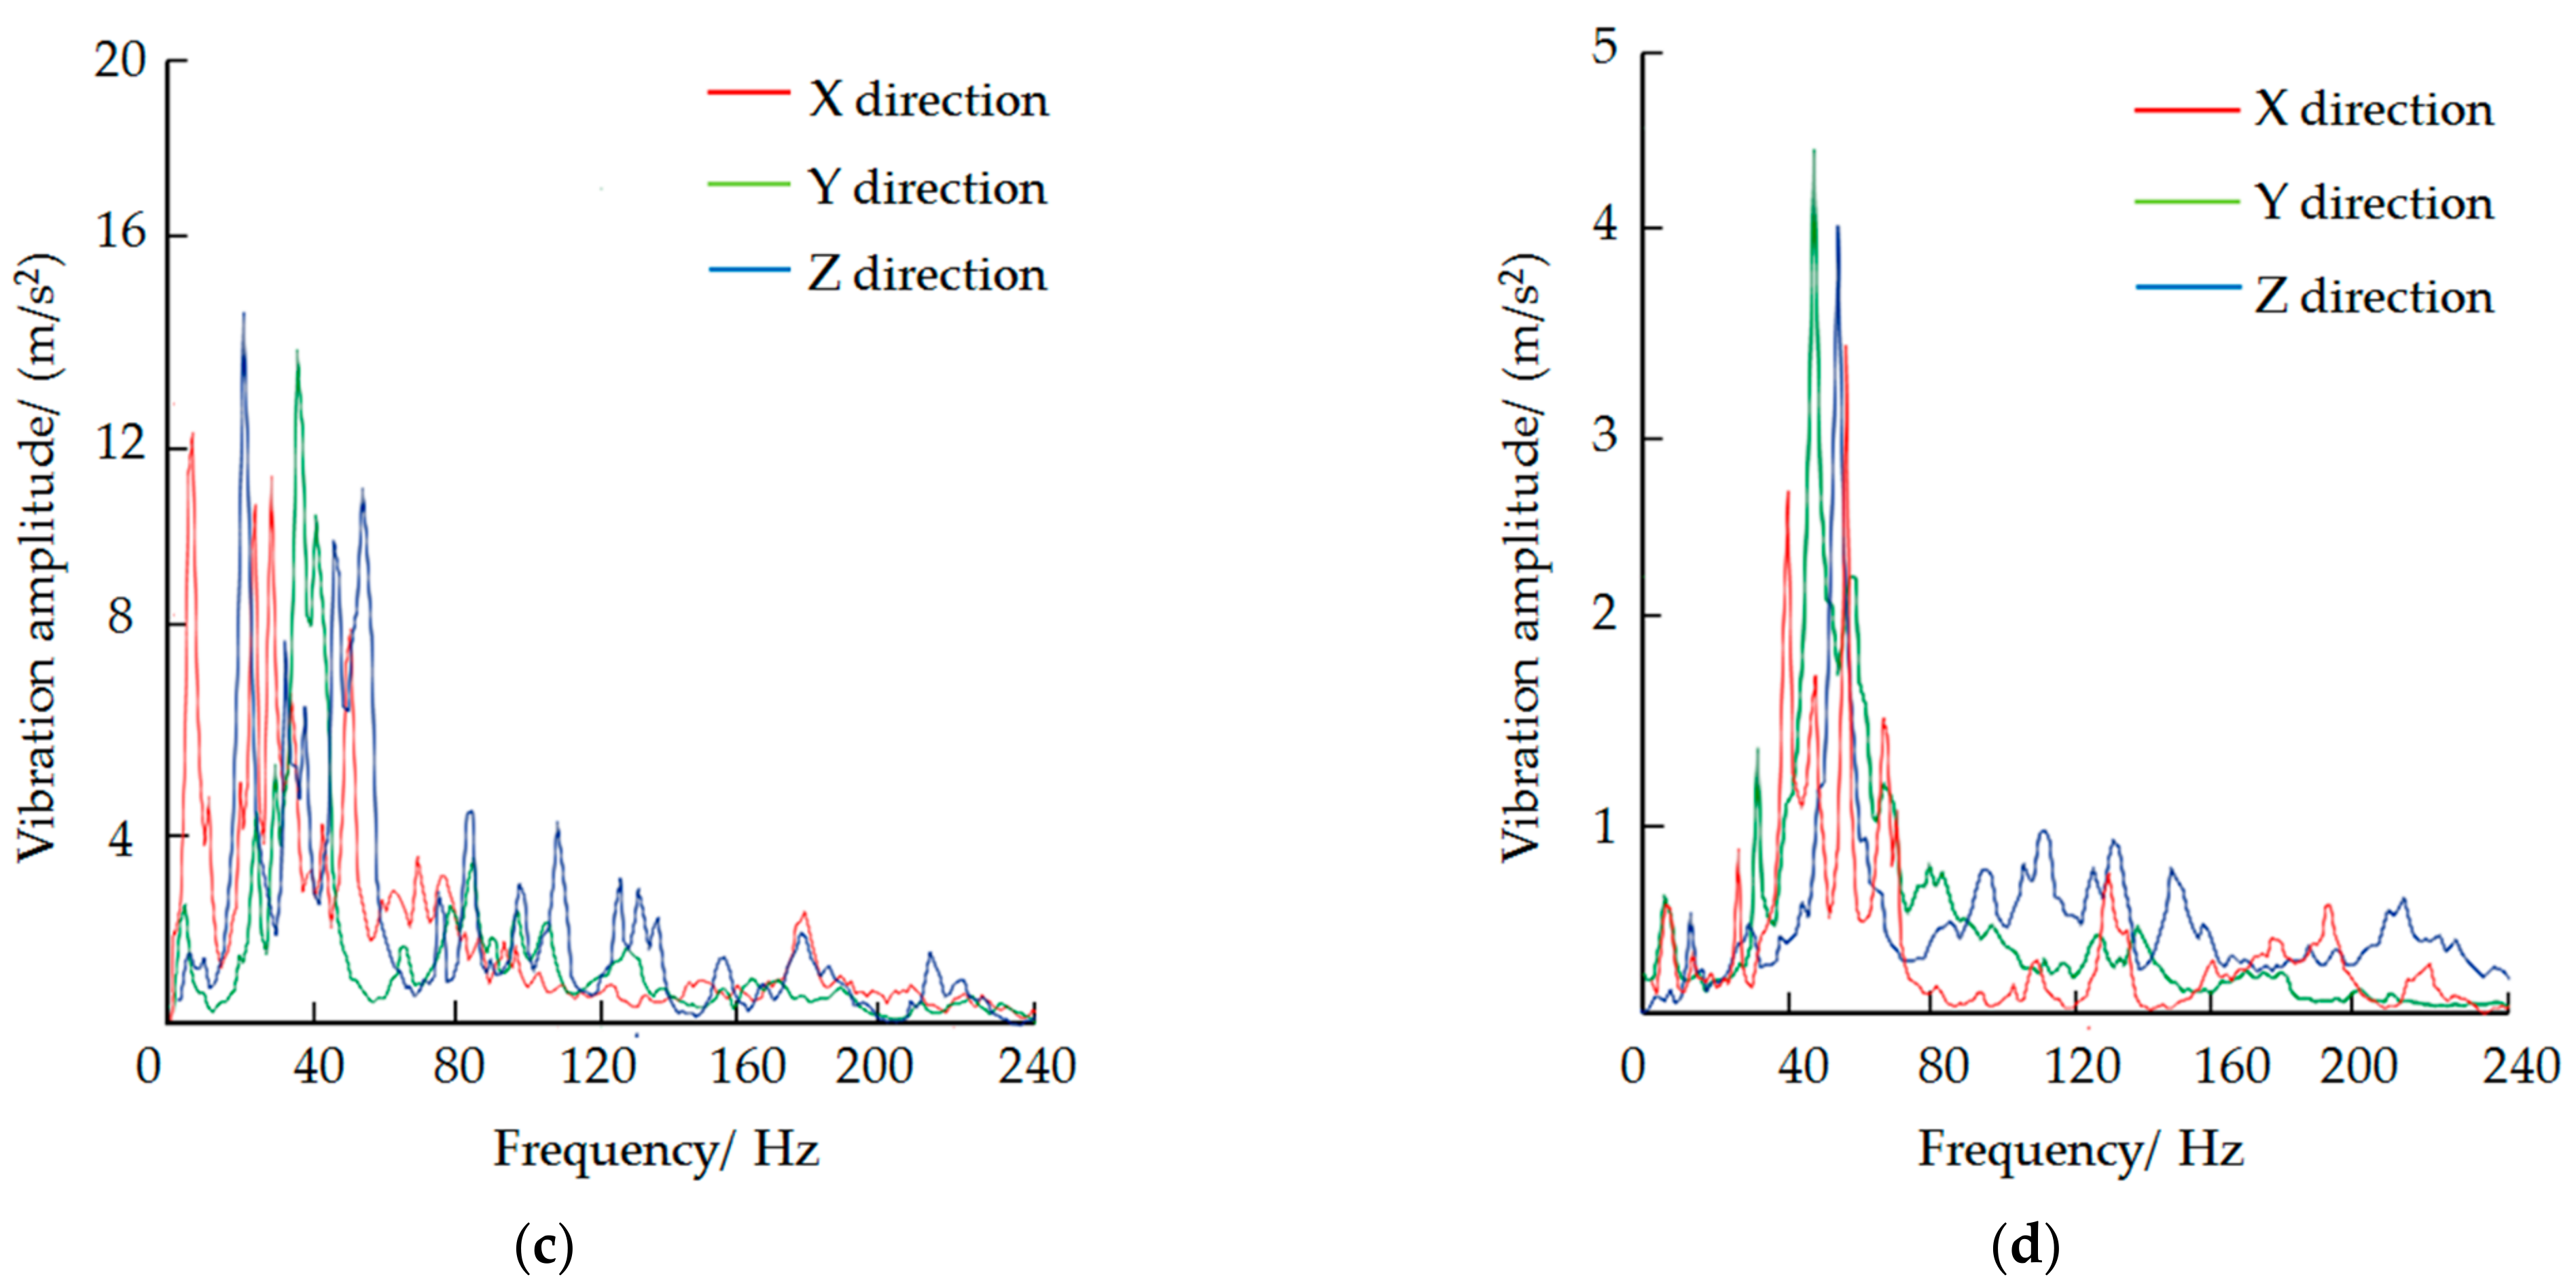
3.4.2. Comparative Analysis Results of Field Experiment

FFT spectrum analysis was used to process the acceleration time domain signal to obtain the spectrum analysis diagram. The spectrum analysis diagram before and after optimization is shown in Figure 17, and the vibration frequency and amplitude corresponding to the first six peak points are shown in Table 9.
According to the analysis of the frequency and peak value of each peak point in Table 10, the amplitude of each direction of the optimized threshing cylinder measuring point was significantly lower than that of the original threshing cylinder measuring point. The maximum peak value of point A decreased by 75.62% in the X direction, 81.45% in the Y direction, and 78.56% in the Z direction. The maximum peak point of B decreased by 72.09% in the X direction, 68.31% in the Y direction, and 73.98% in the Z direction.

4. Conclusions

(1) To obtain the vibration characteristics of the threshing cylinder, the finite element free modal analysis and free modal test were combined to verify the accuracy of establishing the finite element model. Based on the model, the natural frequencies under the constraint state were solved;
(2) Through the analysis of the excitation source, we concluded that the natural frequency (21.08 Hz) corresponding to the first-order modal shape was close to the self-rotation excitation frequency (21.67 Hz), which easily resonated;
(3) Based on the combination of size optimization and shape optimization, a two-factor five-level rotation orthogonal combination experiment was designed, and the parameters were optimized, and the model was reconstructed. The reconstructed threshing cylinder mass was centrosymmetric around the rotation center. When the hollow diameter of the separating rod was 22 mm, the mass fraction of the fixed plate was 57.62%, the first natural frequency of the threshing drum was 26.06 Hz, the maximum stress was 57.61 MPa, and the maximum deformation was 2.68 mm;
(4) The field experiment results showed that the amplitudes of the optimized threshing cylinder were significantly lower than those of the original threshing cylinder.

Author Contributions

Conceptualization, J.W. and C.X.; methodology, C.X.; software, Y.X. and X.Q.; validation, Y.X.; investigation, Z.L. and X.Q.; resources, J.W.; data curation, H.T.; writing—original draft preparation, C.X. and H.T.; writing—review and editing, J.W. and H.T.; visualization, H.T.; supervision, H.T.; funding acquisition, J.W. All authors have read and agreed to the published version of the manuscript.

Funding

This work was funded by the National Industry System of Rice Technology of P. R. China, grant number: CARS-01-44.

Institutional Review Board Statement

Not applicable.

Informed Consent Statement

Not applicable.

Data Availability Statement

All data are presented in this article in the form of figures and tables.

Acknowledgments

The authors would like to acknowledge Wenqi Zhou and Tianyong Tang for the use of the laboratory space for data collection.

Conflicts of Interest

The authors declare no conflict of interest.

References

  1. Choe, J.S.; Inoue, E.; Hashiguchi, K. Development of design theory on the tooth arrangement and the threshing drum for a large-sized and high-speed head-feeding combine. J. Fac. Agric. Kyushu Univ. 2000, 44, 377–384. [Google Scholar] [CrossRef]
  2. Kumar, A.; Mohan, D.; Patel, R.; Varghese, M. Development of grain threshers based on ergonomic design criteria. Appl. Ergon. 2002, 33, 503–508. [Google Scholar] [CrossRef]
  3. Su, Z.; Li, Y.; Dong, Y.; Tang, Z.; Liang, Z. Simulation of rice threshing performance with concentric and non-concentric threshing gaps. Biosyst. Eng. 2020, 197, 270–284. [Google Scholar] [CrossRef]
  4. Qian, Z.; Jin, C.; Zhang, D. Multiple frictional impact dynamics of threshing process between flexible tooth and grain kernel. Comput. Electron. Agric. 2017, 141, 276–285. [Google Scholar] [CrossRef]
  5. Yuan, J.; Wu, C.; Li, H.; Qi, X.; Xiao, X.; Shi, X. Movement rules and screening characteristics of rice-threshed mixture separation through a cylinder sieve. Comput. Electron. Agric. 2018, 154, 320–329. [Google Scholar] [CrossRef]
  6. Chen, S.; Zhou, Y.; Tang, Z.; Lu, S. Modal vibration response of rice combine harvester frame under multi-source excitation. Biosyst. Eng. 2020, 194, 177–195. [Google Scholar] [CrossRef]
  7. Liang, Z.; Li, Y.; Xu, L.; Zhao, Z.; Tang, Z. Optimum design of an array structure for the grain loss sensor to upgrade its resolution for harvesting rice in a combine harvester. Biosyst. Eng. 2017, 157, 24–34. [Google Scholar] [CrossRef]
  8. Yao, Y.; Song, Z.; Du, Y.; Zhao, X.; Mao, E.; Liu, F. Analysis of vibration characteristics and its major influenced factors of header for corn combine harvesting machine. Trans. Chin. Soc. Agric. Eng. 2017, 33, 40–49. [Google Scholar] [CrossRef]
  9. Lee, J.; Kim, D.H. Experimental modal analysis and vibration monitoring of cutting tool support structure. Int. J. Mech. Sci. 1995, 37. [Google Scholar] [CrossRef]
  10. Komeili, M.; Menon, C. Resonance vibration of a thermally-actuated optical fiber with arbitrary periodic excitation: Analysis and optimization. Int. J. Mech. Sci. 2017, 123, 287–296. [Google Scholar] [CrossRef]
  11. Li, Y.; Li, Y.; Xu, L.; Hu, B.; Wang, R. Structural parameter optimization of combine harvester cutting bench. Trans. Chin. Soc. Agric. Eng. 2014, 30, 30–37. [Google Scholar] [CrossRef]
  12. Xie, X.; Ren, M.; Zhu, Y.; Zhang, Z. Simulation and experiment on lateral vibration transmission control of a shafting system with active stern support. Int. J. Mech. Sci. 2020, 170. [Google Scholar] [CrossRef]
  13. Viehmann, A.; Rinderknecht, S. Investigation of the driving comfort of the DE-REX powertrain based on vehicle measurements. IFAC-PapersOnLine 2019, 52, 103–108. [Google Scholar] [CrossRef]
  14. Li, Z.; Zheng, L.; Ren, Y.; Li, Y.; Xiong, Z. Multi-objective optimization of active suspension system in electric vehicle with In-Wheel-Motor against the negative electromechanical coupling effects. Mech. Syst. Signal Process. 2019, 116, 545–565. [Google Scholar] [CrossRef]
  15. Pang, J.; Li, Y.; Ji, J.; Xu, L. Vibration excitation identification and control of the cutter of a combine harvester using triaxial accelerometers and partial coherence sorting. Biosyst. Eng. 2019, 185, 25–34. [Google Scholar] [CrossRef]
  16. Taghizadeh-Alisaraei, A. Analysis of annoying shocks transferred from tractor seat using vibration signals and statistical methods. Comput. Electron. Agric. 2017, 141, 160–170. [Google Scholar] [CrossRef]
  17. Qin, W.; Shangguan, W.B.; Luo, G.; Xie, Z. A method for estimating mount isolations of powertrain mounting systems. J. Sound Vib. 2018, 426, 278–295. [Google Scholar] [CrossRef]
  18. Li, Y.; He, L.; Shuai, C.G.; Wang, F. Time-domain filtered-x-Newton narrowband algorithms for active isolation of frequency-fluctuating vibration. J. Sound Vib. 2016, 367, 1–21. [Google Scholar] [CrossRef]
  19. Elhewy, A.M.H.; Hassan, A.M.A.; Ibrahim, M.A. Weight optimization of offshore supply vessel based on structural analysis using finite element meth od. Alexandria Eng. J. 2016, 55, 1005–1015. [Google Scholar] [CrossRef] [Green Version]
  20. Anthony, D.K.; Elliott, S.J. On reducing vibration transmission in a two-dimensional cantilever truss structure using geometric optimization and active vibration control techniques. J. Acoust. Soc. Am. 2001, 110, 1191–1194. [Google Scholar] [CrossRef] [Green Version]
  21. Sharafi, P.; Teh, L.H.; Hadi, M.N.S. Shape optimization of thin-walled steel sections using graph theory and ACO algorithm. J. Constr. Steel Res. 2014, 101, 331–341. [Google Scholar] [CrossRef] [Green Version]
  22. Rozvany, G.I.N. Topological optimization of grillages: Past controversies and new directions. Int. J. Mech. Sci. 1994, 36, 495–512. [Google Scholar] [CrossRef]
  23. Zhou, P.; Du, J.; Lü, Z. Simultaneous topology optimization of supporting structure and loci of isolators in an active vibration isolation system. Comput. Struct. 2018, 194, 74–85. [Google Scholar] [CrossRef]
  24. Van hoorickx, C.; Sigmund, O.; Schevenels, M.; Lazarov, B.S.; Lombaert, G. Topology optimization of two-dimensional elastic wave barriers. J. Sound Vib. 2016, 376, 95–111. [Google Scholar] [CrossRef] [Green Version]
  25. Rong, J.H.; Xie, Y.M.; Yang, X.Y.; Liang, Q.Q. Topology optimization of structures under dynamic response constraints. J. Sound Vib. 2000, 234, 177–189. [Google Scholar] [CrossRef]
  26. Park, J.; Wang, S. Noise reduction for compressors by modes control using topology optimization of eigenvalue. J. Sound Vib. 2008, 315, 836–848. [Google Scholar] [CrossRef]
  27. Maeda, Y.; Nishiwaki, S.; Izui, K.; Yoshimura, M.; Matsui, K.; Terada, K. Structural topology optimization of vibrating structures with specified eigenfrequencies and eigenmode shapes. Int. J. Numer. Methods Eng. 2006, 67, 597–628. [Google Scholar] [CrossRef]
  28. Wang, J.; Tang, H.; Zhou, W.; Yang, W.; Wang, Q. Improved design and experiment on pickup finger precision seed metering device. Nongye Jixie Xuebao/Trans. Chin. Soc. Agric. Mach. 2015, 46, 68–76. [Google Scholar] [CrossRef]
  29. Aenlle, M.L.; Brincker, R. Modal scaling in operational modal analysis using a finite element model. Int. J. Mech. Sci. 2013, 76, 86–101. [Google Scholar] [CrossRef]
  30. Petyt, M.; Lim, S.P. Finite element analysis of the noise inside a mechanically excited cylinder. Int. J. Numer. Methods Eng. 1978, 13, 109–122. [Google Scholar] [CrossRef]
  31. Laurent, C.; Bauerheim, M.; Poinsot, T.; Nicoud, F. A novel modal expansion method for low-order modeling of thermoacoustic instabilities in complex geometries. Combust. Flame 2019, 206, 334–348. [Google Scholar] [CrossRef] [Green Version]
  32. Nahvi, H.; Jabbari, M. Crack detection in beams using experimental modal data and finite element model. Int. J. Mech. Sci. 2005, 47, 1477–1497. [Google Scholar] [CrossRef]
  33. Datta, N.; Verma, Y. Analytical scrutiny and prominence of beam-wise rigid-body modes in vibration of plates with translational edge restraints. Int. J. Mech. Sci. 2018, 135, 124–132. [Google Scholar] [CrossRef]
  34. Sharifnia, M.; Akbarzadeh, A. A constrained assumed modes method for solution of a new dynamic equation for an axially moving beam. Comput. Math. Appl. 2016, 72, 2167–2180. [Google Scholar] [CrossRef]
  35. Liu, X.; Luo, Y.; Karney, B.W.; Wang, Z.; Zhai, L. Virtual testing for modal and damping ratio identification of submerged structures using the PolyMAX algorithm with two-way fluid-structure Interactions. J. Fluids Struct. 2015, 54, 548–565. [Google Scholar] [CrossRef]
  36. Yao, Y.; Du, Y.; Zhu, Z.; Mao, E.; Song, Z. Vibration characteristics analysis and optimization of corn combine harvester frame using modal analysis method. Trans. Chin. Soc. Agric. Eng. 2015, 31, 46–53. [Google Scholar] [CrossRef]
  37. Jiang, Y.; Liao, Y.; Qin, C.; Guan, Z.; Liao, Q. Vibration analysis and improvement for frame of 4SY-2.9 typed rape windrower. Trans. Chin. Soc. Agric. Eng. 2017, 33, 53–60. [Google Scholar] [CrossRef]
  38. Wang, Q.; Hao, Z.; Li, Y.; Wang, L. A research on the design of low-noise oil-pan based on FEM and BEM. Automot. Eng. 2013, 35, 364–368. [Google Scholar]
  39. Shu, G.; Liang, X. Identification of complex diesel engine noise sources based on coherent power spectrum analysis. Mech. Syst. Signal Process. 2007, 21, 405–416. [Google Scholar] [CrossRef]
  40. Jang, G.H.; Seo, C.H.; Lee, H.S. Finite Element Modal Analysis of an HDD Considering the Flexibility of Spinning Disk-Spindle, Head-Suspension-Actuator and Supporting Structure. In Proceedings of the Microsystem Technologies, Besançon, France, 7–9 June 2007; Volume 13, pp. 837–847. [Google Scholar]
  41. Ebrahimi, R.; Mirdamadi, H.R.; Ziaei-Rad, S. Operational modal analysis and fatigue life estimation of a chisel plow arm under soil-induced random excitations. Meas. J. Int. Meas. Confed. 2018, 116, 451–457. [Google Scholar] [CrossRef]
  42. Liu, C.; Wang, Y.; Du, X.; Song, J.; Wang, J.; Zhang, F. Filling performance analysis and verification of cell-belt rice precision seed-metering based on friction and repeated filling principle. Trans. Chin. Soc. Agric. Eng. 2019, 35, 29–36. [Google Scholar] [CrossRef]
  43. Liu, C.; Wang, Y.; Song, J.; Li, Y.; Ma, T. Experiment and discrete element model of rice seed based on 3D laser scanning. Trans. Chin. Soc. Agric. Eng. 2016, 32, 294–300. [Google Scholar] [CrossRef]
  44. Ariduru, S. Fatigue Life Calculation by Rainflow Cycle Counting Method. Master’s Thesis, Middle East Technical University, Ankara, Turkey, 2004. [Google Scholar]
  45. Gao, Z.; Xu, L.; Li, Y.; Wang, Y.; Sun, P. Vibration measure and analysis of crawler-type rice and wheat combine harvester in field harvesting condition. Trans. Chin. Soc. Agric. Eng. 2017, 33, 48–55. [Google Scholar] [CrossRef]
  46. Fraczek, J.; Złobecki, A.; Zemanek, J. Assessment of angle of repose of granular plant material using computer image analysis. J. Food Eng. 2007, 83, 17–22. [Google Scholar] [CrossRef]
  47. Wan, L.X.; Wu, J.; Shangguan, W.B. Modeling of dynamic properties for hydraulic engine mounts and optimized vibration control method of powertrain mounting systems. J. Vib. Shock 2008, 27, 4–7, 35. [Google Scholar] [CrossRef]
  48. Wang, C.Y.; He, L.; Li, Y.; Shuai, C.G. A multi-reference filtered-x-Newton narrowband algorithm for active isolation of vibration and experimental investigations. Mech. Syst. Signal Process. 2018, 98, 108–123. [Google Scholar] [CrossRef]
  49. Fukushima, T.; Inoue, E.; Mitsuoka, M.; Okayasu, T.; Sato, K. Collision vibration characteristics with interspace in knife driving system of combine harvester. Eng. Agric. Environ. Food 2012, 5, 115–120. [Google Scholar] [CrossRef]
  50. Feng, T.; Bakshi, S.; Gu, Q.; Yan, Z.; Chen, D. Design optimization of bottom-hole assembly to reduce drilling vibration. J. Pet. Sci. Eng. 2019, 179, 921–929. [Google Scholar] [CrossRef]
  51. Zhang, X.; Li, X.; Zhu, X.; Ma, S. Rotational speed control of threshing cylinder of oil sunflower combine harvester based on active disturbance rejection controller-dynamic matrix predictive. Trans. Chin. Soc. Agric. Eng. 2019, 35, 9–16. [Google Scholar] [CrossRef]
Figure 1. Structure of a full feeding rice combine harvester. (a) Overall structure; (b) threshing and cleaning system. 1. Divider; 2. Cutter; 3. Reel; 4. Screw pusher; 5. Cab; 6. Tilt conveyor; 7. Grain unloading system; 8. Power chassis; 9. Threshing cylinder; 10. Concave plate; 11. Sieve; and 12. Fan.
Symmetry 13 00571 g001
Figure 2. Three-dimensional solid model of a threshing cylinder. 1. Screw feeding blade; 2. Barrel; 3. Separating bar; 4. Nail tooth; 5. Axis; and 6. Fixing plate.
Symmetry 13 00571 g002
Figure 3. Free modal test. (a) Test schematic diagram; (b) test field; 1. Threshing cylinder; 2. Acceleration sensor; 3. Force hammer; 4. Data acquisition instrument; 5. Computer; 6. Signal transmission line; and 7. Rubber block.
Symmetry 13 00571 g003
Figure 4. Static force of a threshing cylinder.
Symmetry 13 00571 g004
Figure 5. EDEM 2018 simulation model. (a) Discrete element model of single grain; (b) discrete element model of straw.
Symmetry 13 00571 g005
Figure 6. EDEM simulation of a threshing cylinder.
Symmetry 13 00571 g006
Figure 7. Field experiment. A and B are the measuring points; 1. Data acquisition instrument; 2. Mobile power; 3. Computer; 4. Data transmission line; 5. Concave; and 6. Acceleration sensor.
Symmetry 13 00571 g007
Figure 8. Free modal analysis of the threshing cylinder. (a) First-order modal shape (37.94 Hz); (b) second-order modal shape (45.38 Hz); (c) third-order modal shape (70.09 Hz); (d) fourth-order modal shape (93.87 Hz); (e) fifth-order modal shape (108.89 Hz); and (f) sixth-order modal shape (133.71 Hz).
Symmetry 13 00571 g008aSymmetry 13 00571 g008b
Figure 9. Constrained modal analysis of threshing cylinder. (a) First-order modal shape (21.08 Hz); (b) second-order modal shape (46.50 Hz); (c) third-order modal shape (68.32 Hz); (d) fourth-order modal shape (90.11 Hz); (e) fifth-order modal shape (110.93 Hz); and (f) sixth-order modal shape (131.66 Hz).
Symmetry 13 00571 g009aSymmetry 13 00571 g009b
Figure 10. Optimization state of the fixed plate. (a) Removal of 23.8% mass in the optimized area; (b) Removal of 30% mass in the optimized area; (c) removal of 45% mass in the optimized area; (d) removal of 60% mass in the optimized area; (e) removal of 66.2% mass in the optimized area.
Symmetry 13 00571 g010
Figure 11. Influence of the hollow diameter and mass fraction on the first natural frequency. (a) Response surface; (b) contour map.
Symmetry 13 00571 g011
Figure 12. Influence of the hollow diameter and mass fraction on the maximum stress. (a) Response surface; (b) contour map.
Symmetry 13 00571 g012
Figure 13. Influence of the hollow diameter and mass fraction on the maximum deformation. (a) Response surface; (b) contour map.
Symmetry 13 00571 g013
Figure 14. Model reconstruction. (a) Optimal condition of 57.62% mass fraction of fixed plate removal; (b) reconstructed threshing cylinder model.
Symmetry 13 00571 g014
Figure 15. Modal analysis and static analysis of reconstructed threshing cylinder. (a) First-order modal shapes (26.06 Hz); (b) stress cloud; (c) deformation cloud.
Symmetry 13 00571 g015
Figure 16. Fatigue analysis. (a) The life of the reconstructed threshing cylinder; (b) the safety factor of the reconstructed threshing cylinder.
Symmetry 13 00571 g016
Figure 17. Spectrum analysis. (a) Before optimization of measuring point A; (b) after optimization of measuring point A; (c) before optimization of measuring point B; (d) after optimization of measuring point B.
Symmetry 13 00571 g017aSymmetry 13 00571 g017b
Table 1. The technical parameters of a full feeding rice combine harvester.
ParametersValue
Overall dimension/(mm × mm × mm)5130 × 2470 × 2750
Rated power/(kW)75
Track width/(mm)450
Header width/(mm)2000
Ground clearance of chassis/(mm)672
Threshing cylinder/(mm × mm)Φ620 × 1960
Sieve/(m2)1.24
Reel diameter/(mm)Φ900
Feed rate/(t/h)16.2
Working speed/(km/h)0~4.8
Table 2. Main structural parameters of a threshing cylinder.
ParameterValues
Cylinder outer diameter/(mm × mm)Φ620 × 1960
Separating bar/(mm × mm)Φ30 × 1800
Nail tooth/(mm × mm)Φ14 × 60
Nail tooth spacing/(mm)40
Fixing plate/(mm × mm)Φ500 × 12
Axis/(mm × mm)Φ45 × 2150
Table 3. The test equipment and parameters.
OrderInstrumentParameter
1Computer/
2INV3018C 8-channel 24-bit high precision data acquisition instrumentParallel channel: 8
Maximum sampling frequency: 102.4 kHz
A/D resolution: 24 bits
3LC-2D force hammerMeasuring range: 0–2 kHz
Charge reference sensitivity: 4 pC/N
Linearity: <1%
4AY100I piezoelectric acceleration sensorSensitivity: 100 mV/g
Maximum frequency: 10,000 Hz
Resolution: 0.0002
5DASP-10 Modal analysis system/
Table 4. Test factor level coding table.
LevelHollow Diameter x1/mmMass Fraction x2/%
−1.414823.8
−11030
01545
12060
Table 5. Virtual simulation parameters.
MaterialPoisson RatioShear Modulus/MPaDensity/kg·m−3Restitution Coefficient Static Friction CoefficientDynamic Friction Coefficient
Grain0.332.6013500.26 (Grain–Grain)0.93 (Grain–Grain)0.01 (Grain–Grain)
0.23 (Grain–Straw)0.80 (Grain–Straw)0.01 (Grain–Straw)
Straw0.421.001000.20 (Straw–Straw)0.85 (Straw–Straw)0.01 (Straw–Straw)
0.30 (Straw–Threshing cylinder)0.76 (Straw–Threshing cylinder)0.01 (Straw–Threshing cylinder)
Threshing cylinder0.3070078500.50 (Grain–Threshing cylinder)0.52 (Grain–Threshing cylinder)0.01 (Grain–Threshing cylinder)
Table 6. Comparison of the finite element free modal analysis and modal test results.
OrderFinite Element Free Modal AnalysisModal TestError/%
Calculation Frequency/HzModal ShapeTest Frequency/HzModal Shape
137.94Overall bending38.26Consistent0.84
245.38Overall bending44.10Consistent2.90
370.09Bending of separating bar and nail teeth deformation69.37Consistent1.04
493.87Overall bending98.45Consistent4.65
5108.89Overall bending111.06Consistent1.95
6133.71Overall torsion140.23Consistent4.65
Table 7. Excitation frequencies of the rotating parts.
Rotating PartsSpeed/(r/min)Theoretical Excitation Frequencies/(Hz)
Engine2200–240036.67–40
Fan105017.50
Tilt conveyor axis80013.33
Sieve axis4507.50
Screw pusher2303.83
Reel601.00
Table 8. Test scheme and results.
OrderTest FactorsPerformance Measures
Hollow Diameter
x1/mm
Mass Fraction
x2/%
First-Order Natural Frequency
y1/Hz
Maximum Stress
y2/MPa
Maximum Deformation
y3/mm
1−1 (10)−1 (30)43.64107.322.37
21 (20)−136.29120.482.64
31−121.34310.8513.98
411 (60)29.68106.432.97
5−1.414 (8)0 (45)24.15321.4013.23
61.414 (22)033.38104.153.55
70−1.414 (23.8)44.90112.660.36
801.414 (66.2)22.66274.1310.92
90043.93330.7813.51
100044.18332.6013.41
110043.90327.3112.95
120043.74324.9013.36
130043.97338.4613.22
140042.62332.0712.89
150043.58323.5613.47
160044.28331.8513.33
Table 9. Variance analysis of the regression model.
IndexSource of VarianceSum of SquaresDegree of FreedomMean Square ValueF-Valuep-Value
y1Model1120.935224.1989.10<0.0001
Residual25.16102.52
Deviance23.2937.7629.060.0003
Error1.8770.27
y2Model152,700530,545.7455.25<0.0001
Residual5528.3110552.83
Deviance5367.2431789.0877.75<0.0001
Error161.07723.01
y3Model401.09580.22110.84<0.0001
Residual7.24100.72
Deviance6.8632.2942.32<0.0001
Error0.3870.054
Note: p < 0.01 indicates extreme significance.
Table 10. Amplitudes and frequencies corresponding to each peak point of the test.
Peak PointMeasuring Point APeak PointMeasuring Point B
X DirectionY DirectionZ DirectionX DirectionY DirectionZ Direction
Frequency/HzAmplitude/(m/s2)Frequency/HzAmplitude/(m/s2)Frequency/HzAmplitude/(m/s2)Frequency/HzAmplitude/(m/s2)Frequency/HzAmplitude/(m/s2)Frequency/HzAmplitude/(m/s2)
P1112.5015.4242.8616.1872.1518.00V18.1512.1840.0213.9820.5415.22
P2119.4612.8055.4010.2028.6016.85V238.2711.2342.7510.2052.2010.18
P376.459.0648.929.7645.2615.57V332.8010.1538.275.6043.639.12
P4185.007.48120.105.1240.2011.44V450.588.6783.003.8532.067.75
P520.406.15100.534.8342.559.80V520.005.80100.252.2738.706.96
Q125.373.7640.283.0045.693.86W150.273.4060.344.4360.003.96
Q252.702.8883.650.6656.802.27W240.002.7668.702.31112.551.02
Q345.482.3696.570.4459.442.10W343.251.7238.681.33135.280.94
Q438.551.8676.840.37113.201.17W470.581.4671.251.17150.300.77
Q540.001.57117.900.32117.581.00W574.201.0582.500.84103.650.71
Note: P1–5 and Q1–5 are the peak points of measuring point A before and after the optimization of threshing cylinder, V1–5 and W1–5 are the peak points of measuring point B before and after the optimization of the threshing cylinder.
Publisher’s Note: MDPI stays neutral with regard to jurisdictional claims in published maps and institutional affiliations.

