1. Introduction
Social networking services (SNS), in conjunction with a variety of new types of services, became an indispensable tool for people to communicate with one another. As a result, the number of SNS users is exponentially increasing, and their personal data is becoming a research subject [
1]. One characteristic of SNS is that every user is able to participate and provide feedback for each other. In addition, various communities based on SNS are rapidly formed based on individual interactions, sharing common interests, and gradually developing into various groups [
2]. At the same time, SNS creates a vulnerable space that can be easily exposed to the public. This often causes problems such as stalking and malicious posts, which then creates further problems within society [
3]. For example, users can purposefully provide distorted information, create conflicts between other users, or invade other people’s privacy. These negative byproducts are becoming serious public issues [
4]. In order to find the solution to this social dysfunction, understanding the dynamic relationship between SNS users is pivotal. It is also meaningful as a field of study to deal with the imbalance of data among users in a symmetrical and balanced way. Once the correlation is discovered, a new data processing methodology must be applied to analyze the correlation between users and provide object layering. To collect data for this purpose, all SNS platforms must be assessed. However, it was announced that during every second, 2.5 TB worth of data is being generated on social media around the world [
5]. Accordingly, it is very difficult to collect and analyze all relevant data at once. Therefore, we conducted experiments by adjusting the data collection process through the platform of choice. Once the platform was selected, we needed to understand if the data is managed internally or externally. Further, data from each platform needed to be evaluated for their traffic, amount of transmission, and speed of transmission in order to apply a new data processing methodology for fast and effective results. Based on data type and criteria, each data type needed to be assessed to prepare appropriate technology to collect data and security systems to protect them. If the data is processed internally, ongoing communication must occur with the data coordinator to specify which type of data and how often the data will be collected. If it is processed externally, whether data is offered through Open API, and what type and quantity of data can be collected must be understood [
6]. In addition, if data is being collected through data crawling, its data life cycle and copyright must be considered to create a plan to collect data [
7]. If their data type is categorizing data, it will be collected either from the database or from drivers provided by the vendor, or collected as a file through data crawling from API or HTTP. After the data category and type are understood, the corresponding technology can be determined to collect them.
In this paper, the popular SNS, ‘Instagram’ and community platform, called ‘Bobaedream’ were selected as the SNS given target platforms, and we collected data from the users and processed the data to understand the correlation through object layering. This mutual relationship diagram will predict the individual relationship between each user of symmetrical balance, and ultimately prevent social dysfunction on the SNS platforms.
The following is a list of the composition of papers. First,
Section 2 of the next chapter explains the background of this research and
Section 3 explains the Object layering among users. In addition, the next
Section 4 shows a new data processing methodology, and
Section 5 explains the correlation analysis involving Object layering of users. In
Section 6, we talk about the conclusion once more.
2. Background
In general, the emergence of social media is very important as time changes, and are many successful services around us that have recently emerged through commercialization. Based on this, detailed research and a number of social media software services have emerged together. At the same time, you can see that Facebook, which has a large number of users worldwide, focuses on producing chat, Messenger, advertising, and content.
In the previous research that studied how the SNS experience on smartphones can be improved, a test was conducted to understand what are the initial challenges involved in using the SNS platform (i.e., user interfaces including icon, design, and function) [
8]. Based on the result from this study, the authors offered suggestions to improve experiences from Facebook or Instagram [
9]. In addition, among the characteristics of social media, the method of expressing and satisfying the desire to show off individual content has evolved into a customized advertisement or a method of showing off individual content. Global companies around the world, such as Facebook, or Twitter, are interested in social media and analyzing data through deep learning to develop better services. In addition, much of the population are focusing their efforts on communication and redistribution of content. One study looked into the cause of motor vehicle accidents in metropolitan areas of the United States of America [
10]. The data was collected through hashtags (
#) on Twitter, and after using deep learning, the research successfully analyzed the cause of the accidents. This was one of the few positive results to prove how SNS can deliver information to people, as well as how data can be categorized for these studies [
11].
In addition to these positive aspects, there have also been phenomena that have negative effects through social media. For example, personal lives can be affected by random exposure to an unspecified number of people through social media, and financial damage in the community can result from this. These are all issues that can be solved if the entity that develops social media services analyzes data through optimized layering between users.
3. User Object Layering
A SNS service shares two distinct characteristics of participation and exposure [
12]. Every user can participate to share feedback and communicate, while an individual’s interests, posts, and comments may be shared and exposed to others. Based on these characteristics, various forms of content created by the users is constantly being shared, and the platforms are becoming an innovative space to promote participation and networking.
A ‘Subject user’ is someone who initially posts on SNS, and ‘Object user’ is a respondent to the initial post. This mutual relationship enables all users to communicate, and the role of subject and object users may switch constantly. Thus, these interchanging roles must be understood prior to analyzing the social dysfunction between SNS users and potentially prevent it from occurring.
In
Figure 1, a schematic diagram of the relationship between the Subject and Object users is presented, followed by a suggestion of Object layering and a deep learning model throughout the research article.
For data analysis and service application purposes, data collection is an important process that determines the quality of the analysis as well as the service. Thus, source data must be carefully evaluated in the planning phase, and the difficulty, cost, and safety of data must be considered as well. External data is another factor to consider, as data analysis often does not include any internal data processing, and instead relies on external data for both collection and analysis. To see these data processing methodologies, one of our development goals is to maintain the symmetry and interaction of each user. In this study, Level 1 (L1) is defined as the basic data, Level 2 (L2) as additional data, and Level 3 (L3) as cognitive data [
13,
14].
Structured data is data in schematic form that consists of rows and columns. Examples are tables from RDBMS as well as spreadsheets from Microsoft Excel. On the other hand, unstructured data is analyzable data that is in object form, such as text, multimedia (e.g., image and video), and HTML. Text mining is the most well-known analysis involving unstructured data. Unstructured data is semi-structured data with structures, and each quantity of data has different structures. Thus, meta-data must be analyzed to study data patterns, and examples of this are HTML, XML, and JSON.
Figure 2 is an example of Layer 1 (L1) being used for object layering, representing JSON data from unstructured data.
5. Result and Discussion
To analyze the social networking, modeling was performed to create relationships between nodes and links, which helps to analyze the structure, expansion, and evolution of the findings. Nodes present the object to be analyzed, such as an individual or an object, whereas links demonstrate the relationship between the nodes, which may or may not have directionality [
19].
In SNS, subject users and object users can constantly interchange roles, thus we wanted Artificial Intelligence to learn this volatile relationship and provide values to keep a symmetrical balance. First, objects must be followed by layering in order to analyze their correlation [
20,
21,
22,
23]. As the collection process requires Selenium and the WebDriver API to open a web browser for collection, we have monitored the process through the web browser. However, as the web browser is involved in data collection, the overall speed was slow, and the closure of the web browser stopped the collection process, which resulted in the loss of the entire work memory. In addition, unstable internet connection also force stopped the process.
There were no other technical difficulties discovered. Thus, we have proceeded to selecting public influencers, as their accounts clearly represent subject and object user information. This is an important factor, as the theoretical background applied Multi-layer Perceptron, which predicts the results after the Deep Learning process [
24]. When this occurs, it is pivotal to provide maximal space for exception handling, so that the entire process does not require a manual reset, even when problems occur.
For our first pilot study, we randomly selected two public entertainers or influencers with a high number of followers. As a result, the SNS influencers named ‘Jae Woo Kim’ and ‘Chan Woo Cheong’ were selected, and their Instagram posts and comments were collected. The two individuals are known to have an actual relationship as well as a relationship on social networking services, thus we were expecting to show that through our analysis.
When nodes and links are used to construct a correlation diagram for object layering purposes, the following factors must be considered: Degree centrality (
Cd), Closeness centrality (
Cc), Betweenness centrality (
Cb), and Eigenvector centrality (
Ce). Degree centrality shows how many links are connected in a single node, quantifying the centrality of the node [
25]. Closeness centrality presents the proximity between each node, which calculates the centrality through both a direct and indirect relationship with other notes; by contrast, degree centrality only calculates based on direct relationships. Closeness centrality represents the sum of minimal steps to reach from one node to another [
26]. Betweenness centrality measures the number of roles a node has as a mediator, and a high value can be observed when the node is located in between many different nodes [
27]. Lastly, Eigenvector centrality places a focus on connection to ‘
important nodes’, thus a high value can be measured when the node is connected to multiple important nodes [
23].
Because of the final product of social network analysis and visualization, the following analytical tools can be used: R, NetDraw, Gephi, NodeXL, NetMiner, Pajek, and more. In this research, the igraph package from R was utilized, and this product of correlation diagram can be used for modeling an actual or artificial network.
The data for this diagram were created through
HIVE, and this process requires two tables representing the relationship between the nodes as well as information on the nodes. On these two tables, the link table should include
from_ID,
to_ID, weight, and score, while the node table should include
ID and
group information, without the redundant use of
from_ID and
to_ID.
Figure 8 shows an example of data used to construct the relationship diagram, and shows how the subject and object users can be differentiated. This information was further used to generate a directional relationship calculated by the amount and positivity of the comment.
Figure 9 and
Figure 10 represent the two tables of nodes and links, showing the relationship between nodes. In order to analyze the correlation between user object layering, nodes and links were visualized. This visualization assisted the deep learning process, analyzing the relationship between subject and object users, as well as the relationship between a new object user (i.e., previously, a subject user) and other object users.
Therefore, the process of correlation analysis of user object layering can be described in three steps.
Figure 11 presents the process of Object layering expressing the user relationships, and the node’s relationships were shown with the node’s color, size, and size of the arrow. The width of the link represents the weight, whereas the preference based on the score was visualized with link colors.
The first step starts with displaying the relationship between different nodes. Using the following source with the node’s color, size, and size of the arrow can provide correlation of the nodes. Secondly, interest was presented through the width of the link using the weight. This can add preference to the second source by designating the weight to represent the links’ size. The third step was to show the preference through the score, while designating the link’s color. This can be added to the preference through the second source.
Figure 12 shows the source used to describe a relationship between the nodes for visualizing the correlation. As dynamic relationships between subject and object users in social media cannot be established with a fixed value, user object layering must be carefully performed to complete a deep learning model.
In the following
Figure 13, all data from the two previously mentioned public influencers went through object layering, and the correlation analysis is shown. Using the sources from
Figure 9,
Figure 10 and
Figure 11 results in
Figure 13. This is the first visualization step showing the correlation. The posting data of each user forms user-centered nodes, and the relationship between nodes is shown in the form of a solid line. As there are more relationships, the thickness of the solid line tends to be thicker.
After that,
Figure 14 shows the visualized data focusing on the Interest obtained during the object layering correlation analysis. This interest with a specific algorithm was registered as copyrighted intellectual property [
22,
23,
24].
Similarly,
Figure 15 shows the visualized data focusing on the attraction. The interest may allow both subject and object users to have their own relationships, thus the color of the link was added. This addition resulted in the modification of nodes and links, such as width of the link. As links become more and more complex, the color of the solid lines, which is the connection between the links, becomes darker. Eventually, the beginning begins with black, becomes yellow and red, and becomes darker and darker towards a deep red.
In addition, both the interest and attraction from
Figure 13,
Figure 14 and
Figure 15 were assigned with specific algorithms and registered as copyrighted intellectual property [
13,
14]. Since the correlation from object layering irregularly changes based on the node, the deep learning model experiences challenges in visualizing a user’s data. Thus, this research focused on utilizing width and color for node and link. However, relationship diagrams created through
igraph did not clearly show the interest and attraction. To resolve this problem, another package, NetworkD3 from
R, was used as well. The NetworkD3 package is based on the
htmlwidget package, and it allows visualization of the D3 network [
28]. This package also offers an
igraph_to_networkD3 function, which uses
igraph objects to create a network.
In addition, the igraph_to_networkD3 function may not create any image, but it is capable of extracting parameters used in the
forceNetwork function, which is used for plotting the network. This function creates
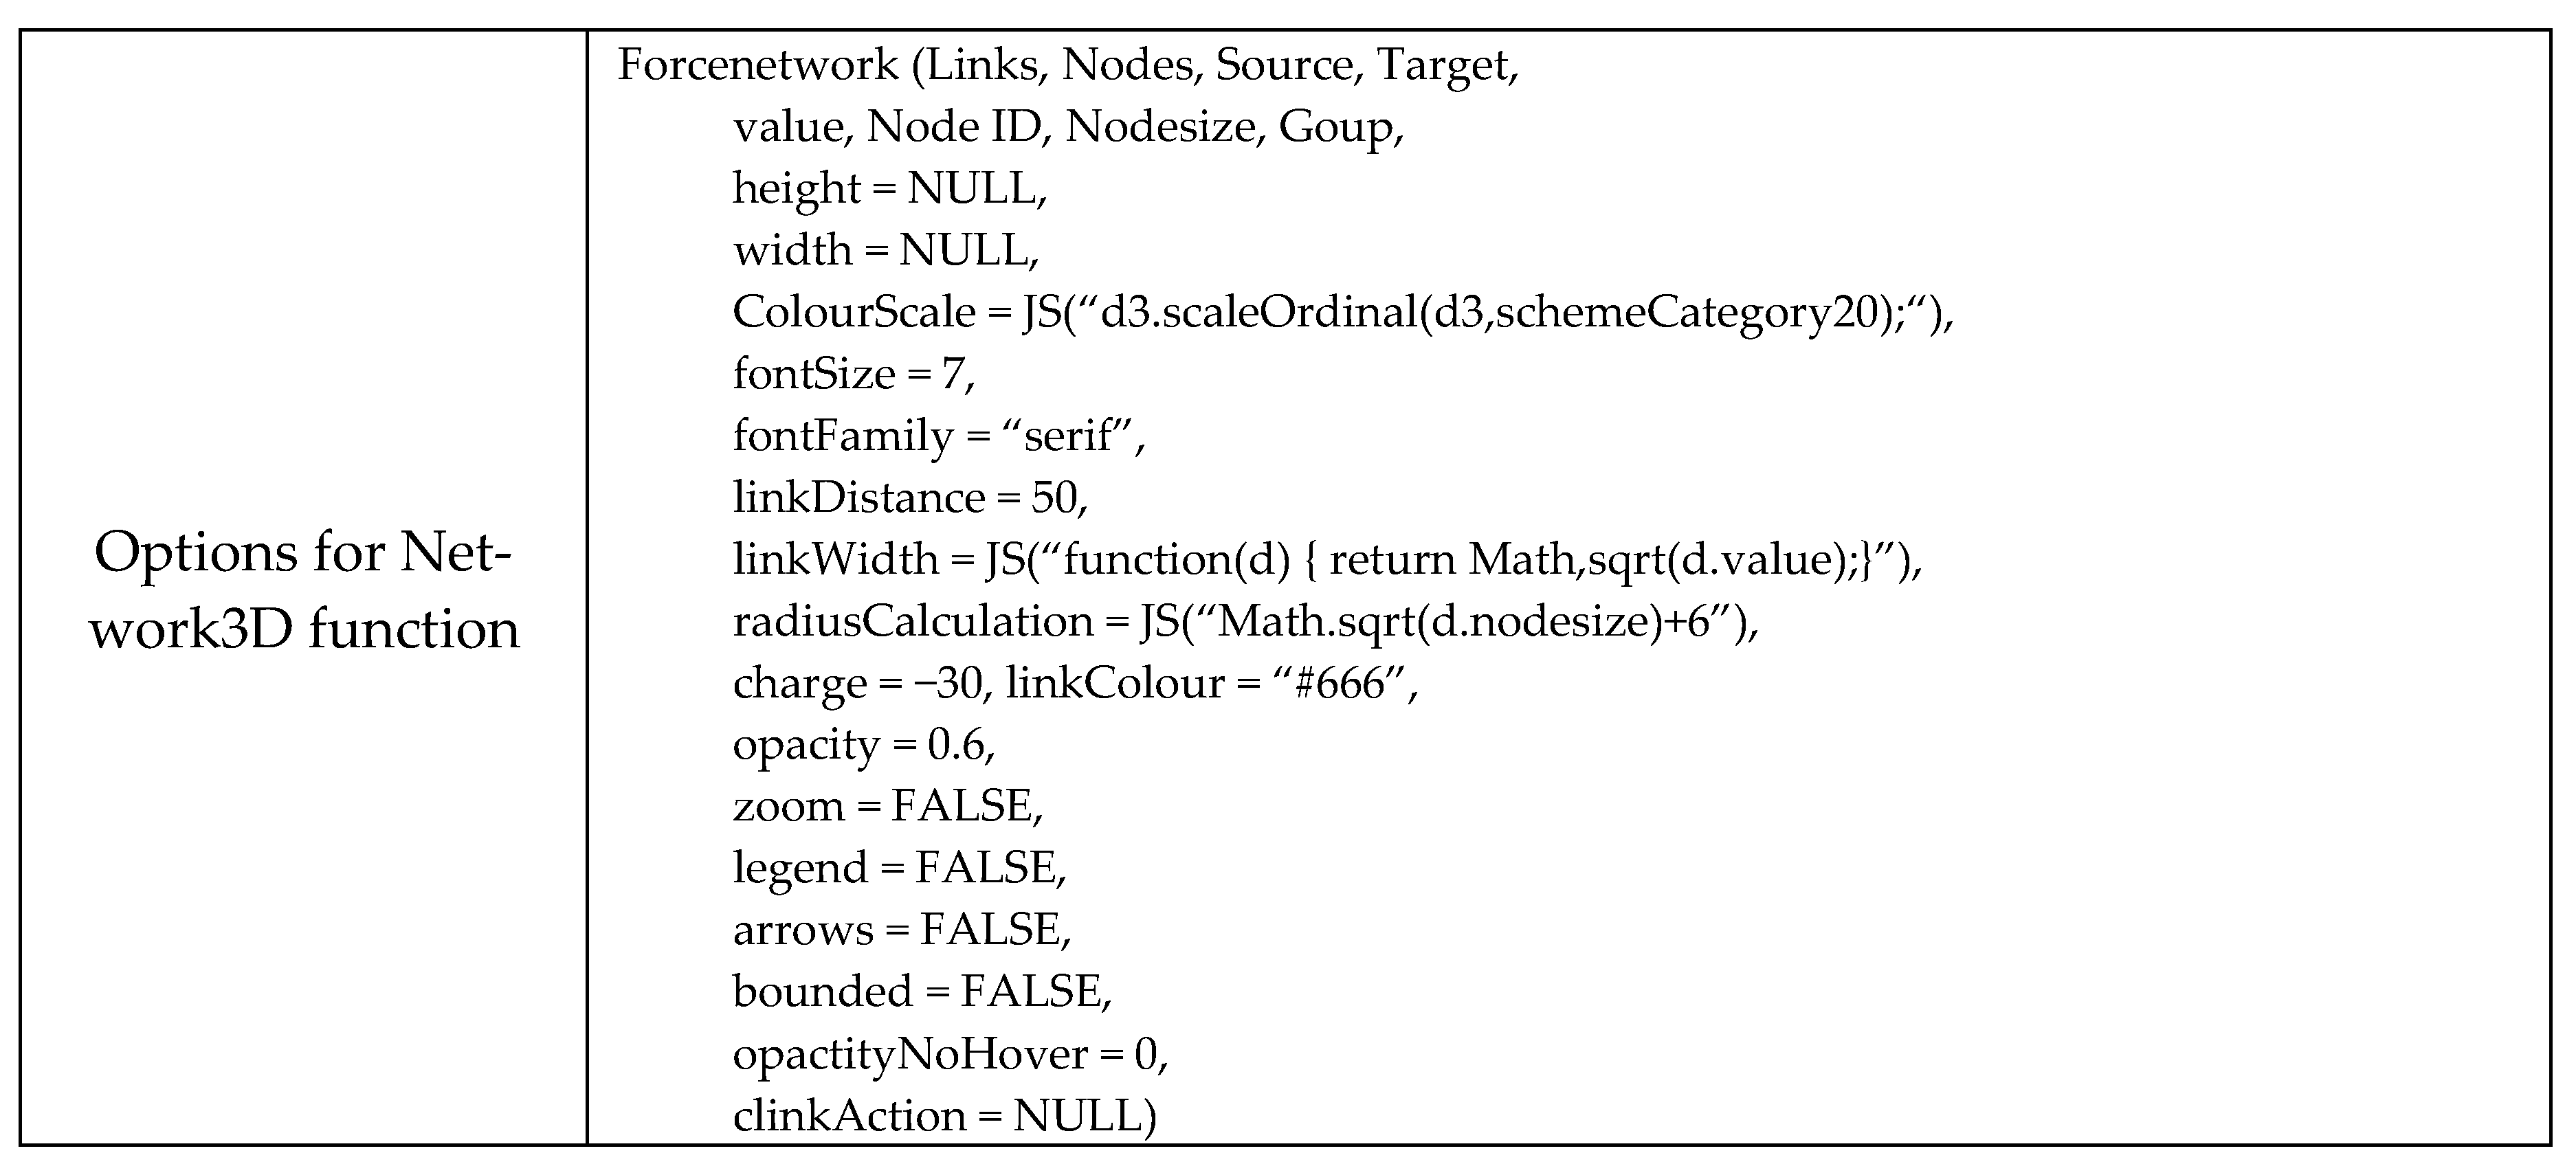
D3.js (forced instruction network graph) from the two data frames. One network includes information for network nodes and the other includes information for network links.
Figure 16 explains
forceNetwork function’s options, and
Figure 17 shows the result from the
forceNetwork function by Network3D.
Additionally,
Figure 17 shows an actual screen capture of real data collection on Instagram. It is the result of using data collected from social media, constructing relationship diagrams through the Network3D and
igraph packages. Based on the amount of data and speed of irregular changes within subject and object users, it was difficult to analyze their correlation.
Therefore,
Figure 17 depicts how actual data from social media may be collected and processed. This is an example of this correlation being studied through the deep learning process.
Figure 18 shows the classification of elements that can be extracted from raw data after data had been collected from one of the public entertainers, or influencers, ‘
Chan Woo Cheong’, who is a famous influencer on both TV and SNS. This is actual data from his Instagram and each string was classified to
₩t, as explained in the deep learning methodology [
29]. The data consist of the actual post, hashtag, tag IDs, and posting IDs as one entity. In addition, other data that can be extracted is also presented, such as the posting ID, posting date, posting time, uploading ID, post texts, public influencer hashtag, commenter IDs, and comments.
6. Conclusions
As social network services currently play a very important role in our society, collecting and analyzing vast amounts of data is an important step for the Deep Learning of Artificial Intelligence. We need an insightful solution because collecting data on social networking service platforms before analyzing the data being collected can be very ineffective. New platforms and services can be built through Deep Learning by applying mesh-up algorithms through different layering of subjects and objects between users so that the data analyzed can be safely used in novel social network services at the same time.
In this research, we provided a method of performing user object layering, showed how to analyze the relationship between subjects and object users, and how to establish the relationship between new object users (i.e., previous subject users) and other object users. This is because the subject in the novel network service is a group of objects surrounded by the subject user, and if each layering is added again, a special relationship, as shown in the various presented figures, between users with different viewpoints and purposes is formed.
The impact of novel social network services around the world is what happens as part of symmetrical relationships with the emotions of many people, so it is necessary to analyze them with Artificial Intelligence. The most commonly used ‘Instagram’ and ‘Bobaedream’ were selected as target SNS platforms, and the results were visualized by collecting, processing, and analyzing data from the accounts of public influencers. Novel social network services that can be reinterpreted from the perspective of subjects from different perspectives (that is, users who were former objects and become subjects again) were combined to cover all events and the object user layering that can occur in countless and symmetrical relationship-oriented networks. This process was implemented with algorithms and Deep Learning. In addition, one data collection tool, Selenium, was used automate programs and mimic the manual use of web browsers, taking advantage of multiple data crawling methods.
In conclusion, based on the data collected from social media, we showed the correlation between interest and attraction in the newly formed network of subjects that are different subjects and objects again, which are both objects and subjects at the same time. Through this research, a safe cyberspace was created to build a safe social network service that can be used with confidence. Future research will focus on preventing social dysfunction by recognizing and blocking potentially problematic user relationships with a mesh-up algorithm.

