Article

Longitudinal Observation of Asymmetric Iron Deposition in an Intracerebral Hemorrhage Model Using Quantitative Susceptibility Mapping

1
Area of Medical Imaging Technology and Science, Department of Medical Physics and Engineering, Division of Health Sciences, Graduate School of Medicine, Osaka University, Osaka 565-0871, Japan
2
Department of Advanced Medical Technologies, National Cerebral and Cardiovascular Center Research Institute, Osaka 564-8565, Japan
*
Author to whom correspondence should be addressed.
Symmetry 2022, 14(2), 350; https://doi.org/10.3390/sym14020350
Submission received: 23 December 2021 / Revised: 17 January 2022 / Accepted: 7 February 2022 / Published: 9 February 2022
(This article belongs to the Special Issue Brain Asymmetry in Evolution II)

Abstract

:
Quantitative susceptibility mapping (QSM) is used to obtain quantitative magnetic susceptibility maps of materials from magnitude and phase images acquired by three-dimensional gradient-echo using inverse problem-solving. Few preclinical studies have evaluated the intracerebral hemorrhage (ICH) model and asymmetric iron deposition. We created a rat model of ICH and compared QSM and conventional magnetic resonance imaging (MRI) during the longitudinal evaluation of ICH. Collagenase was injected in the right striatum of 12-week-old Wistar rats. QSM and conventional MRI were performed on days 0, 1, 7, and 28 after surgery using 7-Tesla MRI. Susceptibility, normalized signal value, and area of the hemorrhage site were statistically compared during image analysis. Susceptibility decreased monotonically up to day 7 but increased on day 28. Other imaging methods showed a significant increase in signal from day 0 to day 1 but a decreasing trend after day 1. During the area evaluation, conventional MRI methods showed an increase from day 0 to day 1; however, decreases were observed thereafter. QSM showed a significant increase from day 0 to day 1. The temporal evaluation of ICH by QSM suggested the possibility of detecting of asymmetric iron deposition for normal brain site.

1. Introduction

1.1. Intracerebral Hemorrhage

Stroke is a common disease that contributes to death worldwide. Intracerebral hemorrhage (ICH) accounts for approximately 10% to 20% of all strokes and is associated with high morbidity and mortality rates [1,2]. Brain damage after ICH can be caused by hematoma lysis, hemoglobin release and degradation, and iron overload in the brain [3,4,5,6,7]. Several studies have already shown that erythrocyte lysis can cause brain edema, neuronal cell death, and neurological damage in animal models [8,9,10]. The clinical setting poses several difficulties when studying ICH. For example, ICH patients are often critically ill and require physiological support; however, most ICH patients may be unsuitable for magnetic resonance imaging (MRI) because of medical instability [11]. Animal models have several advantages when studying ICH because they allow for histological analyses of ICH survivors, initial testing of new therapies, homogeneous experimental groups, and predictable development of ICH [12]. Despite the advantages of animal experiments and the usefulness of iron deposition assessments, to the best of our knowledge, no previous studies have applied quantitative susceptibility mapping (QSM) to animal models of ICH.

1.2. Imaging Techniques for ICH

Computed tomography (CT) and MRI are often the imaging modalities of choice for ICH, depending on the symptoms and time of onset [13]. Noncontrast head CT is the initial neuroimaging modality of choice in most acute situations because of its high sensitivity and specificity, low cost, feasibility for unstable patients, and wide availability. However, the problems with CT scans are their lack of quantitative evaluations and the fact that they are not suitable for follow-up examinations because of radiation exposure issues. However, MRI is often used for follow-up because it is noninvasive and can be repeated. QSM, which is a relatively new technology, has very high sensitivity and specificity for magnetic materials and is also quantitative; therefore, clinical studies of many diseases, including ICH, are being conducted [14,15,16,17,18,19].
CT and MRI for ICH show signal changes based on the elapsed time [20,21,22]. Acute ICH is seen on head CT as a hyperdense lesion. However, over time, the lesion becomes isodense with the brain parenchyma, usually after 1 week; at that time, the sensitivity of CT becomes less than that of MRI [21]. MRI shows changes over time caused by differences in the oxidation/reduction state of hemocyte heme iron and its localization and distribution within and outside the cell. Conventional MRI assesses the hematoma status based on T1 and T2 signal changes. In daily practice, estimating the age of hemorrhage using different MRI sequences is the standard of care; MRI can also distinguish between the two most common etiologies of ICH: arterial hypertensive vasculopathy and cerebral amyloid angiopathy [13].

1.3. QSM

The imaging method of QSM involves multi-echo imaging of magnitude and phase images using three-dimensional (3D) gradient-echo (GRE) [23]. Using the QSM analysis method, magnitude and phase images are first reconstructed from real and imaginary images obtained using 3D-GRE. From the phase image, a global magnetic field map is created by removing the phase fold; from this, a local magnetic field map is obtained by removing the background magnetic field. By estimating the dipole field against it, QSM can be performed. There are several types of QSM reconstruction methods; among these, the morphology-enabled dipole inversion (MEDI) method has been used during many studies because it reduces the appearance of streak artifacts and provides contour information [24]. With ICH, hemoglobin and the resulting iron overload can cause secondary brain damage, including perivascular edema [10]. Therefore, the ability to quantitatively measure the iron component is highly useful in terms of the prognosis. This study aimed to establish a model of ICH and to enhance the basic research of ICH and QSM by comparing QSM with conventional MRI methods longitudinally.

2. Materials and Methods

2.1. Animals

All experimental protocols were approved by the Research Ethics Committee of Osaka University (Number: R02-05-0, Data: 20 November 2020). All experimental procedures involving animals and their care were performed in accordance with the Osaka University Guidelines for Animal Experimentation and the National Institutes of Health Guide for the Care and Use of Laboratory Animals. We used 16 male Wistar rats with a weight of 240 to 333 g that were 12 weeks old (n = 16; Japan SLC, Hamamatsu, Japan). All rats were housed in a controlled vivarium environment (24 °C; 12/12-h light/dark cycle) and fed a standard pellet diet and water ad libitum.

2.2. ICH Models

ICH was produced by bacterial collagenase [25]. First, rats were anesthetized with isoflurane (Pfizer, Tokyo, Japan) and fixed in a stereotactic frame (Stereotaxic Instruments for Rats; Narishige Scientific Instrument Lab, Tokyo, Japan). Next, a scalpel was used to make a sagittal incision in the scalp and detach it under the periosteum. A 1.5-mm-diameter bony window was made with an electric drill 3 mm to the left of the bregma, and a 26-gauge needle was inserted at a depth of 4.5 mm from the dural surface. Then, collagenase (Type Ⅳ; Sigma-Aldrich Japan, Tokyo, Japan) was dissolved in 0.5 µL saline and injected using a microinjector over the course of 5 min. After injection, the needle was promptly removed and the wound was closed, freeing the rat from the frame.

2.3. MRI

Our experiments were performed using 7-Tesla (7T) MRI (PharmaScan 70/16 US; Bruker Biospin, Ettlingen, Germany) equipped with a custom-made transmit/receive volume radiofrequency coil with a diameter of 40 mm (m2 m Imaging Corp., Cleveland, OH, USA) and the ParaVision 6.0 console system (Bruker BioSpin, Billerica, MA, USA). We used 3D-GRE for QSM and conventional MRI (T1-weighted imaging [T1WI], T2-weighted imaging [T2WI], susceptibility-weighted imaging [SWI]), which is often used for follow-up of ICH (Figure 1), for the longitudinal evaluation. QSM was generated using inverse problem-solving and magnitude and phase images acquired by 3D-GRE. These images were obtained under anesthesia with isoflurane (Pfizer, Tokyo, Japan) and respiratory control using a respiratory monitor (Small Animal Instruments, Inc., New York, NY, USA). Body temperature was continuously maintained at 36.0 ± 0.5 °C by circulating water on the heating pad during the entire experiment [26,27].
T1WI images around the rat brain were obtained using the rapid acquisition with relaxation enhancement (RARE) sequence. The sequence parameters were as follows: two-dimensional coronal imaging; repetition time (TR)/echo time (TE), 730/7 ms; RARE factor, 4; field of view, 36 × 36 mm2; matrix, 300 × 300; slice thickness, 0.5 mm; number of averages, 8; and scan time, 5 min 27 s.
T2WI images were acquired using the turbo RARE sequence. The sequence parameters were as follows: two-dimensional coronal; TR/TE, 2800/33 ms; RARE factor, 8; field of view, 36 × 36 mm2; matrix, 300 × 300; slice thickness, 0.5 mm; number of averages, 4; and scan time, 6 min 54 s.
SWI images were acquired using the fast-low angle shot sequence. The sequence parameters were as follows: two-dimensional coronal; TR/TE, 750/18 ms; flip angle, 40°; field of view, 36 × 36 mm2; matrix, 300 × 300; slice thickness, 0.5 mm; number of averages, 2; and scan time, 7 min 30 s.
The QSM sequence parameters were as follows: 3D multi-echo GRE; repetition time/echo time, 100/4 ms; flip angle, 15°; echo images, 5; field of view, 36 × 36 × 10 mm3; matrix, 300 × 300 × 20; number of averages, 2; and scan time, 15 min 4 s. The QSM was calculated using the MEDI method. The algorithm was implemented in MATLAB (The MathWorks, Natick, MA, USA), which is based on the following procedure [24,28,29]: MRI signals were captured at multiple TEs. From the magnitude images, a mask M was created to represent the edge between phases, and from the phase image signals, phase artifacts were removed to create a magnetic field distribution b with no phase wrap. Noise was calculated from the magnitude and phase images of multiple TEs, and W was determined to weigh the calculations. Based on each element created during these steps, susceptibility was sequentially obtained by the MEDI method and mapped.

2.4. MRI Analysis

To quantitatively analyze images obtained using T1WI, T2WI, and SWI, regions of interest (ROIs) were defined in hemorrhagic lesions at each time point (day 0, day 1, day 7, day 28) (Figure 2) and compared with the normal contralateral region. Because QSM is a quantitative image, it was not normalized by the contralateral side, and the ROI was set at the site of the ICH for measurement. The estimated parameter value and area were evaluated on the slice with the largest ICH size by comparing multiple slices.

2.5. Histological Studies

During histological studies, the animals were killed on days 0, 1, 7, and 28 after surgery (n = 2 per timepoint). We used hematoxylin and eosin (HE) staining to observe the tissue morphology. Additionally, we used berlin blue (BB) staining to detect iron in blood components. After MRI image acquisition, the brain was removed and fixed in 4% paraformaldehyde. Then, brains were embedded in paraffin wax. Tissue sections were cut to a thickness of 5 μm using a microtome. Sections were degreased with xylene and rehydrated with a series of ethanol-water washes. After washing with distilled water for 5 min, the sections were incubated with hematoxylin for 4 min and washed three times with purified water for 5 min. Then, sections were incubated with eosin for 2 min and rinsed with purified water for approximately 30 s. Then, sections were rehydrated with a series of ethanol-water washes and degreased with xylene.
Regarding BB staining, after washing three times in distilled water, the sections were incubated with BB staining solution at room temperature for 30 min. The staining solution was prepared by blending 50 mL each of 2% potassium ferrocyanide solution (Sigma-Aldrich Japan, Tokyo, Japan) and 1% hydrochloric acid (Sigma-Aldrich Japan, Tokyo, Japan) in equal volumes. Then, sections were rinsed in running water for 5 min and incubated in cologne echolate solution (Muto Pure Chemicals Co., Tokyo, Japan) for 5 min. Then, sections were rinsed in running water for 30 s and incubated in cologne echolate solution (Muto Pure Chemicals Co., Tokyo, Japan) for 5 min. Finally, after the sections were dehydrated with ethanol, the ethanol in the tissue was replaced with xylene. HE-stained or BB-stained sections were imaged with a BZ-X810 all-in-one fluorescense microscope (Keyence, Osaka, Japan) to visually evaluate the morphology and iron composition of ICH sites.

2.6. Statistical Analysis

Data are expressed as mean ± standard deviations. Differences in susceptibility, normalized values, and areas among groups were analyzed using a one-way analysis of variance with Tukey’s highly significant difference test using Prism (version 9; GraphPad Software, San Diego, CA, USA). Linear regression was used for the correlation analysis; p < 0.05 was considered statistically significant.

3. Results

3.1. MRI Observation

Figure 3 shows the MRI images of QSM and conventional imaging methods longitudinally. Exemplary T1WI, T2WI, and SWI images of the rat brain with ICH at various stages using conventional MRI methods were observed (Figure 3A–L). Furthermore, exemplary QSM with a threshold of susceptibility of −0.3 to 0.3 ppm was observed (Figure 3M–P). Multiple ICH compartments at different stages were illustrated using conventional MRI and QSM. In general, T1WI and T2WI showed hypointensity with internal heterogeneity in the ICH area on day 0, overall hyperintensity on day 1, limbic hypointensity and central mild hyperintensity on day 7, and the characteristic hemosiderin ring. Overall hypointensity of the lesion area was observed on day 27. SWI showed similar signal transitions compared to those observed with T1WI and T2WI, but they were characterized by limbic hypointensity on day 1. During QSM, there were changes in signal intensity and location longitudinally, thus contradicting the signal changes observed with SWI.

3.2. Hemorrhage Signal

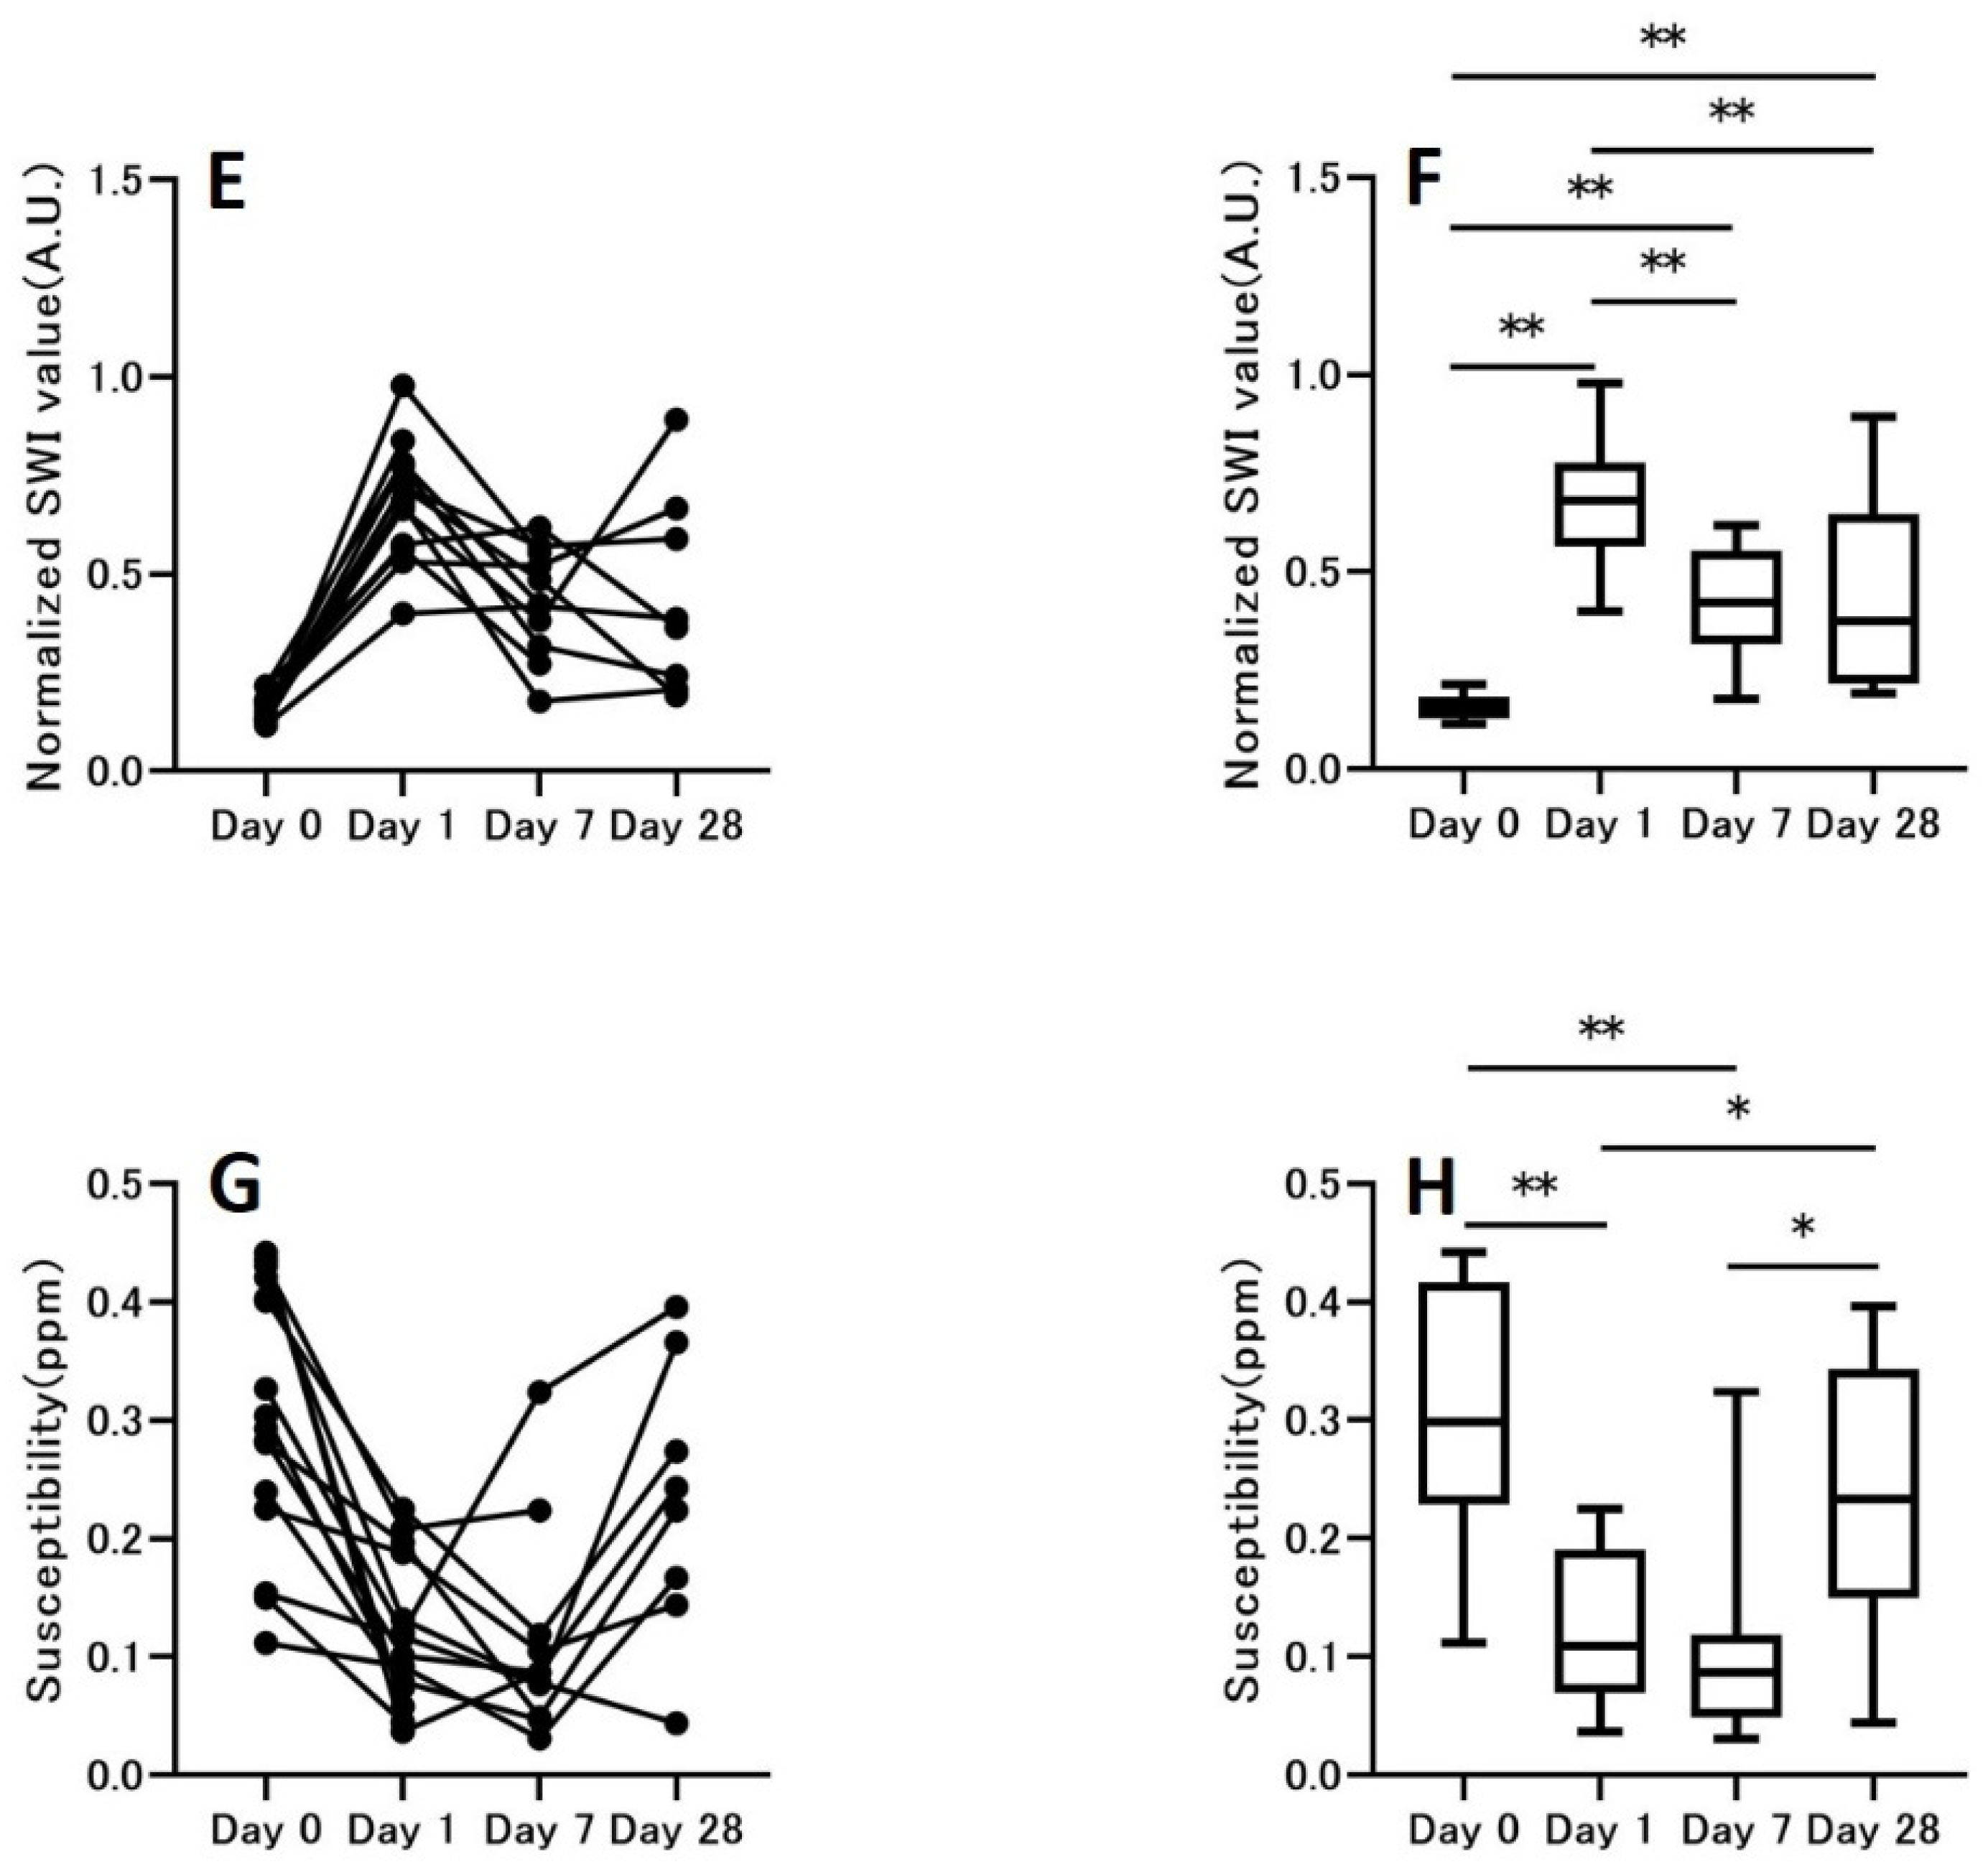
Normalized T1WI, T2WI, SWI, and ICH susceptibility values on days 0, 1, 7, and 28 were compared longitudinally to observe the time evolution (Figure 4). Overall T1WI, T2WI, and SWI values first increased from day 0 to day 1; then, they tended to decrease gradually. Only T1WI values showed a statistically significant decrease between day 7 and day 28. However, susceptibility first decreased until day 7, and then increased significantly (day 0: 0.30 ± 0.10 ppm; day 1: 0.12 ± 0.06 ppm; day 7: 0.12 ± 0.08 ppm; day 28: 0.23 ± 0.10 ppm). When susceptibility of the normal tissue contralateral to the hemorrhage site was measured using QSM, the values were as follows: day 0, −0.03 ± 0.04 ppm; day 1, −0.02 ± 0.03 ppm; day 7, −0.04 ± 0.02 ppm; and day 28, −0.02 ± 0.01 ppm. Susceptibility of the hemorrhage site was significantly higher.

3.3. Hemorrhage Area

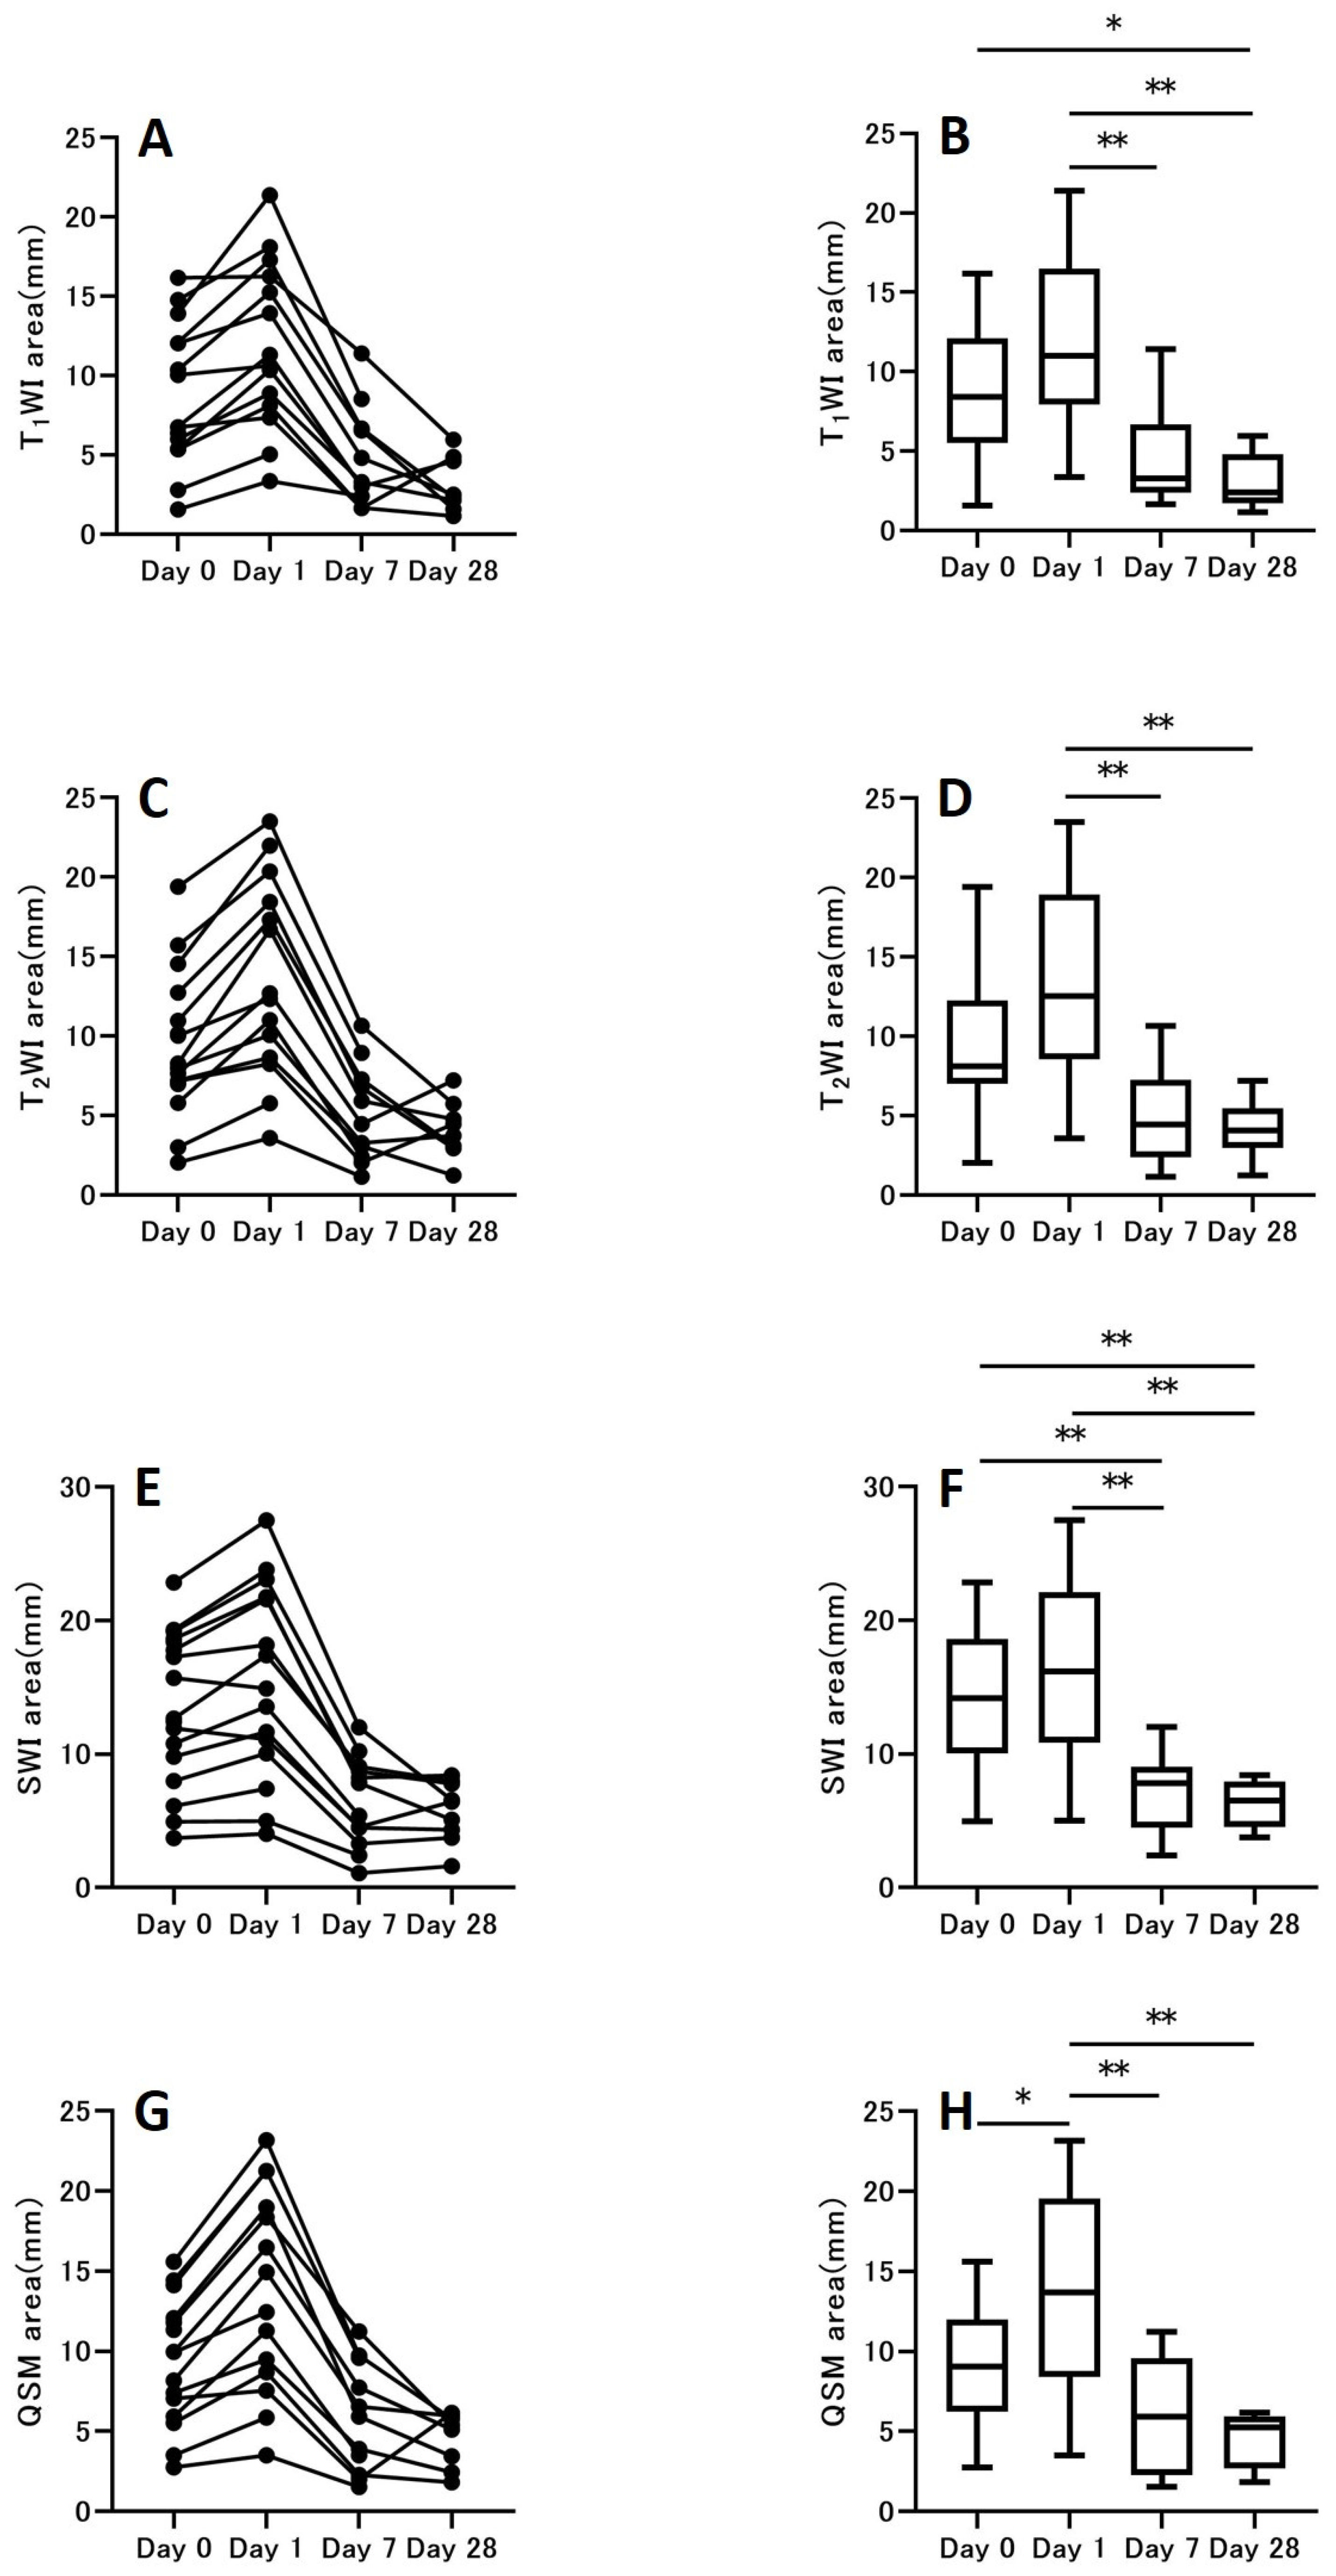
The area changes of the ICH of 16 rats that underwent MRI over time using each imaging method were evaluated (Figure 5). The number of rats decreased over time because of unintentional death and because rats were killed before staining. Conventional MRI and QSM showed increases in the ICH size up to day 1 and decreases in the ICH size thereafter (Figure 5). After day 1, there was a decreasing trend for the area; however, there was little difference in the area between day 7 and day 28 when observed by any of the imaging methods. The area of the ICH site measured using SWI was a larger area than that measured using other methods. This was especially apparent during the hematoma stage with large magnetic susceptibility.
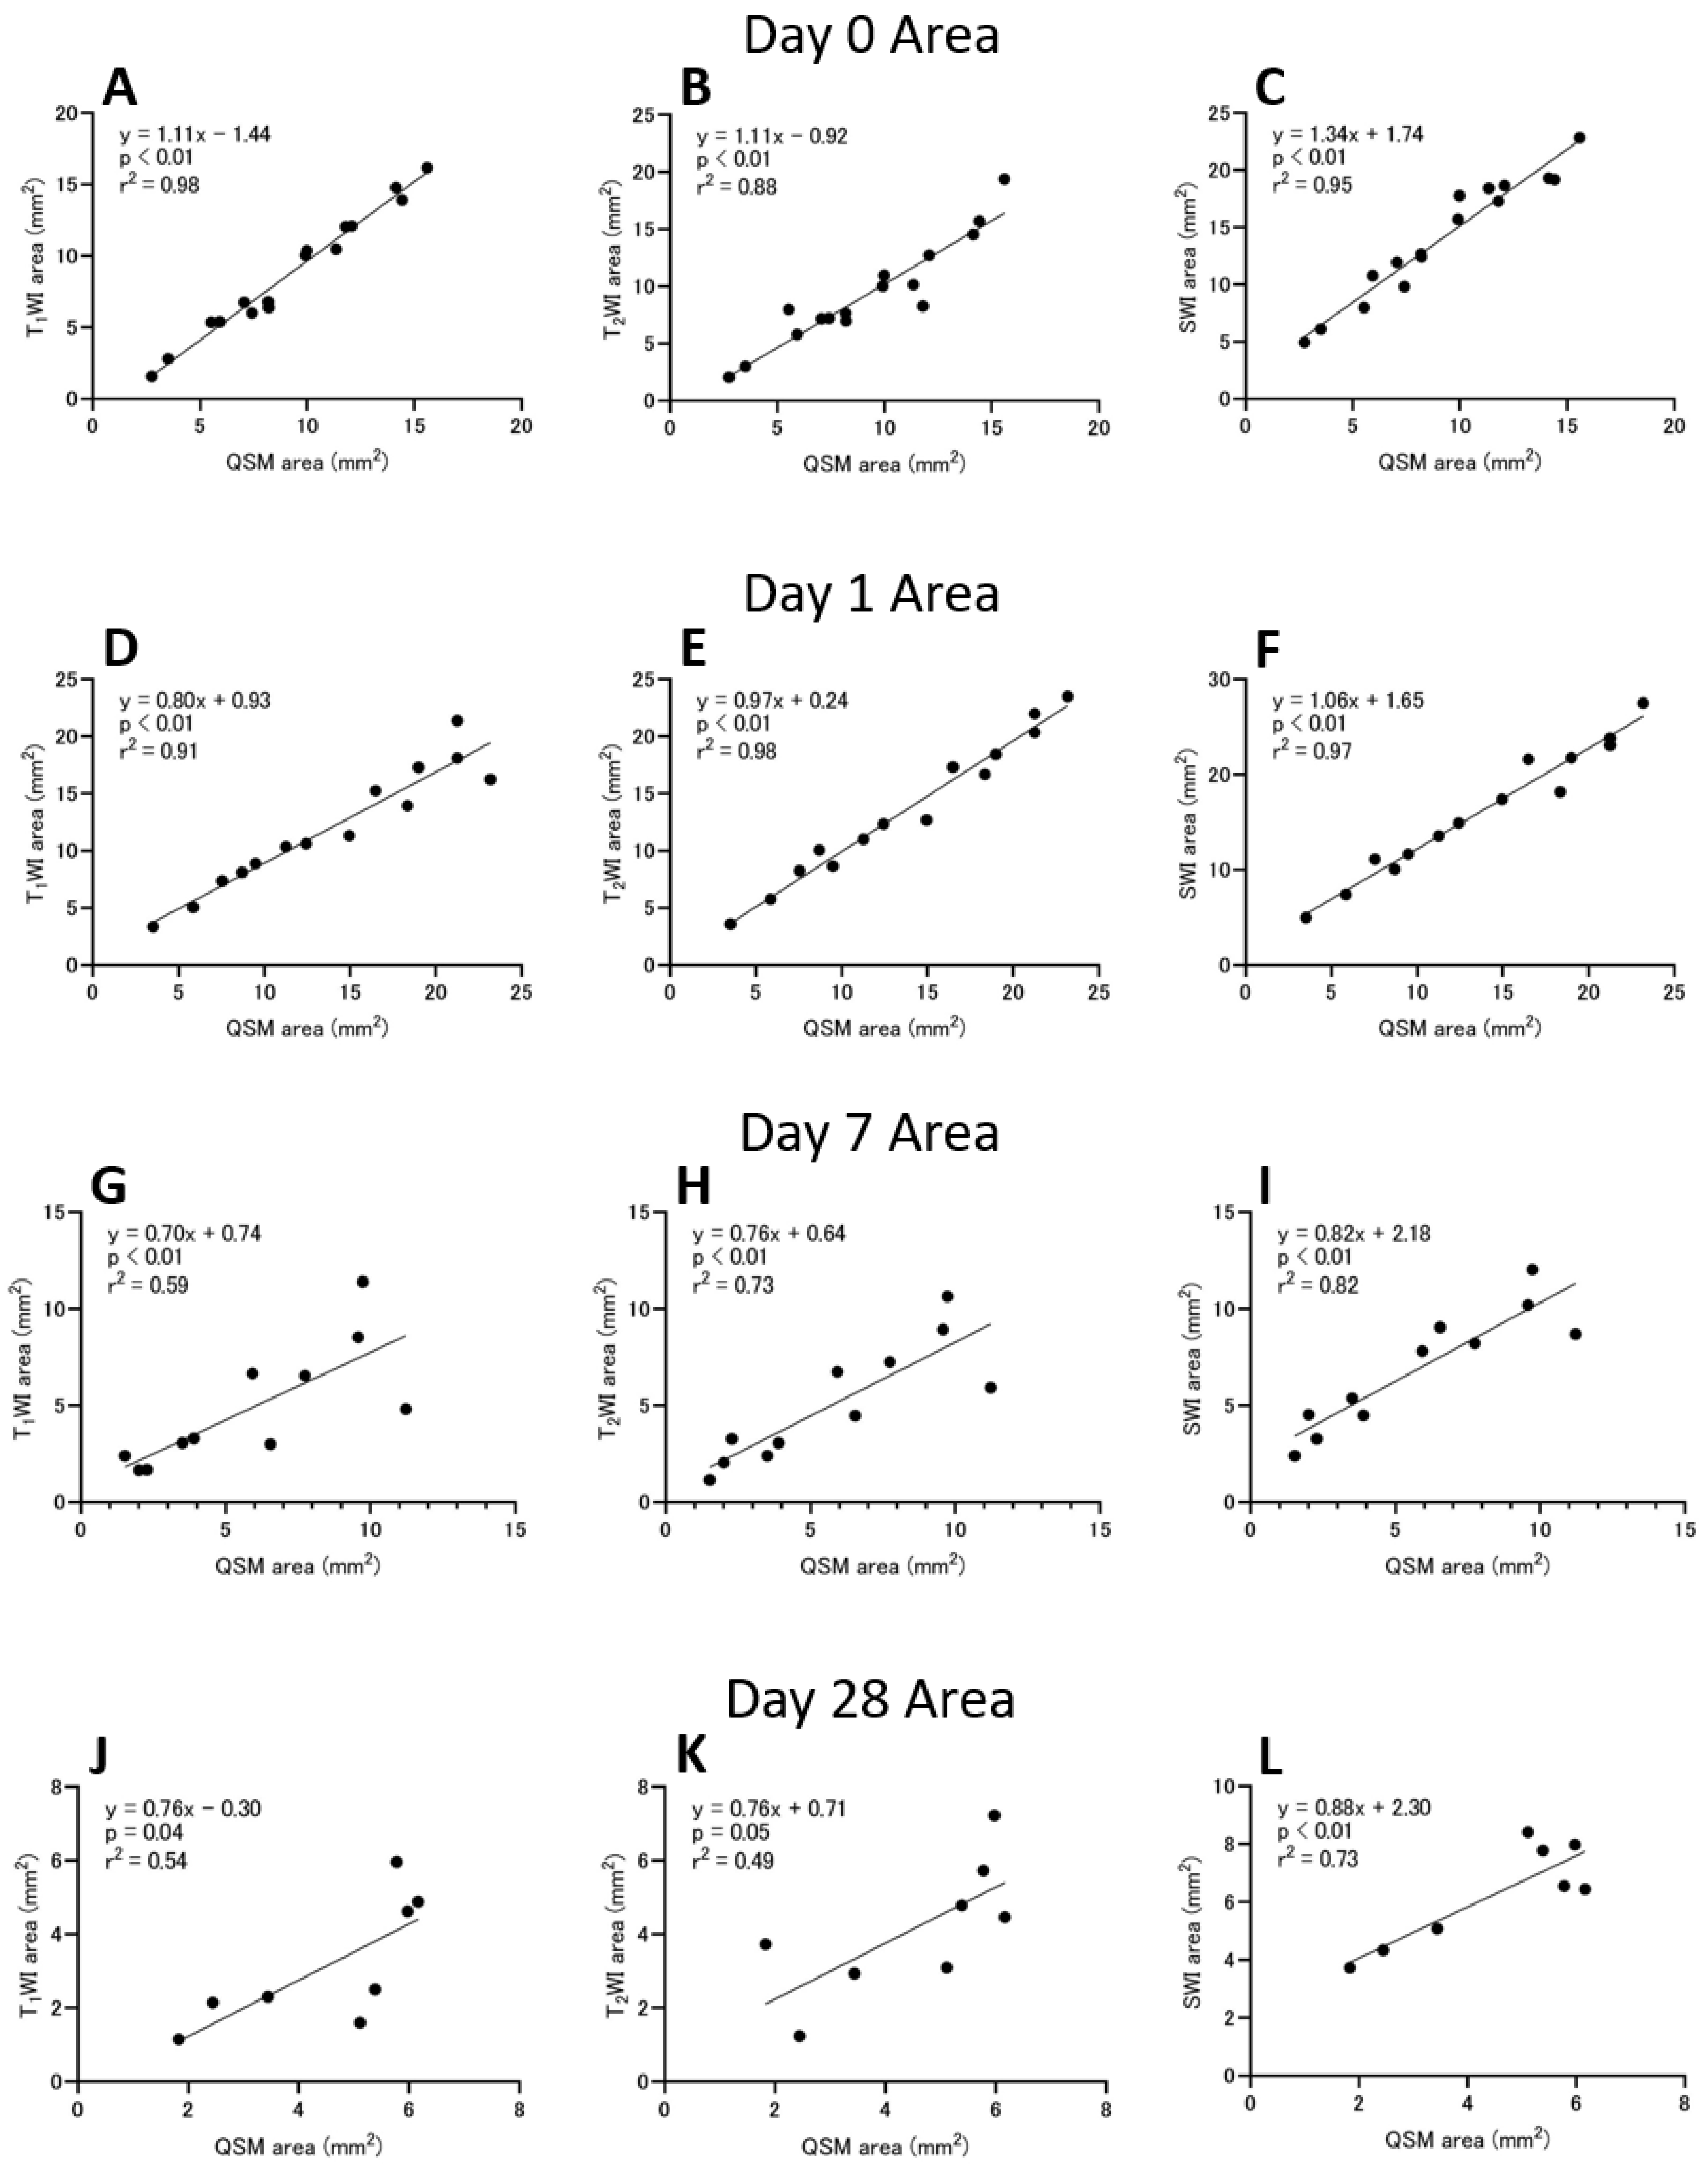
Correlations between QSM and conventional MRI methods with regard to area were evaluated (Figure 6). A high linear correlation with susceptibility was found for SWI at all times (day 0: r2 = 0.95; day 1: r2 = 0.97; day 7: r2 = 0.82; day 28: r2 = 0.73; p < 0.01). However, T1WI and T2WI showed high correlations during the relatively early period after the onset of ICH (day 0: 0.98 [p < 0.01] and 0.88 [p < 0.01]; day 1: 0.91 [p < 0.01] and 0.98 [p < 0.01]) and lower correlations than SWI during the late period (day 7: 0.59 [p < 0.01] and 0.73 [p < 0.01]; day 28: 0.54 [p = 0.04] and 0.49 [p = 0.05]).

3.4. Histological Studies

Figure 7 shows histological sections of the ICH site at various stages (Figure 7A–D shows HE staining; Figure 7E–H shows BB staining). Overall, the area of the ICH site decreased with time when observed using MRI. With BB staining, the bleeding site gradually turned blue from day 0 to day 28.

4. Discussion

To our best knowledge, this is the first study to use QSM to observe the ICH model longitudinally. The temporal evaluation of ICH by QSM suggested the possibility of detecting asymmetric iron deposition. Studies of human ICH are heterogeneous, with different ages in the patient population, different levels of physiological calcification in the basal ganglia, and different old microbleeds in the basal ganglia that affect QSM signal measurements. However, the animals in this study are of the same age, so such problems can be ignored. Our results suggest that QSM can be used in addition to conventional MRI to determine the hematoma stage and iron status. Quantitative evaluation of iron deposition at the site of ICH is highly useful in terms of evaluating the stage and prognosis [10]. QSM demonstrated that susceptibility at the ICH site was highest on day 0, followed by a decreasing trend until day 7; however, the value increased again on day 28. Additionally, the area was found to be the largest on day 1 during our observation.

4.1. Comparison with Previous Studies of ICH Models

Some previous studies of human ICH have demonstrated that ICH can be classified into at least five stages (hyperacute, acute, early subacute, late subacute, and chronic) based on the redox status of heme iron in blood cells and its localization and distribution in and out of cells when observed using MRI [30,31,32,33]. During a previous study using rats, the T2WI findings suggested that the disease enters the hyperacute stage (long T2 value) at 0 to 6 h, the acute or early subacute stage (short T2 value) at 24 to 72 h, and the chronic stage (short T2 value) at 7 days [34]. During the present study, T2WI showed almost the same trend, with hypointense lesions with a faint isosignal on day 0, generally hyperintense lesions on day 1, and hyperintense central areas and hypointense limbic areas on day 7. With human ICHs, T2WI is supposed to show hypointensity during the early subacute stage; however, during this study, it showed hyperintensity. This suggests that erythrocyte membrane degradation may already occur with rat ICHs during the early subacute phase, which is consistent with the findings of preclinical studies of rats and dogs with ICH [35,36]. We observed ICH models using other conventional imaging methods (T1WI, SWI) and a relatively new method, QSM, in addition to T2WI. During a previous study by Sun et al. [37] using QSM for human ICH longitudinally, observations were made using T1WI and SWI, similar to the present study. It should be noted that susceptibility measured by QSM at 2, 7, and 28 days after the onset of ICH decreased monotonically with time (day 2: 1.38 ppm; day 7: 1.12 ppm; day 28: 0.66 ppm). However, during a previous study by Chang et al. [38] that observed human ICH using QSM at various stages classified based on characteristic signal intensity patterns observed using T1WI, T2WI-fluid-attenuated inversion recovery, T2*WI, and CT, the highest susceptibility was observed during the acute stage (deoxyhemoglobin); then, susceptibility decreased until the late subacute phase (extracellular methemoglobin). However, it increased again during the chronic phase (hemosiderin) (hyperacute: 0.57 ± 0.48 ppm; acute: 1.30 ± 0.33 ppm; early subacute: 1.14 ± 0.46 ppm; late subacute: 0.40 ± 0.13 ppm; chronic phase: 0.71 ± 0.31 ppm). During this study, susceptibility was highest on day 0 and showed a decreasing trend until day 7; however, on day 28, susceptibility increased again. Based on the previous study and the current multiparameter observations, our ICH models suggest a transition to the acute phase (mixture of oxyhemoglobin and deoxyhemoglobin) on day 0, to the late subacute phase (extracellular methemoglobin) on day 1, to the chronic phase (limbic hemosiderin and central extracellular methemoglobin) on day 7, and to the chronic phase (hemosiderin) on day 28.
Regarding the quantitative evaluation using QSM, during a previous study by Sun et al. [37], susceptibility values were 1.38 ppm on day 2, 1.12 ppm on day 7, and 0.66 ppm on day 28. Furthermore, during another previous study by Chang et al. [38], susceptibility values were 0.57 ± 0.48 ppm during the hyperacute phase, 1.30 ± 0.33 ppm during the acute phase, 1.14 ± 0.46 ppm during the early subacute phase, 0.40 ± 0.13 ppm during the late subacute phase, and 0.71 ± 0.31 ppm during the chronic phase. In comparison with these results, our results (day 0: 0.30 ± 0.10 ppm; day 1: 0.12 ± 0.06 ppm; day 7: 0.12 ± 0.08 ppm; day 28: 0.23 ± 0.10 ppm) showed lower susceptibility at each timepoint. We could not find any study that evaluated QSM in a rat model of ICH. Santin et al. previously indicated that there were differences in susceptibility and reproducibility depending on the processing method [39]. In particular, when comparing clinical MRI with preclinical research MRI, the difference in the size of the object relative to the coil and the accuracy of the magnetic field correction will have significant impacts.

4.2. Contrast Mechanism of Bleeding

QSM can eliminate blooming artifacts when using conventional T2*WI [40] and can accurately define the distribution of magnetic biomaterials when using MRI [41]. During our study, with the exception of day 1, SWI and QSM showed conflicting signals, suggesting that QSM can be used to observe asymmetry iron components for normal areas of the brain. When blood is broken-down by hemorrhage, susceptibility gradually increases from oxyhemoglobin (diamagnetic) to deoxyhemoglobin (paramagnetic with four unpaired electrons in Fe2+), methemoglobin (strongly paramagnetic with five unpaired electrons in Fe3+), and hemosiderin (super paramagnetic with possible magnetic domain formation or ferromagnetic) [20,42,43,44]. Tissue stained with BB showed blue color on day 7, and clearer blue staining was observed on day 28. This suggests that the change to Fe3+ occurred on day 7, and that the number of components transitioning to hemosiderin increases with time. In fact, susceptibility also increased from day 7 to day 28, and T1WI or T2WI also showed the characteristic signal change of hemosiderin.

4.3. ICH Area

During our study, the ICH size on day 1 was the largest according to all imaging methods. A previous study [45] that observed ICH models at shorter intervals than those used during our study also reported that the collagenase injection model showed the largest hematoma volume at 2 days after surgery, which is consistent with the present results. The ICH size and volume are considered the most powerful predictors of the prognosis [46]. In other words, accurate measurements of these are considered important because they are the main imaging markers of the prognosis [46]. However, T2*WI and SWI, which are considered more sensitive to magnetic materials than other conventional methods, have difficulty accurately assessing ICH size because of blooming artifacts that are attributable to imaging parameters [46,47]. In fact, SWI overestimated the ICH area compared to other imaging methods during our study, especially when susceptibility was large, suggesting that the overestimation was caused by magnetic materials. During this study, SWI showed the highest overall correlation with QSM when measuring the ICH area compared to other imaging methods. A previous study by Belayev et al. [34] indicated that T2WI had a stronger correlation with histological volume based on HE staining than SWI at 7 days after onset. Therefore, it is possible that QSM is strongly affected by the magnitude image during reconstruction, and it is necessary to examine it using a different reconstruction method and imaging parameters.

4.4. Limitations

There were several limitations to our study. First, the limited timepoints of MRI (day 0, day 1, day 7, and day 28) may have prevented us from obtaining the detailed condition of the hematoma status changes, especially during the acute phase. Because previous studies have reported different imaging timepoints and shorter intervals, it may be necessary to increase the number of imaging timepoints and use shorter intervals to investigate the signal changes of the ICH in more detail. Second, because this study used MRI (T1WI, T2WI, SWI, QSM) and tissue staining (HE staining and BB staining), the information obtained may have been limited. Histological staining could not be statistically analyzed because only two animals were observed at each imaging timepoint. In addition to the evaluation methods used during this study, we applied diffusion-weighted imaging [48,49,50] and chemical exchange saturation transfer [51] as observation methods for rats with ICH. CT [37,38], which is the gold standard for the diagnosis of cerebral hemorrhage in clinical practice, may enable a more detailed evaluation. Furthermore, it has been suggested that the observation of ICH models using immunochemical staining and immunofluorescent antibody methods, which were not used during this study, would be useful [36]. Third, we could not completely reproduce human ICH because we only observed a model of ICH induced by collagenase injection. Previous studies have reported that this model mimics human intraparenchymal hemorrhage [45,52]. However, the disadvantages of this model are related to bacterial collagenase’s ability to introduce a significant inflammatory reaction [52]. Given this, this model may not be the best model for human basal ganglia hemorrhage secondary to hypertensive vascular disease. We believe that observations using a different model will enable us to elucidate the pathogenesis of human ICH in more detail. Finally, it is necessary to create QSM using different imaging parameters and reconstruction methods. During this study, we used the MEDI method [24], which has been used during many previous studies, as the reconstruction method. Because susceptibility differed from that reported by previous studies of human ICH, it is necessary to confirm whether susceptibility changes when applying different imaging parameters and reconstruction methods.

5. Conclusions

During this preclinical study using a rat model of ICH, the temporal evaluation of ICH using QSM suggested the possibility of detecting of asymmetric iron deposition in relation for normal areas of the brain. This has not been observed with conventional techniques.

Author Contributions

Conceptualization, K.T., R.O., R.S., N.A., J.U. and S.S.; methodology, K.T. and S.S..; investigation, K.T.; data curation, K.T. and S.S.; writing—original draft preparation, K.T. and S.S.; writing—review and editing, K.T. and S.S.; supervision, S.S.; funding acquisition, S.S. All authors have read and agreed to the published version of the manuscript.

Funding

This research was funded by the Japan Society for the Promotion of Science (JSPS) KAKENHI (grant number 19K08172) and the Agency for Medical Research and Development (AMED) (grant numbers JP19dm0307026 and 20dm0307026h00030. This work was the result of using research equipment shared by the MEXT Project for promoting public utilization of advanced research infrastructure (program for supporting construction of core facilities) (grant number JPMXS0450400021).

Institutional Review Board Statement

Not applicable.

Informed Consent Statement

Not applicable.

Data Availability Statement

Not applicable.

Conflicts of Interest

The authors declare no conflict of interest.

References

  1. Feigin, V.L.; Lawes, C.M.; Bennett, D.A.; Barker-Collo, S.L.; Parag, V. Worldwide stroke incidence and early case fatality reported in 56 population-based studies: A systematic review. Lancet Neurol. 2009, 8, 355–369. [Google Scholar] [CrossRef]
  2. Sacco, S.; Totaro, R.; Toni, D.; Marini, C.; Cerone, D.; Carolei, A. Incidence, case-fatalities and 10-year survival of subarachnoid hemorrhage in a population-based registry. Eur. Neurol. 2009, 62, 155–160. [Google Scholar] [CrossRef] [PubMed]
  3. Keep, R.F.; Hua, Y.; Xi, G. Intracerebral haemorrhage: Mechanisms of injury and therapeutic targets. Lancet Neurol. 2012, 11, 720–731. [Google Scholar] [CrossRef] [Green Version]
  4. Xi, G.; Keep, R.F.; Hoff, J.T. Mechanisms of brain injury after intracerebral haemorrhage. Lancet Neurol. 2006, 5, 53–63. [Google Scholar] [CrossRef]
  5. Xiong, X.Y.; Wang, J.; Qian, Z.M.; Yang, Q.W. Iron and intracerebral hemorrhage: From mechanism to translation. Transl. Stroke Res. 2014, 5, 429–441. [Google Scholar] [CrossRef]
  6. Xiong, X.Y.; Yang, Q.W. Rethinking the roles of inflammation in the intracerebral hemorrhage. Transl. Stroke Res. 2015, 6, 339–341. [Google Scholar] [CrossRef] [Green Version]
  7. Selim, M.; Sheth, K.N. Perihematoma edema: A potential translational target in intracerebral hemorrhage? Transl. Stroke Res. 2015, 6, 104–106. [Google Scholar] [CrossRef] [Green Version]
  8. Song, S.; Hua, Y.; Keep, R.F.; Hoff, J.T.; Xi, G. A new hippocampal model for examining intracerebral hemorrhage-related neuronal death: Effects of deferoxamine on hemoglobin-induced neuronal death. Stroke 2007, 38, 2861–2863. [Google Scholar] [CrossRef] [Green Version]
  9. Hua, Y.; Schallert, T.; Keep, R.F.; Wu, J.; Hoff, J.T.; Xi, G. Behavioral tests after intracerebral hemorrhage in the rat. Stroke 2002, 33, 2478–2484. [Google Scholar] [CrossRef] [Green Version]
  10. Xi, G.; Keep, R.F.; Hoff, J.T. Erythrocytes and delayed brain edema formation following intracerebral hemorrhage in rats. J. Neurosurg. 1998, 89, 991–996. [Google Scholar] [CrossRef]
  11. Kirkman, M.A.; Allan, S.M.; Parry-Jones, A.R. Experimental intracerebral hemorrhage: Avoiding pitfalls in translational research. J. Cereb. Blood Flow Metab. 2011, 31, 2135–2151. [Google Scholar] [CrossRef] [PubMed] [Green Version]
  12. Weingarten, K.; Zimmerman, R.D.; Deo-Narine, V.; Markisz, J.; Cahill, P.T.; Deck, M.D. MR imaging of acute intracranial hemorrhage: Findings on sequential spin-echo and gradient-echo images in a dog model. AJNR Am. J. Neuroradiol. 1991, 12, 457–467. [Google Scholar] [PubMed]
  13. Hakimi, R.; Garg, A. Imaging of Hemorrhagic Stroke. Continuum 2016, 22, 1424–1450. [Google Scholar] [CrossRef] [PubMed]
  14. Acosta-Cabronero, J.; Williams, G.B.; Cardenas-Blanco, A.; Arnold, R.J.; Lupson, V.; Nestor, P.J. In vivo quantitative susceptibility mapping (QSM) in Alzheimer’s disease. PLoS ONE 2013, 8, e81093. [Google Scholar] [CrossRef]
  15. Chen, W.; Gauthier, S.A.; Gupta, A.; Comunale, J.; Liu, T.; Wang, S.; Pei, M.; Pitt, D.; Wang, Y. Quantitative susceptibility mapping of multiple sclerosis lesions at various ages. Radiology 2014, 271, 183–192. [Google Scholar] [CrossRef] [Green Version]
  16. Eskreis-Winkler, S.; Zhang, Y.; Zhang, J.; Liu, Z.; Dimov, A.; Gupta, A.; Wang, Y. The clinical utility of QSM: Disease diagnosis, medical management, and surgical planning. NMR Biomed. 2017, 30, e3668. [Google Scholar] [CrossRef]
  17. Murakami, Y.; Kakeda, S.; Watanabe, K.; Ueda, I.; Ogasawara, A.; Moriya, J.; Ide, S.; Futatsuya, K.; Sato, T.; Okada, K.; et al. Usefulness of quantitative susceptibility mapping for the diagnosis of Parkinson disease. AJNR Am. J. Neuroradiol. 2015, 36, 1102–1108. [Google Scholar] [CrossRef] [Green Version]
  18. Schweitzer, A.D.; Liu, T.; Gupta, A.; Zheng, K.; Seedial, S.; Shtilbans, A.; Shahbazi, M.; Lange, D.; Wang, Y.; Tsiouris, A.J. Quantitative susceptibility mapping of the motor cortex in amyotrophic lateral sclerosis and primary lateral sclerosis. AJR Am. J. Roentgenol. 2015, 204, 1086–1092. [Google Scholar] [CrossRef] [Green Version]
  19. Thomas, G.E.C.; Leyland, L.A.; Schrag, A.E.; Lees, A.J.; Acosta-Cabronero, J.; Weil, R.S. Brain iron deposition is linked with cognitive severity in Parkinson’s disease. J. Neurol. Neurosurg. Psychiatry 2020, 91, 418–425. [Google Scholar] [CrossRef] [Green Version]
  20. Bradley, W.G., Jr. MR appearance of hemorrhage in the brain. Radiology 1993, 189, 15–26. [Google Scholar] [CrossRef]
  21. Domingues, R.; Rossi, C.; Cordonnier, C. Diagnostic evaluation for nontraumatic intracerebral hemorrhage. Neurol. Clin. 2015, 33, 315–328. [Google Scholar] [CrossRef] [PubMed]
  22. Morgenstern, L.B.; Hemphill, J.C., III; Anderson, C.; Becker, K.; Broderick, J.P.; Connolly, E.S., Jr.; Greenberg, S.M.; Huang, J.N.; MacDonald, R.L.; Messe, S.R.; et al. Guidelines for the management of spontaneous intracerebral hemorrhage: A guideline for healthcare professionals from the American Heart Association/American Stroke Association. Stroke 2010, 41, 2108–2129. [Google Scholar] [CrossRef] [PubMed] [Green Version]
  23. Liu, C.; Li, W.; Tong, K.A.; Yeom, K.W.; Kuzminski, S. Susceptibility-weighted imaging and quantitative susceptibility mapping in the brain. J. Magn. Reson. Imaging 2015, 42, 23–41. [Google Scholar] [CrossRef] [PubMed] [Green Version]
  24. Liu, T.; Liu, J.; de Rochefort, L.; Spincemaille, P.; Khalidov, I.; Ledoux, J.R.; Wang, Y. Morphology enabled dipole inversion (MEDI) from a single-angle acquisition: Comparison with COSMOS in human brain imaging. Magn. Reson. Med. 2011, 66, 777–783. [Google Scholar] [CrossRef] [PubMed]
  25. MacLellan, C.L.; Davies, L.M.; Fingas, M.S.; Colbourne, F. The influence of hypothermia on outcome after intracerebral hemorrhage in rats. Stroke 2006, 37, 1266–1270. [Google Scholar] [CrossRef] [Green Version]
  26. Ohki, A.; Saito, S.; Hirayama, E.; Takahashi, Y.; Ogawa, Y.; Tsuji, M.; Higuchi, T.; Fukuchi, K. Comparison of Chemical Exchange Saturation Transfer Imaging with Diffusion-weighted Imaging and Magnetic Resonance Spectroscopy in a Rat Model of Hypoxic-ischemic Encephalopathy. Magn. Reson. Med. Sci. 2020, 19, 359–365. [Google Scholar] [CrossRef] [PubMed] [Green Version]
  27. Saito, S.; Takahashi, Y.; Ohki, A.; Shintani, Y.; Higuchi, T. Early detection of elevated lactate levels in a mitochondrial disease model using chemical exchange saturation transfer (CEST) and magnetic resonance spectroscopy (MRS) at 7T-MRI. Radiol. Phys. Technol. 2019, 12, 46–54. [Google Scholar] [CrossRef]
  28. Liu, J.; Liu, T.; de Rochefort, L.; Ledoux, J.; Khalidov, I.; Chen, W.; Tsiouris, A.J.; Wisnieff, C.; Spincemaille, P.; Prince, M.R.; et al. Morphology enabled dipole inversion for quantitative susceptibility mapping using structural consistency between the magnitude image and the susceptibility map. Neuroimage 2012, 59, 2560–2568. [Google Scholar] [CrossRef] [Green Version]
  29. Liu, T.; Xu, W.; Spincemaille, P.; Avestimehr, A.S.; Wang, Y. Accuracy of the morphology enabled dipole inversion (MEDI) algorithm for quantitative susceptibility mapping in MRI. IEEE Trans. Med. Imaging 2012, 31, 816–824. [Google Scholar] [CrossRef] [Green Version]
  30. Peeling, J.; Del Bigio, M.R.; Corbett, D.; Green, A.R.; Jackson, D.M. Efficacy of disodium 4-[(tert-butylimino)methyl]benzene-1,3-disulfonate N-oxide (NXY-059), a free radical trapping agent, in a rat model of hemorrhagic stroke. Neuropharmacology 2001, 40, 433–439. [Google Scholar] [CrossRef]
  31. Peeling, J.; Yan, H.J.; Chen, S.G.; Campbell, M.; Del Bigio, M.R. Protective effects of free radical inhibitors in intracerebral hemorrhage in rat. Brain Res. 1998, 795, 63–70. [Google Scholar] [CrossRef]
  32. Peeling, J.; Yan, H.J.; Corbett, D.; Xue, M.; Del Bigio, M.R. Effect of FK-506 on inflammation and behavioral outcome following intracerebral hemorrhage in rat. Exp. Neurol. 2001, 167, 341–347. [Google Scholar] [CrossRef] [PubMed]
  33. Tone, O.; Ito, U.; Tomita, H.; Masaoka, H.; Tominaga, B. High colloid oncotic therapy for brain edema with cerebral hemorrhage. Acta Neurochir. Suppl. 1994, 60, 568–570. [Google Scholar] [CrossRef] [PubMed]
  34. Belayev, L.; Obenaus, A.; Zhao, W.; Saul, I.; Busto, R.; Wu, C.; Vigdorchik, A.; Lin, B.; Ginsberg, M.D. Experimental intracerebral hematoma in the rat: Characterization by sequential magnetic resonance imaging, behavior, and histopathology. Effect of albumin therapy. Brain Res. 2007, 1157, 146–155. [Google Scholar] [CrossRef]
  35. An, D.; Park, J.; Shin, J.I.; Kim, H.J.; Jung, D.I.; Kang, J.H.; Kim, G.; Chang, D.W.; Sur, J.H.; Yang, M.P.; et al. Temporal Evolution of MRI Characteristics in Dogs with Collagenase-Induced Intracerebral Hemorrhage. Comp. Med. 2015, 65, 517–525. [Google Scholar]
  36. Dang, G.; Yang, Y.; Wu, G.; Hua, Y.; Keep, R.F.; Xi, G. Early Erythrolysis in the Hematoma after Experimental Intracerebral Hemorrhage. Transl. Stroke Res. 2017, 8, 174–182. [Google Scholar] [CrossRef] [Green Version]
  37. Sun, H.; Klahr, A.C.; Kate, M.; Gioia, L.C.; Emery, D.J.; Butcher, K.S.; Wilman, A.H. Quantitative Susceptibility Mapping for Following Intracranial Hemorrhage. Radiology 2018, 288, 830–839. [Google Scholar] [CrossRef] [Green Version]
  38. Chang, S.; Zhang, J.; Liu, T.; Tsiouris, A.J.; Shou, J.; Nguyen, T.; Leifer, D.; Wang, Y.; Kovanlikaya, I. Quantitative Susceptibility Mapping of Intracerebral Hemorrhages at Various Stages. J. Magn. Reson. Imaging 2016, 44, 420–425. [Google Scholar] [CrossRef] [Green Version]
  39. Santin, M.D.; Didier, M.; Valabregue, R.; Yahia Cherif, L.; Garcia-Lorenzo, D.; Loureiro de Sousa, P.; Bardinet, E.; Lehericy, S. Reproducibility of R2 * and quantitative susceptibility mapping (QSM) reconstruction methods in the basal ganglia of healthy subjects. NMR Biomed. 2017, 30, e3491. [Google Scholar] [CrossRef]
  40. Li, J.; Chang, S.; Liu, T.; Wang, Q.; Cui, D.; Chen, X.; Jin, M.; Wang, B.; Pei, M.; Wisnieff, C.; et al. Reducing the object orientation dependence of susceptibility effects in gradient echo MRI through quantitative susceptibility mapping. Magn. Reson. Med. 2012, 68, 1563–1569. [Google Scholar] [CrossRef] [Green Version]
  41. Wang, Y.; Liu, T. Quantitative susceptibility mapping (QSM): Decoding MRI data for a tissue magnetic biomarker. Magn. Reson. Med. 2015, 73, 82–101. [Google Scholar] [CrossRef] [PubMed] [Green Version]
  42. Heier, L.A.; Amster, J.L.; Zimmerman, R.D.; Deck, M.D. Focal recurrent hemorrhage on magnetic resonance at 0.5 tesla. An aid to the diagnosis of cryptic cerebral vascular malformations. Acta Radiol. Suppl. 1986, 369, 113–115. [Google Scholar] [PubMed]
  43. Liu, T.; Surapaneni, K.; Lou, M.; Cheng, L.; Spincemaille, P.; Wang, Y. Cerebral microbleeds: Burden assessment by using quantitative susceptibility mapping. Radiology 2012, 262, 269–278. [Google Scholar] [CrossRef] [PubMed] [Green Version]
  44. Zimmerman, R.D.; Heier, L.A.; Snow, R.B.; Liu, D.P.; Kelly, A.B.; Deck, M.D. Acute intracranial hemorrhage: Intensity changes on sequential MR scans at 0.5 T. AJR Am. J. Roentgenol. 1988, 150, 651–661. [Google Scholar] [CrossRef] [PubMed]
  45. MacLellan, C.L.; Silasi, G.; Poon, C.C.; Edmundson, C.L.; Buist, R.; Peeling, J.; Colbourne, F. Intracerebral hemorrhage models in rat: Comparing collagenase to blood infusion. J. Cereb. Blood Flow Metab. 2008, 28, 516–525. [Google Scholar] [CrossRef]
  46. Broderick, J.P.; Brott, T.G.; Duldner, J.E.; Tomsick, T.; Huster, G. Volume of intracerebral hemorrhage. A powerful and easy-to-use predictor of 30-day mortality. Stroke 1993, 24, 987–993. [Google Scholar] [CrossRef] [Green Version]
  47. Davis, S.M.; Broderick, J.; Hennerici, M.; Brun, N.C.; Diringer, M.N.; Mayer, S.A.; Begtrup, K.; Steiner, T.; Recombinant Activated Factor, V.I.I.I.H.T.I. Hematoma growth is a determinant of mortality and poor outcome after intracerebral hemorrhage. Neurology 2006, 66, 1175–1181. [Google Scholar] [CrossRef]
  48. Liew, H.K.; Huang, L.C.; Yang, H.I.; Peng, H.F.; Li, K.W.; Tsai, A.P.; Chen, S.Y.; Kuo, J.S.; Pang, C.Y. Therapeutic effects of human urocortin-1, -2 and -3 in intracerebral hemorrhage of rats. Neuropeptides 2015, 52, 89–96. [Google Scholar] [CrossRef]
  49. Orakcioglu, B.; Becker, K.; Sakowitz, O.W.; Unterberg, A.; Schellinger, P.D. Serial diffusion and perfusion MRI analysis of the perihemorrhagic zone in a rat ICH model. Acta Neurochir. Suppl. 2008, 103, 15–18. [Google Scholar] [CrossRef]
  50. Orakcioglu, B.; Fiebach, J.B.; Steiner, T.; Kollmar, R.; Juttler, E.; Becker, K.; Schwab, S.; Heiland, S.; Meyding-Lamade, U.K.; Schellinger, P.D. Evolution of early perihemorrhagic changes—ischemia vs. edema: An MRI study in rats. Exp. Neurol. 2005, 193, 369–376. [Google Scholar] [CrossRef]
  51. Wang, M.; Hong, X.; Chang, C.F.; Li, Q.; Ma, B.; Zhang, H.; Xiang, S.; Heo, H.Y.; Zhang, Y.; Lee, D.H.; et al. Simultaneous detection and separation of hyperacute intracerebral hemorrhage and cerebral ischemia using amide proton transfer MRI. Magn. Reson. Med. 2015, 74, 42–50. [Google Scholar] [CrossRef] [PubMed]
  52. Ma, Q.; Khatibi, N.H.; Chen, H.; Tang, J.; Zhang, J.H. History of preclinical models of intracerebral hemorrhage. Acta Neurochir. Suppl. 2011, 111, 3–8. [Google Scholar] [CrossRef] [PubMed] [Green Version]
Figure 1. Timeline of this study. During this study, the number of rats varied from point to point because of unintended mortality and because rats were killed before staining. MRI = magnetic resonance imaging.
Symmetry 14 00350 g001
Figure 2. Representative image obtained using T2-weighted imaging (T2WI) showing the region of interest (ROI) (dotted lines) placed on hemorrhagic lesions at different stages of intracerebral hemorrhage (ICH). R: right side of the rat brain.
Symmetry 14 00350 g002
Figure 3. Time evolution from day 0 to day 28 of a hematoma in the right striatum. Imaging was performed using T1-weighted imaging (T1WI) (AD); T2-weighted imaging (T2WI) (EH); susceptibility-weighted imaging (SWI) (IL), and quantitative susceptibility mapping (QSM) (MP). R: right side of the rat brain.
Symmetry 14 00350 g003
Figure 4. Line graphs (A,C,E,G) and box plots (B,D,F,H) of normalized values of susceptibility. Time evolutions of intracranial hemorrhage (ICH) are shown for (A) T1-weighted imaging; (T1WI), (C) T2-weighted imaging (T2WI); (E) susceptibility-weighted imaging (SWI), and (G) quantitative susceptibility mapping (QSM) of 16 rats that underwent longitudinal magnetic resonance imaging (MRI). The corresponding box plots (B,D,F,H, respectively) are also shown. A.U., arbitrary units. * p < 0.05; ** p < 0.01.
Symmetry 14 00350 g004aSymmetry 14 00350 g004b
Figure 5. Line graphs (A,C,E,G) and box plots (B,D,F,H) of the area. The intracranial hemorrhage (ICH) size evolved from day 0 to day 28 in 16 rats that underwent longitudinal magnetic resonance imaging (MRI). T1-weighted imaging (T1WI) (A,B); T2-weighted imaging (T2WI) (C,D), susceptibility-weighted imaging (SWI) (E,F), and quantitative susceptibility mapping (QSM) (G,H) were performed. * p < 0.05. ** p < 0.01.
Symmetry 14 00350 g005
Figure 6. Correlation plots at various stages. (AC) Correlation between quantitative susceptibility mapping (QSM) and each parameter on day 0. (DF) Correlation between QSM and each parameter on day 1. (GI) Correlation between QSM and each parameter on day 7. (JL) Correlation between QSM and each parameter on day 28. T1WI, T1-weighted imaging; T2WI, T2-weighted imaging; SWI, susceptibility-weighted imaging; QSM, quantitative susceptibility mapping.
Symmetry 14 00350 g006
Figure 7. Stained images of the intracerebral hemorrhage (ICH) site at various stages (×4). (AD) Hematoxylin and eosin (HE) staining. (EH) Berlin blue (BB) staining. Black bars = 500 µm. R: right side of the rat brain.
Symmetry 14 00350 g007
Publisher’s Note: MDPI stays neutral with regard to jurisdictional claims in published maps and institutional affiliations.