Article

Asymmetry Index Evaluation of Cerebral Volume and Cerebral Blood Flow in Neonatal Hypoxic–Ischemic Encephalopathy

1
Department of Radiology, AMS New Otani Clinic, Osaka 540-8570, Japan
2
Division of Clinical Radiology Service, Kyoto University Hospital, Kyoto 606-8507, Japan
3
Area of Medical Imaging Technology and Science, Department of Medical Physics and Engineering, Division of Health Sciences, Graduate School of Medicine, Osaka University, Osaka 565-0871, Japan
4
Department of Advanced Medical Technologies, National Cerebral and Cardiovascular Center Research Institute, Osaka 565-8565, Japan
*
Author to whom correspondence should be addressed.
Symmetry 2022, 14(3), 596; https://doi.org/10.3390/sym14030596
Submission received: 19 February 2022 / Revised: 8 March 2022 / Accepted: 14 March 2022 / Published: 17 March 2022
(This article belongs to the Special Issue Brain Asymmetry in Evolution II)

Abstract

:
The aim of the present study was to longitudinally evaluate the differences in cerebral volume and cerebral blood flow (CBF) on the right and left sides in rats with neonatal hypoxic–ischemic encephalopathy (HIE) using magnetic resonance imaging and the Rice–Vannucci model. Unilateral ligation of the left common carotid artery was performed on 8-day-old rats, followed by mild (1 h, n = 6) or severe (2 h, n = 7) hypoxic exposure. T2-weighted (T2W) and CBF images were obtained at 1 h and 1, 3, and 7 days following the HI insult. The cerebral volume (Vlesion and Vcontrol), CBF in both hemispheres (lesion and control sides), and asymmetry indices of the cerebral volume (AIvolume) and CBF (AICBF) were calculated for each group. Slight hyperintensities were noted in the lesion-side hemispheres on T2W images at 1 h and 1 day in both groups, as were pronounced hyperintensities at days 3 and 7 in the severe group. AIvolume was positive (Vlesion > Vcontrol) in the mild and severe groups until days 1 and 3, respectively, and changed to negative on days 3 and 7 in the mild and severe groups. These results suggest that the prolonged positive AIvolume prior to day 3 in the severe group was caused by long-term cell swelling following severe HI insult.

Graphical Abstract

1. Introduction

Neonatal hypoxic–ischemic encephalopathy (HIE) is a serious brain disorder in neonates and is caused by perinatal asphyxia [1], in which decreased cerebral blood flow (CBF) causes neuronal cells to be in a state of hypoxia and hypoglycemia. This initiates a cascade of biochemical events that lead to cell dysfunction and ultimately cell death [2,3], and can result in severe and permanent neuropsychological sequelae, including intellectual disability [1], epilepsy, and cerebral palsy. Various animal models of neonatal HIE have been used to study its cellular and molecular mechanisms and assess its state [4,5,6]. The Rice–Vannucci model is the most prevalent animal model and comprises unilateral carotid artery ligation followed by exposure to 8% oxygen for 1–3 h at 37 °C [5,7]. This model replicates the anatomical damage seen in human neonates, such as the white and gray matter injury observed in the cortex, hippocampus, thalamus, and basal ganglia, and has several advantages in that the severity of white matter damage can be modified by varying temperature and duration of exposure to hypoxia [8] and the cerebral hemisphere contralateral to the arterial occlusion appears intact, providing a simple means to compare each hemisphere as lesion and control sides within an identical brain [5].
Magnetic resonance imaging (MRI) is a sensitive imaging modality that can noninvasively identify brain damage caused by HI injury. Several studies have been conducted to assess brain injury in rodent models of neonatal HIE using diffusion-weighted or T2W MRI [9,10,11,12,13]. We previously evaluated the utility of neurite orientation dispersion and density imaging (NODDI) [14] to longitudinally assess HIE severity in rats using 7.0 T MRI and identify early differences between mild and severe HI injuries 1 h following HI insult by employing the orientation dispersion index [15].
Unilateral brain injury is observed after HI insult on MRI or histopathology [10,13] in the Rice–Vannucci model, and is caused by the evolution of HI damage confined in the ipsilateral hemisphere to arterial occlusion, resulting in unilateral neuronal cell death and cerebral atrophy in the rat model. The degree of volumetric left–right differences in brains in the HIE model was assessed to determine the severity or therapeutic effect of HIE. Silverstein et al. examined the impact of pre-treatment with flunarizine, a calcium antagonist, on the development of HIE using the Rice–Vannucci model and identified the neuroprotective effect of flunarizine by evaluating the laterality of the weight and cross-sectional area of the cerebral hemispheres at 2 weeks following HIE onset [16]. To the best of our knowledge, no MRI studies have evaluated the severity of HIE from the perspective of left/right differences in the development of cerebral volume and CBF in the HIE model to date.
The aim of the present study was to longitudinally observe temporal changes in cerebral volume and CBF in mild and severe HIE models using 7.0 T MRI and evaluate the alteration of the left–right differences in cerebral volume and CBF.

2. Materials and Methods

2.1. Preparation of Animal Models

All animal experiments were approved by the Institutional Animal Care and Use Committee at the National Cardiovascular and Cerebral Research Center (approval number: 19054). The animals were kept under standard laboratory conditions of 23 °C room temperature and around 50% humidity with free access to food and water. Thirteen 8-day-old Wister rats (Japan SLC, Inc, Shizuoka, Japan) were subjected to HI insult as described previously [11]. Briefly, the rats were anesthetized with inhalational isoflurane (3% for induction and 1.5–2.0% for maintenance) and underwent unilateral ligation and excision of the left common carotid artery. After 45 min of recovery from operation, the rats were placed in a hypoxic chamber (8% O2 and 92% N2 at 34.0 °C) for 1 or 2 h to generate mild (n = 6) and severe (n = 7) injury groups, respectively. The animals were euthanized with 5% isoflurane after all experiments were completed.

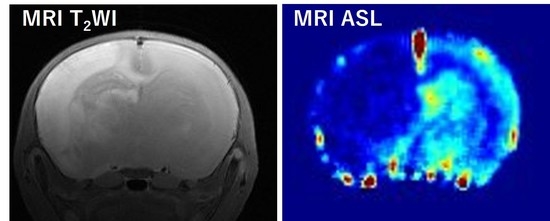
2.2. MRI Acquisition

MRI studies were conducted for all animals in both groups at 1 h and 1, 3, and 7 days after the HI insult using a 7.0 T horizontal scanner (BioSpec 70/30 USR, Bruker Biospin, Ettlingen, Germany) with a 4-channel phased-array coil dedicated for the mouse brain. During MRI experiments, animals were induced into anesthesia with inhalational isoflurane (3.0% for induction and 1.5–2.0% for maintenance) and fixed on a bed using a custom-built stereotaxic frame with mouth and ear bars to prevent any movement [11,17]. Respiratory signals and body temperatures were monitored using a physiological monitoring system (SA Instruments, Inc., Stony Brook, NY, USA). Their body temperatures were continuously maintained at 36.5 °C with regulated water flow throughout all experiments. We used partly the same animal MRI data as those used in the NODDI experiments by Ohki et al. in the present study [11].
Anatomical T2W images were acquired using a rapid acquisition with relaxation enhancement (RARE) sequence with the following parameters: TR/TE = 4000/33 ms; rare factor = 8; field-of-view = 19.2 × 19.2 mm2; matrix size = 256 × 256; in-plane resolution = 75 × 75 μm2; number of slices = 10; slice thickness = 500 μm; number of averages = 4; slice orientation = transaxial; scan time = 6 min 20 s. Flow-sensitive alternating inversion recovery (FAIR) images were captured using a RARE sequence as follows: TR/TE = 12,000/46 ms; rare factor = 72; field-of-view = 19.2 × 19.2 mm2; number of slices = 1; matrix size = 128 × 128; in-plane resolution = 150 × 150 μm2; slice orientation = transaxial; number of averages = 1; number of inversion times = 22 (30, 100, 200, 300, 400, 500, 600, 700, 800, 900, 1000, 1100, 1200, 1300, 1400, 1500, 1600, 1700, 1800, 1950, 2100, and 2300 ms); scan time = 7 min 40 s.

2.3. Image analysis

The volume and CBF were calculated using Paravison 5.1 (Bruker Biospin). In the present study, we defined the left and right hemispheres as the lesioned and control sides, respectively. These volumes (Vlesion, Vcontrol) were calculated by manually drawing regions of interest on each hemisphere on the T2W images and multiplying the sum of these areas across all slices by the slice thickness (1 mm).
We calculated the magnitude of the asymmetry of the cerebral volume and CBF by introducing an asymmetry index (AI), as follows:
A I v o l u m e = V l e s i o n V c o n t r o l V l e s i o n + V c o n t r o l × 100 ,     A I C B F = C B F l e s i o n C B F c o n t r o l C B F l e s i o n + C B F c o n t r o l × 100 ,
in which A I v o l u m e and A I C B F denote the AI of the cerebral volume, whereas C B F l e s i o n   and   C B F c o n t r o l denote the CBF of the lesion and control sides, respectively.

2.4. Statistical Analysis

The average cerebral volume, CBF, and AI are expressed as mean ± standard deviation, and the differences in these parameters between the groups and at each time point were analyzed using one-way analysis of variance. Statistical significance was determined using the Tukey–Kramer multiple comparison test. Statistical significance was set at p < 0.05. All analyses were performed using Prism 5 software (version 9, GraphPad Software, San Diego, CA, USA).

3. Results

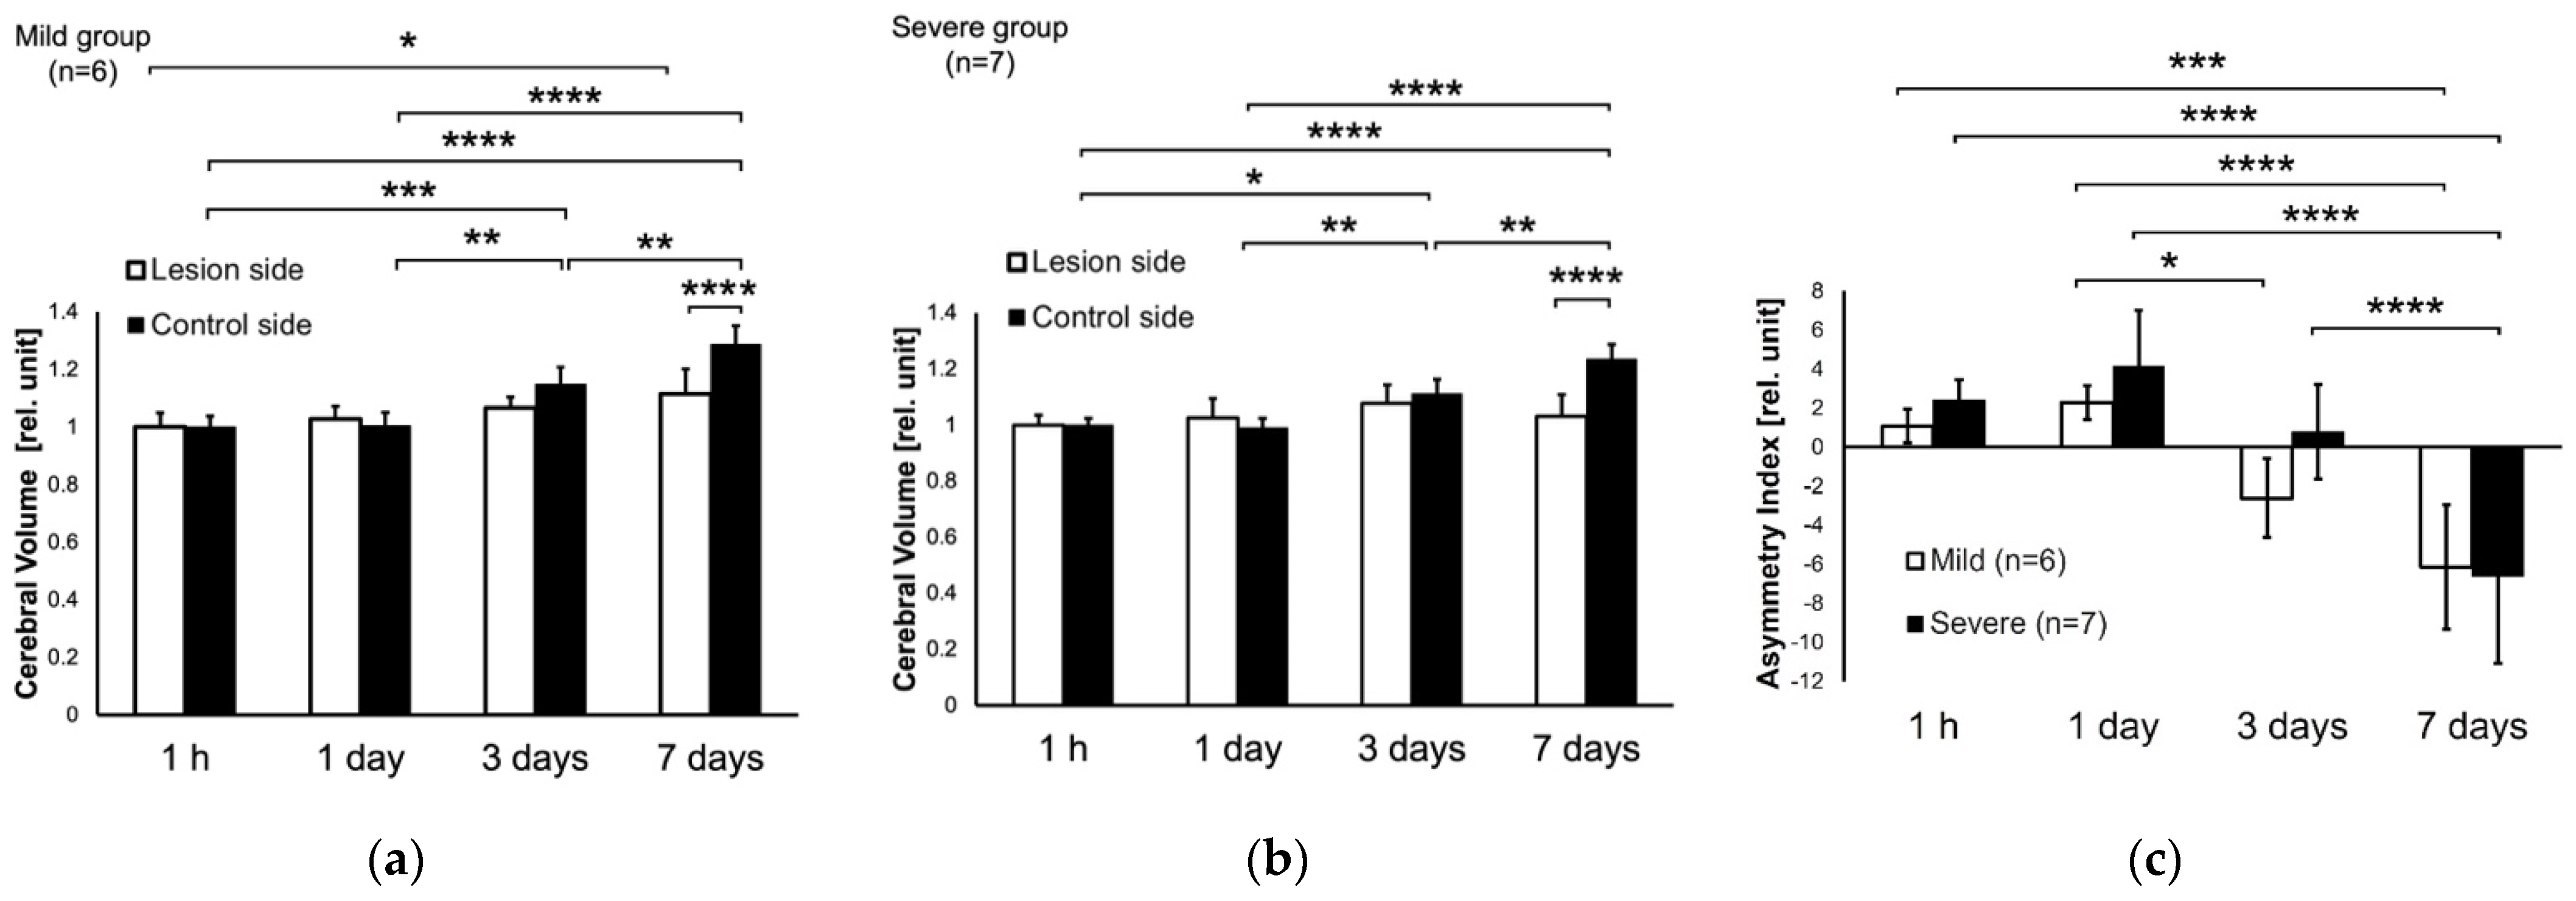
3.1. T2W Images at 1 h, and 1, 3, 7 Days after HIE

Figure 1 shows the representative T2W images from the mild (A–D) and severe (E–H) groups at 1 h and 1, 3, and 7 days after the HI insult. Cerebral damage, as identified by hyperintensities, was observed in the lesion sides at 1 h and 1 d in following HI insult on the mild group (A, B) and 1 h and 1, 3, and 7 days after the HI insult in the severe group (E, F, G, H). One day after the HI insult in both groups (B, F), the magnitude of the signal intensities in the injured area appeared to be enhanced compared to that observed at 1 h. The hyperintensities on the lesion sides were no longer visible in the mild group but were more prominent in the severe group at 3 and 7 days after the HI insult (C, D, G, H). Cerebral volume asymmetry was also observed in both groups. In the mild group, the cerebral volume of the lesioned side appeared to be slightly lower than that of the control side at 3 days (C), which was notable at 7 days (D). In the severe group, the volume of the lesion-side hemisphere appeared to be greater than that of the control side at 1 and 3 days (G), and that relation inverted markedly at 7 days (H).
Figure 2 shows the temporal changes in the mean cerebral volume (Figure 2a,b) of the lesion and control sides, and the AIvolume (Figure 2c) in the mild and severe groups. It should be noted that the mean cerebral volumes at 1, 3, and 7 days after the HI insult were normalized to those at 1 h. Time-dependent increase in cerebral volume on the control side was observed in both groups (Figure 2a,b). At 1 h after the onset of HIE, the cerebral volumes of the control side in both groups (1.0 ± 0.04 in the mild group, 1.0 ± 0.03 in the severe group) were significantly lower than those at 3 days (1.2 ± 0.06, p < 0.001 in the mild group, 1.1 ± 0.01, p < 0.05 in the severe group) and 7 days (1.3 ± 0.07, p < 0.0001 in the mild group, 1.2 ± 0.05, p < 0.0001 in the severe group) following the HI insult (Figure 2a,b). However, the volume of the lesion side at 1 h (1.0 ± 0.05, mild group; 1.0 ± 0.04, severe group) in the mild group was significantly lower than that at 7 days compared with that in the severe group (1.1 ± 0.09, p < 0.05, mild group, 1.0 ± 0.08, p = 0.95, severe group). At 1 day after the onset of HIE, the cerebral volumes of the control side in both groups (1.0 ± 0.05 in the mild group, 1.0 ± 0.03 in the severe group) were significantly lower than those at 3 days (p < 0.01 in the mild group, p < 0.01 in the severe group) and 7 days (p < 0.0001 in the mild group, p < 0.0001 in the severe group). However, the volume of the lesion side did not differ significantly between any of the other time points. Within 7 days of HIE onset, significant differences were observed between the lesion and control sides in both groups (p < 0.01, mild group; p < 0.001, severe group). Significant difference in AIvolume was not observed between mild and severe groups at each time points. The AIvolume at 1 h after the HI insult (1.1 ± 0.9 in the mild group, 2.4 ± 1.1 in the severe group) was significantly higher than that observed at 7 days in both groups (−6.1 ± 3.1, p < 0.01 in the mild group, −6.6 ± 4.5, p < 0.0001 in the severe group) (Figure 2c). Compared with the AIvolume at 1 day after the HI insult (2.3 ± 0.9 in the mild group, 4.1 ± 2.9 in the severe group), the value in both groups decreased significantly at 7 days (p < 0.0001 in both groups) but only decreased at 3 days in the mild group (2.6 ± 2.0, p < 0.05). The AIvolume at 7 days was only significantly lower than that at 3 days in the severe group (0.8 ± 2.4, p < 0.0001 in the severe group).

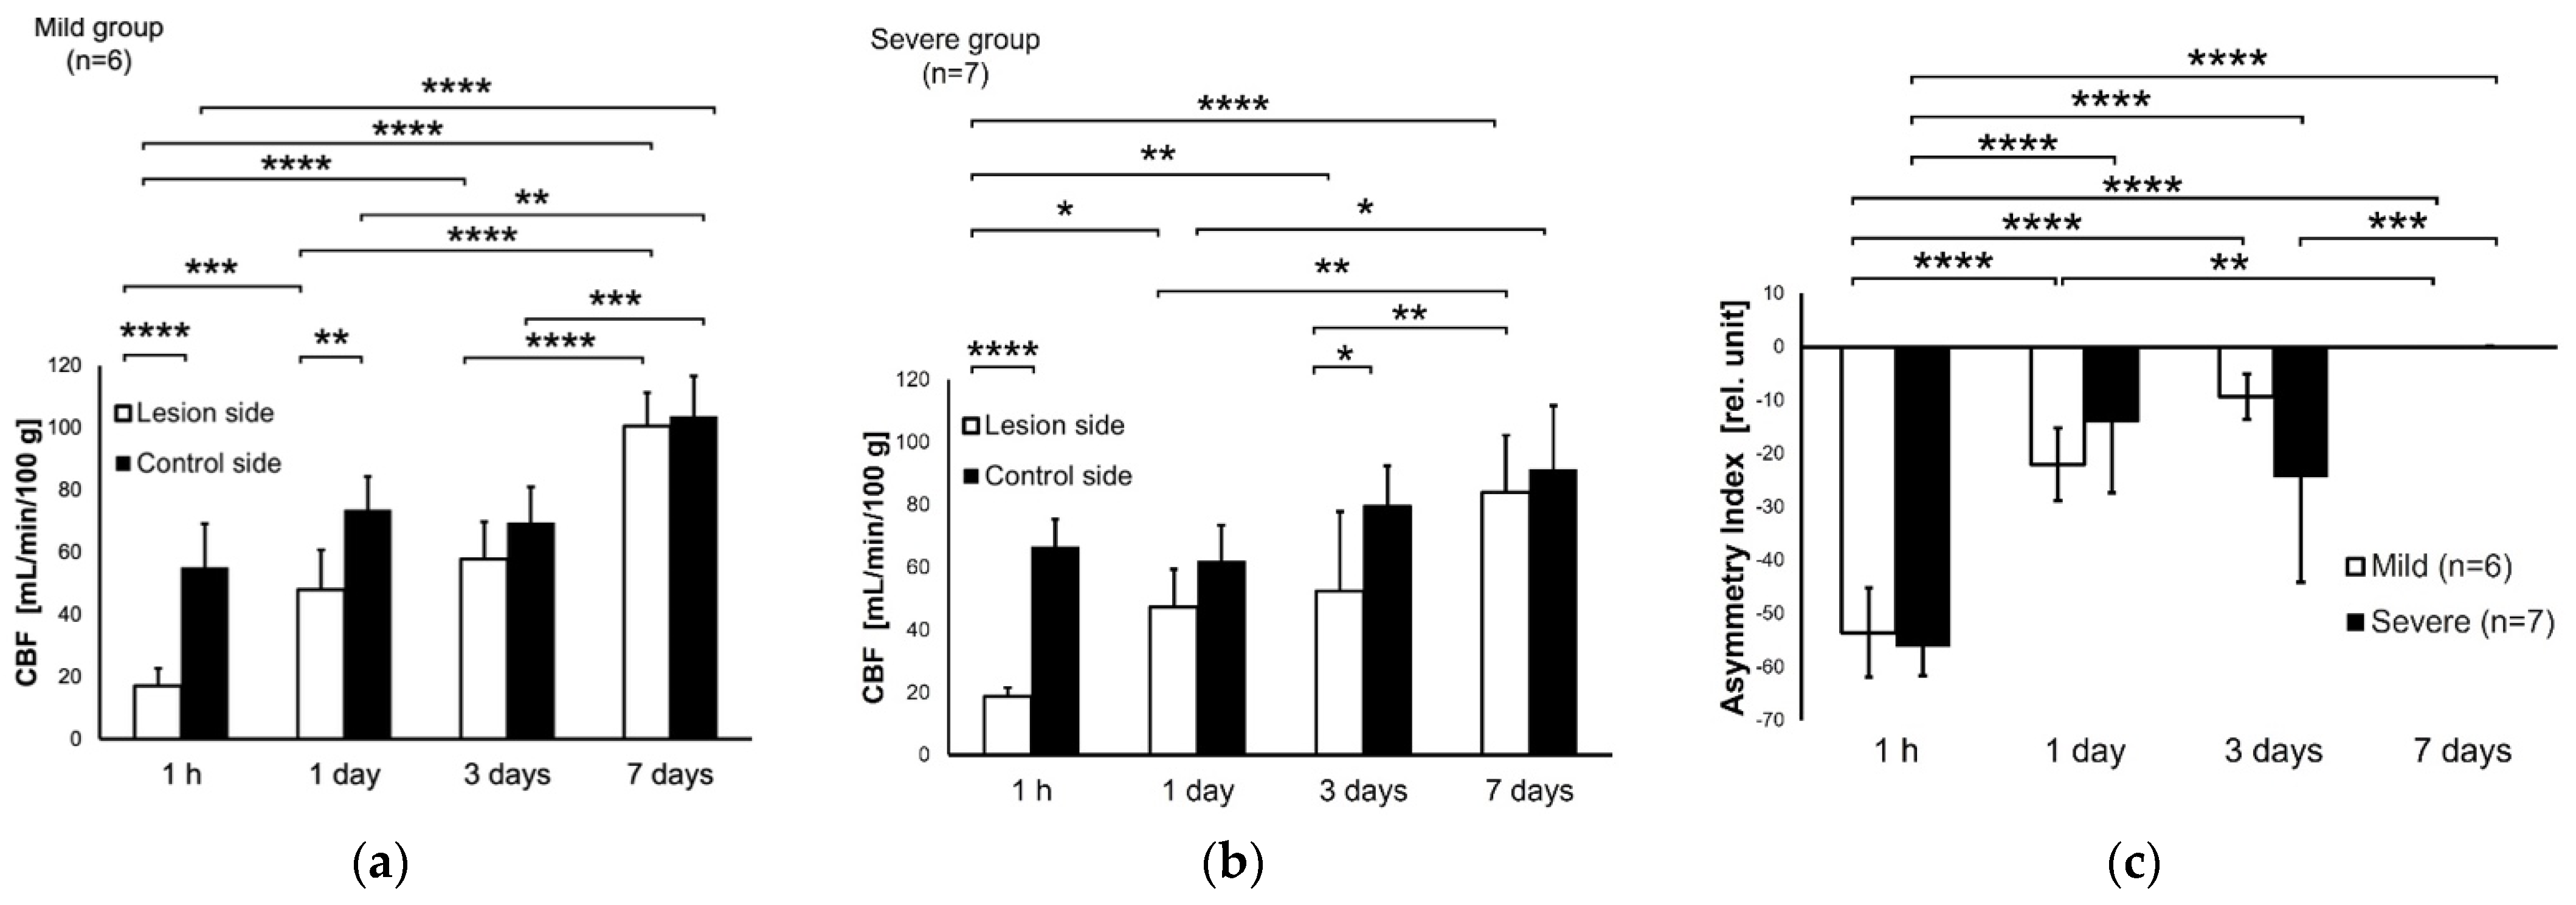
3.2. CBF at 1 h and 1, 3, 7 Days after HIE

Figure 3 shows representative FAIR images showing the CBF from the mild (A–D) and severe (E–H) groups at 1 h and 1, 3, 7 days after the HI insult. Compared to the control side, the CBF on the lesion side appeared lower in both groups at 1 h after the HI insult (A, E). At 7 days, it had recovered in the mild group (D) but not entirely in the severe group (H).
Figure 4 shows the temporal changes in the mean CBF and AICBF values on each side in the mild and severe groups. Time-dependent increase in CBF on the control side was observed in both groups (Figure 4a,b). At 1 h after the HI insult, the mean CBF values of the lesion sides in both groups (17.1 ± 5.6 in the mild group, 18.6 ± 2.9 in the severe group) were significantly lower than those of the control sides (55.1 ± 14.1, p < 0.0001 in the mild group, 66.5 ± 8.9, p < 0.0001 in the severe group). In both groups, the mean CBF values of the lesion side at 1, 3, and 7 days after the HI injury were significantly higher than those at 1 h. In the mild group, the mean CBF value increased significantly between 1 h and 7 days. At day 1 in the mild group, the mean CBF of the control side (73.7 ± 10.8) was significantly higher than that of the lesion side (48.0 ± 12.8, p = 0.009). Compared with the mean CBF values at days 1 and 7 in both groups, the mean CBF values for both sides at day 7 were significantly higher than those at day 1. At day 3 in the severe group, the mean CBF value for the control side (79.8 ± 12.7) was significantly higher than that of the lesion side (52.4 ± 25.4, p < 0.05). Compared with the mean CBF values at 3 and 7 days, the mean CBF value for the lesion side at 7 days was significantly higher than that at 3 days in both groups, but the CBF value for the control side at 7 days was significantly higher than that at 3 days only in the mild group.
In both groups, the AICBF values at 1 h (−53.6 ± 9.4 in the mild group, −56.2 ± 5.4 in the severe group) were significantly lower than those at 1 day (−22.1 ± 6.8, p < 0.0001 in the mild group, −14.1 ± 13.3, p < 0.0001 in the severe group), 3 days (−9.4 ± 4.3, p < 0.0001 in the mild group, −24.4 ± 19.8, p < 0.0001 in the severe group) and 7 days after HI injury (−0.01 ± 0.02, p < 0.0001 in the mild group, −0.04 ± 0.08, p < 0.0001 in the severe group). The AICBF values did not differ significantly between days 1 and 3 in both groups. The AICBF at 7 days was significantly higher than that at 1 day in the mild group (p = 0.008); however, no significant difference was observed in the severe group (p = 0.2).

4. Discussion

In this study, we longitudinally observed cerebral volume and CBF in brains with HI injuries of differing severity in a rat model using MRI, and demonstrated the influence of the severity of brain injury on the asymmetrical development of cerebral volume and CBF until 7 days after the HI insult.
A significant increase was observed in cerebral volume on the lesion side between 1 h and 7 days in the mild group, but not the severe group, as shown in Figure 2a,b. Research has shown that severe HI insult can lead to cellular necrosis caused by complete energy failure in the mitochondria and the destruction of the cell membrane due to an excessive Ca+ influx to the cytoplasm [18,19], whereas mild insults are more likely to lead to cell recovery or progress to apoptosis induced by cell death signals from the mitochondria to the nucleus [18]. Elevated T2W signal intensity after HI insult has also been proven to represent vasogenic or interstitial edema due to disruptions in the blood brain barrier and cell shrinkage or rupture by apoptotic and necrotic cell death [20,21]. These findings were visually confirmed by the T2W images shown in Figure 1. Thus, the prominent T2W signal elevations at 3 and 7 days and disrupted cerebral volume growth observed in the severe group may have been caused by necrotic cell rupture and/or vasogenic edema due to severe HI insult [20].
As shown in Figure 2c, the positive AIvolume in the mild group at 1 day after the HI insult changed significantly to negative at 3 days, whereas the positive AIvolume at 3 days changed significantly to negative at 7 days in the severe group. Previously, Ohki et al. used NODDI to evaluate the temporal changes in microstructural alterations in the HIE model after mild and severe insults, and demonstrated that the severe HI insult resulted in elevated water diffusion in the vasogenic edema later in HIE with abrupt ISO elevations at days 3 and 7 [11]. Because the ISO parameter represents the changes in the free water compartment inside the extracellular space [14], the positive AIvolume may have been prolonged until 3 days after the severe HI insult due to long-term cell swelling, mainly vasogenic edema.
The AICBF values did not differ significantly between the two groups at any time point (Figure 4c). This result is in accordance with those in our previous report [11], suggesting that local CBF does not contribute to the variation in severity, but aids in activating the metabolite response. However, the CBF values differed significantly between the lesion and control sides at days 1 and 3 in the mild and severe groups, respectively (Figure 4a,b). Additionally, there were significant differences in AICBF in the mild and severe groups between days 1 and 7 and days 3 and 7, respectively (Figure 4c). Brain edema initiates the elevation of intracranial pressure (ICP) and reduction of cerebral perfusion pressure around the ischemic core region, resulting in an additional reduction in CBF and ischemic damage [22]. From this knowledge and the results obtained in the volumetric study, it appears that the significant left/right CBF differences at 1 h and 1 day in the mild group and 1 h and 3 days in the severe group can be partially explained by the elevated ICP caused by cell swelling.
This study has several limitations. First, the degree of cerebral damage varied considerably between animals, despite being subjected to hypoxic exposure for the same duration (mild group: 1 h; severe group: 2 h). It is an important factor for the induction of HIE models, such as temperature and duration of hypoxic exposure. Therefore, these factors should be controlled precisely. Day-to-day variability is important factor for evaluating the HIE models. Although these factors were controlled carefully in the present study, the variability in the degree of the cerebral damage was observed. Several studies explained other factors affecting the variety of cerebral damage after HI insults, such as blood glucose levels, surgery time, duration of the exposure to isoflurane [23]. Second, we completed the study 7 days after HI insult and did not evaluate the long-term consequences of HI insult on cerebral volume and CBF. Ten et al. conducted a long-term assessment of the anatomical pattern of HI injury in mice 10 weeks after an HI insult (20 min exposure) using MRI and histopathology, and demonstrated that there were two anatomical patterns of brain injury: mice with severe cerebral atrophy and porencephalic cyst formation (cyst mice), and those with mild or moderate cerebral atrophy, but not a cystic lesion (no-cyst mice) [10]. Because long-term alterations in the injured brain vary depending on the severity of HI insult related to tertiary brain damage: gliosis, an altered epigenome, and ongoing inflammation [24], evaluating its influence on the differences between the left and right cerebral volume and CBF values in rats with different HI severities would be of interest. Additionally, since longitudinal left–right volume difference reflects the relative tissue loss on the control side caused by HI insult, it might be useful for evaluating the therapeutic effect for HIE treatment to compare AIvolume between different treatment groups for long-term MRI use. Moreover, to validate the degree of lesion for each animal, a traditional method such as HE staining in the HIE models should be used for evaluation. Finally, it is important to evaluate more details of the hyperintensity area in T2W in the HIE models. In the future study, we might quantify high intensity and degree of region of HIE brain using T2 quantitative maps and HE staining, etc.

5. Conclusions

In this study, we longitudinally observed the cerebral volume and CBF values at different severities of HIE in a rat model using MRI, and demonstrated that the severity of the HI insult affected the duration of the HI insult’s effects on the left–right volume and CBF differences in the Rice–Vannucci model. Our results suggest that evaluating the time course of left–right differences in volume and CBF in the Rice–Vannucci model using MRI is useful for evaluating the severity or therapeutic effect of HIE.

Author Contributions

Conceptualization, N.B., A.O. and S.S.; methodology, N.B., A.O. and S.S.; validation, N.B., A.O. and S.S.; formal analysis, N.B., A.O. and S.S.; investigation, A.O. and S.S.; resources, A.O. and S.S.; data curation, N.B., A.O. and S.S.; writing—original draft preparation, N.B. and S.S.; writing—review and editing, N.B., A.O. and S.S.; supervision, S.S.; project administration, S.S.; funding acquisition, S.S. All authors have read and agreed to the published version of the manuscript.

Funding

This work was the result of using research equipment shared by the MEXT Project for promoting public utilization of advanced research infrastructure (program for supporting the construction of core facilities) (grant number JPMXS0450400021).

Institutional Review Board Statement

Not applicable.

Informed Consent Statement

Not applicable.

Data Availability Statement

Not applicable.

Conflicts of Interest

The authors declare no conflict of interest.

References

  1. Van Handel, M.; Swaab, H.; de Vries, L.S.; Jongmans, M.J. Long-term cognitive and behavioral consequences of neonatal encephalopathy following perinatal asphyxia: A review. Eur. J. Pediatr. 2007, 166, 645–654. [Google Scholar] [CrossRef] [PubMed] [Green Version]
  2. Lai, M.C.; Yang, S.N. Perinatal hypoxic-ischemic encephalopathy. J. Biomed. Biotechnol. 2011, 2011, 609813. [Google Scholar] [CrossRef] [PubMed] [Green Version]
  3. Wassink, G.; Gunn, E.R.; Drury, P.P.; Bennet, L.; Gunn, A.J. The mechanisms and treatment of asphyxial encephalopathy. Front. Neurosci. 2014, 8, 40. [Google Scholar] [CrossRef] [PubMed] [Green Version]
  4. Vannucci, R.C.; Vannucci, S.J. Perinatal hypoxic-ischemic brain damage: Evolution of an animal model. Dev. Neurosci. 2005, 27, 81–86. [Google Scholar] [CrossRef] [PubMed]
  5. Millar, L.J.; Shi, L.; Hoerder-Suabedissen, A.; Molnar, Z. Neonatal Hypoxia Ischaemia: Mechanisms, Models, and Therapeutic Challenges. Front. Cell Neurosci. 2017, 11, 78. [Google Scholar] [CrossRef] [PubMed] [Green Version]
  6. Hamdy, N.; Eide, S.; Sun, H.S.; Feng, Z.P. Animal models for neonatal brain injury induced by hypoxic ischemic conditions in rodents. Exp. Neurol. 2020, 334, 113457. [Google Scholar] [CrossRef] [PubMed]
  7. Rice, J.E.; Vannucci, R.C.; Brierley, J.B. The influence of immaturity on hypoxic-ischemic brain damage in the rat. Ann. Neurol. 1981, 9, 131–141. [Google Scholar] [CrossRef] [PubMed]
  8. Liu, Y.; Silverstein, F.S.; Skoff, R.; Barks, J.D. Hypoxic-ischemic oligodendroglial injury in neonatal rat brain. Pediatr. Res. 2002, 51, 25–33. [Google Scholar] [CrossRef] [PubMed] [Green Version]
  9. Wang, S.; Wu, E.X.; Tam, C.N.; Lau, H.F.; Cheung, P.T.; Khong, P.L. Characterization of white matter injury in a hypoxic-ischemic neonatal rat model by diffusion tensor MRI. Stroke 2008, 39, 2348–2353. [Google Scholar] [CrossRef] [PubMed] [Green Version]
  10. Ten, V.S.; Wu, E.X.; Tang, H.; Bradley-Moore, M.; Fedarau, M.V.; Ratner, V.I.; Stark, R.I.; Gingrich, J.A.; Pinsky, D.J. Late measures of brain injury after neonatal hypoxia-ischemia in mice. Stroke 2004, 35, 2183–2188. [Google Scholar] [CrossRef] [PubMed] [Green Version]
  11. Ohki, A.; Saito, S.; Hata, J.; Okano, H.J.; Higuchi, T.; Fukuchi, K. Neurite orientation dispersion and density imaging for evaluating the severity of neonatal hypoxic-ischemic encephalopathy in rats. Magn. Reson. Imaging 2019, 62, 214–219. [Google Scholar] [CrossRef]
  12. Doman, S.E.; Girish, A.; Nemeth, C.L.; Drummond, G.T.; Carr, P.; Garcia, M.S.; Johnston, M.V.; Kannan, S.; Fatemi, A.; Zhang, J.; et al. Early Detection of Hypothermic Neuroprotection Using T2-Weighted Magnetic Resonance Imaging in a Mouse Model of Hypoxic Ischemic Encephalopathy. Front. Neurol. 2018, 9, 304. [Google Scholar] [CrossRef] [PubMed] [Green Version]
  13. Aden, U.; Dahlberg, V.; Fredholm, B.B.; Lai, L.J.; Chen, Z.; Bjelke, B. MRI evaluation and functional assessment of brain injury after hypoxic ischemia in neonatal mice. Stroke 2002, 33, 1405–1410. [Google Scholar] [CrossRef] [Green Version]
  14. Zhang, H.; Schneider, T.; Wheeler-Kingshott, C.A.; Alexander, D.C. NODDI: Practical in vivo neurite orientation dispersion and density imaging of the human brain. Neuroimage 2012, 61, 1000–1016. [Google Scholar] [CrossRef]
  15. Lodygensky, G.A.; Inder, T.E.; Neil, J.J. Application of magnetic resonance imaging in animal models of perinatal hypoxic-ischemic cerebral injury. Int. J. Dev. Neurosci. 2008, 26, 13–25. [Google Scholar] [CrossRef] [PubMed] [Green Version]
  16. Silverstein, F.S.; Buchanan, K.; Hudson, C.; Johnston, M.V. Flunarizine limits hypoxia-ischemia induced morphologic injury in immature rat brain. Stroke 1986, 17, 477–482. [Google Scholar] [CrossRef] [PubMed] [Green Version]
  17. Saito, S.; Takahashi, Y.; Ohki, A.; Shintani, Y.; Higuchi, T. Early detection of elevated lactate levels in a mitochondrial disease model using chemical exchange saturation transfer (CEST) and magnetic resonance spectroscopy (MRS) at 7T-MRI. Radiol. Phys. Technol. 2019, 12, 46–54. [Google Scholar] [CrossRef]
  18. Johnston, M.V.; Ishida, A.; Ishida, W.N.; Matsushita, H.B.; Nishimura, A.; Tsuji, M. Plasticity and injury in the developing brain. Brain Dev. 2009, 31, 1–10. [Google Scholar] [CrossRef] [Green Version]
  19. Allen, K.A.; Brandon, D.H. Hypoxic Ischemic Encephalopathy: Pathophysiology and Experimental Treatments. Newborn Infant Nurs. Rev. 2011, 11, 125–133. [Google Scholar] [CrossRef] [Green Version]
  20. Rumpel, H.; Nedelcu, J.; Aguzzi, A.; Martin, E. Late glial swelling after acute cerebral hypoxia-ischemia in the neonatal rat: A combined magnetic resonance and histochemical study. Pediatr. Res. 1997, 42, 54–59. [Google Scholar] [CrossRef] [PubMed] [Green Version]
  21. Rumpel, H.; Buchli, R.; Gehrmann, J.; Aguzzi, A.; Illi, O.; Martin, E. Magnetic resonance imaging of brain edema in the neonatal rat: A comparison of short and long term hypoxia-ischemia. Pediatr. Res. 1995, 38, 113–118. [Google Scholar] [CrossRef] [PubMed] [Green Version]
  22. Sekhon, M.S.; Ainslie, P.N.; Griesdale, D.E. Clinical pathophysiology of hypoxic ischemic brain injury after cardiac arrest: A “two-hit” model. Crit. Care 2017, 21, 90. [Google Scholar] [CrossRef] [PubMed] [Green Version]
  23. Chen, H.; Burris, M.; Fajilan, A.; Spagnoli, F.; Tang, J.; Zhang, J.H. Prolonged exposure to isoflurane ameliorates infarction severity in the rat pup model of neonatal hypoxia-ischemia. Transl. Stroke Res. 2011, 2, 382–390. [Google Scholar] [CrossRef] [PubMed] [Green Version]
  24. Fleiss, B.; Gressens, P. Tertiary mechanisms of brain damage: A new hope for treatment of cerebral palsy? Lancet Neurol. 2012, 11, 556–566. [Google Scholar] [CrossRef]
Figure 1. Representative T2W images from the mild (AD) and severe (EH) groups after 1 h and 1, 3, and 7 days after the HI insult. Slight hyperintensities are visible on the lesion sides in both groups at 1 h and 1 day after the HI insult (A,B,E,F). The hyperintensities in the lesion side are no longer visible in the mild group (C,D), but are more prominent in the severe group at 3 and 7 days after the HI insult (G,H). The cerebral volume of the lesion side appears to be slightly less than that of the control side at 3 days (C), which becomes notable at 7 days (D). However, in the severe group, the lesion side hemisphere appears to have a greater volume than the control side at 1 day and 3 days (G), and that relation inverted remarkably at 7 days (H).
Symmetry 14 00596 g001
Figure 2. Temporal changes in the mean cerebral volume of the lesion (white bars) and control (black bars) sides in the mild ((a), n = 6) and severe ((b), n = 7) groups, as well as the AIvolume in both groups ((c), mild group: whiter bars; severe group: black bars). The values for the mean cerebral volume at 1, 3, and 7 days after the HI insult were normalized using those at 1 h. *: p < 0.05; **: p < 0.01; ***: p < 0.001; ****: p < 0.0001.
Symmetry 14 00596 g002
Figure 3. Representative FAIR images from the mild (AD) and severe (EH) groups at 1 h and 1, 3, 7 days after the HI insult. The CBF on the lesion side appears lower in both groups at 1 h after the HI insult (A,E) and is recovered in the mild group (D) at 7 days, but not completely in the severe group (H).
Symmetry 14 00596 g003
Figure 4. Temporal changes in the mean CBF values of the lesion (white bars) and control (black bars) sides in the mild ((a), n = 6) and severe ((b), n = 7) groups and AICBF in both groups (c) (mild group: whiter bars; severe group: black bars). *: p < 0.05; **: p < 0.01; ***: p < 0.001; ****: p < 0.0001.
Symmetry 14 00596 g004
Publisher’s Note: MDPI stays neutral with regard to jurisdictional claims in published maps and institutional affiliations.

