Article

Numerical Simulation of Thermocapillary Convection in a Half-Zone Liquid Bridge Model with Large Aspect Ratio under Microgravity

1
Key Laboratory of National Education Ministry for Electromagnetic Process of Materials, Northeastern University, Shenyang 110819, China
2
School of Mechanical and Vehicle Engineering, Linyi University, Linyi 276012, China
*
Author to whom correspondence should be addressed.
Symmetry 2022, 14(3), 452; https://doi.org/10.3390/sym14030452
Submission received: 4 January 2022 / Revised: 22 January 2022 / Accepted: 2 February 2022 / Published: 24 February 2022

Abstract

:
The coupled momenta induced by thermal effects near interfaces cause complex three-dimensional flow structures, called thermocapillary flow or Marangoni convection. Thermocapillary convection is crucial for crystal growth quality, and the mainstream method used to study thermocapillary convection is the half-zone liquid bridge model. This paper designs a gas–liquid two-phase system and reports the numerical results on the instability and associated roll structures of thermocapillary convection in half-zone liquid bridge under microgravity environment. The gas and liquid transferred momentum and energy through the free surface. The geometry of interest is high aspect ratio (AR) silicone oil suspended between coaxial disks heated differentially. It was found that with the increase in AR, the vortex of thermocapillary convection gradually moves to the upper disk at the steady state. In the range of 2 < AR < 2.5, the vortex cell splits from 1 to 2, and the distance between the vortex center increases with the increase in AR. The flow field after the onset of instability exhibits a traveling wave with wave number m = 1 when AR ≤ 3 and exhibits a standing wave with wave number m = 1 when AR ≥ 3.5.

1. Introduction

When there is a tangential temperature gradient on the gas–liquid interface, the surface tension distribution on the interface is not uniform, which leads to the surface tension driven flow around the interface. The driving force produced on the interface due to the uneven surface temperature is called thermocapillary force, and the flow driven by thermocapillary force is called the thermocapillary convection. When there is a temperature difference, the buoyancy convection is weakened in the microgravity environment, and thermocapillary convection becomes the main convection in the fluid. The half floating zone model, by which the working fluid is maintained between the upper and lower coaxial copper columns, is widely used, not only in the study of thermocapillary convection, but also in the study of condensation and heat transfer between wet particles in fluidized beds [1,2,3]. This structure is also called the liquid bridge model. Thermocapillary convection has been studied for many years. Chun and Wuest [4] experimentally measured the velocity distribution of thermocapillary convection in a silicone oil layer; Schwabe and Schrmann [5] carried out several experiments of thermocapillary convection in the floating zone on the space station SPAS-1 and obtained the critical conditions of flow instability for the first time. Matsugase et al. [6] observed the transition process of thermocapillary convection from stable to oscillatory and, finally, to chaotic flows with the increase in temperature difference. When the height of the liquid bridge is H and the radius of the liquid bridge is R, the aspect ratio of the liquid bridge is defined as AR = H/R. In the ground experiment, the AR of liquid bridge is limited by the influence of gravity. When AR > 2, it is difficult for the liquid bridge to maintain the cylindrical shape, and the buoyancy convection will be enhanced, which affects the analysis of thermocapillary convection. However, there are relatively few space experiments on long liquid bridges. In a space experiment, Schwabe [7] studied the process in the liquid bridge of AR = 5 from steady to oscillation states under different temperature differences. Yano [8] et al. carried out many groups of thermocapillary convection experiments for long liquid bridges with different AR in space and found that AR affects the motion direction of the vortex in long liquid bridge. When AR < 2.5, the direction of the vortex is the same as that of the fluid on the free surface. When AR > 3, the direction of the vortex is opposite that of the fluid on the free surface.
Due to the large investment in microgravity experiments, the numerical simulation has gradually become the main means by which to study thermocapillary convection. Li et al. [9,10,11] completed the three-dimensional numerical simulation of thermocapillary buoyancy convection in an annular pool with silicon melt and silicon oil as the working fluid. They obtained the free surface temperature fluctuation when the thermal fluid wave appeared and determined the critical condition of flow instability. The simulation results were basically consistent with the experimental results of Azami et al. [12] and Schwabe [13]. Shevtsova [14] numerically studied the influence of shear flow on the thermocapillary convective instability of a liquid bridge under microgravity. It was found that the flow from the cold end makes it easier for the fluid flow in the liquid bridge to enter the instability. Minakuchi [15,16] et al. used the liquid bridge model to study the thermal solute capillary convection in SiGe. It was found that when the concentration difference exceeded the critical value, the flow in the liquid bridge would change from a two-dimensional steady state to a three-dimensional unstable state. Yano et al. [17] studied the thermocapillary convection of a long liquid bridge by numerical and experiment means. They adopted the silicon oil as the working medium and focused on the influence of surface heat dissipation on the flow instability. Nobuhiro [18] et al. considered the influence of thermal radiation in the study of thermocapillary convection in a long liquid bridge and found that 84% of the heat loss on the free surface was caused by radiation.
Although much research has been conducted on the thermocapillary convection for low AR liquid bridge models, most of the work for long-term liquid bridges is in the observation stage in microgravity experiments, and the numerical simulations were mainly limited to two-dimensional [17,18,19,20] ones. It is difficult for the two-dimensional model to reflect the oscillation of the thermocapillary convection, and it is difficult for the experimental results to accurately measure the temperature distribution and flow field structure in the liquid bridge [21,22]. In this paper, the thermocapillary convection in liquid bridges with AR ≥ 2 under microgravity is taken as the research object. Considering the coupling heat transfer between the free surface and the surrounding gas, the three-dimensional direct numerical simulation method is adopted to study the influence of AR on the stability of thermocapillary convection in the liquid bridge, and the evolution law of the flow pattern with Ma (Marangoni) number under different geometries is discussed.

2. Physical and Mathematical Models

The physical model is shown in Figure 1. The working fluid of the liquid bridge is 5 cSt silicone oil, and its periphery is sealed by a cylindrical Ar pipeline. The parameters are shown in Table 1. The radius of the liquid bridge is R and the height of the liquid layer is H. Initially, the temperature of the calculation domain is TC. At the beginning of the calculation, the upper disk temperature linearly increases to TH within 1 s, and then the temperature of the upper and lower disks remains constant. The surface tension gradient of the free surface drives the silicon melt on both sides of the free surface to flow from the upper disk to the lower disk. In the process of flow, the resistance mainly comes from the viscous force of silicone oil. Since the average temperature of silicone oil and the ambient temperature are not high, the heat loss caused by radiation is ignored.
The continuity equation, momentum equation and energy equation of thermocapillary convection in the Ar domain and liquid bridge are respectively as follows:
· u ( i ) = 0
u ( i ) t + ( u ( i ) · ) u ( i ) = 1 ρ ( i ) p ( i ) + ν ( i ) 2 u ( i )
T ( i ) t + ( v ( i ) · ) T ( i ) =   α ( i ) 2 T ( i )
where ρi, ui, pi, Ti, αi and νi are the density, velocity, pressure, temperature, thermal diffusivity and viscosity of the fluid. The superscript i represents silicone oil (i = l) or Ar (i = a). The velocity of the fluid in the upper and lower disk satisfies the condition of no slip.
Upper disk:
u l = 0 ,     T l = T h ,     u α = 0 ,     T α = T h .
Lower disk:
u l = 0 ,     T l = T h ,     u α = 0 ,     T α = T c .
The outermost tube wall surrounding the gas phase domain is an adiabatic non slip boundary:
u α = 0 ,     k α T α r = 0 .
Since the equilibrium condition of tangential stress and normal stress should be satisfied on the interface, the normal stress equilibrium condition of fluid is to add the effect of viscous stress into the equation:
( p l p a ) + n μ l S l n n μ a S a n = σ · ( n )
The equilibrium condition of tangential stress is as follows:
n μ l S l t n μ a S a t = ( t · )   σ
where μS is the viscous stress tensor and en and es are the normal and tangential directions of the free surface, respectively. In the normal stress balance condition, the first term on the left of the equation represents the pressure difference between two phases at the interface. The second and third terms on the left of the equation represent the normal components of the viscous stress vector of the silicone oil and the AR on the free surface, respectively. The tangential stress equilibrium condition is the same. The boundary condition at the interface is:
u l = u a
ν ( u z ) r | l + ν ( u z ) r | a = σ T T z | i n t e r f a c e
ν r r ( u θ r ) | l + ν r r ( u θ r ) | a = 1 r σ T T z | i n t e r f a c e
T l = T a
κ ( T ) r | l = κ ( T ) r | a
where uz, uθ and σ are axial velocity, tangential velocity and surface tension, respectively. The Marangoni number (Ma) is used to characterize the intensity of thermocapillary convection, the aspect ratio (AR) is used to characterize the geometry of the liquid bridge and the Prandtl number (Pr) is used to characterize the fluid properties:
M a = σ T Δ T h ν α | l ,     A R = h R ,     P r = ν α .
The finite volume method is used to discretize the governing equations. The second order central difference scheme and QUICK scheme are used for the diffusion term and the convection term, respectively. The PISO algorithm is used for pressure velocity correction, and a second order implicit scheme is used for the unsteady state term. The time step is 1.0 × 10⁻⁴ s. Figure 2 shows the calculation grid of the liquid bridge when the AR = 3. Due to the large velocity and temperature gradients near the disks and free surface, the grid is densified in these areas, and the uniform grid is used in the circumferential direction. In order to verify the correlation of grids, when the Ma = 73,846, three kinds of grids are used for calculation, and the results of free surface temperature and velocity are shown in Table 2. When the number of grids is 360,000 and 420,000, the relative errors of velocity and temperature are less than 1%. Therefore, considering the calculation time cost and accuracy, the number of grids is 360,000.
A ground experimental verification was performed to verify the present model and code, as shown in Figure 3. The upper and bottom disks of the liquid bridge were made of brass with good thermal conductivity. The experimental system was equipped with a side-view CCD camera, which was used to observe the overall flow pattern in the liquid bridge. Refer to our previous research for a detailed configuration of the experimental equipment [17]. The temperature difference between the upper and lower rods was 10 K. The numerical velocities in the center line of the liquid bridge and the multiple experimental velocities from the sampling points agreed relatively well with each other. Particle image velocimetry (PIV) was used to measure velocities of particles in the liquid bridge. In the process of velocity measurement, all measuring devices did not interfere with the flow field and had high measurement accuracy.

3. Results and Discussion

3.1. Axisymmetric Flow

Ma represents the intensity of thermocapillary convection. When the Ma number is lower than Mac (Yano et al. [8]), the flow field in the liquid bridge is axisymmetric. In this state, the flow field structure is greatly affected by AR. The streamline and temperature distribution on the x–z plane of a liquid bridge with different AR are shown in Figure 4. Where H = 30 mm, Pr = 67, Tc = 293 K and TH = Tc + ΔT, it can be seen that the flow field presents a single vortex structure when AR = 1 and 2 and a double vortex structure when AR = 2.5 and 3. In the space experiment of Yano et al. [8], similar vortex structures were reported, as well. When Pr = 67 and AR = 2.5 and 3, this is a double vortex, and when AR = 1, 1.5 and 2, it is a single vortex.
Figure 5 shows the velocity (Figure 5a) and temperature distribution (Figure 5b) on the free surface of a liquid bridge with different AR. There are two peaks on the free surface of the liquid bridge, which are located near the hanging wall and the footwall, respectively. When AR is small, the velocity gradient near the upper disk and lower disk is also small. With the increase in AR, especially after vortex splitting, the velocity gradients near the disks increase significantly, but the velocity in the main flow region also decreases. The velocity on the free surface affects the temperature distribution, and the temperature on the free surface also affects the velocity due to the coupling of the thermocapillary. The temperature gradient near the upper disk and lower disk of the free surface is higher than that of other regions, and the temperature gradient near the lower disk is higher than that near the upper disk. This is because the fluid flows from the high temperature to the low temperature region along the free surface, and the fluid continues to accelerate near the lower disk, which further increases the temperature gradient. The circle in Figure 5 represents the position of the vortex center, and the vortex center near the upper wall is almost at the end of the velocity peak region. When AR is small, the vortex center is near the middle line of the liquid bridge. With the increase in AR, the vortex center deviates further from the middle of the liquid bridge. When AR exceeds 2, a new vortex center appears below the middle of the liquid bridge.

3.2. Oscillating Flow

With the increase in the Ma number, the intensity of thermocapillary convection increases. When the Ma number exceeds the critical value (Mac), any small disturbance will be amplified and eventually form a three-dimensional oscillatory flow. Figure 6 shows the growth and amplification process of tangential velocity at the free surface monitoring point P (z = 0) for Ma = 11,211, Pr = 67 and AR = 2. At this time, the oscillation in the small disturbance of tangential velocity is gradually amplified, and then oscillates with a certain period, with the dominant frequency of 0.315, finally forming a three-dimensional time-dependent oscillatory flow.
Zhang et al. [23] found that AR is an important factor for the instability of thermocapillary convection in low Pr number fluid. Figure 7 is the temperature State Transform Diagram (STD) of the liquid bridge with AR = 2, 2.5 and 3 on the z = 0 plane. The temperature STD image shows a group of parallel and inclined striped lines, which indicates that the thermocapillary wave is a traveling wave (Peng et al. [24]). For traveling waves, the inclination angle of the stripes in the STD image reflects the propagation direction and speed of the thermocapillary wave. The smaller the inclination angle, the faster the propagation speed. When AR = 2, 2.5 and 3, the inclination angles of the stripes are 12°, 9° and 5°. This shows that the larger the AR, the faster the thermocapillary wave propagates. The stripe density reflects the oscillation frequency of the thermocapillary wave. It can be seen that the faster propagation speed of the thermocapillary wave leads to the larger oscillation frequency. Only reducing the radius of the liquid bridge but keeping other parameters unchanged increases the reflux intensity of the thermocapillary convection, which aggravates the flow instability and, finally, increases the temperature oscillation frequency. In the liquid bridge with low AR, this is one of the main factors affecting the wave number of the thermocapillary wave. The smaller the AR is, the more the wave number is (Zeng et al. [25]). However, in the high AR liquid bridge, the propagation direction and wave number of the thermocapillary wave have no obvious relationship with AR. From the top view, the propagation direction of the thermocapillary wave is counterclockwise, and the thermocapillary wave number is 1.
Figure 8a is the velocity vector of the x–z section of the liquid bridge with AR = 2 in quarter oscillation period. It can be seen from Figure 8a that the vortex of the AR = 2 liquid bridge in the x–z plane is always 2 in the oscillatory state. The vortices move back and forth between the upper and lower disks, and there is a half period phase difference between the left and right vortices. On the left side of the x–z plane, the vortex near the lower disk moves upward, while the vortex near the upper disk moves downward on the right side. Therefore, under the influence of oscillating thermocapillary convection, the vortices always disappear and appear periodically. In order to study the internal velocity oscillation intensity of the liquid bridge, the monitoring lines are taken at the positions of z = 10 mm and z = −10 mm, respectively. Due to the periodic flow of the flow field, the two sets of data extracted on the monitoring line are separated by a quarter of a cycle (t0). In Figure 8b–d, the upper part is the velocity of the monitoring line with z = 10 mm, and the lower part is that of z = −10 mm. It can be seen that in the upper half of the liquid bridge, the difference between the velocity on the free surface and the internal velocity is greater than that in the lower half. In the figure, the error line is represented as the oscillation amplitude, and it can be seen that the oscillation amplitude in the middle region of the liquid bridge of these types of ARs is small.
Figure 9 shows the isotherm (T = 296 K) in different AR liquid bridges at different times. The two selected moments are the highest position of the isotherm and the subsequent quarter cycle (t0). The temperature in the liquid bridge should be evenly distributed when there is no thermocapillary convection. Due to the long distance of reflux of the thermocapillary convection, it is difficult for the fluid to flow along the center of the liquid bridge in the process of oscillation, just like the steady-state flow, but it is inclined to the free surface. Due to the change in flow field structure, the temperature contour of the cross section at different heights of the liquid bridge is no longer concentric. It can be seen from the temperature contours at different times that the temperature distribution near the footwall is less affected by the oscillation, while the temperature distribution near the hanging wall is more affected by the oscillation. For different AR liquid bridges, the temperature iso-surface at 296 k presents an inclined cone. Since the oscillation state of thermocapillary convection in AR is a traveling wave, the conical iso-surface revolves around the central axis of the liquid bridge. This results in a large temperature change at different times of the same section in the middle of liquid bridge, as shown in Figure 9.
In order to quantitatively show the influence of the thermocapillary wave on the liquid bridges with different ARs, the liquid bridges of different ARs are divided into five equal parts according to different heights or concentric circles in Figure 10a,b, and the average temperature of each part is calculated. It can be seen that, due to the influence of thermocapillary convection, the average temperature in the central region of the liquid bridge is the lowest, and the average temperature near the free surface is the highest. In the z-axis direction, due to the thermocapillary convection, several periodic vortices appear in the flow field of the liquid bridge, resulting in the uniform temperature distribution. Without thermocapillary convection, the average temperature of the lowest layer is 294 K, which is 299 K at the uppermost wall. However, due to the influence of thermocapillary convection, the average temperature near the footwall increases, while the average temperature near the hanging wall decreases.
Since the thermocapillary force comes from the free surface, the temperature distribution on the free surface has important reference significance. In order to investigate the temperature variation on the free surface, four equidistant loops are selected on the free surface, as shown in Figure 11. The temperature at different positions on the free surface fluctuates in a small range, and the temperature of most regions varies from 298 K and 300 K. The results show that the temperatures of the loop lines at different locations are similar; that is, the high temperature area is concentrated on one side, while the low temperature area is concentrated on the other side. The position of the temperature minimum point at each height is different, and the temperature minimum point at each height has a stable phase difference. In most cases, the temperature near the upper disk is higher than that near the lower disk, but under the influence of thermocapillary convection, the temperature near the lower disk is higher in some places.
When AR = 3.5, the thermocapillary convection will change from traveling wave oscillation to standing wave oscillation. Figure 12 is the temperature STD diagram of the liquid bridge in the standing wave state on the z = 0 plane. The temperature STD image is in the shape of a wave, which indicates that the thermocapillary wave is a standing wave (Zhang et al. [26]). The thermocapillary wave number is also 1. Figure 12 also shows the temperature distribution in the liquid bridge at different times. In the z = 0 section, the standing wave makes the isotherm move left and right in a certain direction, while the traveling wave makes the isotherm rotate around the central axis.
Figure 13 shows the fluctuation of the velocity and temperature at the free surface monitoring point P (z = 0) of the liquid bridge with Ma = 11,211. It can be seen that the velocity vibration on the liquid bridge surface precedes temperature vibration at the standing wave state. When the isothermal surface of T = 296 K moves near the free surface, the height of the isothermal surface increases obviously. At this time, the temperature of the monitoring point on the free surface is at the peak. The height decreases when the isothermal surface passes near the central axis. Li et al. [11] also found that AR is one of the important factors that affects the fluctuation state of the thermocapillary wave. In the process of thermocapillary convection in a liquid pool, increasing the depth of the liquid pool will change the thermocapillary wave from the traveling wave to the standing wave, as well.
It can be seen from the above results that the thermocapillary convection will oscillate stably under the appropriate temperature difference. Therefore, it is necessary to investigate the oscillation frequency and intensity of different AR liquid bridges. Figure 14 shows the power spectral density (PSD) function for velocity and temperature at the monitoring point P (z = 0) on the free surface of different AR liquid bridges. The phase difference between velocity and temperature increases with the increase in the AR, and temperature always vibrates before velocity. This should be the phenomenon of thermocapillary convection from the temperature difference on the free surface. It can be seen from the PSD diagram that both temperature and velocity oscillations have a dominant frequency and a harmonic frequency. In the liquid bridge with the same AR, the dominant frequencies of velocity and temperature oscillations are basically the same, which is a feature of the thermal fluid wave (Li et al. [11]).
The results show that when AR is greater than 1, the transition sequence of thermocapillary convection with AR is as follows: traveling wave with wave number 2 > traveling wave with wave number 1 > standing wave with wave number 1. The transition sequence of thermocapillary convection with Ma is as follows: two-dimensional axisymmetric steady-state flow > thermal fluid wave > chaos. Figure 15 shows the flow regime transition regions for different Ma numbers and AR. It can be seen that the critical Marangoni number decreases with the increase in AR, and similar results are obtained in the experiment of Yano et al. [27] under microgravity.

4. Conclusions

In this paper, a series of numerical simulations are carried out on the basic and oscillation characteristics of thermocapillary convection with a long liquid bridge. The geometric and physical boundary conditions of all models are completely symmetrical. The flow structure in the flow field is axisymmetric or spatio-temporal symmetry. The main results are summarized as follows.
(1)
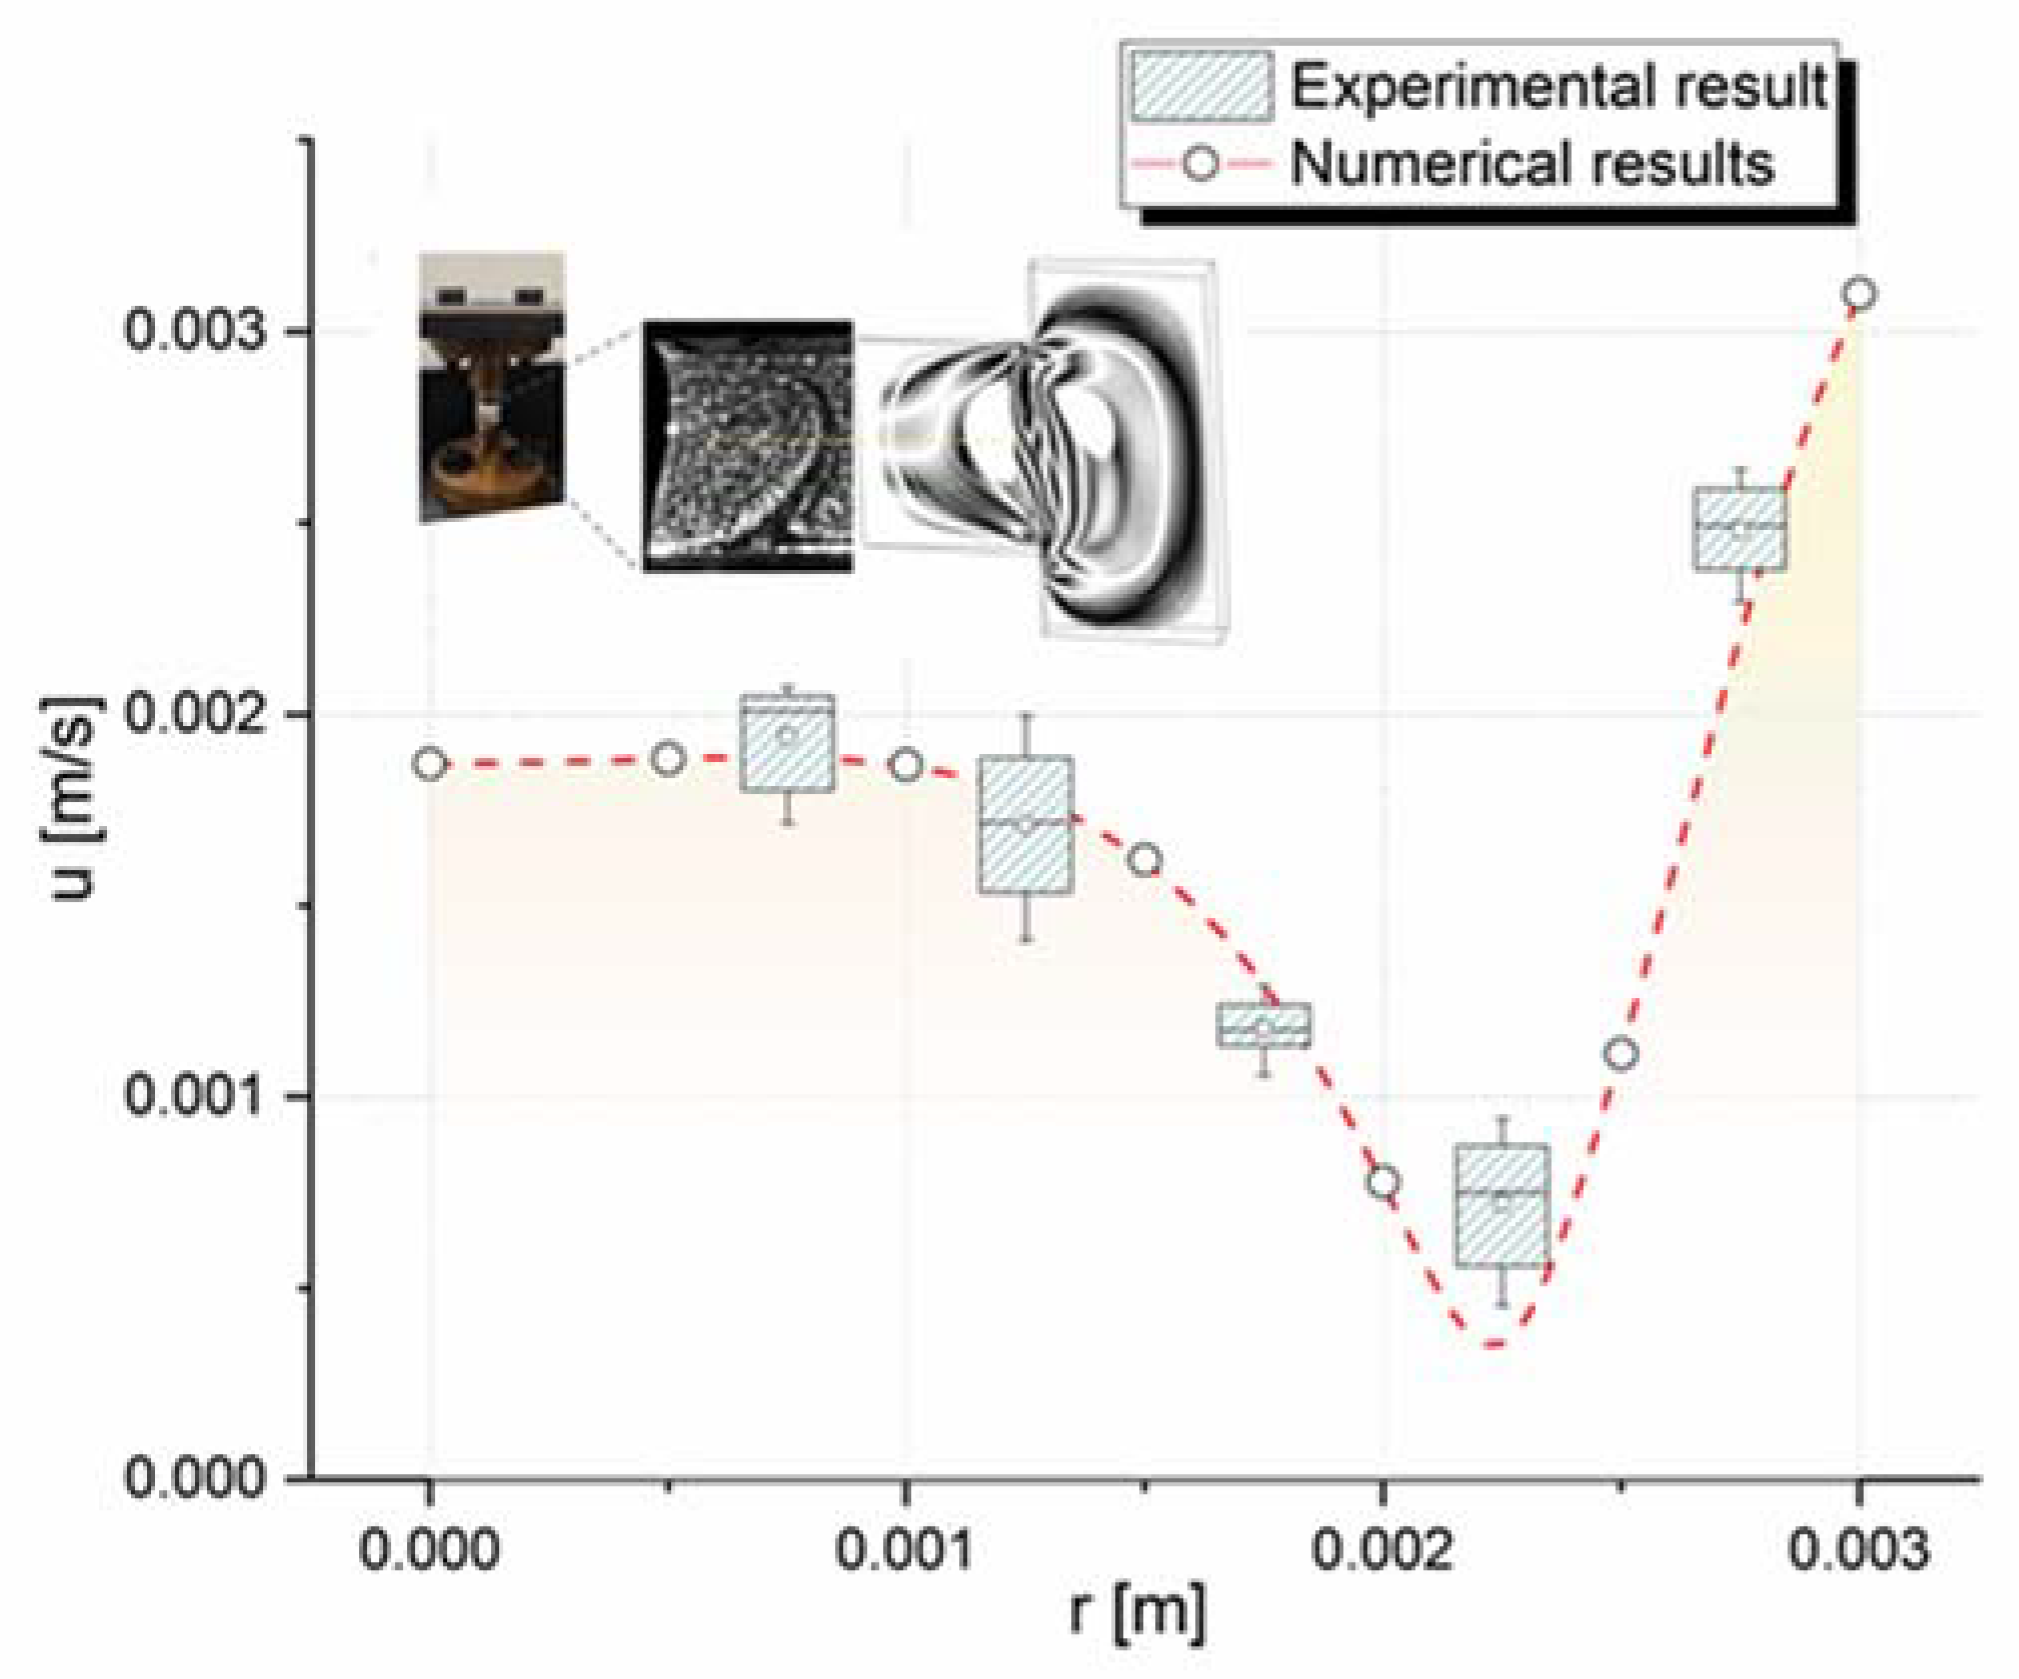
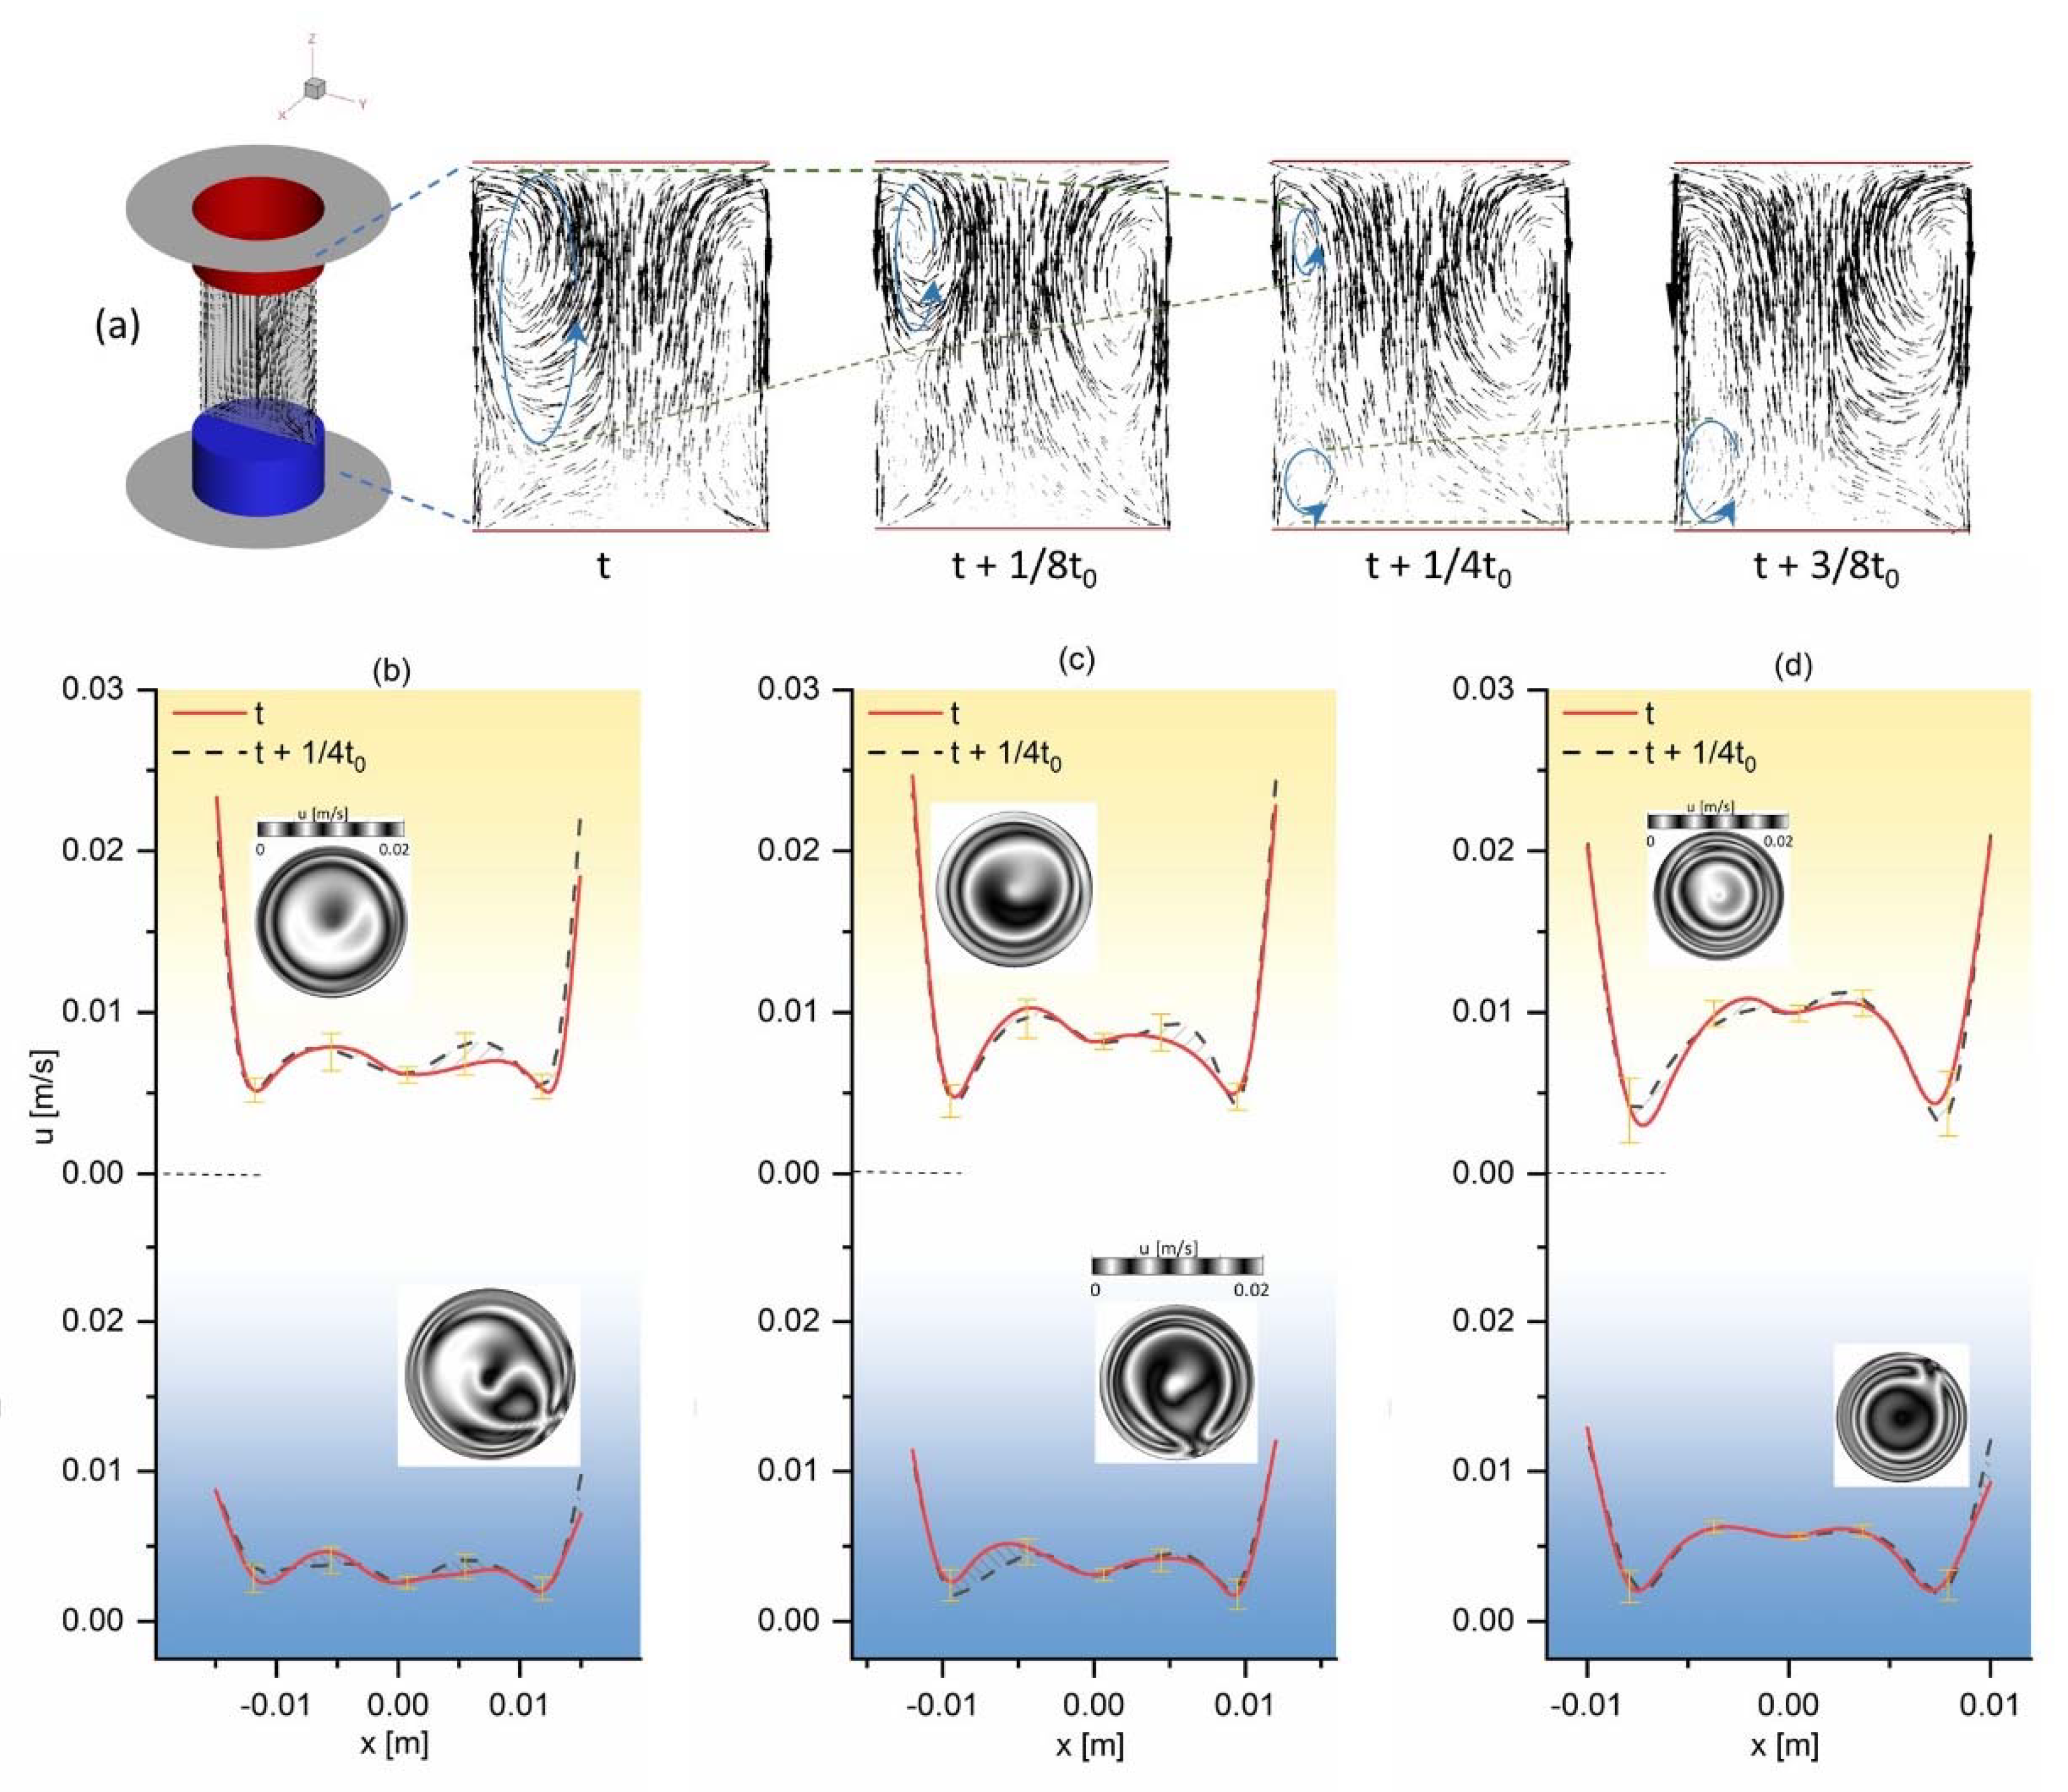
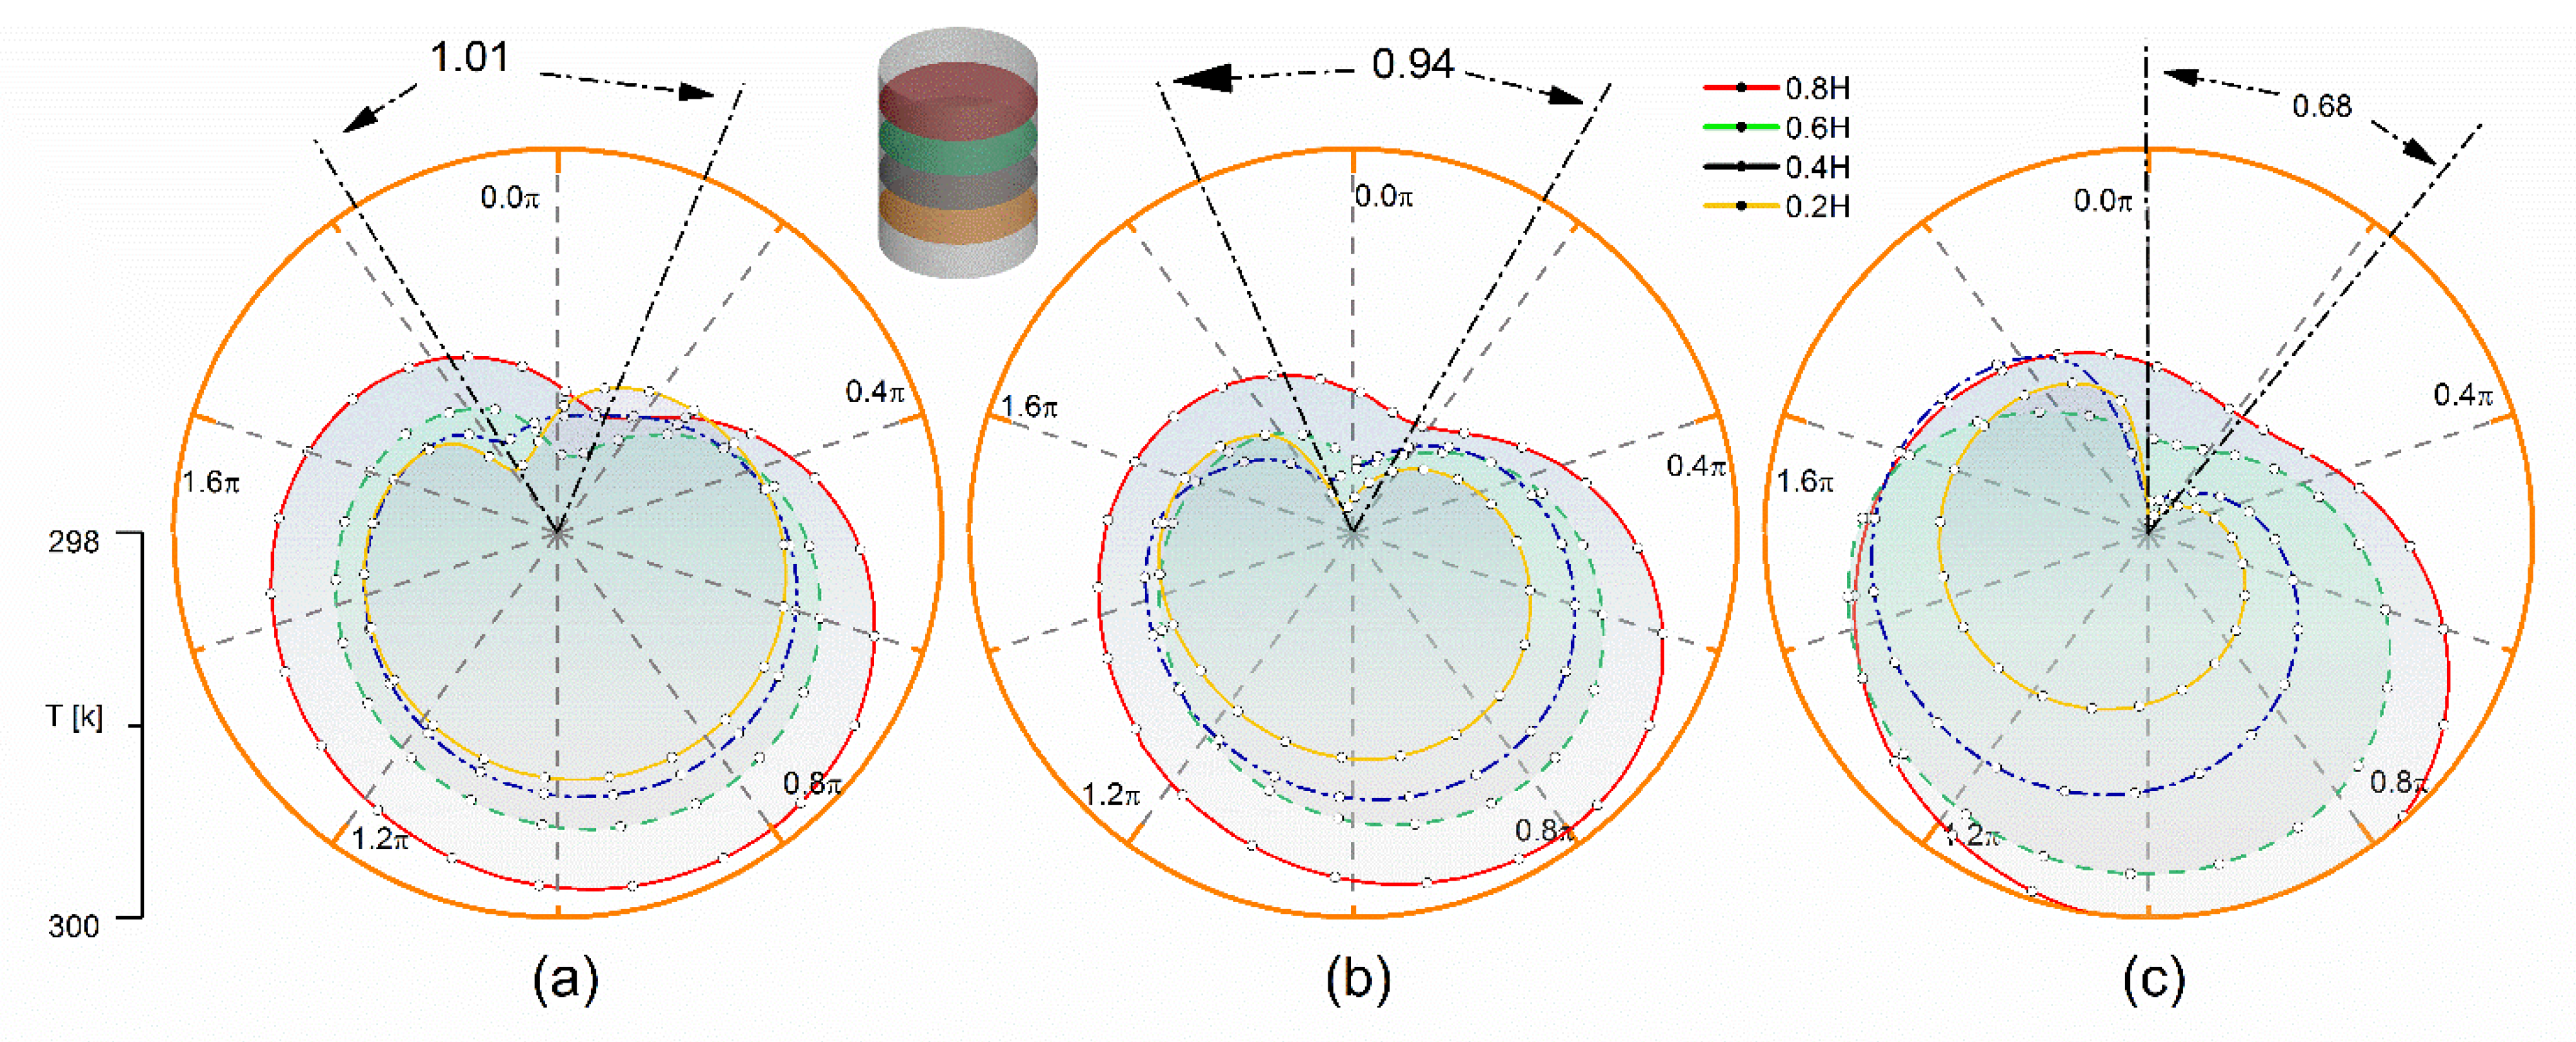
In the basic state, with the increase in AR, the vortex of thermocapillary convection gradually moves to the upper disk. In the range of 2 < AR < 2.5, the vortex cell splits from 1 to 2, and the distance between the vortex center increases with the increase in AR. When AR is larger, the average temperature on the free surface is also higher. The maximum velocity near the lower disk is not obviously affected by AR. In this state (the temperature difference between the upper and lower disks is small), the flow field structure in the liquid bridge is axisymmetric.
(2)
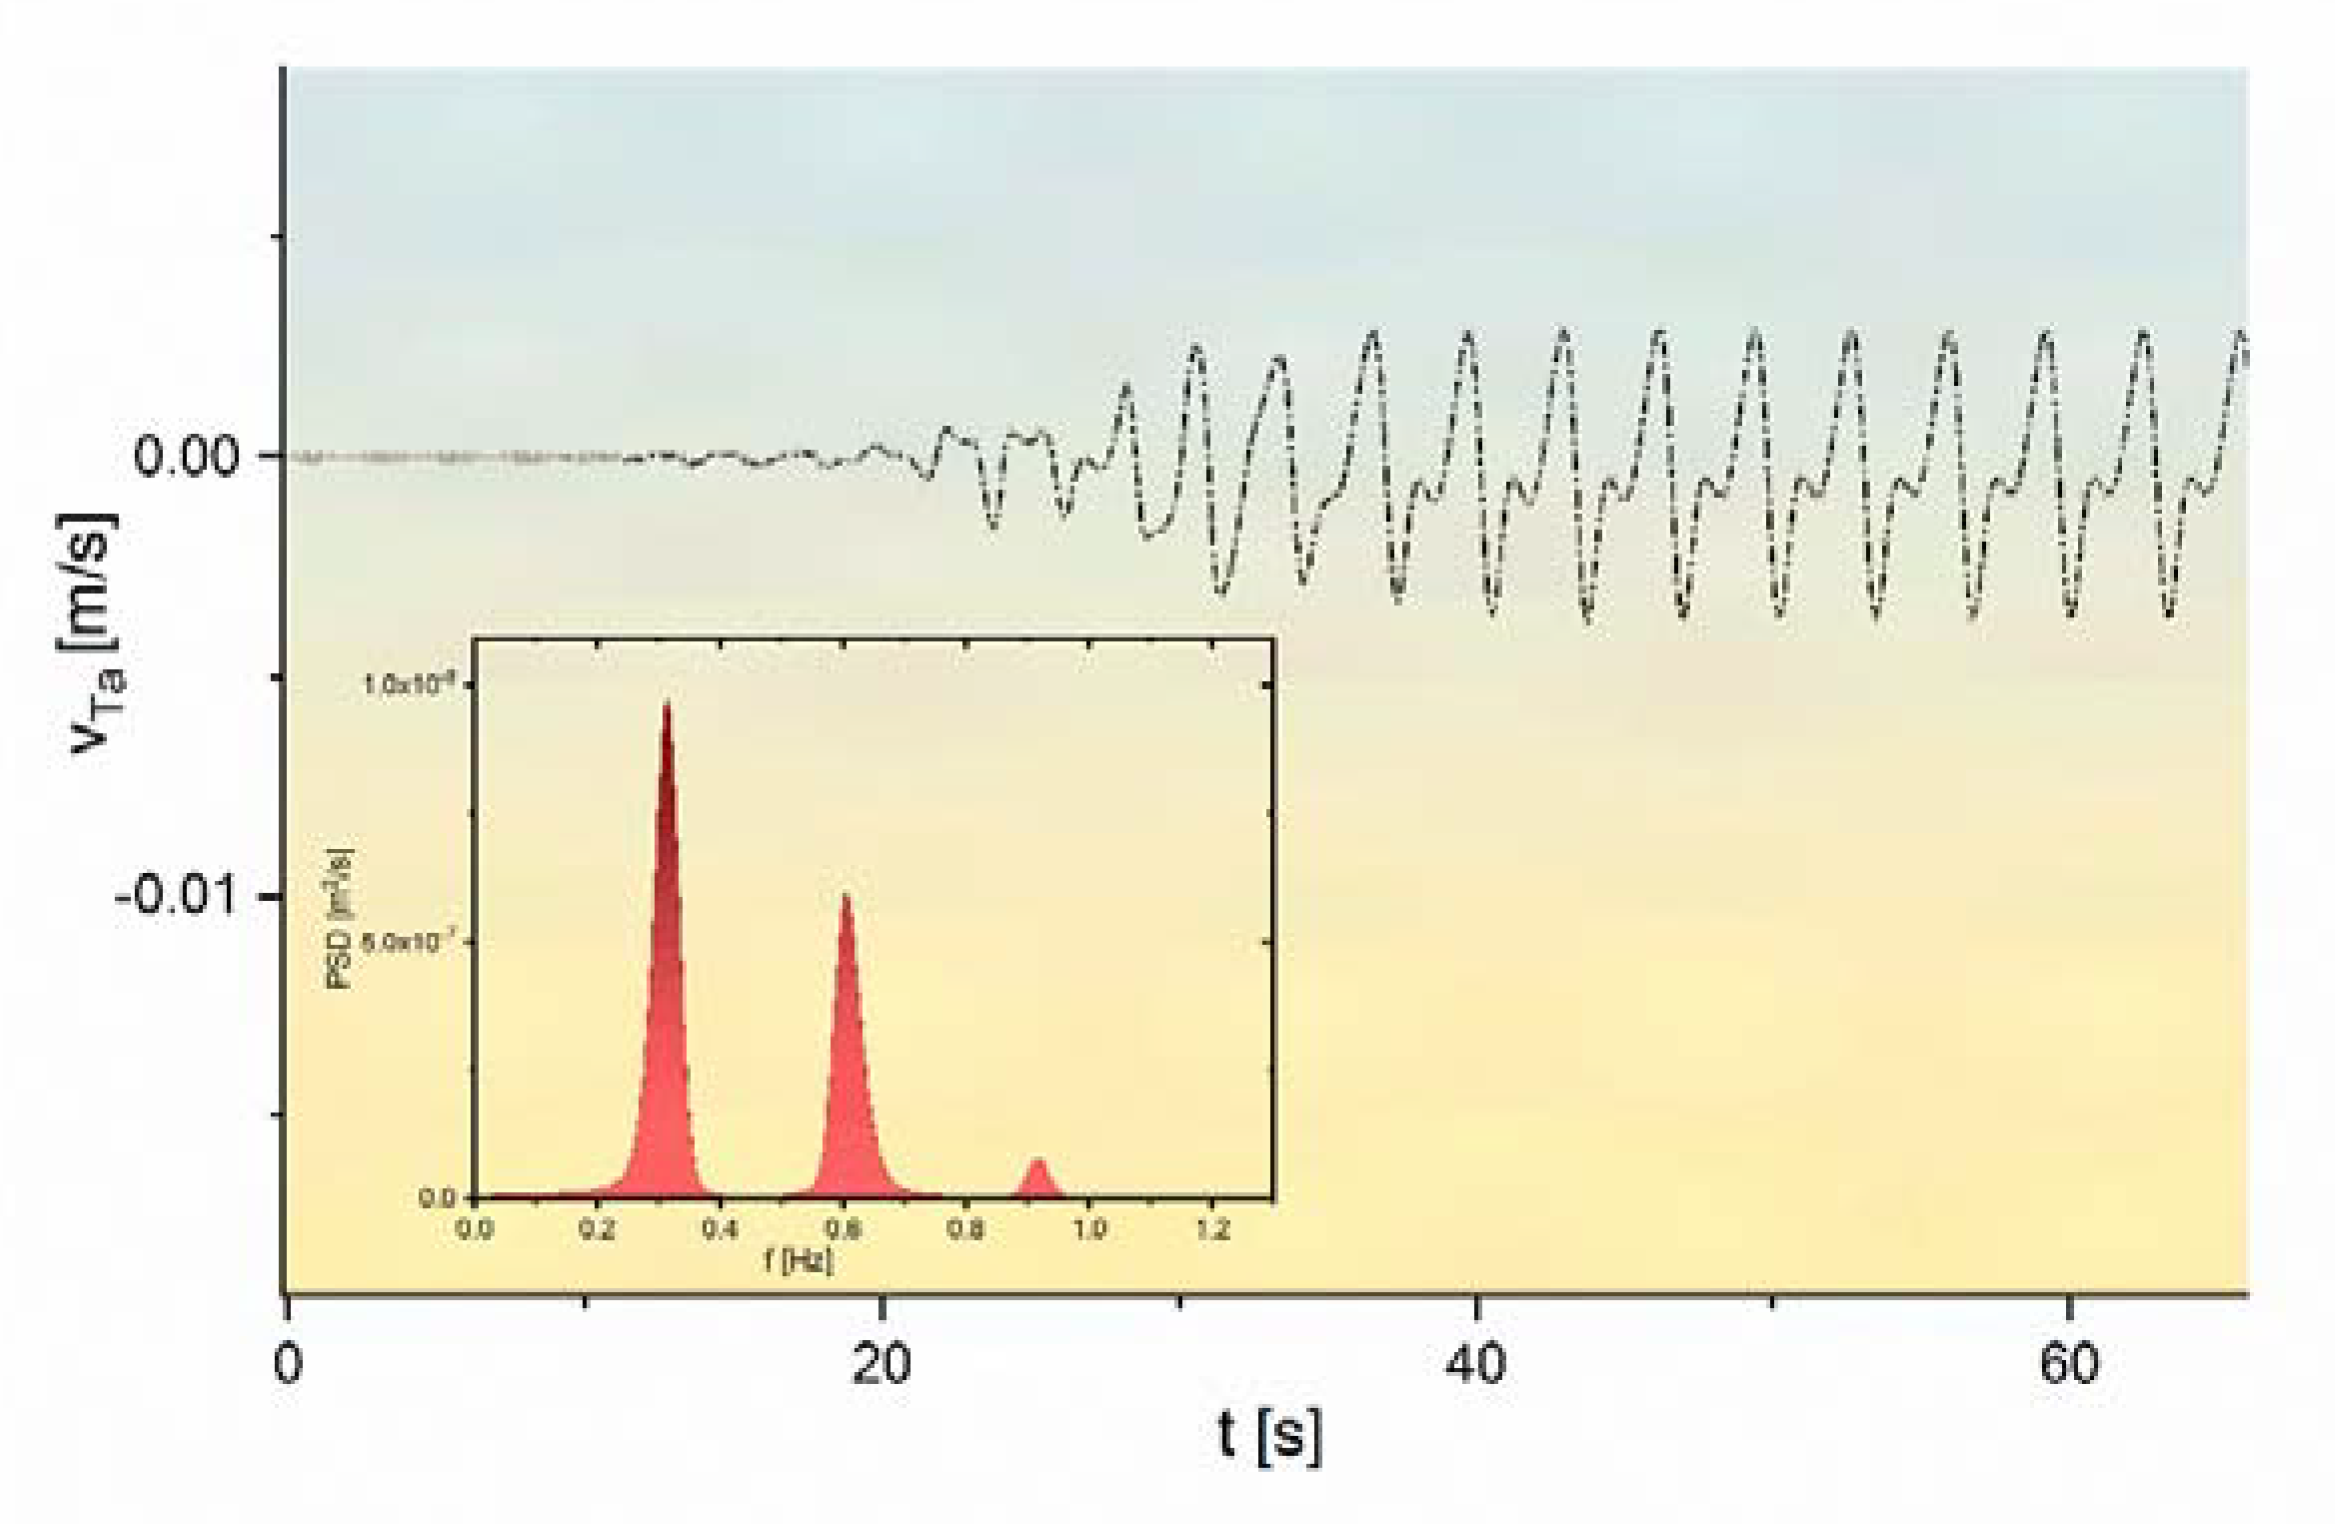
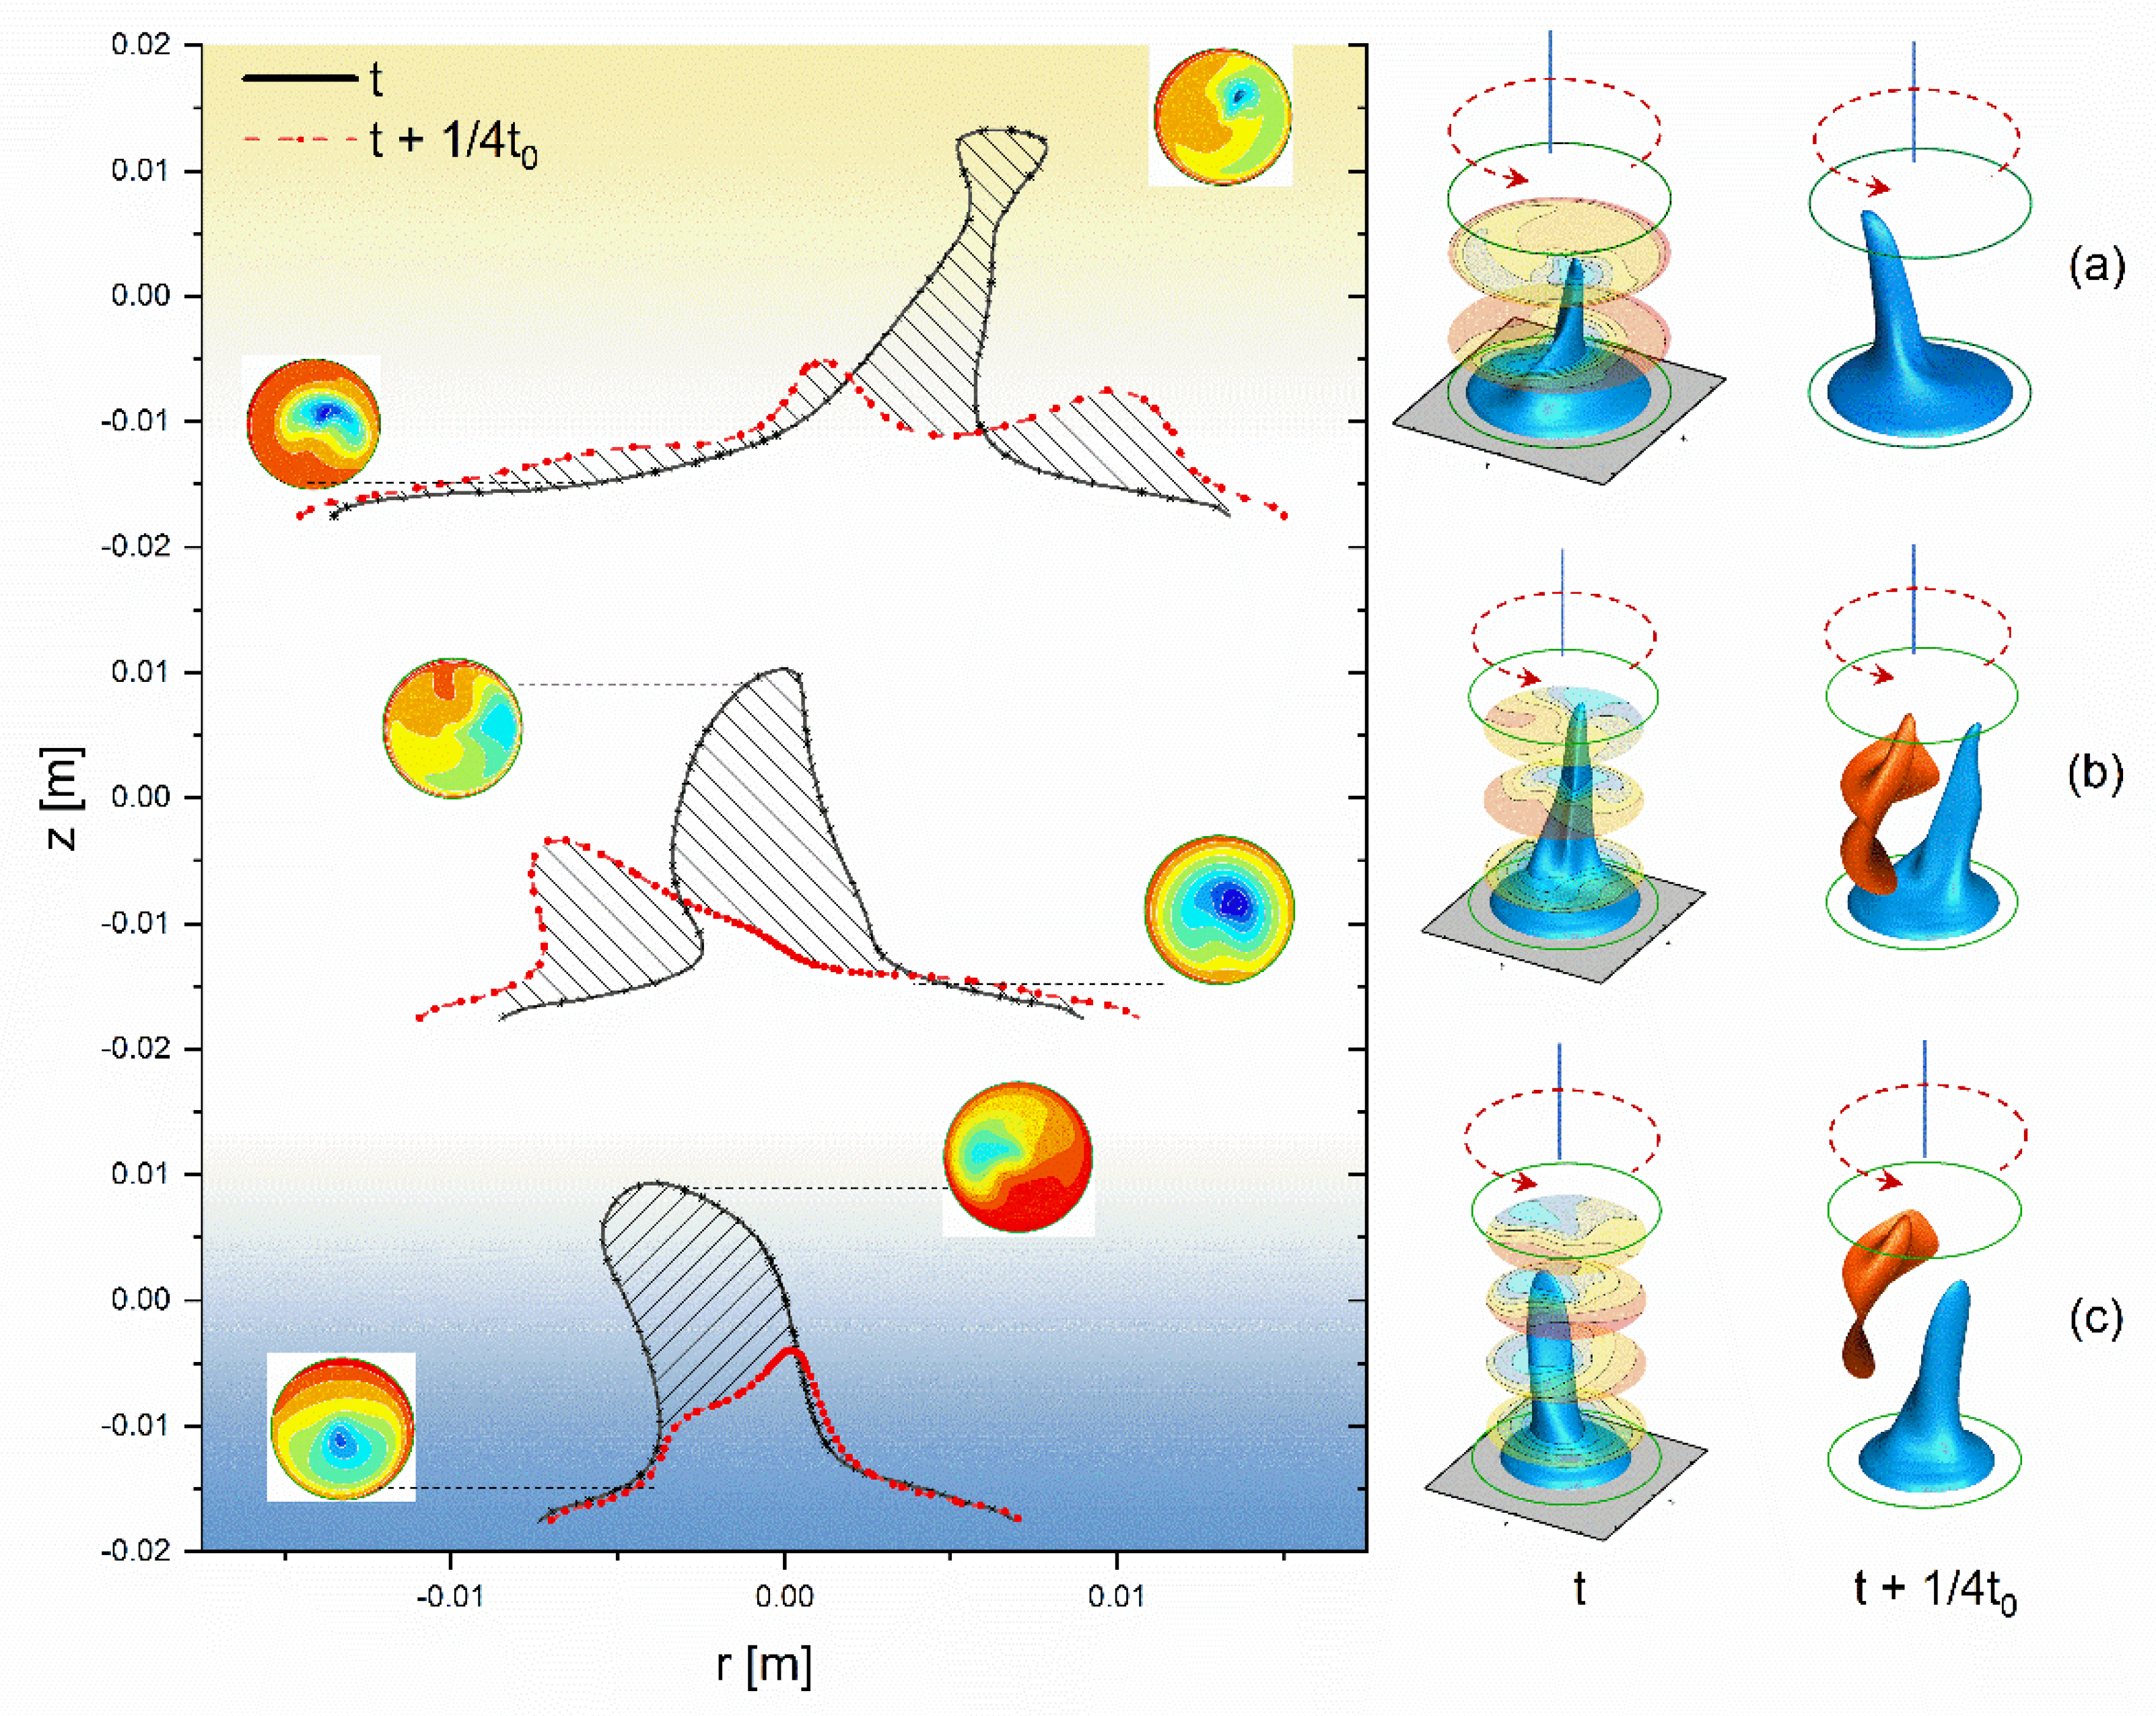
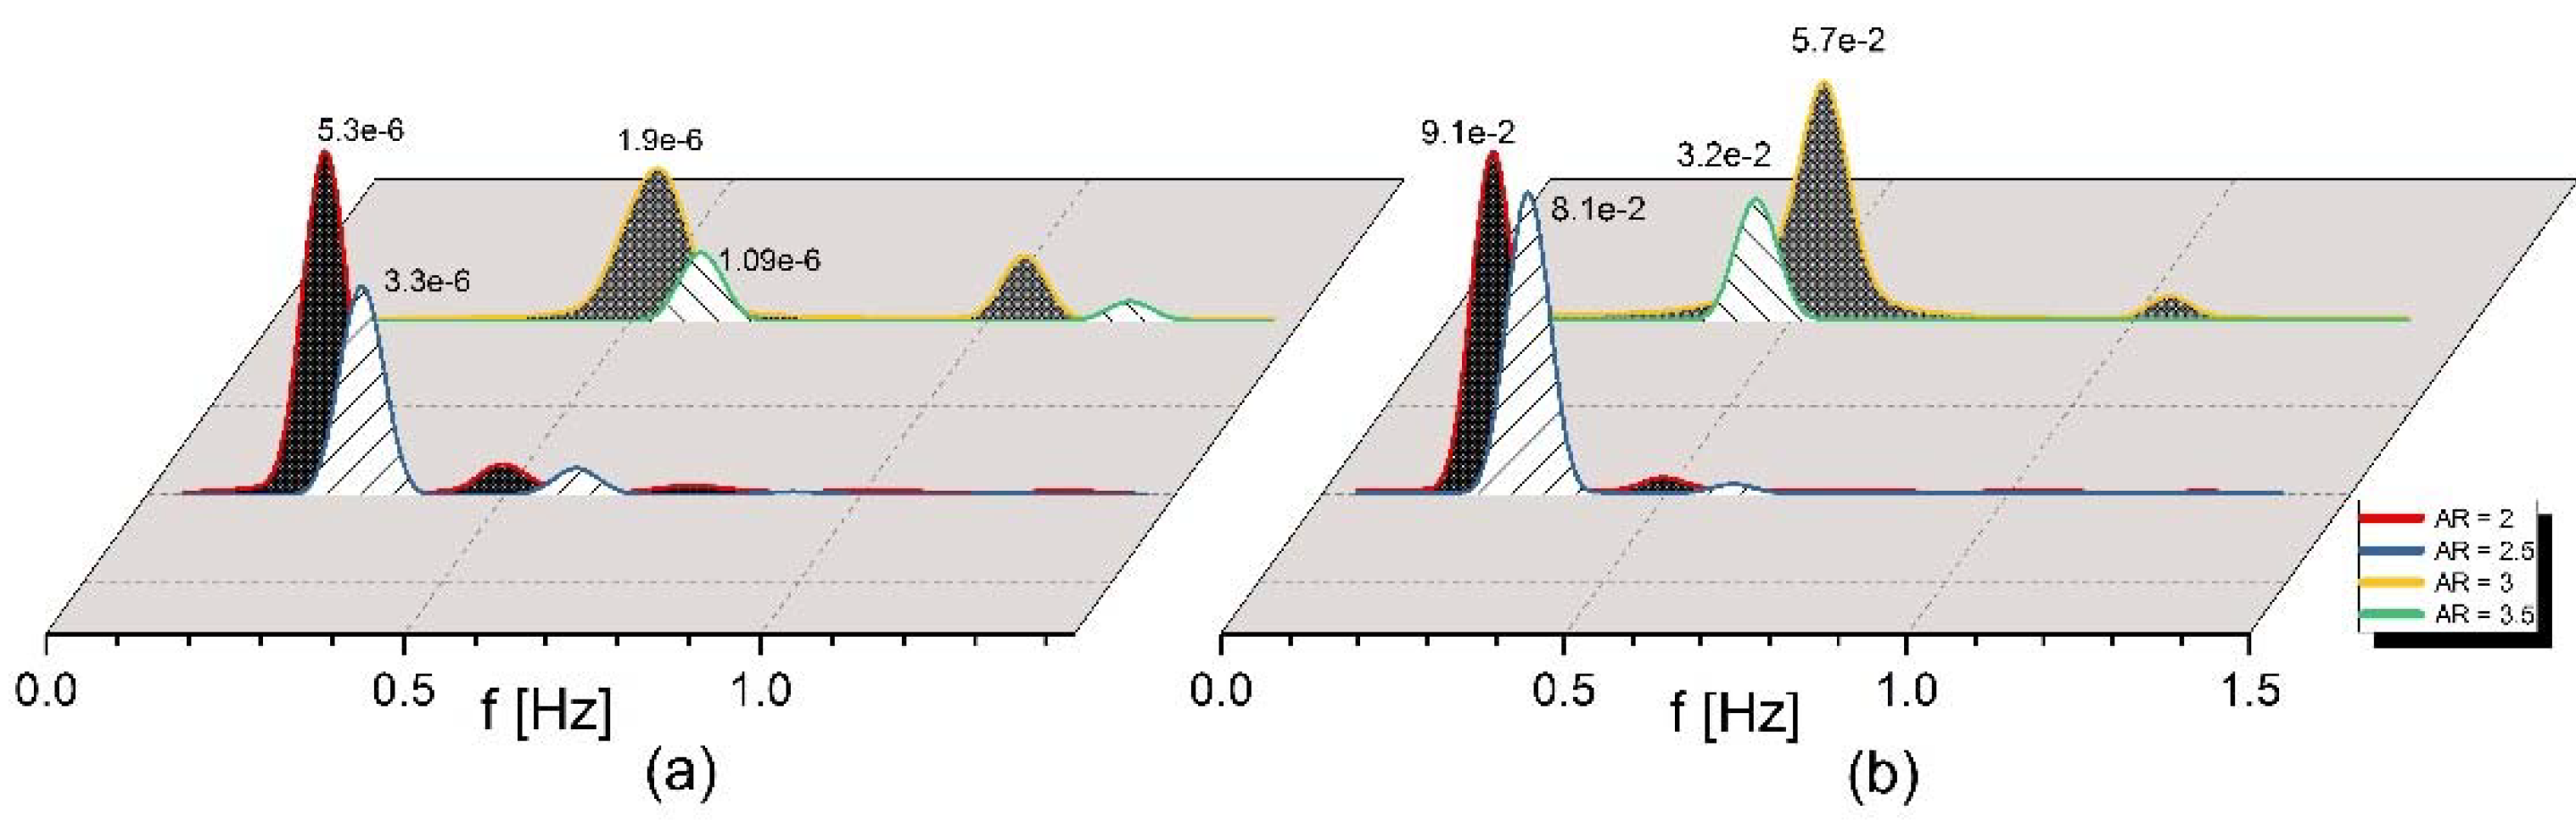
After the long liquid bridge changes from a steady to an oscillation state, the flow field structure and temperature distribution become more complex. When AR > 2, the vortex near the upper disk and the vortex near the lower disk on the x = 0 cross section squeeze each other and appear alternately. When AR = 2, the number of vortices on half side at the x = 0 section is 1, and the vortex moves up and down. In the oscillating state, the flow field structure in the liquid bridge shows spatio-temporal symmetry. The temperature wave in the liquid bridge rotates periodically around the axis of the liquid bridge.
(3)
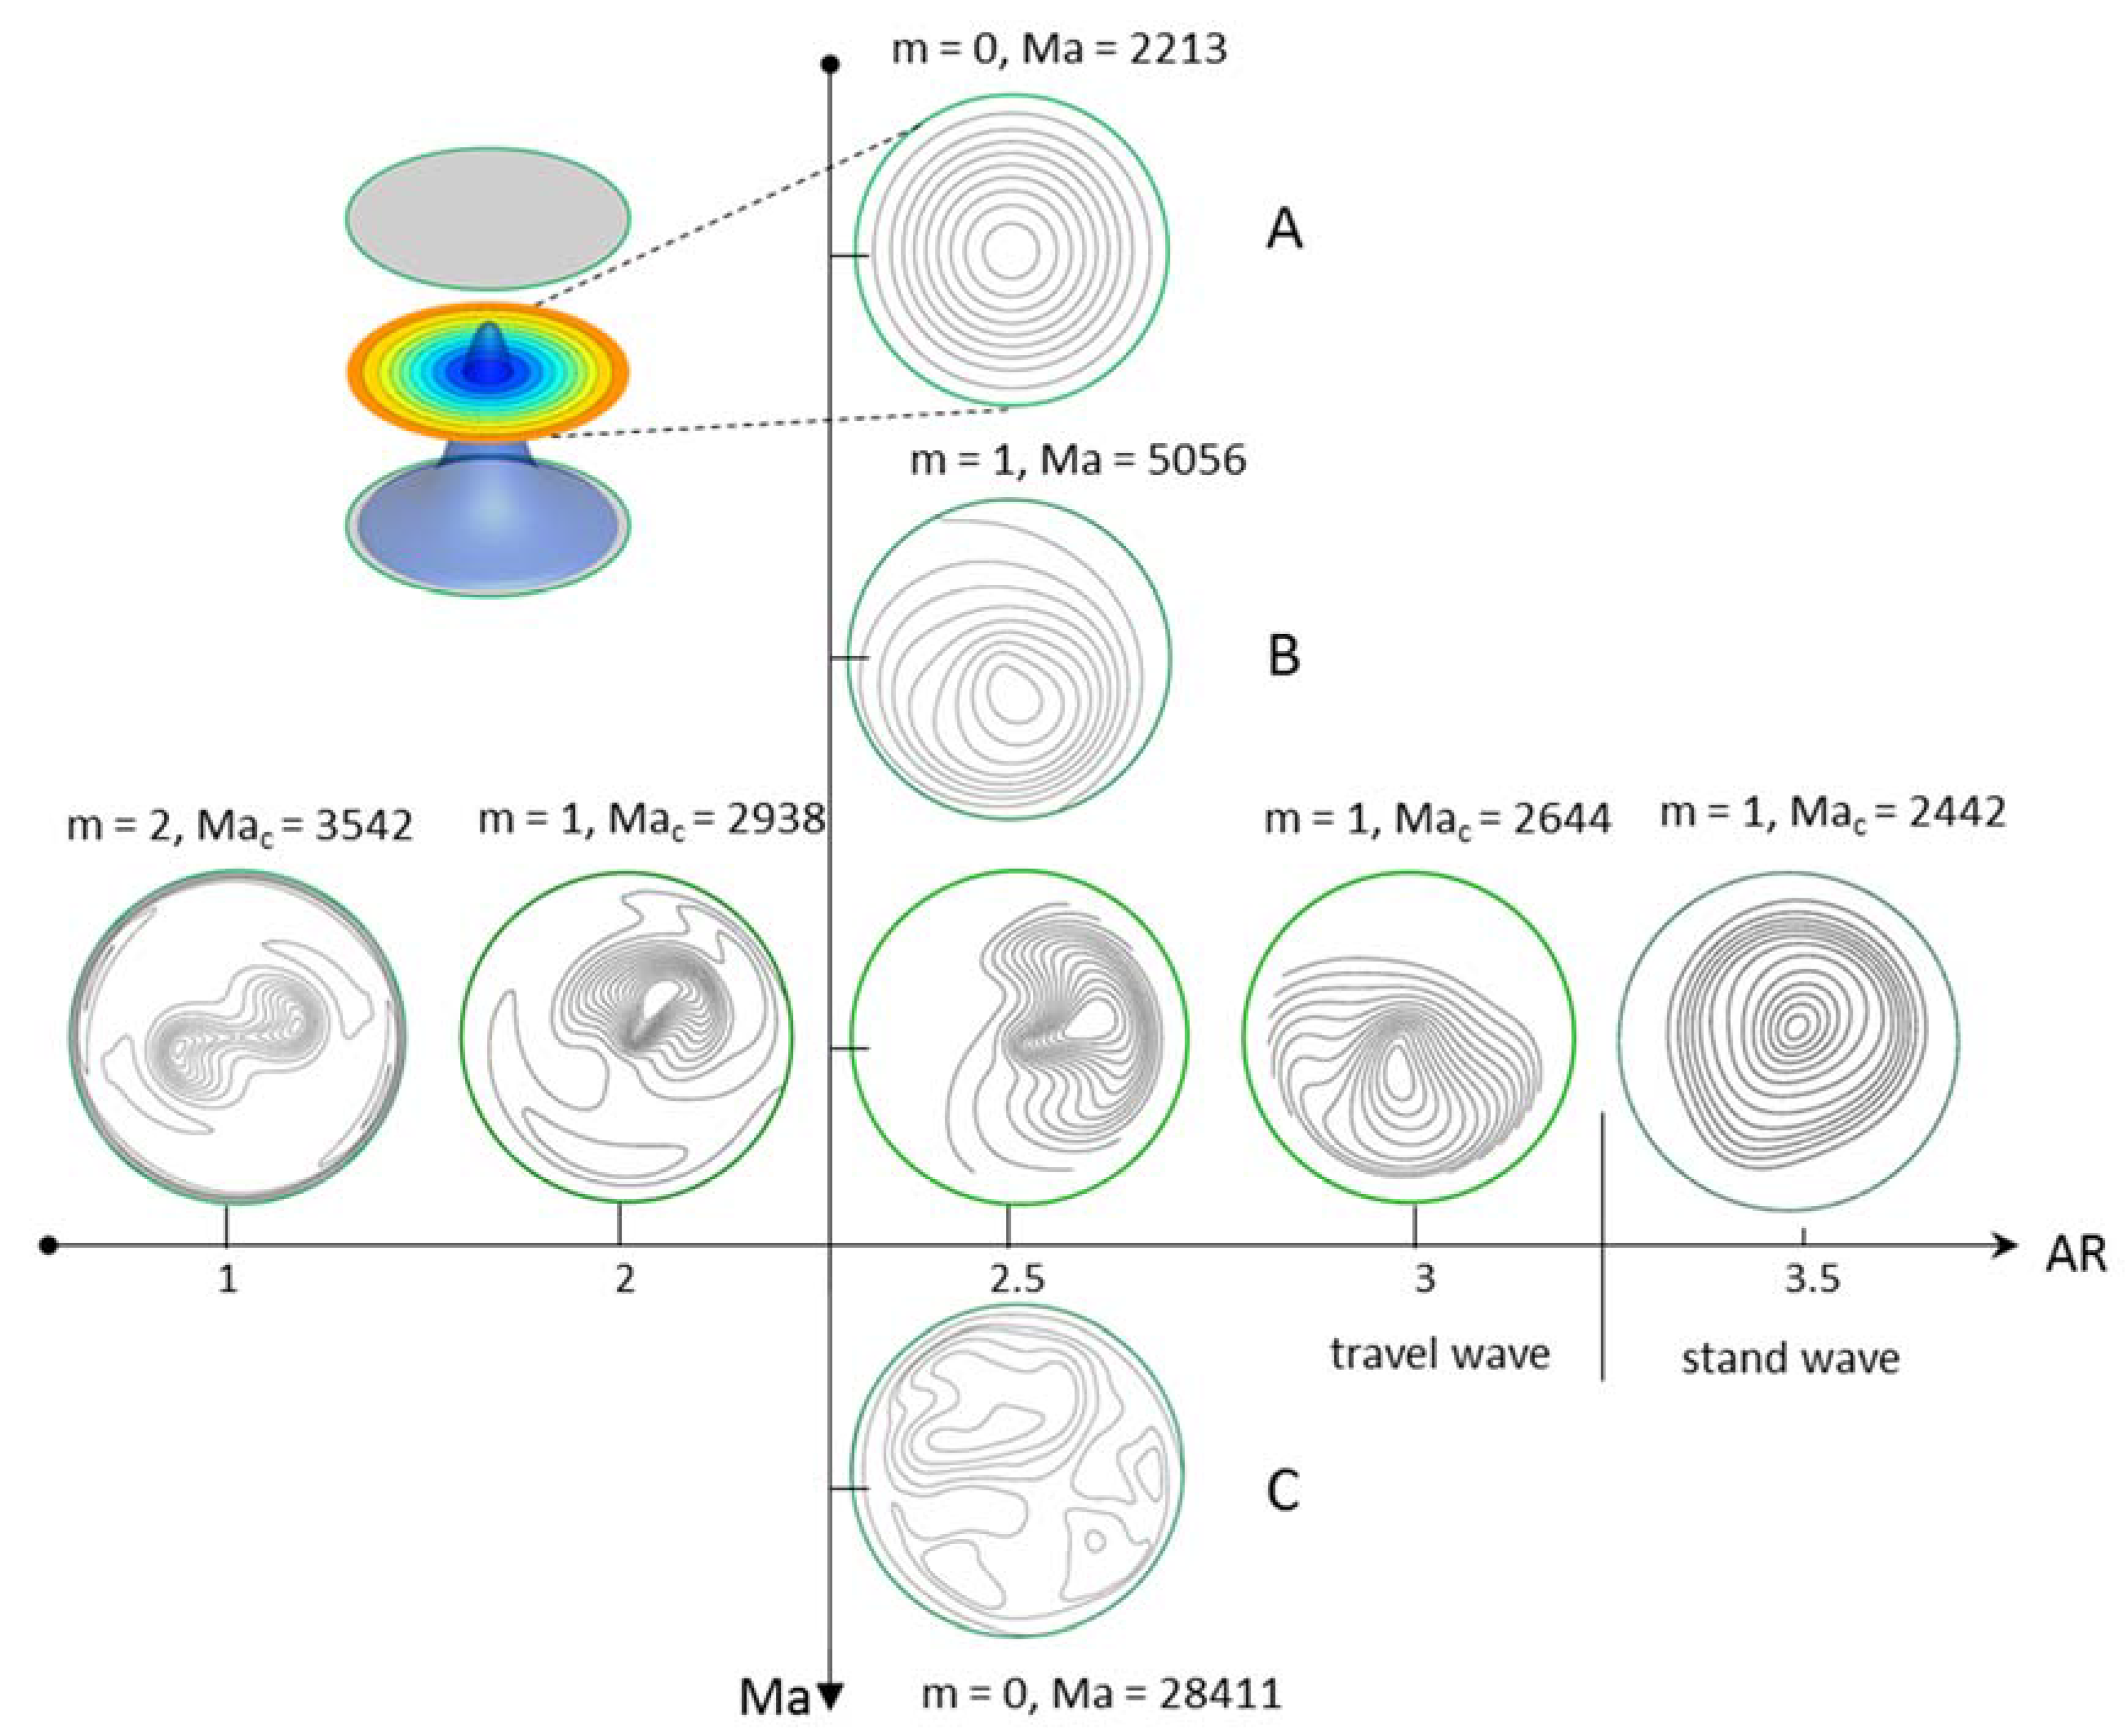
The critical Ma number of the long liquid bridge decreases with the increase in AR. When AR is between 2 and 3, the transition process of thermocapillary convection in a long liquid bridge is as follows: axisymmetric steady-state flow > thermal fluid wave traveling wave > chaotic flow. When AR = 3.5, the transition process of thermocapillary convection in a long liquid bridge is as follows: two-dimensional axisymmetric steady-state flow > thermal fluid wave standing wave > chaos. When AR > 1, the transition process of a liquid bridge is as follows: traveling wave of wave number 1 > standing wave of wave number 1. When the temperature difference between the upper and lower disks is large enough, the symmetrical structure (axisymmetric or spatio-temporal symmetry) of the flow field in the liquid bridge is destroyed.

Author Contributions

R.L. proposed the methodology, supervised the research and drafted the manuscript. J.F. finished the simulation and data curation work. All authors have read and agreed to the published version of the manuscript.

Funding

This research was funded by the National Natural Science Foundation of China, Grant number 51976087 and 51676031.

Institutional Review Board Statement

Not applicable.

Informed Consent Statement

Not applicable.

Data Availability Statement

The data presented in this study are available on request from the corresponding author.

Acknowledgments

The authors would like to express their gratitude to the Editor for his assistance, as well as the anonymous respected reviewers for providing insightful suggestions.

Conflicts of Interest

The authors declare no conflict of interest.

References

  1. Xiao, F.; Jing, J.; Kuang, S.; Yang, L.; Yu, A. Capillary forces on wet particles with a liquid bridge transition from convex to concave. Powder Technol. 2020, 363, 59–73. [Google Scholar] [CrossRef]
  2. Tang, Q.; Guo, W.; Chen, H.; Jia, R.; Zhou, Y. A discrete element simulation considering liquid bridge force to investigate the mechanical behaviors of methane hydrate-bearing clayey silt sediments. J. Nat. Gas Sci. Eng. 2020, 83, 103571. [Google Scholar] [CrossRef]
  3. Boyce, C.M. Gas-solid fluidization with liquid bridging: A review from a modeling perspective. Powder Technol. 2018, 336, 12–29. [Google Scholar] [CrossRef]
  4. Chun, C.H.; Wuest. A micro-gravity simulation of the marangoni convection. Acta Astronaut. 1978, 5, 681–686. [Google Scholar] [CrossRef]
  5. Schwabe, D.; Scharmann, A. Microgravity experiments on the transition from laminar to oscillatory thermocapillary convection in floating zones. Adv. Space Res. 1984, 4, 43–47. [Google Scholar] [CrossRef]
  6. Matsugase, T.; Ueno, I.; Nishino, K.; Ohnishi, M.; Sakurai, M.; Matsumoto, S.; Kawamura, H. Transition to chaotic thermocapillary convection in a half zone liquid bridge. Int. J. Heat Mass Transf. 2015, 89, 903–912. [Google Scholar] [CrossRef]
  7. Schwabe, D. Hydrodynamic instabilities under microgravity in a differentially heated long liquid bridge with aspect ratio near the rayleigh-limit: Experimental results. Adv. Space Res. 2005, 36, 36–42. [Google Scholar] [CrossRef]
  8. Yano, T.; Nishino, K.; Kawamura, H.; Ueno, I.; Matsumoto, S.; Ohnishi, M.; Sakurai, M. 3-d ptv measurement of marangoni convection in liquid bridge in space experiment. Exp. Fluids 2012, 53, 9–20. [Google Scholar] [CrossRef]
  9. Li, Y.R.; Peng, L.; Akiyama, Y.; Imaishi, N. Three-dimensional numerical simulation of thermocapillary flow of moderate prandtl number fluid in an annular pool. J. Cryst. Growth 2003, 259, 374–387. [Google Scholar] [CrossRef]
  10. Li, Y.R.; Imaishi, N.; Azami, T.; Hibiya, T. Three-dimensional oscillatory flow in a thin annular pool of silicon melt. J. Cryst. Growth 2004, 260, 28–42. [Google Scholar] [CrossRef]
  11. Li, Y.R.; Peng, L.; Wu, S.Y.; Zeng, D.L.; Imaishi, N. Thermocapillary convection in a differentially heated annular pool for moderate prandtl number fluid. Int. J. Therm. Sci. 2004, 43, 587–593. [Google Scholar] [CrossRef]
  12. Azami, T.; Nakamura, S.; Eguchi, M.; Hibiya, T. The role of surface-tension-driven flow in the formation of a surface pattern on a czochralski silicon melt. J. Cryst. Growth 2001, 233, 99–107. [Google Scholar] [CrossRef]
  13. Schwabe, D. Buoyant-thermocapillary and pure thermocapillary convective instabilities in czochralski systems. J. Cryst. Growth 2002, 237–239, 1849–1853. [Google Scholar] [CrossRef]
  14. Shevtsova, V.; Gaponenko, Y.A.; Nepomnyashehy, A. Thermocapillary flow regimes and instability caused by a gas stream along the interface. J. Fluid Mech. 2013, 714, 644–670. [Google Scholar] [CrossRef]
  15. Minakuchi, H.; Takagi, Y.; Okano, Y.; Gima, S.; Dost, S. The relative contributions of thermo-solutal marangoni convections on flow patterns in a liquid bridge. J. Cryst. Growth 2014, 385, 61–65. [Google Scholar] [CrossRef]
  16. Minakuchi, H.; Okano, Y.; Dost, S. Effect of thermo-solutal marangoni convection on the azimuthal wave number in a liquid bridge. J. Cryst. Growth 2017, 468, 502–505. [Google Scholar] [CrossRef]
  17. Liang, R.; Zhou, J.; Yang, S.; Zhang, Y.; Shi, J.; Xiao, S. Experimental study on transition characteristics of thermo-solutocapillary convection under buoyancy. Exp. Therm. Fluid Sci. 2019, 106, 38–47. [Google Scholar] [CrossRef]
  18. Shitomi, N.; Yano, T.; Nishino, K. Effect of radiative heat transfer on thermocapillary convection in long liquid bridges of high-prandtl-number fluids in microgravity. Int. J. Heat Mass Transf. 2019, 133, 405–415. [Google Scholar] [CrossRef]
  19. Yano, T.; Nishino, K. Numerical study on the effects of convective and radiative heat transfer on thermocapillary convection in a high-prandtl-number liquid bridge in weightlessness. Adv. Space Res. 2020, 66, 2047–2061. [Google Scholar] [CrossRef]
  20. Yano, T.; Hirotani, M.; Nishino, K. Effect of interfacial heat transfer on basic flow and instability in a high-prandtl-number thermocapillary liquid bridge. Int. J. Heat Mass Transf. 2018, 125, 1121–1130. [Google Scholar] [CrossRef]
  21. Yang, S.; Liang, R.; Wang, G.; Gao, Y.; Ma, R.; Xu, Y.; Xia, Y. The experimental investigation on dynamic response of free surface for non-isothermal liquid bridge with the varying shear airflow. Exp. Therm. Fluid Sci. 2018, 98, 662–673. [Google Scholar] [CrossRef]
  22. Yang, S.; Ma, R.; Deng, Q.; Wang, G.; Gao, Y.; Ma, S. The effect of uniform magnetic field on spatial-temporal evolution of thermocapillary convection with the silicon oil based ferrofluid. J. Therm. Sci. 2020, 24, 4159–4171. [Google Scholar] [CrossRef] [Green Version]
  23. Zhang, L.; Li, Y.R.; Wu, C.M.; Liu, Q.S. Flow bifurcation routes to chaos of thermocapillary convection for low prandtl number fluid in shallow annular pool with surface heat dissipation. Int. J. Therm. Sci. 2018, 125, 23–33. [Google Scholar] [CrossRef] [Green Version]
  24. Peng, L.; Li, Y.R.; Shi, W.Y.; Imaishi, N. Three-dimensional thermocapillary-buoyancy flow of silicone oil in a differentially heated annular pool. Int. J. Heat Mass Transf. 2007, 50, 872–880. [Google Scholar] [CrossRef]
  25. Zeng, Z.; Mizuseki, H.; Chen, J.Q.; Ichinoseki, K.; Kawazoe, Y. Oscillatory thermocapillary convection in liquid bridge under microgravity. Mater. Trans. 2004, 45, 1522–1527. [Google Scholar] [CrossRef] [Green Version]
  26. Zhang, L.; Li, Y.R.; Wu, C.M.; Liu, Q.S. Flow pattern transition and destabilization mechanism of thermocapillary convection for low prandtl number fluid in a deep annular pool with surface heat dissipation. Int. J. Heat Mass Transf. 2018, 126, 118–127. [Google Scholar] [CrossRef] [Green Version]
  27. Yano, T.; Nishino, K.; Kawamura, H.; Ueno, I.; Matsumoto, S. Instability and associated roll structure of marangoni convection in high prandtl number liquid bridge with large aspect ratio. Phys. Fluids 2015, 27, 024108. [Google Scholar] [CrossRef]
Figure 1. The geometry of the problem.
Symmetry 14 00452 g001
Figure 2. The computational mesh.
Symmetry 14 00452 g002
Figure 3. Comparison results of the thermocapillary convection flow.
Symmetry 14 00452 g003
Figure 4. Flow structure observation along AR (a) AR = 1, (b) AR = 2, (c) AR = 2.5 and (d) AR = 3.
Symmetry 14 00452 g004
Figure 5. Profiles of the (a) surface temperature and (b) axial surface velocity along the axial direction.
Symmetry 14 00452 g005
Figure 6. Growth of the azimuthal velocity disturbance and the PSD at Ma = 11,211 and AR = 2.
Symmetry 14 00452 g006
Figure 7. Temperature isoline (left) and STD (right) at Ma = 11,211 on z = 0 plane for 3-D oscillatory flow at (a) AR = 2, (b) AR = 2.5 and (c) AR = 3.
Symmetry 14 00452 g007
Figure 8. Time series of velocity of oscillatory thermocapillary convection for (a) AR = 2 and velocity on monitoring line z = 10 (upper) and z = −10 (lower) for (b) AR = 2, (c) AR = 2.5 and (d) AR = 3.
Symmetry 14 00452 g008
Figure 9. Time series of temperature fields of oscillatory thermocapillary convection for (a) AR = 2, (b) AR = 2.5 and (c) AR = 3.
Symmetry 14 00452 g009
Figure 10. Average temperature for LB with different AR at (a) axial direction and (b) radial direction.
Symmetry 14 00452 g010
Figure 11. Distribution of temperature in a tangent direction on the free surface. (a) AR = 2, (b) AR = 2.5 and (c) AR = 3.
Symmetry 14 00452 g011
Figure 12. STD (right) on z = 0 plane for 3-D oscillatory flow of the standing wave at AR = 3.5.
Symmetry 14 00452 g012
Figure 13. Velocity (dashed line) and temperature (solid line) fluctuations at z = 0 on the free surface.
Symmetry 14 00452 g013
Figure 14. Power spectral density (PSD) function for (a) velocity and (b) temperature at the monitoring point P (z = 0) on the free surface.
Symmetry 14 00452 g014
Figure 15. Diagram of flow patterns (A): the basic flow, (B) the oscillatory flow and (C) the chaos flow.
Symmetry 14 00452 g015
Table 1. Physical properties of silicon melt and argon gas.
ParameterSilicon MeltArgon
Prandtl number, Pr0.0110.67
Density, ρ (kg/m3)25301.63
Kinematic viscosity, ν (m2/s)5.0 × 10−61.39 × 10−5
Thermal diffusivity, α (m2/s)7.46 × 10−82.08 × 10−5
Thermal conductivity, k [W/(mK)]0.120.018
Specific heat, cp [J/(kgK)]1.76 × 1035.22 × 102
Temperature coefficient of surface tension, σT [N/(mK)]−7 × 10−5-
Table 2. Mesh dependence test.
GridT/Ku/(m·s−1)
300,000291.3770.021
360,000291.4080.022
420,000291.410.022
Publisher’s Note: MDPI stays neutral with regard to jurisdictional claims in published maps and institutional affiliations.

