
Symmetries in the Superposition Model of Extensive Air Shower Development


Faculty of Physics and Applied Informatics, University of Lodz, Pomorska 149/153, 90-236 Lodz, Poland
Symmetry 2022, 14(3), 559; https://doi.org/10.3390/sym14030559
Submission received: 21 January 2022
/
Revised: 15 February 2022
/
Accepted: 8 March 2022
/
Published: 11 March 2022
(This article belongs to the Section Physics)
Abstract
:According to the superposition principle, an extensive air shower initiated by a nucleus with energy E and mass number A can be approximated as the superposition of A proton-initiated showers each with energy . The superposition principle for interactions of atomic nuclei proposes to describe nucleus-initiated extensive air showers using simulations performed for proton showers. Single detectors and systems working in tight coincidence mainly register events initiated by particles with very low energies, which are affected by major statistical fluctuations, such as those used in high schools for education and outreach purposes. Verifying whether the superposition principle is still a good approximation in the low-energy region is important for the validity of the interpretation of such measurements. We present results of the comparison of results of the superposition model with detailed simulations of showers with the CORSIKA program from the energy of 10 GeV. While the energy dependence of the mean shower parameters satisfies the superposition principle, the higher moments do not. A modification of the superposition model based on the wounded nucleon model, reducing these discrepancies, is proposed. The semi-analytical description of showers in the modified superposition model can give the density spectrum of cosmic ray particles, which is consistent with the measurements. In this paper, we present results both consistent with the superposition model and indicating the need for its modification. This modification is proposed and tested.
1. Introduction
The surface detector arrays of the largest Extensive Air Shower (EAS) experiments, such as the Pierre Auger Observatory [1] or the Telescope Array [2], combine local triggers based on signals from individual stations into higher-level triggers combining local triggers from neighbouring stations, and so on hierarchically to finally record the events of interest. It was these composite interlinks of local triggers that made it possible in practice to measure ultra-high-energy cosmic-ray (UHECR) flux above 10 eV, which is on the order of one particle per few km per century. The construction of larger surface detector arrays for the measurement of increasingly higher cosmic-ray energies, where the flux is increasingly lower is, today, only considered theoretically with the prospect of realization in the next decades [3]. For larger statistics measurements above the Greisen–Zatsepin–Kuzmin cut-off, new techniques are needed, such as satellite or radio measurements, which dozens or hundreds of scientists from many countries are working on [4,5].
On the other hand, there has recently been considerable interest in small-scale EAS experiments to satisfy young people’s scientific curiosity and develop their interest in science. Small local (school) EAS arrays can play an important role in education. They represent one of the few “hands-on” opportunities for secondary school students to learn about nuclear physics, modern high-energy physics, and particle physics. The clear scale symmetry between the large, largest, and small local physics experiments reflects the physical consistency of the description of showers with giant numbers of particles counted in billions and the smallest ones with a few particles reaching the surface of the earth.
The physics of the interactions is, in principle, the same; however, in the range of 10 decades of primary cosmic-ray energy, we can expect some differences. Some approximations valid for energies around 100 GeV may no longer be valid at 100 EeV and vice versa. In particular, this may concern superposition rules and symmetries related to the mass number of primary nuclei. Interest in similar projects has emerged in many countries with the hope of increasing interest for young people in physics and, in particular, the physics of space radiation.
In some cases, this has already been done on a smaller or larger scale to list some of the following: the High School Project on Astrophysics Research with Cosmics (HiSPARC) [6] in the Netherlands; as well as the Washington Area Large-scale Time coincidence Array (WALTA) [7], North American LargeArea Time Coincidence Array (NALTA), Alberta LargeArea Time Coincidence Array (ALTA) [8], Snowmass Area Large-scale Time-coincidence Array (SALTA), CZEch Large-area Time coincidence Array (CZELTA) [9], SKALTA (SlovaKiAn Large-area coincidence Time Array), CHICOS (California HIgh school Cosmic ray ObServatory) [10], CROP (Cosmic Ray Observation Project), CosMO (Cosmic Muon Observer) [11], Net [12] Extreme Energy Events (EEE) [13] or Maze [14,15] and Cosmic-Ray Extremely Distributed Observatory (CREDO [16] and CREDO-Maze [17]). In several centres, work is in progress on the stage of construction of prototypes or on research and development stage.
In several places, prototypes are being built; in others, they are only at the research and development stage. From a very practical point of view, building local arrays does not pose serious problems. The main problem lies in properly preparing people, especially teachers, to actively use the equipment entrusted to them, the detectors and their entire network, and integrate them into the curriculum or extracurricular activities. For the proposed idea to work in practice, it is necessary to create a rich set of educational materials for teachers and students. Pupils must understand that they are investigating real physical phenomena and that what they see is actually the cosmic radiation reaching the Earth from distant space.
For this, they need tools to interpret the signals recorded by their arrays. The simultaneous appearance of a signal in several detectors is not particularly interesting. It only becomes of interest when, from a series of measurements lasting continuously for at least weeks, and preferably months or even years, something starts to emerge that actually enriches our knowledge of the surrounding world. The transition from measurement to conclusions requires the appropriate tools, which we make available to pupils and teachers together with clear and comprehensible documentation and hopefully training, either face-to-face or online.
Small arrays are, by their nature, designed to record small showers. Such small showers raise particular problems of interpretation. Locating the position of the shower axis is, of course, impossible. With a small number of detectors, the localisation even if there were higher particle densities in the detectors (large showers) would be questionable. With four detectors set up at short distances (approx. 10 m), it is also not possible to determine with reasonable accuracy the arrival directions of the showers. In the absence of information on the direction and position of the axis, the analysis of individual showers makes no sense. What we can reasonably determine is, first, the frequency of the observation of the various types of coincidences.
The event time measured will allow us to study how the detection rate changes with time, which can be a basis for various studies conducted by groups of students, such as its variability as a function of atmospheric parameters, day/night variability, sun activity—space weather and dependencies of various “everyday life” quantities on the observed cosmic ray flux. From the fundamental physics point of view, it is crucial to connect many (the more, the better) local arrays into one network allowing the search for the existence of real-time long-distance correlations.
The observation of EAS pairs in distant points of the globe may indicate, through the Gerasimov–Zatsepin effect, the existence of heavy nuclei in the cosmic ray stream at the highest energies. The mass composition of cosmic rays in this area is still completely unknown. The observation of other spatial correlations may indicate the existence of even more exotic cosmological objects, such as the Cosmic Ray Ensembles, which are the main focus of the CREDO Collaboration [16]. Thereby, building small, local, school-based EAS arrays and networking them on a much larger, global scale has many beneficial aspects.
2. Simulations
The fundamental role in the development of cosmic-ray Extensive Air Showers is played by inelastic interactions of primary cosmic-ray protons and heavier nuclei with the nuclei of atmospheric atoms. As a result of these interactions, new high-energy hadrons are created. These are mostly pions of which 1/3 are neutral pions. They decay practically at the point of the creation of two photons. These photons initiate electromagnetic cascades. Electromagnetic particles dominate in the composition of extensive air showers: electrons, positrons, and photons. The development of electromagnetic cascades is determined by the laws of quantum electrodynamics, and we can say that these are known to us. Nevertheless, at the highest shower energies, we have to deal with billions of particles. The three-dimensional tracking of all these particles is a problem.
This problem is mainly related to the calculation time, When it comes to hadrons, we do not have a problem with quantity. In their case, the limitation is the lack of knowledge of the physical processes responsible for multiparticle production. This is described by phenomenological models. Additionally, from the point of view of the development of large showers, the most important is the production of particles in the forward high-rapidity region, and accelerator data on this subject are very poor, which adds an additional uncertainty factor for extrapolations of many orders of magnitude in the (laboratory) primary particle energy.
The description of the electromagnetic component, as well as the modelling of strong interactions in the lowest energy region of cosmic rays, looks much better due to the richness of the experimental data. Computer simulations of small showers do not appear to pose fundamental difficulties. (Let us define as “small showers” those that are caused by particles with energies below “knee” eV). However, other problems arise caused by the large slope of the cosmic-ray energy spectrum. As has been known for years, it is the power-law with an index (differential) of about 3. This spectrum is given to us by nature, and we must take it into account as an a priori factor in the Bayesian approach whenever we want to compare the results of simulation calculations with measurements. Simulations are always performed for a constant energy of the primary particle, while measurements are always only an average taking into account all the a priori factors and, therefore, also the steepness of the energy spectrum.
This effect must always be taken into account, regardless of energy; however, the importance of fluctuations for large energies is relatively easily accounted for. All fluctuations at large statistics tend toward normal (or log-normal) distributions with relative widths that can be easily determined. Appropriate integration with the spectrum a priori gives a shift on the energy scale without significantly changing the nature of the observed relationships. For very small showers in the extreme, we are dealing with cases of observables that are small natural numbers. Their distributions cannot be considered as normal and may additionally have a significant relative width (dispersion).
Due to the aforementioned steepness of the energy spectrum in such cases, when averaging with the spectrum (a priori), we hardly reach the mean values, and sometimes we are far from them. Taking large fluctuations into account in simulation calculations requires simulating a sufficiently large number of cases, and although, in each single case, the simulation of a shower initiated by particles with energies on the order of TeV does not take much time, when such simulations have to be made in the millions, we are confronted with the problem of computational time.
2.1. Corsika Program
The history of modelling strong interactions is long. One could look for its roots in Fermi’s first thermodynamic models from the mid-20th century. The models available “on the market” today have been developed over the years. They were improved with the appearance of new theoretical concepts and were tuned to received continuously new experimental data. These models, in order to lead to results capable of predicting observations of extensive air showers, were implemented in three-dimensional geometric structures and embedded in a cascading mechanism in the Earth’s atmosphere. Programs simulating the development of the extensive air showers are also equipped with the electromagnetic part containing descriptions of many processes, which may involve electrons and photons propagating in matter.
One of the most widely used programs in many experiments and interpretive and theoretical works is the CORSIKA program [18,19], which was created over 30 years ago in Karlsruhe for use essentially in the KASCADE experiment [20,21] in the “knee” region (– eV). This program has been continuously improved and developed throughout. In particular, a great deal of attention has been paid to new functionalities to enable use in applications other than KASCADE. It is even used for simulations in the UHECR area up to eV.
In the CORSIKA program, the user has many options allowing adjustment of the simulations to their own needs. They relate first to the structure of the algorithm, the selection of high- and low-energy interaction models as well as to the parameters of showers that are of interest to the user (Cherenkov or fluorescence light, neutrinos, and emissions in the radio area). There are so many options that a mere short description of them takes almost 200 pages in the latest version of the CORSIKA description [19].
After linking, the program has many options for setting the operating parameters, which is done with the control cards. For typical simulations, a default set is provided embedded in the program itself. However, to use the CORSIKA program for an unusual, non-standard purpose, one should set the values of the control parameters with particular care. We will use the program mainly to simulate small and very small showers. In our case, it is important to precisely determine the size of fluctuations, which we deal with at low and very low energies; therefore, we turn off all thinning options.
Using the control cards, the parameters of the already connected programme can be changed. In the program itself, the set of parameter values corresponding to the typical case of running the program in the energy area of the “knee” region is already set as default. Special care must be taken if we want to use the CORSIKA program in a non-standard configuration for purposes other than typical ones. In this paper, we analyse the results of simulations with CORSIKA program in version 7.7401 with the EPOS LHC strong interaction model (v3400) set up.
Our interest is focused on energies of particles below 10 eV, which energies were available in accelerator experiments almost half a century ago (SPS, Tevatron). Interaction models implemented in CORSIKA were adjusted to the accelerator results at these energies from the very beginning, and they all give very similar results in this region. Significant discrepancies appear only when extrapolating these models to higher and the highest energies. We tested the results obtained with the SIBYLL 2.3d, VENUS, and QGSJET-II-04 models and did not observe any significant discrepancies with the EPOS model results.
2.2. Heavy Nuclei
Methodological limitations of the analysis of data from small local arrays do not allow the use of data processing methods typical of cosmic ray experiments. The interpretation of EAS registration, in any case, is based on computer simulations describing the evolution of EAS and modelling the response of array detectors to them, comparing the registrations with predictions. These predictions take into account such parameters as the mass of the primary particle, its energy, and the direction of arrival with the position of the shower axis (the intersection of the primary particle trajectory with the observation plane).
The importance of these parameters is clear. In addition, the models and parameters of the cosmic ray particle-air interactions also enter implicitly. Some characteristics of air showers strongly depend on the mass of the primary particle and its mass number, not only on its total energy. The hydrogen and helium nuclei dominate the primary cosmic rays flux. There are very few lithium, beryllium, and boron nuclei. Behind them, an important group of nuclei are the carbon, nitrogen and oxygen nuclei, collectively called the CNO group. Next, we have a wide group of intermediate nuclei, mainly Ne, Mg, and Si, and the abundant group of iron (plus nickel and so-called sub-iron nuclei). Heavier nuclei are observed much less. In the area of low energies, the mass composition is known quite well, and we can take it into account in the calculations by averaging the simulation results over the mass of cosmic ray nuclei. Such averaging clearly extends the time needed to precisely simulate the appropriate number of cases.
2.3. Superposition Model
Finding a formula relating to the relationship between the mass of the primary particle and the development of a extensive air shower would facilitate and simplify the calculations and, in particular, would enable almost instant averaging over the mass of the particle. In shower physics, a fairly obvious superposition model is used for this purpose. The atomic nucleus, from the point of view of high-energy processes of multi-particle production, is only a set of nucleons (protons and neutrons that do not differ, at least in the aspect we are interested in). Thus, they can be treated in a first approximation in a simplified manner, and it can be assumed that, for example, an iron nucleus initiated shower is a superposition of 56 single nucleon-initiated showers with 56-times lower energy.
This simple and undoubtedly attractive model allows us to substantiate many claims about iron- and proton-initiated showers that were and are still used primarily to analyse the mass composition of primordial cosmic rays in EAS experiments.
3. Characteristics of the Simulated EAS
From the very definition, there is a relationship between the number of particles in proton and iron showers:
An analogous relationship holds for showers initiated by any nucleus. and denote here the number of electrons (and positrons) and muons at the observation level, which will be hereafter called the electron and muon shower size. This relationship is shown in Figure 1.
It is worth noting that the relation described in Equation (1) is successful not only in the area of relatively high energies (where we deal with power functions) but also in areas where the averaged size of the shower is less than 1. Such showers, developing in the atmosphere, do not reach the level of observation, in our case, at sea level.
Both the electron and muon shower size must fluctuate even with a certain energy and type of primary particle. These fluctuations are an immanent part of the superposition of the physical processes responsible for the development of the extensive air shower and its probabilistic nature. Thus, they are naturally included in a complex simulation programs, like CORSIKA. In Figure 2, we present the dispersion of the electron and muon shower size obtained with the CORSIKA program for showers initiated by protons with energies of 10 eV and iron-initiated showers with a total energy of 10 eV. The lines on each plot correspond to a Gaussian (actually log-normal) distribution fitted to the simulation results shown. These examples show that the log-normal distribution describes the fluctuations in the size of the air showers quite well.
In the case of showers smaller than those shown in Figure 2, when the number of particles in the shower is on the order of a few particles, the log-normal distribution clearly can no longer work well. With such a small number of particles, a significant correlation between the particles should be expected, generated by their common origin from small cascades, developed randomly right above the level of observation.
This is overlapped with Poisson-type fluctuations caused by the probabilistic nature of the phenomenon itself. The discrete nature of the size variable means that we expect a series of events with a size equal to exactly 0 for low energies. Analysis of the simulation results shows that there are more such cases than would result from the purely Poisson nature of the process. The amount of such “empty” showers increases rapidly with the decrease of the energy of the primary particles. This relationship is important because it cuts off the observed flux of primary cosmic ray particles on the low-energy side.
If we assume the symmetry of the superposition model, we have 56 proton showers consisting of one iron EAS independent from each other. Each of them fluctuates as shown in Figure 2. Based on the Fenton–Wilkinson approximation, the widths (logarithmic) of the distributions of the logarithm of the total number of electrons (and muons) for the proton and iron-induced showers should satisfy the relation
Figure 3 shows the CORSIKA proton shower results represented by black symbols compared with iron shower results (empty symbols).
The first thing that is noticeable is that the scaling according to Equation (2) does not work here. The simple superposition model regarding the CORSIKA simulation shows clearly that fluctuations of the total number of electrons in showers initiated by iron nuclei are wider than one could expect (almost about a factor of 2 [22,23]). In the case of the muon component, this difference is also present, and it is significant.
Next, we mention the surprisingly high dispersion values seen for iron nuclei at very low energies ( eV). This is due, as we said, to a significant contribution from cases of showers disappearing before they reach the level of observation and the resulting superimposition of additional Poisson fluctuations.
The simple superposition used in our phenomenological computational model takes into account the necessary modifications related to the cases previously mentioned for showers with a very small number of particles at the observational level. It essentially agrees with Equation (2). The results for iron showers are scaled accordingly to the line for protons for muon size already above the energy of iron nuclei above eV, and for electron size the asymptotic agreement appears further. Interestingly, the scaling according to Equation (2) clearly do not agree with the CORSIKA simulations.
This apparent and clear inconsistency with the simple superposition model requires further discussion; however, before we start modifying this model, let us follow other characteristics of showers and examine how they are described with the simple superposition model.
The transverse distributions of particles in great showers are described by the simple formula proposed many years ago by Greisen [24] and theoretically justified by detailed calculations (but only in the case of purely electromagnetic cascades) by Kamata and Nishimura [25], and thus this function has been called the Nishimura–Kamata–Greisen (NKG) function. We took the same form of the distance dependence for EAS muons:
where is the electron and muon shower size, and is a radial scale parameter. In the case of the electromagnetic cascade, this is called the Molière unit and it is equal to about 2 radiation lengths units above the observation level, ∼79 m on a sea level (for the muon distribution its value was adjusted and parametrized using the CORSIKA results), and s is the age parameter.
The average radial distributions for the electron and muon components of CORSIKA vertival showers are shown in Figure 4 for primary protons and iron nuclei of energies 10 TeV, 100 TeV, and 1 PeV. The lines show our model calculation results. They were obtained from a smooth parametrization of the fits of the NKG curves to the average electron and muon distributions for proton showers over the whole analysed energy range as well as for very small showers. The showers with a size of (on average) about one particle have a particle density (on average) of 10 per m in the central part (the case of 100 GeV proton shower in Figure 1).
The NKG function cannot describe such cases well. Moving on, with central densities of 10 per m, as shown in Figure 1, this corresponds to a proton shower with an energy of 10 GeV and iron-induced shower with a total energy of about 1 TeV, the distribution can be considered almost uniform, and the shower particles can appear almost anywhere up to a distance of several hundred meters from the shower axis.
The lack of a statistically justified average particle distribution in such very small showers does not affect the results of any theoretical predictions to be compared with a real physical experiment. The surface integrals of these distributions, which we ultimately aim at by averaging, will be normalized by the total number of particles in showers, which will be on the order of 0.01, as shown in Figure 1.
The small shower generator radial distributions for iron showers shown in Figure 4 by dashed lines were obtained using the superposition principle. For all analysed superposition models no significant differences in the resulting iron distributions, were observed.
Analysing the application of the superposition symmetry in the case of small showers, it is worth paying attention to the longitudinal development of the showers. The features of interest here are not and cannot be observed by local small shower arrays and, in general, are very difficult for any precise observations and measurements even in the case of very large and complex Cherenkov telescopes. Nevertheless, the comparison of the longitudinal development of showers resulting from the CORSIKA program in the case of proton and iron-induced showers may provide an important guidance for the modification of the simple superposition model and thus lead to the proposition of a more precise fast small showers generator.
The longitudinal profile of the shower provides an excellent opportunity to follow the process of successive nucleon interactions of the initial heavy nucleus and the superposition mechanism. In the case of a proton initiated shower, its size at maximum (the largest number of particles that the developing shower reaches at some point) is determined by the energy of the original particle.
where is the critical energy of electron in air, effective interaction inelasticity coefficient, and is the effective pion multiplicity [26].
The shape of the function describing the number of particles at the level described by the depth in the atmosphere x can be described by different relations [27]. We decided to test the relation called the Gaisser–Hillas function [28] in our small shower generator
If we are dealing with a heavy nucleus with a mass number of A, we have A nucleons, each of which can interact at a different depth in the atmosphere of (). Let us define as A-dimensional probability density of places, in the case of a simple superposition, we have all independent, and then
where is the proton interaction length. It can be seen, clearly, that the averaged longitudinal profile of a shower initiated by a cosmic ray nucleus of mass A is, in this case, equal to the sum of A average profiles of proton showers of correspondingly smaller () energy.
When studying the longitudinal profiles of showers, one usually compares the first two moments in the form of the average depth of the maximum and its dispersion. In the superposition model, the average position of the maximum of the iron shower is exactly in the exact place of the maximum of the shower for the proton shower with the initial energy being 56-times smaller.
This is shown in Figure 5.
Quite surprisingly, for very small energies, CORSIKA showers do not agree with Equation (7) relation. The lowest energy cascades are dominated by interactions in low-energy models, e.g., GHEISHA or URQMD. The results for all interaction models, including the high-energy ones (SIBYLL, EPOS, VENUS, and QGSM) available in the CORSIKA package do not differ significantly from those shown in Figure 5. As well, the simple superposition model and its modifications, which are presented below, give very similar results for the average position of the shower maximum.
Much more interesting is the comparison of the second moments: the dispersion of the position of the shower maximum. The situation is shown in Figure 6.
The dispersion results for the simple superposition model obtained from our small generator for proton showers are shown with a thick solid line (left scale in Figure 6). The agreement with CORSIKA is seen. For iron showers in the superposition model, the situation is quite the opposite. According to this model, the -scaled dispersion (the right scale in Figure 6) for showers initiated by iron nuclei should agree with the results for proton showers, and this is indeed the case. Our generator results for iron showers shown in Figure 6 by the dotted line clearly asymptotically tend towards the agreement with the results for proton showers. However, the problem is that CORSIKA shows a significant inadequacy of the simple superposition model in this case.
For higher moments of the longitudinal distributions simple relations of the type Equation (7) do not hold [29]. The dispersions of obtained from the CORSIKA program for iron showers are three-times larger than expected for simple superposition (at the same energy per nucleon). This is a clear signal that the simple superposition model needs to be modified.
4. Modification of the Simple Superposition Model
The simple superposition model in the case of average sizes and must lead to the relation given by Equation (1) and for by Equation (7) (neglecting the divergence for very low energies shown in Figure 5) regardless of whether the nucleon sub-showers comprising the iron shower are in any way dependent on each other or not. The picture of the hadron cascade development shows that the sub-cascades appearing with depth in the atmosphere must be correlated with each other.
It is known that the cross-section for the interaction of a heavy nucleus with the atmosphere (we can choose nitrogen, oxygen, or argon) is clearly larger than the cross-section for the interaction of a single nucleon (proton). The widely accepted model of Glauber [30,31] describing nuclear collisions is, to some extent, geometric and its further evolution to the “wounded nucleon” model [32] explains this difference in cross-sections in a natural way. One nucleus interaction includes several single nucleon–nucleon interactions simultaneously. The average number of interacting “wounded” nucleons is expressed by the ratio of the active sections:
Following this line, we need to modify Equation (6) to take into account the microscopic mechanism of nuclei interaction. We call such a model of shower development the wounded nucleon superposition model. Let us assume that the number of wounded nucleons in a given nuclear interaction is equal to w. This means that only w nucleons will interact in the same place at the same depth in the atmosphere. This is defined by the cross section of the nucleus as a whole. This fact leads to the multiplication of identical (or almost identical) sub-cascades.
Another assumption should be made about the remaining non-interacting nucleons. Suppose, as a first boundary working hypothesis, that the nucleus is completely fragmented by the first interaction and that all the nucleons of which it is assembled continue to move through the atmosphere as free particles.
By Equation (8) we obtain that the distribution of the values of the depth of the first interaction of a single nucleon (we omit the irrelevant ordering occurring in Equation (9)) is the same as in the simple superposition model described by Equation (6). It follows that the position of the EAS maximum, as determined, first, by the depths of the first interactions, will be the same in the simple superposition model and in the wounded nucleon model assuming the first interaction of the nucleus as common for w its nucleons.
This is seen in Figure 1 and Figure 5 as an exact correspondence between the outputs of the small shower generator for the simple superposition model and the total fragmentation model. The results regarding to the average shower size merge into one curve shown in Figure 1 as a dashed line. In Figure 5, the differences are slightly larger, although still insignificant.
The assumption of a complete fragmentation of the nucleus in its first interaction clearly does not have to be correct. Another extreme case, when non-wounded nucleons remain as one smaller nucleus, this does not change the situation substantially. Replacing the product in Equation (9) by a complex of appropriate exponential factors for successively smaller nuclei remaining after successive interactions leads also to the same distribution of the first interaction positions. The contribution to the development of EAS from successive interactions of fragmented or unfragmented remnants of primary nuclei has no significant effect either on the size of the shower or on the depth of its maximum. However, some effects can be expected for higher momenta of the distributions of some characteristics of the shower parameters.
The number of wounded nucleons in the interaction of specific nuclei at a given energy is clearly not always the same. It has a certain distribution. The expectation value of this distribution is determined by the ratio of interaction cross sections; however, the shape is essentially unknown. As a first approximation, the simplest assumption can be made—that the interactions of nucleons in the nucleus are independent of each other. If so, then, clearly, the actual number of wounded nucleons must have a binomial distribution. We call this solution the superposition model of independent wounded nucleons.
Analysing more deeply the geometrical concept of the interaction of heavy nuclei, on which Glauber’s theory is essentially based, one must conclude that the individual interactions of the nucleons from the beam nucleus with the nucleons from the target nucleus are not and cannot be independent. A more realistic distribution of the number of wounded nucleons can be attempted by appealing to a simple geometric picture.
The assumption that the actual number of wounded nucleons depends on the integrated opacity of the two colliding nuclei with a certain collision parameter is not necessarily correct and accurate. One can nevertheless carry out detailed calculations under this assumption [29,33]. As a result, one obtains that the actual width of the distribution of the number of wounded nucleons is much larger than would be implied by a model of independent interactions with the same mean.
Taking into account this realistic distributions in our small shower generator, we obtain a significant increase in the spread of the small EAS characteristics. This applies both to the total shower sizes (muon and electron) and in particular to the width of the depth distributions of the shower development maximum . We call this version of the superposition model genuine wounded nucleon superposition model.
5. Small Shower Generator
In this paper, we analysed the results of simulations with CORSIKA program in version 7.7401 with the EPOS LHC strong interaction model (v3400) set up. Our interest is focused on energies of particles below 10 eV—energies that were available in accelerator experiments almost half a century ago (SPS, Tevatron). Interaction models implemented in CORSIKA were adjusted to the accelerator results at these energies from the very beginning, and they all gave very similar results in this region. Significant discrepancies appeared only when extrapolating these models to higher and the highest energies. We tested the results obtained with the SIBYLL 2.3d and QGSJET-II-04 models and did not observe any significant discrepancies with the EPOS model.
To obtain the aforementioned phenomenological description of CORSIKA showers, intensive simulation calculations were conducted in the energy range from 10 GeV to 10 PeV, for different zenith angles, and for proton and iron showers. At low energies, it is important to select a low energy interaction model in CORSIKA, and thus two available models were tested: GHEISHA and URQMD without finding significant differences in the results, at least as far as the large shower parameters analysed in this work are concerned. The results for interaction models for the high-energy region (SIBYLL, EPOS, VENUS, and QGSM) were similarly checked, again with no significant differences for low energy and parameters of interest in this paper.
Shower size (electron and muon) and their fluctuations and parameters of the transverse evolution of the shower obtained from simulations with the CORSIKA program have been parametrized as a function of the energy of the primary particle and the angle of arrival of the shower for the primary proton. The superposition model both in the standard version and in the discussed modified versions allows us to describe the properties of showers initiated by an iron nucleus, in fact, by any heavy nucleus of the primary cosmic ray.
These parametrizations were applied practically by creating a program, a fast small shower generator, realizing a random distribution of shower particles at the level of observation, to generate the number of particles (electrons and muons) at any distance from the core of the shower initiated by a cosmic ray particle of any mass of any energy, arriving from any direction in the sky. This allowed us to compare the results obtained from our small shower generator not only with the CORSIKA showers on which it is based but also with experimental results.
By its very nature, the generation by such a program of numbers of particles hitting the detectors of a local small shower array is incomparably faster than obtaining the same data from the CORSIKA-like program and the generation of millions of events is no longer a computational time problem.
It should be noted that our generator is based on CORSIKA simulations for the energy range from 10 eV to 10 eV, with particular attention to the correct implementation for the lowest energy events. The actual validity of the simulated showers it produces is therefore limited by the correctness of the CORSIKA program. At the energies under consideration, this reliability appears to be high.
6. Example Result: Shower Particle Density Spectrum
This credibility is confirmed by comparing the results based on our simulations with real physical measurements of the density spectrum of shower particles. This is one of the primary characteristics of cosmic rays reaching the earth’s surface. These have been measured since at least the middle of the last century. The spectrum has a power spectrum, which is a reflection of the energy spectrum of the primary cosmic radiation. Measurements were made by Cocconi, Loverdo, and Tongiorgi in 1946 for densities from about 10 to 1000 particles per square meter [34,35]
where x is the actual particle density (m) and N is the rate of events of densities higher than x (h). We have also the results of the measurements by Broadbent et al. in 1950: for slightly lower densities [36], and those by Norman in 1956: (for per m) [37]. There was estimation by Greisen in 1960 who gave a similar expression for the density spectrum in the range of per m with the index of [38].
Our fast small shower generator not only reproduces the average shower characteristics determined for a given energy, mass, and inclination angle of the primary particle but also takes into consideration the respective fluctuations. One can use it to perform multidimensional Monte Carlo integration to obtain the shower particle density spectrum. The general formula is clear:
where is the cosmic ray flux energy density for a component with the mass number of the primary cosmic ray nucleus A, is the average number of electrons/muons of the shower coming from the zenith angle , and is the probability density distribution of the actual electron/muon shower size where the expected value is given.
The charged particle density is where the electron/muon density is described by NKG-type formula Equation (3) with the adjusted parameters and s. The upper limit of the primary particle energy spectrum depends on the values of the density that we wish to study. This paper is concerned with small densities and small showers; therefore, if we limit ourselves to densities not exceeding a few hundred per m, the limit of 10 eV is quite sufficient. The 2 km upper limit on r integration is again taken up with a surplus to be safe for the problem we are discussing.
Consideration of the mass spectrum of primary cosmic ray nuclei for practical reasons is usually changed to summing the five already mentioned groups of nuclei with similar masses: protons (), helium (), CNO (), Medium (), and iron group (). The uncertainties introduced by this approximation are not significant when compared to other effects that average and blur the results. The result of the integration in Equation (11) is shown in Figure 7 in comparison with measured results listed above [35,36,37]. As we can see, the agreement is very good.
The presented results on the particle density spectrum allow, in principle, to draw conclusions regarding the energy spectrum of the primary cosmic rays. Averaging over the position of the shower axis (x, y) does not obscure the complex proportionality of the observed particle density at some point to the average energy of the primary particle, thus, giving that very density at the surface. Certainly, the simple proportionality between density and energy E is ultimately inaccurate; however, studying the slope of the density spectrum allows general inferences about the cosmic ray energy spectrum. Following this idea, in 1957, Zawadzki first identified the existence of an abrupt change of the index in the density spectrum [39], which was later confirmed in many EAS experiments and commonly known today as the “knee”.
7. Conclusions
Using the superposition principle based on the similarity symmetry of extensive air showers generated by primary cosmic ray nuclei and single protons, we developed a phenomenological “small shower generator”. This generator can be used as a semi-analytical method to calculate the flux of secondary particles at sea level and to simulate the accurate generation of showers by the CORSIKA program and other Monte-Carlo programs that accurately simulate extensive air showers.
The CORSIKA program simulation results were used to obtain characteristics of the showers at the lowest primary energies (allowed by this program). The mean values of the most important parameters of the shower were found and described. The shapes of their distributions were determined—in particular, the second moments and the small correlations between some of them that occur. The parametrizations were performed separately for the soft component (electrons) and for the hard component (muons). Parametric descriptions of radial distributions of these particles as a function of the energy of the primary particle and the zenith angle were obtained.
Analysing the electron and muon shower sizes as well as the radial and longitudinal shower particle distributions for different atomic masses of the primary nuclei, we examined the simple superposition hypothesis, finding that the extensive air shower produced in the interaction of a nucleus of mass A is a simple compound of A showers initiated by nucleons (protons) of appropriately lower energy. The analysis of the mean values confirmed the presence of this symmetry.
In addition, we found the persistence of this symmetry in the range of the smallest showers, even those that do not contain any particles (electrons or muons). However, investigating the dispersion of the electron and muon shower size, we showed that the assumption that the shower from nucleons folding according to the superposition principle, fold independently of each other, does not correspond to reality, or at least does not correspond to the results of the CORSIKA program.
We investigated the degree of violation of this symmetry and tested possible corrections that could fix this inconsistency. These consisted of taking into account the correlation between some of the constituent sub-showers. According to the wounded nucleon model, a heavy cosmic ray nucleus interacting with an air nucleus initiates the simultaneous generation of a number of nucleon sub-cascades at the interaction point. Their average number is determined by the ratio of the cross sections of the interaction of the whole nucleus and a single nucleon.
We tested the possibility that fluctuations in the number of wounded nucleons do not follow the simple symmetry of the superposition model of independently interacting nucleons but rather indicate a subtle symmetry breaking and a more collective picture of the interaction (wounded nucleon model), thus, changing the binomial distribution into a more geometrical one. The most sensitive parameter describing the shower development for deciding between these possibilities appears to be the position of the maximum of the shower and, more precisely, its dispersion. This indicates that the genuine wounded nucleon superposition model describes this system much better.
Other shower parameters showed little or no significant dependence on such model details as was the case, for example, for the total number of particles in the shower, which followed the symmetry of the superposition model. Our small shower generator is well suited for interpreting measurements made by small school local EAS arrays. It can be used not only to determine the shower registration rates but also to determine the flux of secondary cosmic rays at sea level that are registered by small individual array detectors. A comparison of registrations with the calculation results allowed for testing the detectors themselves and the analysis of local measurements.
Funding
This research received no external funding.
Institutional Review Board Statement
Not applicable.
Informed Consent Statement
Not applicable.
Data Availability Statement
Not applicable.
Conflicts of Interest
The author declares no conflict of interest.
References
- Abb, A.; Abreu, P.; Aglietta, M.; Ahn, E.J.; Al Samarai, I.; Albert, J.N.; Albuquerque, I.F.M.; Allekotte, I.; Allen, J.; Allison, P.; et al. The Pierre Auger Cosmic Ray Observatory. Nucl. Instrum. Methods Phys. Res. Sect. A 2015, 798, 172–213. [Google Scholar] [CrossRef]
- Abu-Zayyad, T.; Aida, R.; Allen, M.; Anderson, R.; Azuma, R.; Barcikowski, E.; Belz, J.W.; Bergman, D.R.; Blake, S.A.; Cady, R.; et al. The surface detector array of the Telescope Array experiment. Nucl. Instrum. Methods Phys. Res. Sect. A 2012, 689, 87–97. [Google Scholar] [CrossRef]
- Hörandel, J.R. GCOS—The Global Cosmic Ray Observatory. In Proceedings of the 37th International Cosmic Ray Conference (ICRC2021), Berlin, Germany, 15–22 July 2021. [Google Scholar]
- Ricci, M. The JEM-EUSO program. J. Phys. Conf. Ser. 2016, 718, 052034. [Google Scholar] [CrossRef] [Green Version]
- Álvarez-Muñiz, J.; Alves Batista, R.; Balagopal, A.; Bolmont, V.J.; Bustamante, M.; Carvalho, W.; Charrier, D.; Cognard, I.; Decoene, V.; Denton, P.B.; et al. The Giant Radio Array for Neutrino Detection (GRAND): Science and design. Sci. China Phys. Mech. Astron. 2020, 63, 219501. [Google Scholar] [CrossRef] [Green Version]
- van Dam, K.; van Eijk, B.; Fokkema, D.B.R.A.; van Holten, J.W.; de Laat, A.P.L.S.; Schultheiss, N.G.; Steijger, J.J.M.; Verkooijen, J.C. The HiSPARC Experiment. arXiv 2019, arXiv:astro-ph.IM/1908.01622. [Google Scholar] [CrossRef] [Green Version]
- Wilkes, R.J.; Berns, H.; Burnett, T.H.; Gran, R. WALTA school-network cosmic ray detectors. IEEE Trans. Nucl. Sci. 2004, 51, 1385–1388. [Google Scholar] [CrossRef] [Green Version]
- Brouwer, W.; Burris, W.; Caron, B.; Hewlett, J.; Holm, L.; Hamilton, A.; McDonald, W.; Pinfold, J.; Price, P.; Schaapman, J.; et al. The ALTA cosmic ray experiment electronics system. Nucl. Instrum. Methods Phys. Res. Sect. A 2005, 539, 595–605. [Google Scholar] [CrossRef]
- Smolek, K.; Nyklíček, M.; Kovačíková, P. Cosmic Rays & Experiment CZELTA. AIP Conf. Proc. 2007, 958, 197–199. [Google Scholar]
- Brobeck, E. Measurement of Ultra-High Energy Cosmic Rays with CHICOS. Ph.D. Thesis, California Institute of Technology, Pasadena, CA, USA, 2009. [Google Scholar]
- Franke, R.; Holler, M.; Kaminsky, B.; Karg, T.; Prokoph, H.; Schönwald, A.; Schwerdt, C.; Stößl, A.; Walter, M. CosMO—A Cosmic Muon Observer Experiment for Students. In Proceedings of the 33rd International Cosmic Ray Conference (ICRC2013), Rio de Janeiro, Brazil, 2–9 July 2013; p. 1084. [Google Scholar]
- Petropoulos, M.; Leisos, A.; Tsirigotis, A. μNet: Towards the first array of educational air shower detectors in Greece. Int. J. Mod. Phys. A 2020, 35, 2044022. [Google Scholar] [CrossRef]
- Rocca, P.L.; Abbrescia, M.; Avanzini, C.; Baldini, L.; Ferroli, R.B.; Batignani, G.; Bencivenni, G.; Bossini, E.; Chiavassa, A.; Cicalò, C.; et al. The EEE Project: A sparse array of telescopes for the measurement of cosmic ray muons. J. Instrum. 2016, 11, C12056. [Google Scholar] [CrossRef] [Green Version]
- Gawin, J.; Kurp, I.; Jȩdrzejczak, K.; Pluciński, P.; Szabelska, B.; Szabelski, J.; Wibig, T. The Roland Maze Project. Acta Phys. Pol. B 2002, 33, 349. [Google Scholar]
- Feder, J.; Jȩdrzejczak, K.; Karczmarczyk, J.; Lewandowski, R.; Swarzyński, J.; Szabelska, B.; Szabelski, J.; Tokarski, P.; Wibig, T. The Roland Maze Project—Cosmic Ray Registration At Schools. Int. J. Mod. Phys. A 2005, 20, 6881–6883. [Google Scholar] [CrossRef]
- Homola, P.; Beznosko, D.; Bhatta, G.; Bibrzycki, Ł.; Borczyńska, M.; Bratek, Ł.; Budnev, N.; Burakowski, D.; Alvarez-Castillo, D.E.; Cheminant, K.A.; et al. Cosmic-Ray Extremely Distributed Observatory. Symmetry 2020, 12, 1835. [Google Scholar] [CrossRef]
- Karbowiak, M.; Wibig, T. Small shower array for education purposes. CREDO-Maze Project. In Proceedings of the 37th International Cosmic Ray Conference (ICRC2021), Berlin, Germany, 15–22 July 2021. [Google Scholar]
- Heck, D.; Knapp, J.; Capdevielle, J.N.; Schatz, G.; Thouw, T. CORSIKA: A Monte Carlo Code to Simulate Extensive Air Showers; KZKA-6019; Forschungszentrum Karlsruhe: Karlsruhe, Germany, 1998. [Google Scholar]
- Heck, D.; Pierog, T. Extensive Air Shower Simulationwith CORSIKA: A User’s Guide (Version 7.7402); Karlsruher Institute fur Technologie: Karlsruhe, Germany, 2020. [Google Scholar]
- Antoni, T.; Apel, W.D.; Badea, F.; Bekk, K.; Bercuci, A.; Blümer, H.; Bozdog, H.; Brancus, I.M.; Büttner, C.; Chilingarian, A.; et al. The cosmic-ray experiment KASCADE. Nucl. Instrum. Methods Phys. Res. Sect. 2003, 513, 490–510. [Google Scholar] [CrossRef]
- Klages, H.O.; Apel, W.D.; Bekk, K.; Bollmann, E.; Bozdog, H.; Brancus, I.M.; Brendle, M.; Chilingarian, A.; Daumiller, K.; Doll, P.; et al. The Extensive Air Shower Experiment Kascade—First Results. In Proceedings of the 25th International Cosmic Ray Conference (ICRC1997), Durban, South Africa, 28 July–8 August 1998; pp. 297–306. [Google Scholar] [CrossRef] [Green Version]
- Dixon, H.E.; Turver, K.E.; Waddington, C.J.; Rochester, G.D. Computer simulations of cosmic-ray air showers II. Showers initiated by heavy primary particles. Proc. R. Soc. Lond. Math. Phys. Sci. 1974, 339, 157–170. [Google Scholar] [CrossRef]
- Gaisser, T.K.; Stanev, T.; Freier, P.; Waddington, C.J. Nucleus-nucleus collisions and interpretation of cosmic-ray cascades above 100 TeV. Phys. Rev. D 1982, 25, 2341–2350. [Google Scholar] [CrossRef]
- Wilson, J.G.; Greisen, K. Progress in Cosmic Ray Physics; North-Holland: Amsterdam, The Netherlands, 1956; Volume 3. [Google Scholar]
- Kamata, K.; Nishimura, J. The Lateral and the Angular Structure Functions of Electron Showers. Prog. Theor. Phys. Suppl. 1958, 6, 93–155. [Google Scholar] [CrossRef] [Green Version]
- Stanev, T. 13th International Conference on Elastic and Diffractive Scattering (Blois Workshop)—Moving Forward into the LHC Era. arXiv 2011, arXiv:hep-ph/1002.3527. [Google Scholar]
- Matthews, J.A.J.; Mesler, R.; Becker, B.R.; Gold, M.S.; Hague, J.D. A parameterization of cosmic ray shower profiles based on shower width. J. Phys. Nucl. Part. Phys. 2010, 37, 025202. [Google Scholar] [CrossRef] [Green Version]
- Gaisser, T.K.; Hillas, A.M. Reliability of the Method of Constant Intensity Cuts for Reconstructing the Average Development of Vertical Showers. Int. Cosm. Ray Conf. 1977, 8, 353. [Google Scholar]
- Engel, J.; Gaisser, T.K.; Lipari, P.; Stanev, T. Nucleus-nucleus collisions and interpretation of cosmic-ray cascades. Phys. Rev. D 1992, 46, 5013–5025. [Google Scholar] [CrossRef] [PubMed]
- Glauber, R.J. Theory of High Energy Hadron-Nucleus Collisions. In High-Energy Physics and Nuclear Structure; Devons, S., Ed.; Springer: Boston, MA, USA, 1970; pp. 207–264. [Google Scholar]
- Glauber, R.; Matthiae, G. High-energy scattering of protons by nuclei. Nucl. Phys. B 1970, 21, 135–157. [Google Scholar] [CrossRef]
- Bialas, A.; Bleszynski, M.; Czyz, W. Multiplicity Distributions in Nucleus-Nucleus Collisions at High-Energies. Nucl. Phys. B 1976, 111, 461–476. [Google Scholar] [CrossRef]
- Wibig, T. Inelasticity and intranuclear cascading in geometrical multichain model. J. Phys. G Nucl. Part. Phys. 1998, 24, 567–577. [Google Scholar] [CrossRef] [Green Version]
- Cocconi, G.; Loverdo, A.; Tongiorgi, V. The Density Spectrum of the Extensive Cosmic-Ray Showers of the Air. Phys. Rev. 1946, 70, 841–846. [Google Scholar] [CrossRef]
- Cocconi, G.; Loverdo, A.; Tongiorgi, V. Experimental and Theoretical Evaluation of the Density Spectrum of Extensive Cosmic-Ray Showers. Phys. Rev. 1946, 70, 846–849. [Google Scholar] [CrossRef]
- Broadbent, D.; Kellermann, E.W.; Hakeem, M.A. The Density Spectrum and Structure of Extensive Cosmic-ray Air Showers at Sea Level. Proc. Phys. Soc. Sect. A 1950, 63, 864–883. [Google Scholar] [CrossRef]
- Norman, R.J. The Energy Spectrum of Extensive Air Showers. Proc. Phys. Soc. Sect. A 1956, 69, 804–820. [Google Scholar] [CrossRef]
- Greisen, K. Cosmic Ray Showers. Annu. Rev. Nucl. Sci. 1960, 10, 63–108. [Google Scholar] [CrossRef]
- Zawadzki, A.; Wibig, T.; Gawin, J. On the extensive air shower density spectrum. Nuovo Cim. 1998, A111, 329–345. [Google Scholar]
Figure 1.
Average electrons (a) and muons (b) shower sizes in a vertical CORSIKA shower shown as a function of energy per nucleon of the primary particles. The graphs simultaneously show the results for proton showers (filled symbols and left axis for the shower size) and scaled-up iron shower size (open symbols and right axis). The solid and dashed lines show the results of our phenomenological calculations for proton and iron showers, respectively.
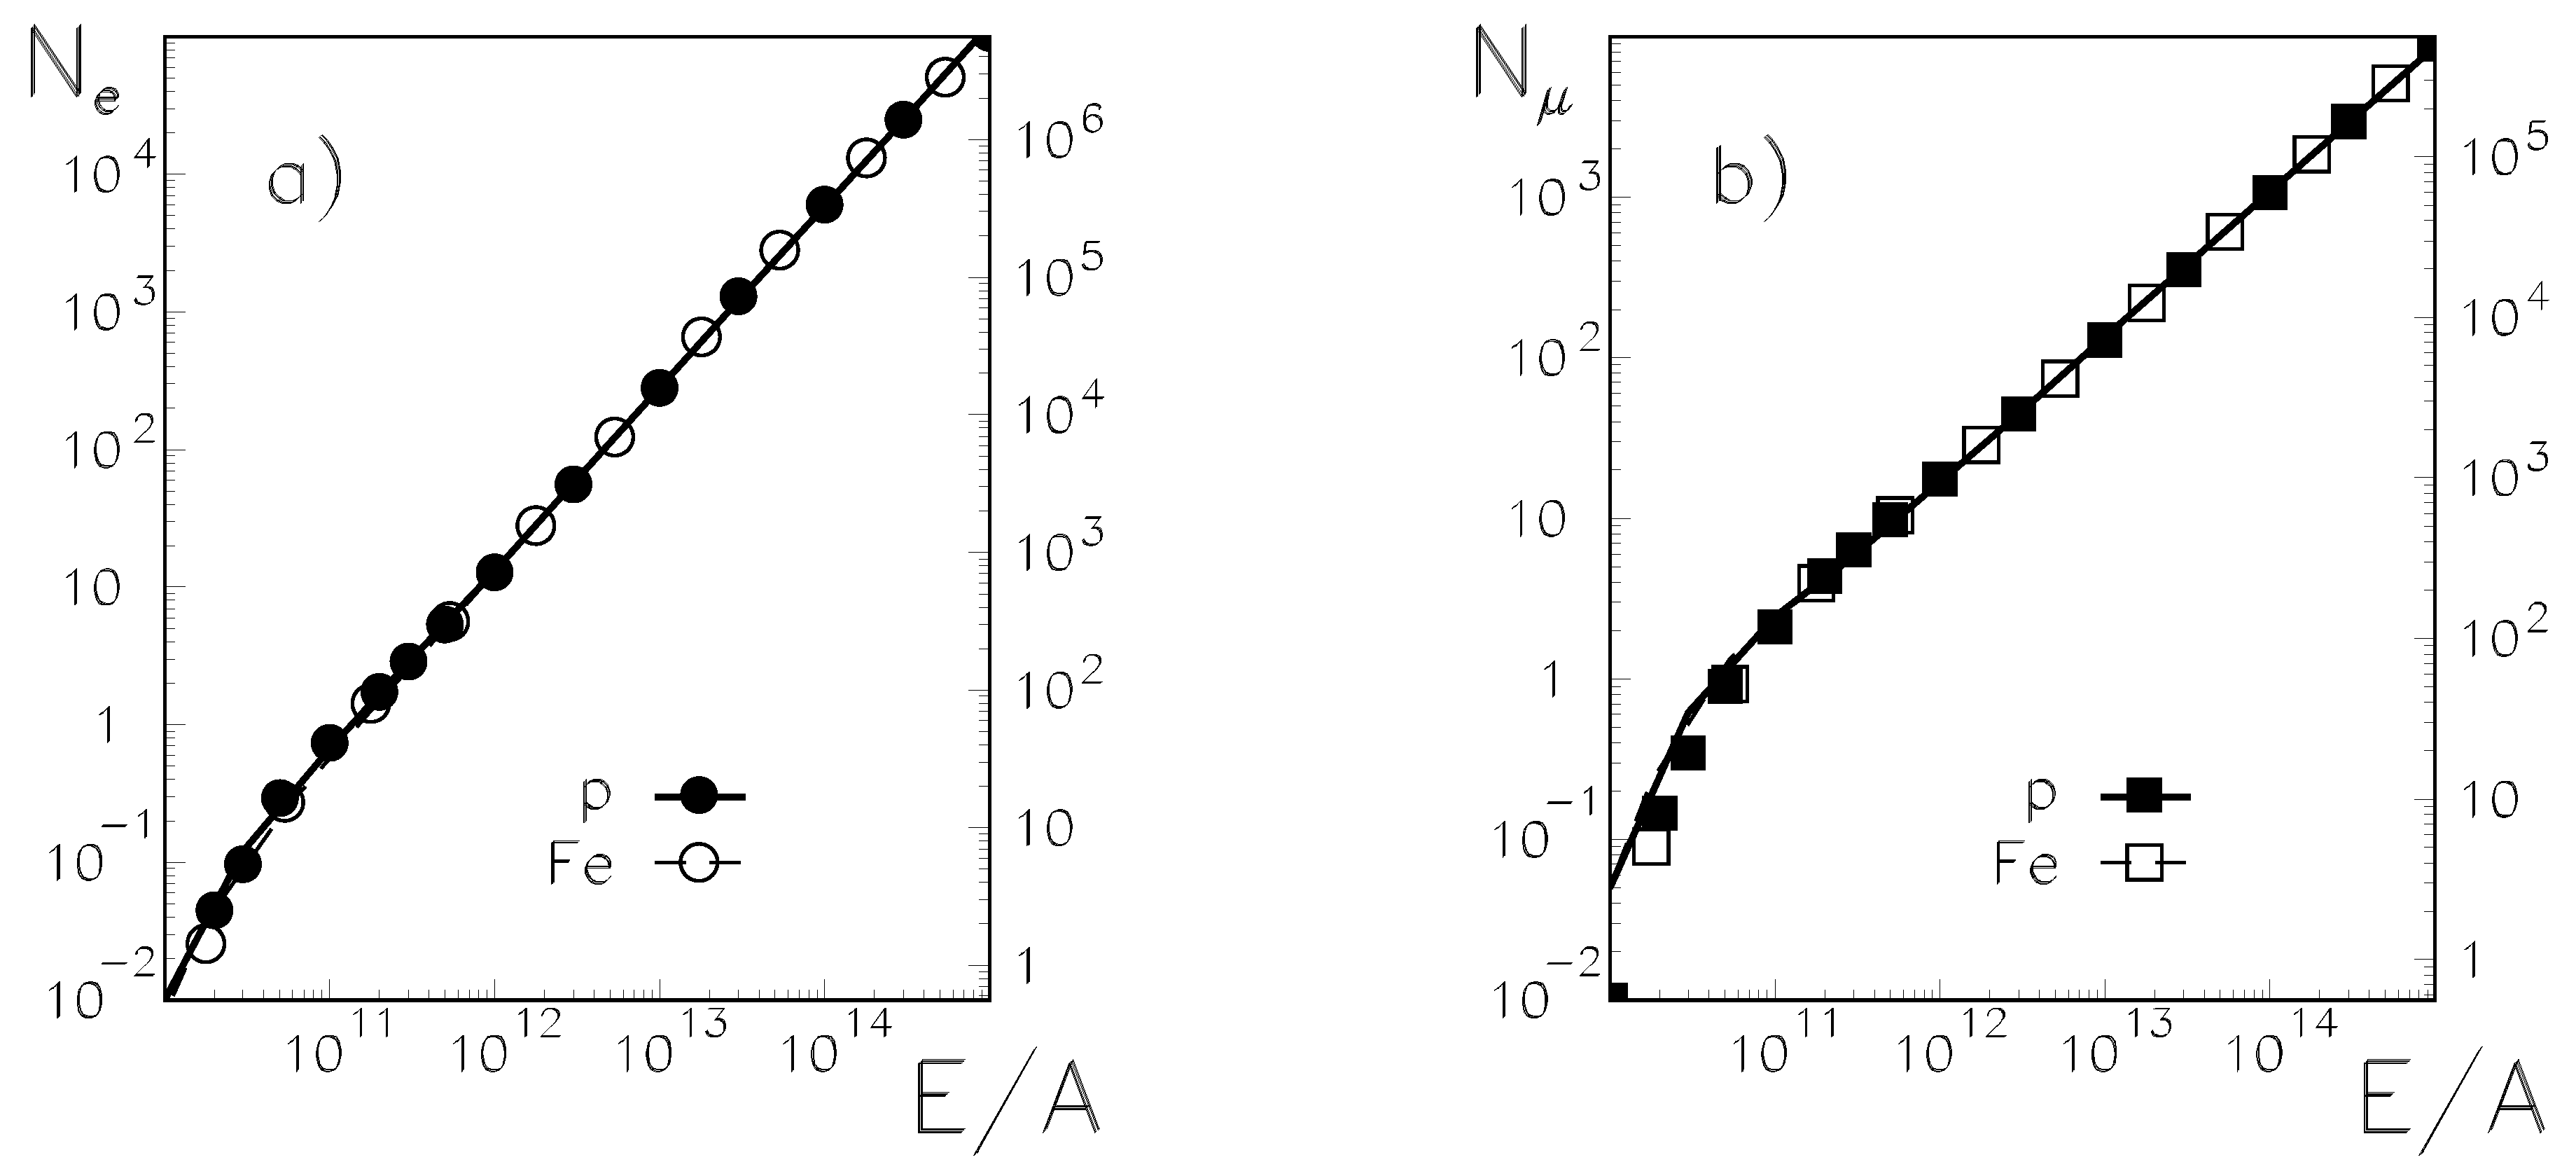
Figure 2.
Examples of fluctuations of electron (a,c) and muon (b,d) size of CORSIKA vertical showers initiated by protons of energy of 10 eV (a,b) and iron of 10 eV (c,d). Lines shows respective fits of the Gaussian (log-normal) distribution.
Figure 2.
Examples of fluctuations of electron (a,c) and muon (b,d) size of CORSIKA vertical showers initiated by protons of energy of 10 eV (a,b) and iron of 10 eV (c,d). Lines shows respective fits of the Gaussian (log-normal) distribution.

Figure 3.
Dispersion of the electron size (a) and muon size (b) of vertical CORSIKA showers shown as a function of the primary energy per nucleon. There are according to the Equation (2) simultaneously shown results for dispersion of proton showers (black dots and left axis) and scaled-up iron showers (open symbols and right axis). Thick solid lines represent results of our small shower generator for proton showers. Thin lines represent iron shower results: the solid lines show the results of our small shower generator with the simple superposition model, dashed for the independent wounded nucleon superposition model, and dotted for the genuine wounded nucleon superposition model.

Figure 4.
The average radial distribution of electrons (circles) and muons (squares) in CORSIKA showers of energy eV (left plot), eV (middle plot), and eV (right plot) initiated by proton (filled symbols) and iron nucleus (open symbols) compared with results of our small shower generator—solid lines for proton induced showers and dashed for iron showers.

Figure 5.
The average depth of the shower maximum obtained with the CORSIKA for primary proton (black circles) and iron (open squares) compared with the results of our small shower generator. The thick solid line is for proton showers, and the thin solid line is this proton line displaced according to Equation (7), which is intended to correspond to an iron shower for a superposition symmetry assumption. Other thin lines are obtained by more sophisticated calculations (with our small shower generator) for different modification of the superposition models: dotted for pure superposition, dashed for the independent wounded nucleon superposition model, and dot-dashed lines for the genuine wounded nucleon superposition model.

Figure 6.
Dispersion of the depth of the shower maximum obtained with the CORSIKA for primary proton (filled circles and left scale) and iron (empty squares and right scale). The scale for the iron was scaled accordingly as described in the text and compared with the results of our small shower generator. The thick solid line is for proton showers, and thin lines are for iron showers: solid for the pure superposition model, dashed lines for the independent wounded nucleon superposition model, and dotted lines represent the genuine wounded nucleon superposition model.


Publisher’s Note: MDPI stays neutral with regard to jurisdictional claims in published maps and institutional affiliations. |
© 2022 by the author. Licensee MDPI, Basel, Switzerland. This article is an open access article distributed under the terms and conditions of the Creative Commons Attribution (CC BY) license (https://creativecommons.org/licenses/by/4.0/).
Share and Cite
MDPI and ACS Style
Wibig, T. Symmetries in the Superposition Model of Extensive Air Shower Development. Symmetry 2022, 14, 559. https://doi.org/10.3390/sym14030559
AMA Style
Wibig T. Symmetries in the Superposition Model of Extensive Air Shower Development. Symmetry. 2022; 14(3):559. https://doi.org/10.3390/sym14030559
Chicago/Turabian StyleWibig, Tadeusz. 2022. "Symmetries in the Superposition Model of Extensive Air Shower Development" Symmetry 14, no. 3: 559. https://doi.org/10.3390/sym14030559
Note that from the first issue of 2016, this journal uses article numbers instead of page numbers. See further details here.