1. Introduction
With the development of the Internet, many companies’ new product development tasks are currently completed in virtual networks [
1]. The product design and manufacturing service in the virtual network is an extension and transformation of the traditional collaborative development model [
2]. With the virtual network as the platform, the research and development requirements are published online on the internet, allowing designers to participate independently. However, for complex product research and development tasks, designers need to constantly interact and collaborate, that is, to form a team to coordinate research and development.
The cloud environment creates conditions for crowdsourcing services for product design, and crowdsourcing designers who serve the collaborative research and development of products are a cooperative partnership [
3]. Regarding designers as nodes and the relationships between designers as edges, a network of designers is formed. It is formed by the designer’s spontaneous cooperation based on their own interests, conditions, etc., with the goal of improving efficiency and expending the overall effectiveness of the task at a higher level [
4,
5,
6].
The designer network has the characteristics of agglomeration and spread of the real network, and the realization of its functions depends on the communication and cooperation of the nodes. The evolution process of the designer network is a development process driven by internal mechanisms, from disorder to order, from low-level to high-level, and to continuously improve its own complexity and the meticulous division of labor [
7]. In the initial stage or in the embryonic stage of the establishment of the designer network, members are combined according to their interests, their position is relatively equal, and communication is sufficient. The collision of different ideas is fertile ground for the buds of innovation. However, the members are based on one side and the cooperation is random. At this time, the organizational characteristics of the designer network are not obvious, showing a state of disorder. As it exchanges material, energy, and information with the environment, the new elements and old elements in the system interact, making the network gradually stable and developing in an orderly direction [
8,
9]. This process can be abstracted as the process of team members connecting with new members according to a simple mechanism, and the process of link growth between original members. New members have preferential connectivity, that is, when new members join, it is easier to choose those important members to cooperate [
10]. There is competition among members: the status of a member in the team does not depend on the time he joins but is related to some of his own essential characteristics. For example, some people are more adept at gathering resources in a short period of time and obtaining a large number of links. With the evolution of the team and the addition of new members, team members are affected by their cooperation preferences to form different small groups, the division of labor of members is further refined, and the complexity of the team is further increased.
In the actual designer network, due to differences in abilities, personalities, etc., members have inconsistent opinions during the continuous running-in process, which may cut off the contact with different view holders; however, some people keep in touch with holders of different opinions for various reasons [
11]. This paper considers the mechanism of opinion change among designers based on complex network theory and the opinion dynamics model. How to understand the changes in human opinions is one of the great challenges facing the research of complex systems [
12]. The importance of this research is reflected in the consideration of many modeling methods, such as Sznajd, Voter, Deffuant, and Krasue-Hefsekmann [
13,
14,
15,
16]. These models explain the reasons for the change in people’s opinions from different angles and reveal the essential characteristics of many opinion dynamic processes. The Deffuant model is based on the continuum opinion and studies macroscopic changes with the microscopic interaction between individuals.
To build a designer network, the interaction between designers is considered first, and this interaction will be affected by different factors such as their ability, personality, hobbies, religious beliefs, and so on. Because some key nodes are different from general nodes, the designer network will have the feature of “the rich get richer”, that is, the phenomenon of hub nodes (nodes with a large number of links) in the BA network. In related research, scholars use the BA network to simulate various complex network changes, but, in the construction rules, only add nodes, do not move nodes, or only change the state of nodes, and have no effect on the network topology [
17,
18]. However, the influence between the network structure and the dynamics of the network is symmetric, and the opinion dynamics of the network also affect the network structure [
19]. Therefore, the BA network cannot describe the real designer network because the changes in nodes and the changes in network topology are mutually influenced. This paper aims to extend the BA network to a complex designer network while considering the interaction of nodes and network topology.
For designer networks, when a collaborative design task forms a team, malicious designers may emerge and fail to complete the task. Therefore, in order to control the risks in the designer’s network, it is necessary to give designers a team to put forward corresponding strategies and suggestions through simulated attack experiments based on network evolution. After the network is attacked, the smaller the changes, the better the robustness [
20].
In the research on network robustness, many scholars have explored the robustness of different network structures, such as regular networks, random networks, small-world networks, and scale-free networks, from the perspective of complex networks. References [
21,
22] considered the evolution of network topology and added a rewiring mechanism, in which nodes have a certain chance to disconnect from holders of different opinions and connect with holders of similar opinions. Prettejohn et al. [
23] discussed the impact of node disconnection on the robustness of the network during the consensus process.
In this paper, a new DBA (Deffuant and BA Adaptive) model was proposed by studying the network growth model and the opinion dynamics model. The DBA model considers three factors: (1) Opinion updates, if the opinion of the network nodes is similar, the opinion can be updated according to the degree of acceptance, (2) Broken edge and reconnection, network nodes may disconnect some links with different opinions and then have a higher probability of linking with nodes with similar opinions. (3) Opinion changes, reasons for the change in opinion include change of mind due to unexpected key events, religious conversion [
13,
24], and change of opinion due to sudden changes in the environment (such as immigration) [
25]. These three factors are integrated into the same model, resulting in a complex dynamic system. As discussed above, this model may be more similar to what is observed in real life.
Our main contributions are summarized as follows:
- (1)
An improved Deffuant model is proposed that takes into account the differences in the acceptance of others’ opinions by different individuals;
- (2)
Combing the evolution of the BA network and improving the Deffuant opinion dynamics model, an adaptive model DBA is proposed;
- (3)
In the simulation experiment, it is verified that the DBA model is more robust and related parameters will affect the average path of the DBA model.
The rest of this article is structured as follows. In
Section 2, the BA model, the Deffuand model, and the evaluation indicators are briefly introduced and the DBA model proposed in this paper is introduced in detail. In
Section 3, the experimental results of this paper are presented. The issues involved are discussed in
Section 4. Finally, a conclusion is drawn in
Section 5.
2. Materials and Methods
2.1. Barabasi–Albert Model
Through their research on the World Wide Web, Barabasi and Albert found that most nodes have relatively low degrees, while a few nodes have high degrees, and they called this network a scale-free network [
26]. It is concluded that the phenomena in the evolution of this type of network are attributed to two characteristics of growth and preferential connection [
27].
(1) Growth: Starting from an initial network with modes, each step adds a new node with connections, where ;
(2) Preferential connection: The probability that a new node is connected to an existing node
satisfies the following conditions:
where
is the degree of node
.
2.2. Deffuant Model
The Deffuant model is a kind of bounded trust model. It uses a real number
to represent the degree of confidence. First, for each node in the network, a number from [0, 1] is randomly selected as each node’s opinion. At time
, node
is randomly selected first, and then its neighbor node
is randomly selected in the neighbor node set of node
, and their opinion values are
and
. If
, the opinions of these two nodes will not be updated:
If
, their opinions
and
at time
will be updated according to the following formula:
Among them,
is the convergence parameter, the value of
is usually fixed at 0.5 [
10,
28].
2.3. Deffuant and Barabasi–Albert Adaptive Model
The connection mechanism of the BA network is a preferential connection but this connection mechanism is relatively simple and does not take into account the differences in opinion between designers, which may cause the connection to be disconnected and reconnected. Nor does it consider that the designer’s opinion will change due to a certain event. When constructing the designer network model, the designer’s opinion should be considered. Secondly, besides reaching a consensus, the designers may change their opinions for other reasons. Factors for a change of opinion include change of mind due to unexpected key events, religious conversion, and change of opinion due to sudden changes in the environment (such as immigration).
In the Deffuant model, at time
, whether the nodes
and
communicate or not is related to the confidence
. In some sense, the individuals of the Deffuant model have no independent opinions and it is easy to change their opinions. When individuals with similar opinions meet, their original opinions are discarded. The Deffuant model does not take into account that different individuals accept the opinions of others differently. In the designer network, some designers have more important significance for their neighbor nodes, while some designer nodes (such as edge designers) have less influence on their neighbor nodes. To measure the influence of an individual on another individual, many scholars use the common neighbor
to measure. It is defined as follows:
Among them, is the set of neighbor nodes of node , and is the number of neighbors of node . For example, in a social network, if two people have more common neighbors, they may know each other in real life, and nodes with more common neighbors will have more influence than nodes with fewer common neighbors.
In the real network, because the relationship between individuals is not symmetrical, that is to say, the degree of acceptance of other people’s opinions is more or less different when individuals communicate with each other. In this paper, the Jaccard [
29] similarity is used to express the degree of trust between two connected individuals, denoted by
.
From Formula (5), it can be seen that the number of common neighbors of nodes and is located in the numerator position. The more their common neighbors, the greater the coefficient of their mutual influence, that is, the greater the degree of acceptance of node to the opinion of node .
Therefore, the interaction rule of the improved Deffuant model is: if
:
Otherwise, update according to Formula (2).
Through the above analysis, this paper proposes a model DBA based on the combination of the improved Deffuant model and the BA model to simulate the generation of the designer network. In the DBA model, when the newly added node
is connected to
nodes, calculate the absolute
of the difference between the opinion values of
and
nodes. If
, then keep the edge. If
, there is a probability of
to disconnect the edges of these two nodes, and node
selects a node to link among the remaining nodes that are not connected to it. Among them, a node with similar opinions has a higher probability of being linked. The calculation formula for the probability that the node chooses to link to an existing node is as follows:
where
is a small positive number (
), to ensure that there will be no divisor 0. Then, one of the neighbor nodes of the new node will be randomly selected, and the opinion values of these two nodes will be updated according to the improved opinion update Formula (6). In addition, there is
probability that makes the opinion change, and
belongs to [0, 1].
The probability of the node being selected is then mapped to [0, 1] according to Formula (8).
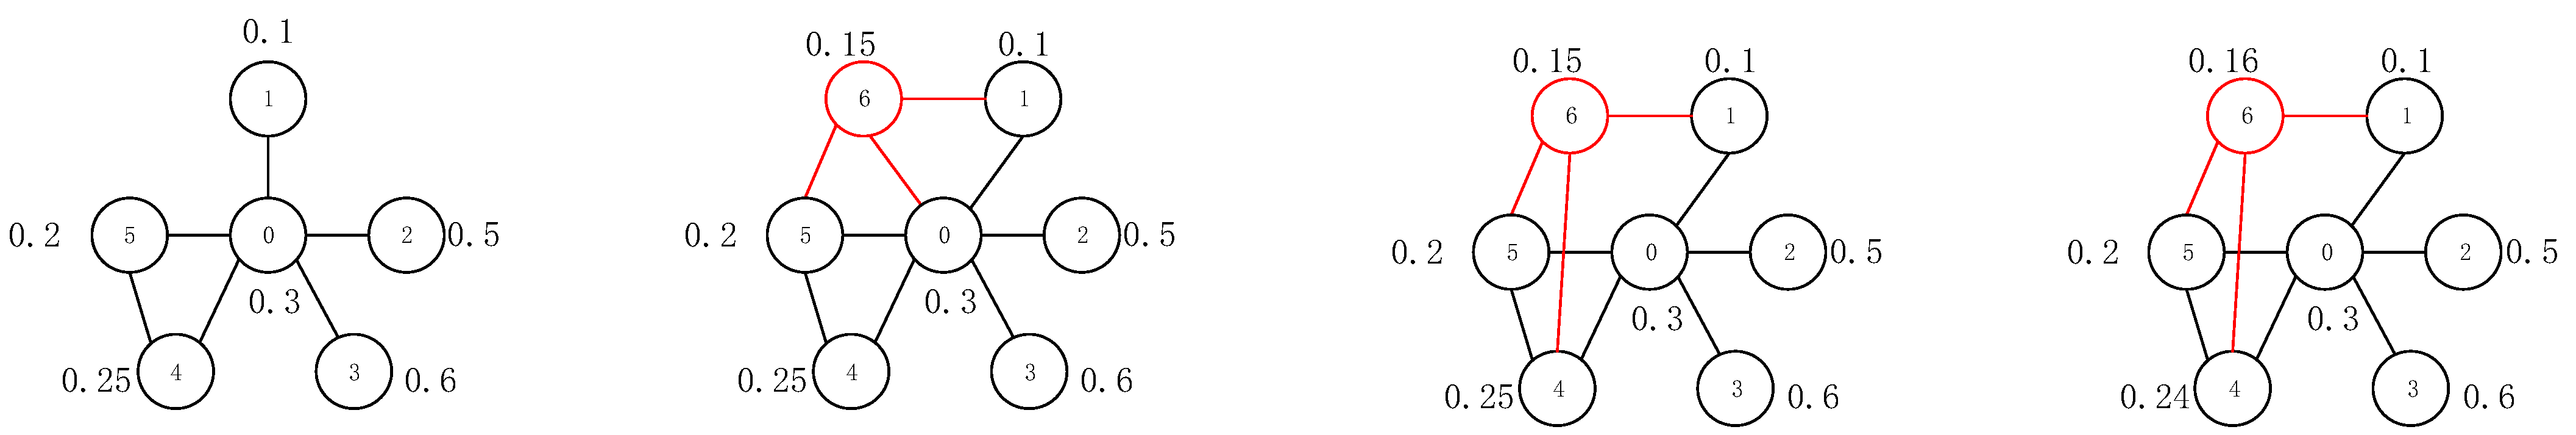
A simple example is shown in
Figure 1 to illustrate the construction principle of the DBA model. In the initial structure of the network, each node has an opinion value. When a new node 6 is added, it connects nodes 0, 1, and 5, and then calculates the difference between the opinion values of node 6 and these three nodes. It is found that the opinion value difference with node 0 is greater than
, there is a probability of
to disconnect the edge. Then, the connection probability in the remaining nodes is calculated, where
, and the normalized selection probability is:
. Node 6 selects node 4 as the new connection, and then randomly selects the neighbor node 4 of node 6 to update the viewpoint values of the two nodes. When a new node comes, the above steps are repeated, paying attention to the probability of
that causes the node’s opinion value to change suddenly. The algorithm pseudocode is shown in Algorithm 1. The flowchart of the DBA algorithm is shown in
Figure 2.
Assuming that the final number of nodes of the DBA network is , the network growth is M, the average degree in each iteration is , and is the current iteration number. The time complexity of initialization is . The time complexity of connecting to nodes in each iteration is , and the time complexity of computing is . The time complexity of broken edge reconnection is , and the time complexity of opinion update and opinion mutation is . In summary, the time complexity of the DBA algorithm in this paper is about .
2.4. Robustness Evaluation Criteria
The robustness of the network means that after the nodes in the network fail, the network itself still maintains its normal working ability. The indicators to measure the robustness of the network are the network efficiency and the maximum connected subgraph coefficient. The current research on network robustness focuses on the research on deliberate attacks faced by the network. Deliberate attacks refer to removing nodes in the network according to a certain strategy [
30]. In this paper, the maximum connected subgraph coefficient and the network efficiency coefficient are used as indicators to evaluate the robustness of the designer’s network.
| Algorithm 1: DBA Algorithm |
| Input: The number of network nodes N, the number of network growth M, the confidence d, the probability of broken edge and reconnection p, and the probability of opinion changes w. |
| Output: Network G |
| 1. Construct a network with an initial node number of M, set i = M, and randomly assign the value of [0, 1] to these M nodes. |
| 2. While
|
| 3. According to Formula (1), M nodes are selected to be connected to the newly added node i, and an opinion value is assigned to the node. |
| 4. Among the M edges, calculate the absolute value of difference between the opinion values of node i and M nodes. |
| 5. if
|
| 6. The edge is removed with p probability, the selection probability of this node and other nodes is calculated according to Formula (8), select a node to link among the remaining unconnected nodes, among which nodes with similar opinions have a higher probability of being linked. |
| 7. else: |
| 8. the edge is kept |
| 9. A neighboring node j of the node i is randomly selected. If , the opinion value is updated according to Formula (6), otherwise, the opinion value is updated according to Formula (2). |
| 10. The node has the probability of w to change its opinion value. |
| 11.
|
| 12. Return G |
2.4.1. Maximum Connected Subgraph Coefficient
Suppose that after the network G is attacked, the node
is disconnected from some or all nodes in the network, the network G is divided into several independent sub-connected networks
. Assuming that
is the total number of nodes contained in the sub-connected network
, it represents the size of the sub-connected network, and
is defined as the size of the largest sub-connected network after the network is attacked. Therefore, the coefficient of the maximum connected subgraph of the designer’s network can be defined as the ratio of the maximum connected subgraph containing the designer to the initial network size after being attacked. The formula for calculating the coefficient of the largest connected subgraph
is as follows:
represents the number of nodes in the maximum connected subgraph in the network after removing some nodes.
2.4.2. Network Efficiency
The network efficiency can well reflect the performance of the system. The calculation formula of network efficiency
is as follows:
where
is the shortest path length between node
and
. In order to make the effect more intuitive, this paper shows the decline rate of network efficiency. The network efficiency drop rate (
) is calculated according to Formula (10):
Among them, represents the network efficiency after the network is attacked, and represents the original network efficiency.
3. Experimental Results
This paper conducts simulation experiments in the environment of Python 3.7. The model assumes that designers publish related issues through a “crowdsourcing” virtual community network, attracting designers with common interests and needs in the network to join the team and carry out product design exchanges and discussions. In the DBA model of this article, the final number of nodes is set to N, and the network growth to M. Each time a node is added, the node will be connected to M nodes, and an opinion value between [0, 1] will be randomly assigned to the node. They co-evolve according to the rules described in the DBA model. In the growth of the network, adding one node at a time and then interacting once, and the probability of the existence of w makes the opinion of the node change until the number of network nodes is equal to N. Finally, the adjacency matrix of the network is symmetric.
In order to better measure the robustness of the network, attack strategies from different angles are used to deliberately attack the DBA and BA networks, such as Betweenness Centrality [
31,
32] of global information; LLS [
33], Degree Centrality [
34], H-index [
35,
36], K-index [
37] are based on local information; and PageRank [
38] based on a random walk.
The following paper will introduce the changes in the maximum connected subgraph coefficient and the network efficiency drop rate under six different attack strategies. The curves in the figure represent models with different parameters, where each subgraph contains a BA and DBA network with the same and , but in the DBA network, the same and w are set, and the effect of different on the maximum connectivity coefficient and the network efficiency is observed. If the network has higher connectivity and network efficiency than the same type of network under attack from different angles, it means that the network is more robust. All results are averaged 20 times.
Figure 3 and
Figure 4 are the network robustness diagrams of the LLS algorithm in the case of node removal under different confidence d. It can be seen from the figures that the robustness of the DBA model is better than that of the BA model, and the network is more robust to attacks when
.
Figure 5 and
Figure 6 are the network robustness diagrams of the Degree algorithm in the case of node removal under different confidence d. It can be seen from the figures that the robustness of the DBA model is better than that of the BA model, and the network is more robust to attacks when
.
Figure 7 and
Figure 8 are the network robustness diagrams of the Betweenness Centrality algorithm in the case of node removal under different confidence d. It can be seen from the figures that the robustness of the DBA model is better than that of the BA model, and the network is more robust to attacks when
.
Figure 9 and
Figure 10 are the network robustness diagrams of the H-index algorithm in the case of node removal under different confidence d. It can be seen from tthe figures that the robustness of the DBA model is better than that of the BA model, and the network is more robust to attacks when
.
Figure 11 and
Figure 12 are the network robustness diagrams of the K-index algorithm in the case of node removal under different confidence d. It can be seen from the figures that the robustness of the DBA model is better than that of the BA model, and the network is more robust to attacks when
.
Figure 13 and
Figure 14 are the network robustness diagrams of the PageRank algorithm in the case of node removal under different confidence d. It can be seen from the figures that the robustness of the DBA model is better than that of the BA model, and the network is more robust to attacks when
.
Since the evolution mechanism and parameters of various complex network models are different, this paper compares the robustness of the original evolution model and the network structure with different parameters under the same evolution mechanism. In
Figure 3,
Figure 4,
Figure 5,
Figure 6,
Figure 7,
Figure 8,
Figure 9,
Figure 10,
Figure 11,
Figure 12,
Figure 13 and
Figure 14, it is found that the smaller the d, the better the robustness of the network when it is attacked, whether it is an attack method based on global information or an attack method based on local information. Compared with the DBA network with different parameters, when the BA network is deliberately attacked, after removing the same proportion of nodes, the robustness of the BA network is the worst, and its
value is the smallest compared to the other DBA networks with different parameters. The BA network has the worst robustness and its network efficiency drops the fastest, while the DBA network has a slower network efficiency drop rate than BA. The smaller the
value, the better the network efficiency. It can be seen from these 12 figures that the network evolution model of this paper is better than the BA model under the same evolution mechanism in both indicators, and this phenomenon is also reflected in the various attack strategies of this paper.
The average shortest path length
is one of the characteristics of networks, which refers to the average number of steps required from one member to another in the network. The average path length focuses on the topological characteristics of the overall network. Assuming a simple designer network, shown in
Figure 15, when node 6 joins and connects to node 1, if the absolute value of the difference between the opinion values of node 6 and node 1 is greater than the confidence d, there is a
probability of disconnection the edge with node 1. Calculate the selection probability from the nodes that are not connected to it according to Formula (8). The greater the probability, the greater the chance of being selected. Assuming that node 5 is selected by node 6, then the network structure changes from the left side of
Figure 15 to the right side of
Figure 15 at this time. From this, it can be seen that, except for node 5, the shortest path between node 6 and other nodes becomes longer, and the overall average shortest path of the network rises from 1.6667 to 1.8667. The existence of the opinion changes
will affect the opinion of the node, which in turn affects the consensus formation of opinions and the reconnection of the broken edge.
It can be known that when the basic parameters
are unchanged, changing the remaining parameters will change the network topology. The smaller the confidence
, the more opportunities for reconnection after the broken edge, and the more network topology changes. This paper compares the average shortest path length of different network sizes and different parameters and the data results are shown in
Table 1. The meanings of the relevant parameters in
Table 1 are: The number of network nodes
, the number of network growth
, the confidence
, the probability of broken edge and reconnection
, and the probability of opinion changes
. It can be found that in the case of the same
and
, the average shortest path of the BA network is the smallest. When
,
,
, and
are unchanged, changing
, it can be found that as
increases, the average shortest path of the DBA network shows a downward trend. When
changes and other parameters remain unchanged, as
increases, the average shortest path of the DBA network also shows a downward trend. When the probability
of a sudden change in opinion, and the remaining parameters remain unchanged, the average shortest path of the DBA network changes, indicating that a change in opinion will cause changes in the network topology, the greater
, the longer the average shortest path. Due to broken edges and reconnections and opinion changes, the connections between nodes with large degrees will be reduced, which means that the number of connections through these nodes will be reduced. Therefore, due to the lack of intermediaries for nodes with large degrees, the connection paths between nodes will become longer.
Node failure will have an important impact on the robustness of the network structure. The average shortest path is one of the metrics to measure the robustness of the network. There are two variables and in the model. The difference between these two variables will result in different networks. This paper simulates and analyzes the following two situations: (a) To examine the influence of network size on the average shortest path; (b) To examine the influence of network growth on the average shortest path. The parameters of the DBA model are (.1).
As shown in
Figure 16, under the same scale, the more the number of edges connected to the new node, the shorter the average shortest path, and the decrease causes the average shortest path to become smaller, which means that when the number of connected edges is sufficient, the average shortest path will reach a minimum value. Under the same number of edges, the larger the network size, the larger the average shortest path.
4. Discussion
There are uncertainties in the evolution of the designer network. Factors such as the interruption of the relationship between internal designers and the interference of external platforms will destroy the structure of the designer network and affect the performance of the network. Under the influence of these uncertain factors, robustness becomes an important factor for the continuous and stable operation of the designer’s network.
In many scholars’ research on the robustness of network models, the networks constructed are mostly random networks and pure BA networks. For example, the connection mechanism of the BA network is a preferential connection but this connection mechanism is relatively simple. It does not take into account the differences in the views of designers, which may lead to disconnection and reconnection; nor does it take into account that the views of designers will change due to an event. The attack strategy and network structure robustness of the designer network are not studied deeply enough.
This paper summarizes and compares some work on improving the BA model, see
Table 2 for details.
Opinion dynamics is one of the phenomena of cluster dynamics in human society. Convergence and differentiation among interacting individuals are very important social processes [
43]. The diversity of individuals and their interactions are reflected in the diversity of individual types and the heterogeneity of interaction strengths in social networks. Individuals and their interactions in designer networks reflect the non-trivial nature of individual behavioral dynamics in social systems [
44]. This plays an important role in the dynamic behavior of the network. The interaction between individuals and the dynamics of opinion are coupled with each other, which is the co-evolution of many scholars’ research. The interaction between individuals in co-evolution will be reflected in the reconnection of broken edges between individuals with the time evolution of individual viewpoints.
This paper integrates opinion update, broken edge reconnection, and opinion mutation factors into the BA model, and constructs a designer network model. By adjusting the parameters in the model and changing the evolution mechanism of the model, a designer network that is closer to reality is constructed, and on this basis, the attack strategy and robustness are studied, which has important theoretical significance for the rational formation of the designer network and improving its invulnerability.
In the face of deliberate attacks, the DBA model has better robustness, and the DBA model with different structural parameters is better than the BA model. The DBA model shows the ability to maintain connections. In other words, the DBA model has better robustness against attacks. A reasonable explanation is that the introduction of broken edges and reconnections and opinion changes lead to changes in the network topology. In terms of deliberate attacks, the broken edge reconnection in the DBA model shows its advantages. A small proportion of nodes in the network with a large number of nodes play a vital role in maintaining network connections because to some extent, reconnection of broken edges increases the chance of connecting with other nodes. This means that after the network is attacked, it is more likely that nodes will find an existing path after the attack due to the reconnection of the broken edge.
5. Conclusions
In order to characterize the evolution of the designer’s network, the co-evolution phenomenon between the evolution of the designer’s viewpoint and the dynamic process of the network topology’s change is included. This article combines the evolution of the BA network and the Deffuant opinion dynamics model. Aiming at the co-evolution between the network topology and the structural opinion dynamics process, a DBA model is proposed, and the three factors of opinion update, broken edge and reconnection, and opinion changes are integrated into this model. In addition, when updating opinions, this paper also considers that different individuals accept the opinions of others differently, and then improves the Deffuant model.
Based on the two robustness indexes in complex network theory, the attack strategy of this model is studied. Through simulation analysis of LLS attack, degree attack, BC attack, H-index attack, and PageRank attack based on node removal, the robustness of the designer network is studied from two measures of maximum connected subgraph system and network efficiency. The experimental results show that under six different attack strategies, the DBA model is more robust than the BA model, it is still better to measure the small-world characteristics of the DBA model by the average path length. In addition, the changes in the , , and parameters will affect the average shortest path of the DBA model, because these three parameters will lead to changes in the network structure. The increase in and will cause the average shortest path of the network to decrease.
In addition, the change of the d, p, and w parameters will affect the average shortest path of the DBA model because these three parameters will cause a change in the network edges.
The designer evolution model proposed in this paper simulates network evolution. Although the model considers three factors: opinion update, edge reconnection, and opinion mutation, the evolution process ignores the problem that the designer will exit the network. In addition, individuals often have to consider multiple interests before making final decisions. The study of such issues requires the use of game theory, which is also the next step to focus on.


