Article

Variable Selection of Heterogeneous Spatial Autoregressive Models via Double-Penalized Likelihood

1
School of Mathematics, Hangzhou Normal University, Hangzhou 311121, China
2
College of Economics, Hangzhou Dianzi University, Hangzhou 310018, China
*
Author to whom correspondence should be addressed.
Symmetry 2022, 14(6), 1200; https://doi.org/10.3390/sym14061200
Submission received: 10 May 2022 / Revised: 4 June 2022 / Accepted: 7 June 2022 / Published: 10 June 2022
(This article belongs to the Section Mathematics)

Abstract

:
Heteroscedasticity is often encountered in spatial-data analysis, so a new class of heterogeneous spatial autoregressive models is introduced in this paper, where the variance parameters are allowed to depend on some explanatory variables. Here, we are interested in the problem of parameter estimation and the variable selection for both the mean and variance models. Then, a unified procedure via double-penalized quasi-maximum likelihood is proposed, to simultaneously select important variables. Under certain regular conditions, the consistency and oracle property of the resulting estimators are established. Finally, both simulation studies and a real data analysis of the Boston housing data are carried to illustrate the developed methodology.

1. Introduction

In the field of modern economics and statistics, the spatial autoregressive (SAR) model has always been a hot topic for economists and statisticians. Theories and methods for estimation as well as other inferences based on linear SAR models and their extensions have been deeply studied. Among them, there is a lot of wonderful literature based on linear SAR models, such as Cliff and Ord [1], Anselin [2], and Anselin and Bera [3]. Other research results for linear SAR models can also be referred to: Xu and Lee [4], Liu et al. [5], Xie et al. [6], Xie et al. [7], and so on. In order to capture the nonlinear relationship between response variables and some explanatory variables, a variety of semiparametric SAR models have recently been proposed and studied in depth. For example, based on a partially linear spatial autoregressive model, Su and Jin [8] developed a profile quasi-maximum likelihood-estimation method and discussed the asymptotic properties of the obtained estimators. Du et al. [9] developed partially linear additive spatial autoregressive models and proposed an estimation method via combining the spline approximations with an instrumental-variables-estimation method. Cheng and Chen [10] discussed partially linear single-index spatial autoregressive model as well as obtained the consistency and asymptotic normality of the proposed estimators, under some mild conditions. Other research results of semiparametric SAR models can also be seen in Wei et al. [11], Hu et al. [12], and so on. Previous research on various SAR models focused mainly on the homoskedasticity assumption, that the variance of the unobservable error, conditional on the explanatory variables, is constant. It is well-known that if the innovations are heteroskedastic, most existing statistical inference methods under homoskedasticity assumption could lead to incorrect inference, see Lin and Lee [13]. Therefore, many researchers want to relax the homoskedasticity assumption for spatial autoregressive models, by allowing different variances for each unobservable error. For example, Dai et al. [14] developed a Bayesian local-influence analysis for heterogeneous spatial autoregressive models. However, the variance terms in these above-mentioned heterogeneous spatial autoregressive models are assumed fixed and do not depend on the regression variables. Furthermore, in many application fields, such as economics and quality management, it is a topic of interest to model the variance itself, which is helpful to identify the factors that affect the variability in the observations. Thus, we intend to propose a class of heterogeneous spatial autoregressive models where the variance parameters are modelled in terms of covariates.
In addition, many authors have done a lot of research on joint mean and variance models. For example, Wu and Li [15] proposed a variable-selection procedure via a penalized maximum likelihood for the joint mean and dispersion models of the inverse Gaussian distribution. Xu and Zhang [16] discussed a Bayesian estimation for semiparametric joint mean and variance models, based on B-spline approximations of nonparametric components. Zhao et al. [17] studied variable selection for beta-regression models with varying dispersion, where both the mean and the dispersion are modeled by explanatory variables. Li et al. [18] proposed an efficient unified variable selection of the joint location, scale, and skewness models, based on a penalized likelihood method. Zhang et al. [19] developed a Bayesian quantile-regression analysis for semiparametric mixed-effects double-regression models, on the basis of the asymmetric Laplace distribution for the errors.
As we all know, variable selection is the most important problem to be considered in regression analysis. In practice, a large number of variables should be used in the initial analysis, but many of them may not be important and should be excluded from the final model, in order to improve the accuracy of the prediction. When the number of predictive variables is large, traditional variable selection methods such as stepwise regression and best-subset selection are not computationally feasible. Therefore, various shrinkage methods have been proposed in recent years and have gained much attention, such as the LASSO (Tibshirani [20]), the adaptive LASSO (Zou [21]), and the SCAD (Fan and Li [22]). Based on these shrinkage methods, the variable selection for SAR models (see Liu et al. [5]; Xie et al. [6]; Xie et al. [7]; Luo and Wu [23]) and the variable selection for other models without spatial dependence (see, for example, Li and Liang [24]; Zhao and Xue [25]; Tian et al. [26]) have been studied extensively in recent years. To the best of our knowledge, most existing variable-selection methods in spatial-data analysis are limited, to only select the mean explanatory variables in the literature, and little work has been done to select the variance explanatory variables.
Therefore, in this paper we aim to make variable selection of heterogeneous spatial autoregressive models (heterogeneous SAR models), based on penalized quasi-maximum likelihood, using different penalty functions. The proposed variable-selection method simultaneously selects important explanatory variables in a mean model and a variance model. Furthermore, it can be proven that this variable selection procedure is consistent, and the obtained estimators of regression coefficients have oracle property under certain regular conditions. This indicates that the penalized estimators work as well as if the subset of true zero coefficients were already known. A simulation and a real data analysis of a Boston housing price are used to illustrate the proposed variable selection method.
The outline of the paper is organized as follows. Section 2 introduces new heterogeneous spatial autoregressive models. Then, we propose a unified variable-selection procedure for the joint models via the double-penalized quasi-maximum likelihood method. Section 3 gives the theoretical results of the resulting estimators. The computation of the penalized quasi-maximum likelihood estimator as well as the choice of the tuning parameters are presented in Section 4. The finite-sample performance of the method is investigated, based on some simulation studies, in Section 5. Section 6 gives a real data analysis of a Boston housing price to illustrate the proposed method. Some conclusions as well as a brief discussion are given in Section 7. Some assumptions and the technical proofs of all the asymptotic results are provided in Appendix A.

2. Variable Selection via Penalized Quasi-Maximum Likelihood

2.1. Heterogeneous SAR Models

The classical spatial autoregressive models have the following form:
Y = ρ W Y + X β + ε ,
where Y = ( y 1 , y 2 , , y n ) T is an n-dimensional observation vector on the dependent variable; | ρ | < 1 is an unknown spatial parameter; and W is a specified spatial weight matrix of known constants with zero diagonal elements. Let X = ( x 1 , x 2 , , x n ) T is an n × p matrix whose ith row x i T = ( x i 1 , , x i p ) is the observation of the explanatory variables and β = ( β 1 , , β p ) T be a p × 1 vector of unknown regression parameters in the mean model; ε is an n-dimensional vector of independent identically distributed disturbances with zero mean and finite variance σ 2 .
Furthermore, similar to Xu and Zhang [16], we consider variance heterogeneity in the models and assume an explicit variance modeling related to other explanatory variables, that is:
σ i 2 = h ( z i T γ ) ,
where z i T = ( z i 1 , , z i q ) is the observation of explanatory variables associated with the variance of y i and γ = ( γ 1 , , γ q ) T is a q × 1 vector of regression parameters in the variance model. There might be some components of z i which coincide with some x i ’s. In addition, h ( · ) is a known function, for the identifiability of the models, so we always assume that h ( · ) is a monotone function and h ( · ) > 0 , which takes into account the positiveness of the variance. For example, the researcher can take h ( x ) = exp ( x ) in general. So, this paper considers the following heterogeneous SAR models:
Y = ρ W Y + X β + ε , Σ = diag ( σ 1 2 , σ 2 2 , , σ n 2 ) σ i 2 = exp ( z i T γ ) , i = 1 , 2 , , n .
According to the idea of the quasi-maximum likelihood estimators (Lee [27]), the log-likelihood function of the model (3) is
n ( ρ , β , γ | Y , X , Z ) = n 2 l n ( 2 π ) 1 2 i = 1 n z i T γ + l n | S | 1 2 e T Σ 1 e ,
where e = S Y X β , S = I n ρ W , and  I n is an ( n × n ) identity matrix.

2.2. Penalized Quasi-Maximum Likelihood

In order to obtain the desired sparsity in the resulting estimators, we propose the penalized quasi-maximum likelihood
L ( ρ , β , γ ) = n ( ρ , β , γ ) n j = 1 p p λ j ( 1 ) ( | β j | ) n k = 1 q p λ k ( 2 ) ( | γ k | ) .
For notational simplicity, we rewrite (5) in the following
L ( θ ) = n ( θ ) n j = 2 s p λ n ( | θ j | ) ,
where θ = ( θ 1 , , θ s ) T = ( ρ , β 1 , , β p ; γ 1 , , γ q ) T with s = p + q + 1 , and p λ n ( · ) is a given-penalty function with the tuning parameters λ n . The data-driven criteria, such as cross validation (CV), generalized cross-validation (GCV), or the BIC-type tuning-parameter selector (see Wang et al. [28]), can be used to choose the tuning parameters, which is described in Section 4. Here we use the same penalty function p ( · ) for all the regression coefficients but with different tuning parameters λ n , for the mean parameters and the variance parameters, respectively. Note that the penalty functions and tuning parameters are not necessarily the same for all the parameters. For example, we wish to keep some important variables in the final model and, therefore, do not want to penalize their coefficients. In this paper, we mainly use the smoothly clipped absolute deviation (SCAD) penalty, with a first derivative that satisfies
p λ ( t ) = λ I ( t λ ) + ( a λ t ) + ( a 1 ) λ I ( t > λ )
in which a = 3.7 is taken in our work. The details about SCAD can be seen in Fan and Li [22].
The penalized quasi-maximum likelihood estimator of θ is denoted by θ ^ , which maximizes the function L ( θ ) in (6) with respect to θ . The technical details and an algorithm for calculating the penalized quasi-maximum likelihood estimator θ ^ are provided in Section 4.

3. Asymptotic Properties

We next study the asymptotic properties of the resulting penalized quasi-maximum likelihood estimators. We first introduce some notations. Let θ 0 denote the true value of θ . Furthermore, let θ 0 = ( θ 01 , , θ 0 s ) T = ( ( θ 0 ( 1 ) ) T , ( θ 0 ( 2 ) ) T ) T . For ease of presentation and without loss of generality, it is assumed that θ 0 ( 1 ) is an s 1 × 1 nonzero regression coefficient and that θ 0 ( 2 ) = 0 is an ( s s 1 ) × 1 vector of the zero-valued regression coefficient. Let
a n = max 2 j s { | p λ n ( | θ 0 j | ) | , θ 0 j 0 }
and
b n = max 2 j s { p λ n ( | θ 0 j | ) : θ 0 j 0 } .
Theorem 1.
Suppose that a n = O p ( n 1 2 ) , b n 0 , and λ n 0 as n . Under the conditions ( C 1 ) ( C 10 ) in Appendix A, with probability tending to 1 there must exist a local maximizer θ ^ of the penalized quasi-maximum likelihood function L ( θ ) in (6), such that θ ^ is a n -consistent estimator of θ 0 .
The following theorem gives the asymptotic normality of θ ^ . Let
A n = diag ( 0 , p λ n ( | θ 01 ( 1 ) | ) , , p λ n ( | θ 0 s 1 ( 1 ) | ) ) ,
B n = ( 0 , p λ n ( | θ 01 ( 1 ) | ) sgn ( θ 01 ( 1 ) ) , , p λ n ( | θ 0 s 1 ( 1 ) | ) sgn ( θ 0 s 1 ( 1 ) ) ) T ,
where θ 0 j ( 1 ) is the jth component of θ 0 ( 1 ) ( 1 j s 1 ) .
Furthermore, denote
I n ( θ 0 ) = E 1 n 2 n ( θ 0 ) θ θ T = 1 n [ G n X β 0 ) T Σ 1 ( G n X β 0 ) + t r ( G n s G n ) ] 1 n X T Σ 1 ( G n X β 0 ) 1 n X T Σ 1 X 0 1 n i = 1 n g n , i i Z i T 0 1 2 n Z T Z ,
J n ( θ 0 ) = J 1 1 n X T Σ 2 G n μ 3 0 1 2 n X T diag ( μ 3 ) Σ 2 Z J 2 1 4 n [ Z T Σ 2 diag ( μ 4 ) Z Z T Z ] ,
where J 1 = 1 n [ μ 4 T Σ 2 1 n t r ( G n 2 ) + 2 ( G n X β 0 ) T G n Σ 2 μ 3 3 t r ( G n 2 ) ] ,
J 2 = 1 2 n [ Z T Σ 2 diag ( μ 3 ) ( G n X β 0 ) + Z T Σ 2 G n μ 4 3 i = 1 n g n , i i Z i T ] ,
G n = W A 1 , and G n s = G n + G n T , thus, I n ( θ 0 ) is called as the average Hessian matrix (the information matrix when { e i } are normal). In addition, J n ( θ 0 ) is a symmetric matrix, 1 n is an n-dimensional column vector of ones, μ j = E ( e i j ) , j = 2 , 3 , 4 , G i n is the ith row of G n , and g n , i j is the ( i , j ) th entry of G n . Besides, diag ( C ) represents a diagonal matrix with C, where C is an arbitrary vector.
Theorem 2.
Suppose that the penalty function p λ ( t ) satisfies
lim inf n lim inf t 0 + p λ n ( t ) λ n > 0 ,
and under the same mild conditions as these given in Theorem 1, if  λ n 0 and n λ n as n , and J ( θ 0 ) = lim n J n ( θ 0 ) , then the n -consistent estimator θ ^ = ( ( θ ^ ( 1 ) ) T , ( θ ^ ( 2 ) ) T ) T in Theorem 1 must satisfy
(i)
θ ^ ( 2 ) = 0 with probability tending to 1.
(ii)
n ( I n ( 1 ) ( θ 0 ( 1 ) ) + A n ) { ( θ ^ ( 1 ) θ 0 ( 1 ) ) + ( I n ( 1 ) ( θ 0 ( 1 ) ) + A n ) 1 B n } L N s 1 ( 0 , I 1 ( θ 0 ( 1 ) ) + J 1 ( θ 0 ( 1 ) ) ) ,
where I n ( 1 ) ( θ 0 ( 1 ) ) , I 1 ( θ 0 ( 1 ) ) , and J 1 ( θ 0 ( 1 ) ) are the first super-left submatrix of I n ( θ 0 ) , I ( θ 0 ) = lim n I n ( θ 0 ) and J ( θ 0 ) . In addition, “ L ” denotes convergence in distribution.

4. Computation

4.1. Algorithm

Since L ( θ ) is irregular at the origin, the commonly used gradient method is not applicable. Now, an iterative algorithm is developed based on the local quadratic approximation of the penalty function p λ n ( · ) , as in Fan and Li [22].
Firstly, note that the first two derivatives of the log-likelihood function n ( θ ) are continuous. Around a fixed point θ 0 = ( ρ 0 , β 0 T , γ 0 T ) T , we approximate the log-likelihood function by
n ( θ ) n ( θ 0 ) + n ( θ 0 ) θ T ( θ θ 0 ) + 1 2 ( θ θ 0 ) T 2 n ( θ 0 ) θ θ T ( θ θ 0 ) .
Moreover, given an initial value t 0 , the penalty function p λ n ( t ) can be approximated by a quadratic function
p λ n ( | t | ) p λ n ( | t 0 | ) + 1 2 p λ n ( | t 0 | ) | t 0 | ( t 2 t 0 2 ) , for t t 0 .
Therefore, we can approximate the penalized quasi-maximum likelihood function (6) by the following formula
L ( θ ) n ( θ 0 ) + n ( θ 0 ) θ T ( θ θ 0 ) + 1 2 ( θ θ 0 ) T 2 n ( θ 0 ) θ θ T ( θ θ 0 ) n 2 θ T A n λ ( θ 0 ) θ ,
where
A n λ ( θ 0 ) = diag 0 , p λ n 1 ( 1 ) ( | β 01 | ) | β 01 | , , p λ n p ( 1 ) ( | β 0 p | ) | β 0 p | , p λ n 1 ( 2 ) ( | γ 01 | ) | γ 01 | , , p λ n q ( 2 ) ( | γ 0 q | ) | γ 0 q | ,
θ = ( θ 1 , , θ s ) T = ( ρ , β 1 , , β p ; γ 1 , , γ q ) T and θ 0 = ( θ 01 , , θ 0 s ) T = ( ρ 0 , β 01 , , β 0 p ; γ 01 , , γ 0 q ) T . Accordingly, the quadratic maximization problem for L ( θ ) leads to a solution iterated by
θ n e w θ 0 + 2 n ( ρ 0 , β 0 , γ 0 ) θ θ T n A n λ ( θ 0 ) 1 n A n λ ( θ 0 ) θ 0 n ( ρ 0 , β 0 , γ 0 ) θ .
Secondly, based on the log-likelihood function (4) we can obtain the score functions
U ( θ ) = n ( ρ , β , γ ) θ = ( U 1 T ( ρ ) , U 2 T ( β ) , U 3 T ( γ ) ) T ,
where U 1 ( ρ ) = n ( ρ , β , γ ) ρ = Y T W T Σ 1 ( S Y X β ) t r ( G ) , U 2 ( β ) = n ( ρ , β , γ ) β = X Σ 1 ( S Y X T β ) , U 3 ( γ ) = n ( ρ , β , γ ) γ = 1 2 i = 1 n z i + 1 2 i = 1 n ( y ¯ i x i T β ) 2 σ i 2 z i ,   S Y = ( y ¯ 1 , y ¯ 2 , , y ¯ n ) T . Denote
H ( θ ) = 2 n ( ρ , β , γ ) θ θ T = 2 n ( ρ , β , γ ) ρ ρ T 2 n ( ρ , β , γ ) ρ β T 2 n ( ρ , β , γ ) ρ γ T 2 n ( ρ , β , γ ) β ρ T 2 n ( ρ , β , γ ) β β T 2 n ( ρ , β , γ ) β γ T 2 n ( ρ , β , γ ) γ ρ T 2 n ( ρ , β , γ ) γ β T 2 n ( ρ , β , γ ) γ γ T ,
where 2 n ( ρ , β , γ ) ρ ρ T = Y T W T Σ 1 W Y t r ( G 2 ) , 2 n ( ρ , β , γ ) β β T = X Σ 1 X T , 2 n ( ρ , β , γ ) γ γ T = 1 2 i = 1 n ( y ¯ i x i T β ) 2 σ i 2 z i z i T , 2 n ( ρ , β , γ ) β ρ T = X T Σ 1 W Y ,
2 n ( ρ , β , γ ) β γ T = i = 1 n ( y ¯ i x i T β ) σ i 2 x i z i T , 2 n ( ρ , β , γ ) γ ρ T = i = 1 n y w i e i z i / σ i 2 , here, Y w = W Y = ( y w 1 , y w 2 , , y w n ) T . Finally, we give the following Algorithm 1, which can summarize the computation of penalized quasi-maximum likelihood estimators of the parameters in the heterogeneous SAR Models.
Algorithm 1 
Step 1. The ordinary quasi-maximum likelihood estimators (without penalty) β ( 0 ) , γ ( 0 ) , ρ ( 0 ) of β , γ , ρ are taken as their initial values.
Step 2. θ ( m ) = { ρ ( m ) , β ( m ) T , γ ( m ) T } T are given as current values, then update them by
θ ( m + 1 ) = θ ( m ) + H ( θ ( m ) ) n A n λ ( θ ( m ) ) 1 n A n λ ( θ ( m ) ) θ ( m ) U ( θ ( m ) ) .
Step 3. Repeat Step 2 above until | θ ( m + 1 ) θ ( m ) | < ϵ , where ϵ is a given small number, such as 10 5 .

4.2. Choosing the Tuning Parameters

The penalty function p λ n ( l ) ( · ) involves the tuning parameters λ n ( l ) ( l = 1 , 2 ) that control the amount of the penalty. Many selection criteria, such as CV, GCV, and BIC selection can be used to select the tuning parameters. Wang et al. [28] suggested using a BIC for the SCAD estimator in linear models and partially linear models and proved that its model selection consistency property, i.e., the optimal parameter chosen by the BIC, can identify the true model with the probability tending to one. Hence, their suggestion will be adopted in this paper. Nevertheless, in real application, how to simultaneously select a total of p + q shrinkage parameters { λ n i , i = 1 , , p + q } is challenging. To bypass this difficulty, we follow the idea of Li et al. [18], and simplify the tuning parameters as follows,
(i)
λ n j ( 1 ) = λ n | β ˜ j ( 0 ) | , j = 1 , , p ;
(ii)
λ n k ( 2 ) = λ n | γ ˜ k ( 0 ) | , k = 1 , , q
where β ˜ j ( 0 ) and γ ˜ k ( 0 ) are, respectively, the jth element and kth element of the unpenalized estimates β ˜ ( 0 ) and γ ˜ ( 0 ) . Consequently, the original p + q dimensional problem about λ n i becomes a one-dimensional problem about λ n . λ n can be selected according to the following BIC-type criterion
B I C λ n = 2 n n ( ρ ^ , β ^ , γ ^ ) + d f λ × log ( n ) n ,
where 0 d f λ s is simply the number of nonzero coefficients of θ ^ λ n , and, here, θ ^ λ n = ( ρ ^ , β ^ T , γ ^ T ) T is the estimate of θ for a given λ n .
The tuning parameter can be obtained as
λ ^ n = arg min λ n B I C λ n .
From our simulation studies, we found that this method works well.

5. Simulation Study

In this section we conduct a simulation study to assess the small sample performance of the proposed procedure. In this simulation, we choose m to be 5 and R to be 30, 40, 60, thus n = R × m to be 150, 200, and 300. X and Z are, respectively, generated from multivariate normal distribution with zero mean vector and covariance matrix being Σ 0 = ( c i j ) where c i j = 0.5 | i j | , i = 1 , , 8 , j = 1 , , 8 . Besides, let the spatial parameter ρ = 0.5 , 0 , 0.5 , which represents different spatial dependencies; β = ( 3 , 1.8 , 2.2 , 0 , 0 , 0 , 0 , 0 ) T and the structure of the variance model is log ( σ i 2 ) = z i T γ with γ = ( 1 , 1 , 1 , 0 , 0 , 0 , 0 , 0 ) T . In these simulation, the weight matrix is taken to be W = I R H m , H m = ( l m l m T I m ) / ( m 1 ) , where l m is an m-dimensional vector with all elements being 1,⊗ means Kronecker product.
We generated M = 500 random samples of size n = 150, 200, and 300, respectively. For each random sample, the proposed variable-selection method, based on penalized quasi-maximum likelihood with SCAD and ALASSO penalty functions, is considered. The unknown tuning parameters λ ( l ) , ( l = 1 , 2 ) for the penalty function are chosen by the BIC criterion in the simulation. The average number of the estimated zero coefficients with 500 simulation runs is reported in Table 1, Table 2 and Table 3. Note that “C” in the tables means the average number of zero regression coefficients that are correctly estimated as zero, and “IC” depicts the average number of non-zero regression coefficients that are erroneously set to zero. The performance of estimators β ^ , and γ ^ is assessed by the mean square error(MSE), defined as
MSE ( β ^ ) = E ( β ^ β 0 ) T ( β ^ β 0 ) , MSE ( γ ^ ) = E ( γ ^ γ 0 ) T ( γ ^ γ 0 ) .
The simulation results are reported in Table 1, Table 2 and Table 3.
From Table 1, Table 2 and Table 3, we can make the following observations: (i) as n increases, the performances of variable-selection procedures become better and better. For example, the values in the column labeled ‘MSE’ of β and γ become smaller and smaller; the values in the column labeled ‘C’ become closer and closer to the true number of zero regression coefficients in the models. (ii) Based on different spatial parameters, the results of variable selection are similar. (iii) Two different penalty functions (SCAD and ALASSO) are used in this paper, and both methods perform almost equally well. (iv) Under the same circumstances, the ‘MSE’ of the mean parameters is smaller than the variance parameters’, which are very common in parametric estimation due to the fact that lower-order moments are easier to estimate than higher-order moments’.

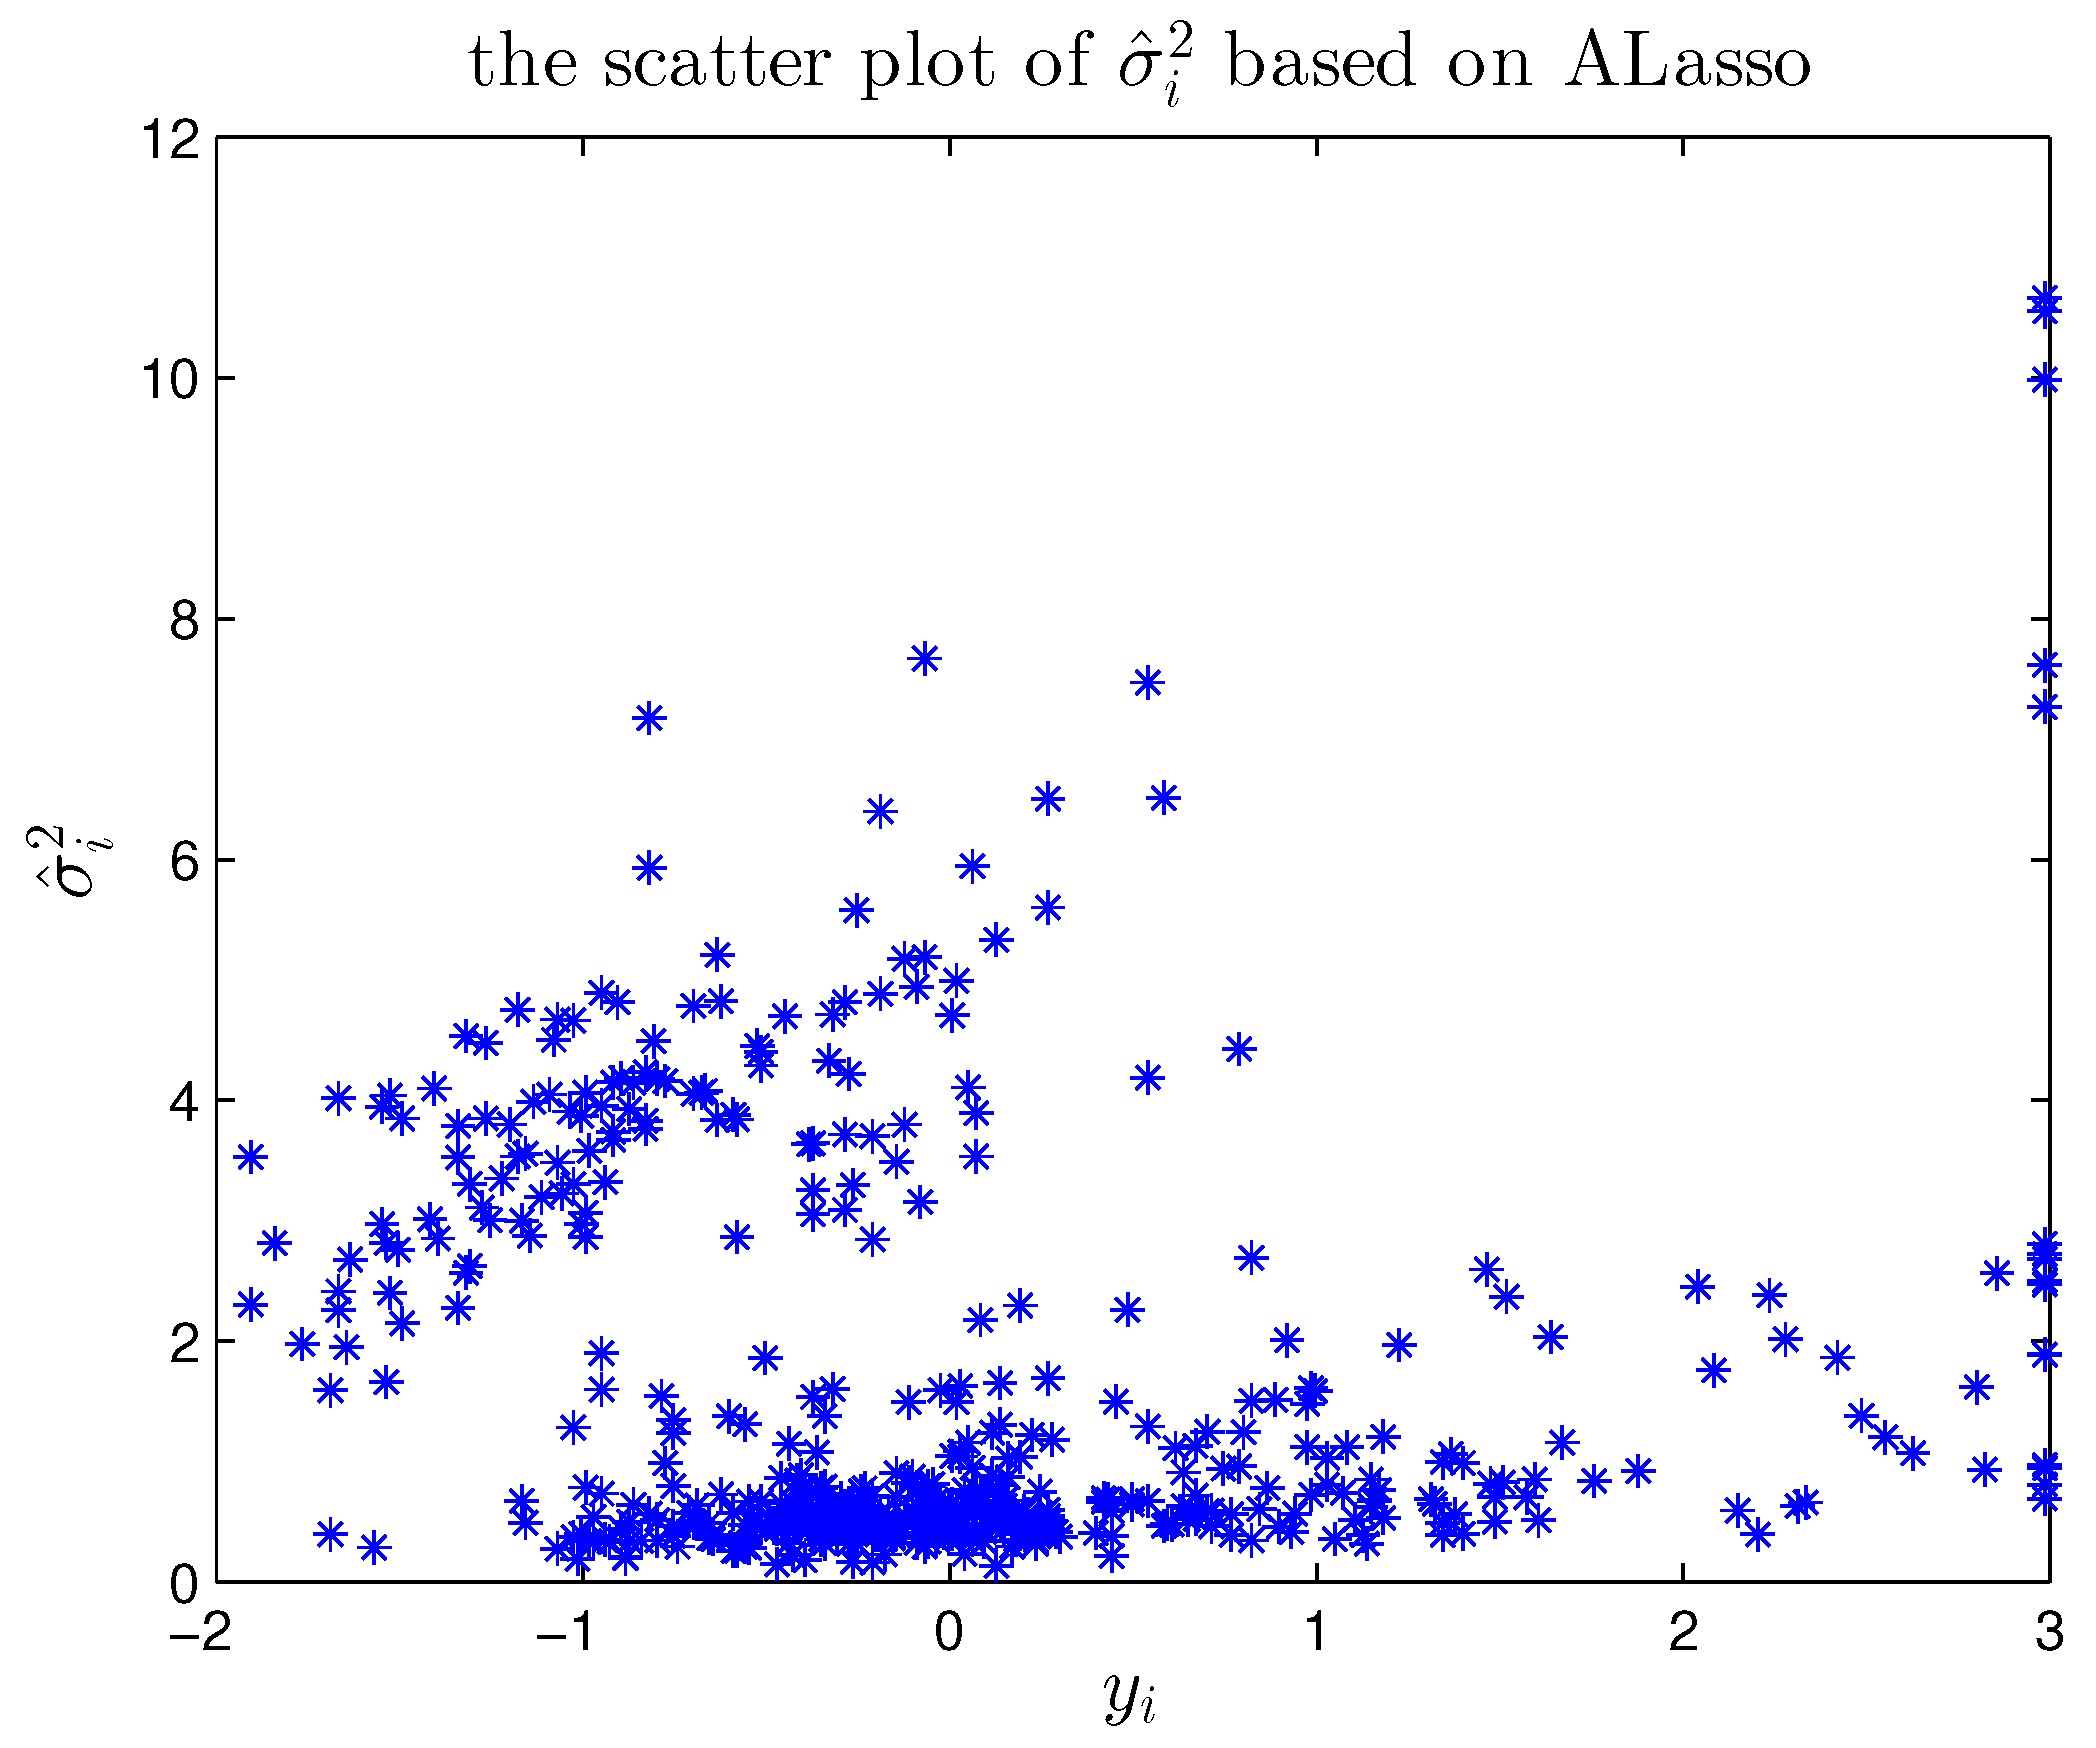
6. Real Data Analysis

In this section, the proposed variable selection method is used to analyze the Boston housing price data that has been analyzed by many authors, for example, Pace and Gilley [29], Su and Yang [30], and so on. The database can be found in the spdep library of R. The dataset contains 14 variables with 506 observations, and a detailed description of these variables is listed in Table 4.
This dataset has been used by Pace and Gilley [29] on the basis of spatial econometric models, and longitude–latitude coordinates for the census tracts are added to the dataset. In this paper, we take MEDV as the response variable, and the other 13 variables in Table 4 are treated as explanatory variables. Similar with Pace and Gilley [29] as well as Su and Yang [30], we use the Euclidean distances in terms of longitude and latitude to generate weight matrix W = ( w i j ) , where
w i j = max 1 d i j d 0 , 0 ,
d i j is the Euclidean distance and d 0 is the threshold distance, which is set to be 0.05 as in Su and Yang [30]. Thus, a spatial weight matrix is used with 19.1% nonzero elements. In addition, Z-variables in the variance model are taken to be the same as X-variables in the mean model. Then, the heterogeneous SAR models are considered here as follows:
Y i = ρ j = 1 n w i j Y j + k = 1 13 X i k β k + ε i , σ i 2 = exp k = 1 13 Z i k γ k , i = 1 , 2 , , 506 .
The ordinary quasi-maximum likelihood estimators (QMLE) and the penalized quasi-maximum likelihood estimators using the SCAD and ALASSO penalty functions are all considered. The tuning parameter was selected by the BIC. The estimated spatial parameter and the regression coefficients by different penalty-estimation methods are presented in Table 5. From Table 5, we can clearly see the following facts. (i) As expected, the spatial parameters are estimated very close to each other, and the other estimates are slightly different among different methods. (ii) Both the SCAD and ALASSO methods can eliminate many unimportant variables in joint mean and variance models. Concretely, the ALASSO method can select the same variables with the SCAD method in the mean model, and the SCAD method can select two more variables than the ALASSO method in the variance model. (iii) The important explanatory variables, selected by the proposed methods, are basically consistent with existing research results, for example, the regression coefficient of X 11 is negative in the mean model, which reveals that the housing price would decrease as the pupil–teacher ratio increases. In addition, based on the estimate of γ ’s, we can obtain the estimates of σ i 2 based on different methods and list the scatter plot of σ ^ i 2 in Figure 1, Figure 2 and Figure 3, which shows that the heteroscedasticity modeling for this dataset is reasonable.

7. Conclusions and Discussion

Within the framework of heterogeneous spatial autoregressive models, we proposed a variable-selection method on the basis of a penalized quasi-maximum likelihood approach. Like the mean, the variance parameters may be dependent on various explanatory variables of interest, so that simultaneous variable selection to the mean and variance models becomes important to avoid the modeling biases and reduce the model complexities. We have proven that the proposed penalized quasi-maximum likelihood estimators of the parameters in the mean and variance models are asymptotically consistent and normally distributed under some mild conditions. Simulation studies and a real data analysis of the Boston housing data are conducted to illustrate the proposed methodology. The results show that the proposed variable selection method is highly efficient and computationally fast.
Furthermore, there are several interesting issues that merit further research. For example, (i) it is interesting to increase the model flexibility by introducing nonparametric functions in the context of spatial autoregressive model and to study the variable selection for both the parametric component and the nonparametric component; (ii) a possible extension of the heterogeneous spatial autoregressive models is considered when the response variables are missing under a different missingness mechanism; and (iii) in the penalized estimation, we can also penalize the spatial parameter just like regression coefficients, which can help us directly judge whether the analyzed data have a spatial structure. These are all topics of interest and worthy of further study.

Author Contributions

Conceptualization, R.T. and D.X.; methodology, R.T. and D.X.; software, M.X. and D.X.; data curation, R.T. and D.X.; formal analysis, M.X. and D.X.; writing—original draft, R.T. and D.X. All authors have read and agreed to the published version of the manuscript.

Funding

This work was supported by the National Statistical Science Research Project (2021LY061), the Startup Foundation for Talents at Hangzhou Normal University (2019QDL039), and the Statistical Science Research Project of Zhejiang Province (in 2022).

Institutional Review Board Statement

Not applicable.

Informed Consent Statement

Not applicable.

Data Availability Statement

Not applicable.

Conflicts of Interest

The authors declare no conflict of interest.

Appendix A. Proof of Theorems

To prove the theorems in the paper, we require the following regular conditions:
C1.
The { e i } , i = 1 , , n are independent with E ( e i ) = 0 and v a r ( e i ) = σ i 2 . The moment E ( | e i | 4 + v ) exists for some v > 0 .
C2.
The elements w n , i j = O ( 1 / h n ) and w n , i i = 0 , i , j = 1 , , n are in W, where h n / n 0 as n .
C3.
The matrix S is a nonsingular matrix.
C4.
The sequences of matrices { W } and { S 1 } are uniformly bounded in both row and column sums.
C5.
The lim n n 1 X T Σ 1 X and lim n n 1 Z T Z exist and are nonsingular. The elements of X and Z are uniformly bounded constants for all n.
C6.
S 1 ( ρ ) are uniformly bounded in row or column sums, uniformly in ρ in a closed subset Λ of ( 1 , 1 ) . The true ρ 0 is an interior point of Λ .
C7.
The lim n ( X , G X β 0 ) T Σ 1 ( X , G X β 0 ) exists and is a nonsingular matrix.
C8.
The lim n E ( n 1 ( 2 n ( θ 0 ) ) / θ θ T ) exists.
C9.
The third derivatives ( 3 L ( θ ) / θ j θ l θ m ) exist for all θ in an open set Θ that contains the true parameter point θ 0 . Furthermore, there exist functions M j l m such that | n 1 3 n ( θ ) / θ j θ l θ m | M j l m for all θ Θ , where E ( M j l m ) < for j , l , m .
C10.
The penalty function satisfies
lim inf n lim inf θ j 0 + λ n j 1 p λ n j ( | θ j | ) > 0 , j = 2 , , s .
Remarks: Conditions 1–8 are sufficient conditions for the correctness of the global identification, asymptotic normality, and the consistent estimation of the QMLE of the model (3), which are similar to the conditions provided by Lee [27] and Liu et al. [5]. Concretely, Condition 1 is applied in the use of the central-limit theorem of Kelejian and Prucha [31]. Condition 2 shows the features of the weight matrix. If { h n } is a bounded sequence, Condition 2 holds. In Case’s model (Case [32]), Condition 2 is still satisfied although h n might diverge to infinity. Condition 3 is used to guarantee the existence of mean and variance of independent variable. Condition 4 implies that the variance of Y is bounded when n tends to infinity, see Kelejian and Prucha [31] as well as Lee [27]. Condition 5 can exclude the multicollinearity of the regressors of X and Z. For convenient analysis, we assume that the regressors are uniformly bounded. If not, they can be replaced by stochastic regressors with certain finite-moment conditions (Lee [27]). Condition 6 is meaningful to deal with the nonlinearity of l n | S ( ρ ) | in a log-likelihood function. Conditions 7–8 are used for the asymptotic normality of the QMLE. Condition 9 plays an important role in the Taylor expansion of related functions, which is similar to the condition (C) provided by Fan and Li [22]. Condition 10 is an assumption on the penalty function.
In order to prove Theorems 1 and 2, we need for the log-likelihood function n ( ρ , β , γ ) to have several properties, which are stated in the following Lemmas.
Lemma A1.
Suppose that Conditions 1–9 hold, then we can obtain
1 n n ( θ 0 ) θ = O p ( 1 ) .
Proof of Lemma A1. 
By calculating the first-order partial derivatives of the log-likelihood function at θ 0 , we obtain
1 n n ( θ 0 ) ρ = 1 n ( G n X β ) T Σ 1 e + 1 n e T G n Σ 1 e 1 n t r ( G n ) ,
1 n n ( θ 0 ) β = 1 n X T Σ 1 e ,
1 n n ( θ 0 ) γ = 1 2 n i = 1 n e i 2 σ i 2 Z i ,
The variance of 1 n n ( θ 0 ) ρ is
v a r 1 n n ( θ 0 ) ρ = v a r 1 n ( G n X β ) T Σ 1 e + ( 1 n e T G n Σ 1 e 1 n t r ( G n ) ) 2 1 n [ v a r ( ( G n X β ) T Σ 1 e ) + v a r ( e T G n Σ 1 e t r ( G n ) ) ] = 2 n ( G n X β ) T ( G n X β ) + 2 n v a r ( e T G n Σ 1 e ) = O ( 1 ) + O ( 1 h n ) = O ( 1 ) .
Thus, 1 n n ( θ 0 ) ρ = O p ( 1 ) . When the elements of X and Z are uniformly bounded for all n, it is obvious that 1 n X T Σ 1 e = O p ( 1 ) . In addition, by some elementary calculations, we have the variance of 1 n n ( θ 0 ) γ is
v a r 1 n n ( θ 0 ) γ = 1 4 n i = 1 n v a r ( e i 2 ) 1 σ i 4 Z i T Z i = 1 4 n i = 1 n 1 σ i 4 ( μ 4 i σ i 4 ) = O ( 1 ) ,
where μ 4 i = E ( e i 4 ) , therefore, 1 n n ( θ 0 ) γ = O p ( 1 ) . Thus, the proof of the Lemma A1 is completed. □
Lemma A2.
If Conditions 1–8 hold, then
1 n 2 n ( θ 0 ) θ θ T = E ( 1 n 2 n ( θ 0 ) θ θ T ) + o p ( 1 ) .
Proof of Lemma A2. 
The proof of Lemma A2 is similar to the proof of Theorem 3.2 (Lee [27]), so we omit the details. □
Proof of Theorem 1. 
Let α n = n 1 / 2 + a n . Similar to the proof of Theorem 1 in Fan and Li [22], we just need to prove that for any given ε > 0 , there exists a large constant C, such that
P sup u = C L ( θ 0 + α n u ) < L ( θ 0 ) 1 ε .
Note that p λ n ( 0 ) = 0 . By using the Taylor expansion of the log-likelihood function, we have
D n ( u ) = L ( θ 0 + α n u ) L ( θ 0 ) = n ( θ 0 + α n u ) n ( θ 0 ) { n j = 2 s p λ n j ( | θ j 0 + α n u j | ) n j = 2 s p λ n j ( | θ j 0 | ) } α n n ( θ 0 ) θ T u 1 2 u T I n ( θ 0 ) u n α n 2 { 1 + o p ( 1 ) } j = 2 s 1 [ n α n p λ n j ( | θ j 0 | ) s g n ( θ j 0 ) u j + n α n 2 p λ n j ( | θ j 0 | ) u j 2 { 1 + o ( 1 ) } ] = A 1 A 2 A 3 ,
where s 1 is the number of dimensions of θ 0 ( 1 ) . It follows from Lemma A1 that
A 1 = α n n ( θ 0 ) θ T u α n n ( θ 0 ) θ T · u = u · O p ( n α n 2 ) .
Under Condition 8,
A 2 = 1 2 u T I n ( θ 0 ) u n α n 2 { 1 + o p ( 1 ) } = u 2 · O p ( n α n 2 ) .
In addition,
A 3 = j = 2 s 1 [ n α n p λ n j ( | θ j 0 | ) s g n ( θ j 0 ) u j + n α n 2 p λ n j ( | θ j 0 | ) u j 2 { 1 + o ( 1 ) } ] j = 2 s 1 [ n α n | p λ n j ( | θ j 0 | ) | · | u j | + n α n 2 p λ n j ( | θ j 0 | ) u j 2 { 1 + o ( 1 ) } ] s 1 n α n a n u + n α n 2 max { p λ n j ( | θ j 0 | ) : θ j 0 0 } u 2 { 1 + o ( 1 ) } = u · O p ( n α n 2 ) + u 2 · o p ( n α n 2 ) .
Furthermore, by choosing a sufficiently large C, A 1 and A 3 are dominated by A 2 uniformly in u = C . Hence, (A1) holds, which implies the proof of Theorem 1 is completed. □
Proof of Theorem 2. 
We first prove part (i). According to Theorem 1, it is sufficient to show that, for any θ ( 1 ) that satisfies θ ( 1 ) θ 0 ( 1 ) = O p ( n 1 / 2 ) and some given small ϵ n = C n 1 / 2 , when n , with probability tending to 1, we have
L ( θ ) θ j < 0 , for 0 < θ j < ϵ n , j = s 1 + 1 , , s ,
and
L ( θ ) θ j > 0 , for ϵ n < θ j < 0 , j = s 1 + 1 , , s .
By the Taylor expansion, it is easy to prove that
L ( θ ) θ j = n ( θ ) θ j n p λ n j ( | θ j | ) s g n ( θ j ) = n ( θ 0 ) θ j + l = 1 s 2 n ( θ 0 ) θ j θ l ( θ l θ l 0 ) + l = 1 s m = 1 s 3 n ( θ ) θ j θ l θ m ( θ l θ l 0 ) ( θ m θ m 0 ) n p λ n j ( | θ j | ) s g n ( θ j )
where θ lies between θ and θ 0 . From Lemmas A1–A2 and Condition 9, we obtain
1 n n ( θ 0 ) θ j = O p ( n 1 / 2 ) ,
1 n 2 n ( θ 0 ) θ θ T = E 1 n 2 n ( θ 0 ) θ θ T + o p ( 1 ) ,
1 n 3 n ( θ ) θ j θ l θ m = O p ( 1 ) .
When θ ( 1 ) θ 0 ( 1 ) = O p ( n 1 / 2 ) , we have
L ( θ ) θ j = n λ n { λ n 1 1 n n ( θ 0 ) θ j + λ n 1 l = 1 s 1 n 2 n ( θ 0 ) θ j θ l ( θ l θ l 0 ) + λ n 1 l = 1 s m = 1 s 3 n ( θ ) θ j θ l θ m ( θ l θ l 0 ) ( θ m θ m 0 ) λ n 1 p λ n ( | θ j | ) s g n ( θ j ) } = n λ n [ λ n 1 O p ( n 1 / 2 ) + λ n 1 O p ( n 1 / 2 ) + λ n 1 O p ( n 1 ) λ n 1 p λ n ( | θ j | ) s g n ( θ j ) ] = n λ n [ λ n 1 p λ n ( | θ j | ) s g n ( θ j ) + O p ( n 1 / 2 λ n 1 ) ] .
Note that lim inf n lim inf δ 0 + λ n 1 p λ n ( δ ) > 0 and lim n n 1 / 2 λ n 1 = 0 . The sign of the derivative is determined by that of θ j with a sufficiently large n. This show that (A2) and (A3) follow. This completes the proof of part (i).
Next, we prove part (ii). By Theorem 1, there is a n consistent local maximizer of L n ( θ ( 1 ) T , 0 T ) , denoted as θ ^ ( 1 ) , which satisfies
L ( θ ) θ j | θ = ( θ ( 1 ) T , 0 T ) T = 0 , for j = 1 , , s .
For j 2 , note that
L ( θ ) θ j = n ( θ ) θ j n p λ n j ( | θ j | ) sgn ( θ j ) = n ( θ 0 ) θ j + l = 1 s 2 n ( θ 0 ) θ j θ l + o p ( 1 ) ( θ l θ l 0 ) n [ p λ n j ( | θ j 0 | ) sgn ( θ j 0 ) + ( p λ n j ( | θ j 0 | ) + o p ( 1 ) ) ( θ j θ j 0 ) ]
Hence, we have
n ( θ 0 ) θ j = l = 1 s 2 n ( θ 0 ) θ j θ l + o p ( 1 ) ( θ ^ l θ l 0 ) + n [ p λ n ( | θ j 0 | ) sgn ( θ j 0 ) + ( p λ n ( | θ j 0 | ) + o p ( 1 ) ) ( θ ^ j θ j 0 ) ]
where θ ^ l is the lth element of θ ^ 1 ( 1 ) .
Let Ω = 1 n 2 n ( θ 0 ) θ j θ l s 1 × s 1 , B = [ I s 1 × s 1 , 0 s 1 × ( s s 1 ) ] , then
B 1 n n ( θ ) θ = Ω n ( θ ^ ( 1 ) θ 0 ( 1 ) ) + A n n ( θ ^ ( 1 ) θ 0 ( 1 ) ) + n b n + o p ( 1 ) = [ Ω I n ( 1 ) ( θ 0 ( 1 ) ) ] n ( θ ^ ( 1 ) θ 0 ( 1 ) ) + I n ( 1 ) ( θ 0 ( 1 ) ) n ( θ ^ ( 1 ) θ 0 ( 1 ) ) + A n n ( θ ^ ( 1 ) θ 0 ( 1 ) ) + n b n + o p ( 1 ) = I n ( 1 ) ( θ 0 ( 1 ) ) n ( θ ^ ( 1 ) θ 0 ( 1 ) ) + A n n ( θ ^ ( 1 ) θ 0 ( 1 ) ) + n b n + o p ( 1 ) = n ( I n ( 1 ) ( θ 0 ( 1 ) ) + A n ) ( θ ^ ( 1 ) θ 0 ( 1 ) ) + b n + o p ( 1 ) .
Furthermore, by using the central-limit theorem for the linear-quadratic forms of Kelejian and Prucha [31], it has
B 1 n n ( θ 0 ) θ L N ( 0 , ( I 1 ( 1 ) ( θ 0 ( 1 ) ) + J 1 ( θ 0 ( 1 ) ) ) .
Therefore, according to Slutsky’s theorem, we obtain
n ( I n ( 1 ) ( θ 0 ( 1 ) ) + A n ) ( θ ^ ( 1 ) θ 0 ( 1 ) ) + B n L N ( 0 , ( I 1 ( 1 ) ( θ 0 ( 1 ) ) + J 1 ( θ 0 ( 1 ) ) ) .
The proof of Theorem 2 is, hence, completed. □

References

  1. Cliff, A.; Ord, J.K. Spatial Autocorrelation; Pion: London, UK, 1973. [Google Scholar]
  2. Anselin, L. Spatial Econometrics: Methods and Models; Kluwer Academic Publishers: Dordrecht, The Netherlands, 1988. [Google Scholar]
  3. Anselin, L.; Bera, A.K. Spatial Dependence in Linear Regression Models with an Introduction to Spatial Econometrics. In Handbook of Applied Economics Statistics; Ullah, A., Giles, D.E.A., Eds.; Marcel Dekker: New York, NY, USA, 1998. [Google Scholar]
  4. Xu, X.B.; Lee, L.F. A spatial autoregressive model with a nonlinear transformation of the dependent variable. J. Econom. 2015, 186, 1–18. [Google Scholar] [CrossRef]
  5. Liu, X.; Chen, J.B.; Cheng, S.L. A penalized quasi-maximum likelihood method for variable selection in the spatial autoregressive model. Spat. Stat. 2018, 25, 86–104. [Google Scholar] [CrossRef]
  6. Xie, L.; Wang, X.R.; Cheng, W.H.; Tang, T. Variable selection for spatial autoregressive models. Commun.-Stat. Methods 2021, 50, 1325–1340. [Google Scholar] [CrossRef]
  7. Xie, T.F.; Cao, R.Y.; Du, J. Variable selection for spatial autoregressive models with a diverging number of parameters. Stat. Pap. 2020, 61, 1125–1145. [Google Scholar] [CrossRef]
  8. Su, L.J.; Jin, S.N. Profile quasi-maximum likelihood estimation of partially linear spatial autoregressive models. J. Econom. 2010, 157, 18–33. [Google Scholar] [CrossRef]
  9. Du, J.; Sun, X.Q.; Cao, R.Y.; Zhang, Z.Z. Statistical inference for partially linear additive spatial autoregressive models. Spat. Stat. 2018, 25, 52–67. [Google Scholar] [CrossRef]
  10. Cheng, S.L.; Chen, J.B. Estimation of partially linear single-index spatial autoregressive model. Stat. Pap. 2021, 62, 485–531. [Google Scholar] [CrossRef]
  11. Wei, C.H.; Guo, S.; Zhai, S.F. Statistical inference of partially linear varying coefficient spatial autoregressive models. Econ. Model. 2017, 64, 553–559. [Google Scholar] [CrossRef]
  12. Hu, Y.P.; Wu, S.Y.; Feng, S.Y.; Jin, J.L. Estimation in Partial Functional Linear Spatial Autoregressive Model. Mathematics 2020, 8, 1680. [Google Scholar] [CrossRef]
  13. Lin, X.; Lee, L.F. GMM estimation of spatial autoregressive models with unknown heteroskedasticity. J. Econom. 2010, 157, 34–52. [Google Scholar] [CrossRef]
  14. Dai, X.W.; Jin, L.B.; Tian, M.Z.; Shi, L. Bayesian Local Influence for Spatial Autoregressive Models with Heteroscedasticity. Stat. Pap. 2019, 60, 1423–1446. [Google Scholar] [CrossRef]
  15. Wu, L.C.; Li, H.Q. Variable selection for joint mean and dispersion models of the inverse Gaussian distribution. Metrika 2012, 75, 795–808. [Google Scholar] [CrossRef]
  16. Xu, D.K.; Zhang, Z.Z. A semiparametric Bayesian approach to joint mean and variance models. Stat. Probab. Lett. 2013, 83, 1624–1631. [Google Scholar] [CrossRef]
  17. Zhao, W.H.; Zhang, R.Q.; Lv, Y.Z.; Liu, J.C. Variable selection for varying dispersion beta regression model. J. Appl. Stat. 2014, 41, 95–108. [Google Scholar] [CrossRef]
  18. Li, H.Q.; Wu, L.C.; Ma, T. Variable selection in joint location, scale and skewness models of the skew-normal distribution. J. Syst. Sci. Complex. 2017, 30, 694–709. [Google Scholar] [CrossRef]
  19. Zhang, D.; Wu, L.C.; Ye, K.Y.; Wang, M. Bayesian quantile semiparametric mixed-effects double regression models. Stat. Theory Relat. Fields 2021, 5, 303–315. [Google Scholar] [CrossRef]
  20. Tibshirani, R. Regression shrinkage and selection via the LASSO. J. R. Stat. Soc. Ser. B 1996, 58, 267–288. [Google Scholar] [CrossRef]
  21. Zou, H. The adaptive lasso and its oracle properties. J. Am. Stat. Assoc. 2006, 101, 1418–1429. [Google Scholar] [CrossRef] [Green Version]
  22. Fan, J.Q.; Li, R.Z. Variable selection via nonconcave penalized likelihood and its oracle properties. J. Am. Stat. Assoc. 2001, 96, 1348–1360. [Google Scholar] [CrossRef]
  23. Luo, G.; Wu, M. Variable selection for semiparametric varying-coefficient spatial autoregressive models with a diverging number of parameters. Commun.-Stat. Methods 2021, 50, 2062–2079. [Google Scholar] [CrossRef]
  24. Li, R.; Liang, H. Variable selection in semiparametric regression modeling. Ann. Stat. 2008, 36, 261–286. [Google Scholar] [CrossRef] [PubMed]
  25. Zhao, P.X.; Xue, L.G. Variable selection for semiparametric varying coefficient partially linear errorsin-variables models. J. Multivar. Anal. 2010, 101, 1872–1883. [Google Scholar] [CrossRef] [Green Version]
  26. Tian, R.Q.; Xue, L.G.; Liu, C.L. Penalized quadratic inference functions for semiparametric varying coefficient partially linear models with longitudinal data. J. Multivar. Anal. 2014, 132, 94–110. [Google Scholar] [CrossRef]
  27. Lee, L.F. Asymptotic distributions of quasi-maximum likelihood estimators for spatial autoregressive models. Econometrica 2004, 72, 1899–1925. [Google Scholar] [CrossRef]
  28. Wang, H.; Li, R.; Tsai, C. Tuning parameter selectors for the smoothly clipped absolute deviation method. Biometrika 2007, 94, 553–568. [Google Scholar] [CrossRef] [PubMed]
  29. Pace, R.K.; Gilley, O.W. Using the spatial configuration of the data to improve estimation. J. Real Estate Financ. Econ. 1997, 14, 333–340. [Google Scholar] [CrossRef]
  30. Su, L.; Yang, Z. Instrumental Variable Quantile Estimation of Spatial Autoregressive Models; Working Paper; Singapore Management University: Singapore, 2009. [Google Scholar]
  31. Kelejian, H.H.; Prucha, I.R. On the asymptotic distribution of the Moran I test statistic with applications. J. Econom. 2001, 104, 219–257. [Google Scholar] [CrossRef] [Green Version]
  32. Case, A.C. Spatial patterns in household demand. Econometrica 1991, 59, 953–965. [Google Scholar] [CrossRef] [Green Version]
Figure 1. The scatter plot of σ ^ i 2 based on the ordinary quasi-maximum likelihood estimators (QMLE).
Symmetry 14 01200 g001
Figure 2. The scatter plot of σ ^ i 2 based on the penalized quasi-maximum likelihood using SCAD.
Symmetry 14 01200 g002
Figure 3. The scatter plot of σ ^ i 2 based on the penalized quasi-maximum likelihood using ALASSO.
Symmetry 14 01200 g003
Table 1. Variable selections for β and γ under different sample sizes when ρ = 0.5 .
SCADALASSO
β nMSECICMSECIC
1500.00434.936000.00414.97600
2000.00294.948000.00274.99000
3000.00164.976000.00154.99800
γ nMSECICMSECIC
1500.09034.89600.00400.09704.90000.0040
2000.06334.904000.06314.94000
3000.03424.958000.03524.99000
Table 2. Variable selections for β and γ under different sample sizes when ρ = 0 .
SCADALASSO
β nMSECICMSECIC
1500.00414.918000.00384.97000
2000.00274.952000.00264.99000
3000.00164.976000.00165.00000
γ nMSECICMSECIC
1500.09034.904000.09554.90800
2000.06324.920000.06454.94600
3000.03874.926000.03834.97600
Table 3. Variable selections for β and γ under different sample sizes when ρ = 0.5 .
SCADALASSO
β nMSECICMSECIC
1500.00464.908000.00444.95600
2000.00324.924000.00304.98000
3000.00174.972000.00175.00000
γ nMSECICMSECIC
1500.09194.878000.10334.88600
2000.06004.922000.06364.95000
3000.03634.942000.03724.98000
Table 4. Description of the variables in Boston housing data.
VariablesDescription
CRIM ( X 1 ) Per capita crime rate by town
ZN ( X 2 ) Proportion of residential land zoned for lots over 25,000 sq. ft.
INDUS ( X 3 ) Proportion of non-retail business acres per town
CHAS ( X 4 ) Charles River dummy variable (=1 if tract bounds river; 0 otherwise)
NOX ( X 5 ) Nitric-oxides concentration (parts per 10 million)
RM ( X 6 ) Average number of rooms per dwelling
AGE ( X 7 ) Proportion of owner-occupied units built prior to 1940
DIS ( X 8 ) Weighted distances to five Boston employment centres
RAD ( X 9 ) Index of accessibility to radial highways
TAX ( X 10 ) Full-value property-tax rate per USD 10,000
PTRATIO ( X 11 ) Pupil–teacher ratio by town
B ( X 12 ) 1000 ( B k 0.63 ) 2 , where Bk is the proportion of blacks by town
LSTAT ( X 13 ) % of the population with lower status
MEDV ( Y ) Median value of owner-occupied homes in USD 1000s
Table 5. Penalized quasi-maximum likelihood estimators for β and γ .
Coefficient QMLESCADALASSO
β 1 ( X 1 ) −0.088200
β 2 ( X 2 ) 0.069900
β 3 ( X 3 ) −0.042700
β 4 ( X 4 ) 0.003800
β 5 ( X 5 ) −0.014500
β 6 ( X 6 ) 0.46410.57090.6023
β 7 ( X 7 ) −0.1509−0.1788−0.1489
β 8 ( X 8 ) −0.2076−0.1287−0.1175
β 9 ( X 9 ) 0.20080.14400.0502
β 10 ( X 10 ) −0.2031−0.2049−0.1502
β 11 ( X 11 ) −0.1073−0.0750−0.0829
β 12 ( X 12 ) 0.14400.16380.1033
β 13 ( X 13 ) −0.059700
γ 1 ( Z 1 ) 0.126500
γ 2 ( Z 2 ) 0.102000
γ 3 ( Z 3 ) −0.083000
γ 4 ( Z 4 ) 0.082300
γ 5 ( Z 5 ) −0.4000−0.36730
γ 6 ( Z 6 ) 0.111300
γ 7 ( Z 7 ) 0.36370.34610.2357
γ 8 ( Z 8 ) −0.4004−0.3877−0.2381
γ 9 ( Z 9 ) 0.73660.89520.9143
γ 10 ( Z 10 ) 0.29200.21050
γ 11 ( Z 11 ) −0.3533−0.4085−0.2723
γ 12 ( Z 12 ) −0.014100
γ 13 ( Z 13 ) −0.4262−0.4586−0.3929
ρ 0.25310.28810.2809
Publisher’s Note: MDPI stays neutral with regard to jurisdictional claims in published maps and institutional affiliations.

