Article

Improved LightGBM-Based Framework for Electric Vehicle Lithium-Ion Battery Remaining Useful Life Prediction Using Multi Health Indicators

1
Department of Automation Engineering, Zhonghuan Information College Tianjin University of Technology, Tianjin 300380, China
2
Key Laboratory of Smart Grid of Ministry of Education, Tianjin University, Tianjin 300072, China
3
Department of Electrical Engineering and Automation, Harbin Institute of Technology, Harbin 150006, China
4
College of Electrical Engineering, Sichuan University, Chengdu 610044, China
5
State Grid Tianjin Electric Power Company Economic and Technological Research Institute, Tianjin 300160, China
6
Department of Energy Technology, Aalborg University, 9220 Aalborg, Denmark
*
Authors to whom correspondence should be addressed.
Symmetry 2022, 14(8), 1584; https://doi.org/10.3390/sym14081584
Submission received: 30 June 2022 / Revised: 23 July 2022 / Accepted: 29 July 2022 / Published: 1 August 2022
(This article belongs to the Section Engineering and Materials)

Abstract

:
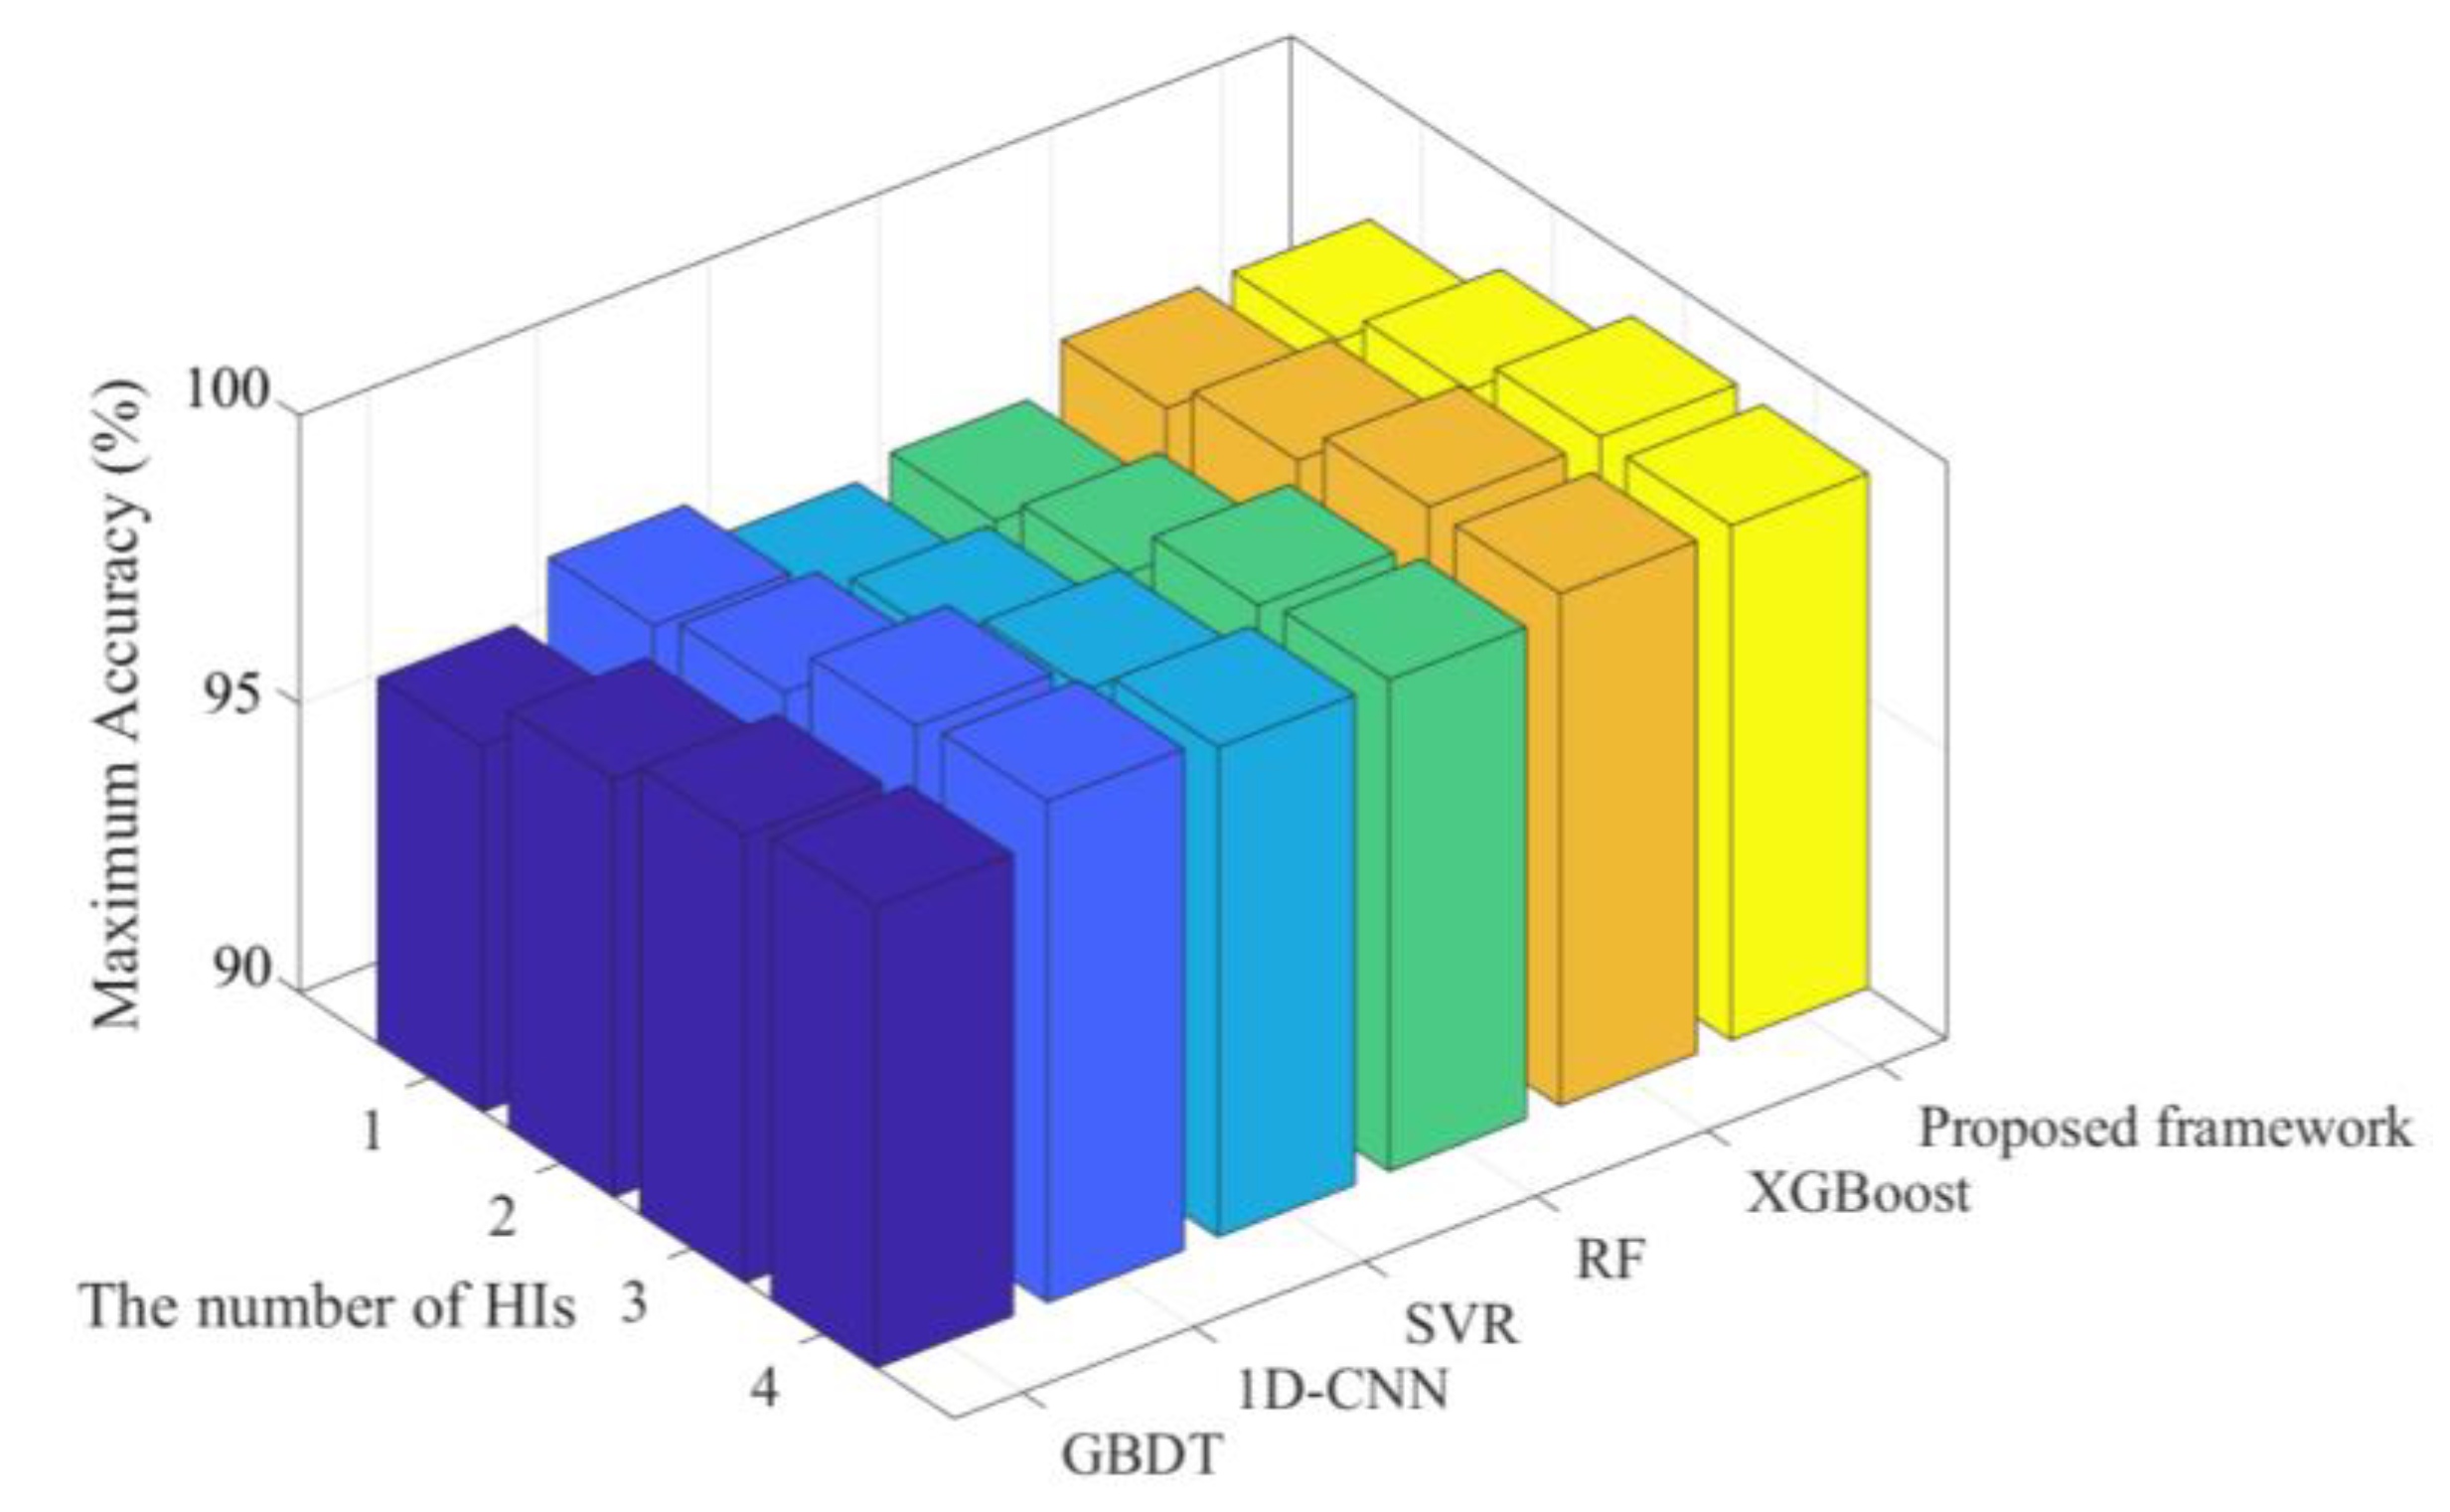
To improve the prediction accuracy and prediction speed of battery remaining useful life (RUL), this paper proposes an improved light gradient boosting machine (LightGBM)-based framework. Firstly, the features from the electrochemical impedance spectroscopy (EIS) and incremental capacity-differential voltage (IC-DV) curve are extracted, and the open circuit voltage and temperature are measured; then, those are regarded as multi HIs to improve the prediction accuracy. Secondly, to adaptively adjust to multi HIs and improve prediction speed, the loss function of the LightGBM model is improved by the adaptive loss. The adaptive loss is utilized to adjust the loss function form and limit the saturation value for the first-order derivative of the loss function so that the improved LightGBM can achieve an adaptive adjustment to multiple HIs (ohmic resistance, charge transfer resistance, solid electrolyte interface (SEI) film resistance, Warburg resistance, loss of conductivity, loss of active material, loss of lithium ion, isobaric voltage drop time, and surface average temperature) and limit the impact of error on the gradient. The model parameters are optimized by the hyperparameter optimization method, which can avoid the lower training efficiency caused by manual parameter adjustment and obtain the optimal prediction performance. Finally, the proposed framework is validated by the database from the battery aging and performance testing experimental system. Compared with traditional prediction methods, GBDT (1.893%, 4.324 s), 1D-CNN (1.308%, 47.381 s), SVR (1.510%, 80.333 s), RF (1.476%, 852.075 s), and XGBoost (1.119%, 24.912 s), the RMSE and prediction time of the proposed framework are 1.078% and 15.728 s under the total HIs. The performance of the proposed framework under a different number of HIs is also analyzed. The experimental results show that the proposed framework can achieve the optimal prediction accuracy (98.978%) under the HIs of resistances, loss modes, and isobaric voltage drop time.

1. Introduction

The power batteries mainly include the lead-acid battery, the nickel-metal hydride battery, and the lithium-ion battery. Among them, lithium-ion batteries have been widely used in electric vehicles (EV) or hybrid electric vehicles (HEV) and other fields [1,2], with the merits of high energy density, long cycle lifetime, low self-discharge rate, great charge–discharge performance, and a wide operating temperature range [3]. However, with the process of charge and discharge, the symmetrical or asymmetrical electrochemical reaction inside the battery intensifies. Besides the oxidation–reduction reaction caused by lithium ion deinterlacing, there are also many side reactions, such as electrolyte decomposition, active substance dissolution, metal lithium deposition, etc. These side reactions lead to the degradation of the battery capacity [4]. Under the actual driving conditions of electric vehicles, the working environment and performance degradation of batteries are complex. An accurate remaining useful life (RUL) prediction for a battery can avoid serious inconvenience and enormous maintenance costs, led by the risk of catastrophic consequences, which plays an emphatic role in prognostics and health management [5].
According to the literature, RUL prediction can be mainly divided into the model-based and the data-driven. The model-based RUL prediction method usually uses prior knowledge to model the battery degradation mechanism [6] and identifies the parameters in the model by means of the least square method [7] or the observer [8] through the battery lifecycle test data [9] and electrochemical impedance spectroscopy (EIS) [10]. The RUL degradation model mentioned above can consider the influence of different temperature effects [11] and the unobservable state quantity [12] on battery capacity degradation, which have clear physical significance. Nevertheless, these models often ignore the battery operation conditions, such as vibration stress [13,14]. Battery model parameters will vary with the service conditions, resulting in the battery model accuracy of the fixed parameters decreasing with age. In order to improve the prediction accuracy, the model needs to be modified according to different battery types and operation conditions; this brings a huge amount of parameter identification calculations and complex physical models [15].
With the development of machine learning [16], many data-driven methods, such as the gradient boosting decision tree (GBDT) [17], the Gaussian regression method [18], Monte Carlo simulation [19], neural network [20], support vector regression (SVR) [21], random forest (RF) [22], extreme gradient boosting (XGBoost) [23], and the light gradient boosting machine (LightGBM) [24], are gradually being widely used in battery RUL prediction. The data-driven RUL prediction process mainly includes health indicator establishment and model training. Many scholars have carried out research on RUL prediction based on health indicators (HIs) [25]. In [26], the input voltage [22,24] and the current and temperature measurement [17] are regarded as HIs to realize RUL prediction through the GBDT. In [18,19], the multi HIs are extracted from the peak area of the incremental capacity curve and the charge–discharge time period, and the Box–Cox transformation method was used to build a battery state of health (SOH) estimation framework. In [20], the isobaric voltage drop time is regarded as the HI, and the convolution neural network, the long short-term memory neural network, and the back-propagation neural network are compared to predict the battery RUL. In [21], the OCV is extracted from current pulse as the HI; the SVR optimized by the swam algorithm is used for RUL prediction and to solve the problems of nonlinear data processing and convergence accuracy. In [22], capacity degradation and internal resistance growth are considered HIs to estimate the battery SOH. In [23], the battery open circuit voltage (OCV) [24], current, and impedance are regarded as HIs, and the adaptive Brownian motion is utilized to estimate battery SOH. The above research provides a basis of the HIs extraction for this paper. Hence, the EIS, OCV, temperature, and the incremental capacity-differential voltage (IC-DV) curves are used to establish the HIs for the RUL prediction.
As for the model training, many scholars have made great progress in model establishment and prediction training. The SVR with parameters optimized by NSGA [21] or the artificial bee colony [18] is proposed to achieve accurate RUL prediction considering the small samples, nonlinearity, and time-series characteristics. An ELM-based model under driving conditions is established in [21] for RUL prediction using the features from the discharge voltage curve as the HI, which is adopted to achieve online prediction. In [17], a GBDT-based model is proposed to identify the nonlinear relationship between the lifetime and the various features to accomplish the RUL prediction, which can improve the existing base models. An RF-based model with a Box–Cox transformation is established in [19,22] using the features from partial charging voltage curves to obtain the precise capacity. An XGBoost-based model is established in [23], comparing the battery voltage with the cutoff voltage to achieve the previous overdischarge fault diagnosis. In [24], the LightGBM-based model is proposed to accomplish RUL prediction using the features from the discharge voltage curve, which proves that LightGBM can improve the training speed and reduce the impact of noise on the prediction. However, the single HI has a limited effect on improving prediction accuracy. Hence, the attention of this paper is to utilize multi HIs to improve prediction accuracy.
Meanwhile, multi HIs can improve the prediction accuracy; however, long training time caused by multi HIs may lower training efficiency. For the above problem, although the XGBoost-based model can solve the problems of prediction accuracy and speed, the XGBoost-based model uses the traditional boosting integrated learning method, which needs to traverse the entirety of the training samples many times during prediction and select the best segmentation point, lowering the training efficiency. LightGBM [24] can improve training efficiency. LightGBM reduces the sample and feature dimensions, reduces memory usage, and further improves training efficiency and prediction accuracy through histogram optimization, gradient-based one-side sampling, exclusive feature bundling, and the depth-limited leaf-wise method. Based on the performance merits of LightGBM mentioned in the literature, the LightGBM is used to build an RUL prediction model, which is helpful in improving the efficiency and accuracy of RUL prediction.
The contributions of the proposed method can be summarized as follows:
(1)
To improve prediction accuracy and avoid low training efficiency caused by HIs. This paper proposes a LightGBM-based RUL prediction framework, which derives the multi HIs extraction and an improved RUL prediction model.
(2)
The extracted HIs can be mainly divided into indirect HIs (i.e., resistances from EIS and loss modes from IC-DV curves) and direct HIs (i.e., OCV and temperature). To adapt to multi HIs, the loss function of the LightGBM model is improved by the adaptive loss.
(3)
To obtain the optimal performance, the parameters of the model are optimized by the hyperparameter optimization method. The proposed framework is validated by the database from a battery aging and performance testing experimental system. The performance of the proposed framework under different numbers of HIs is also analyzed.
The rest of this paper is organized as follows: Section 2 introduces the multi health indicators extraction and battery aging and performance testing experimental system. Section 3 establishes the RUL prediction framework based on the improved LightGBM. Section 4 discusses the effectiveness validation and performance evaluation of the proposed RUL prediction framework. Section 5 provides the summary and conclusion.

2. Multi Health Indicators Extraction

2.1. Multi Health Indicators Extraction

2.1.1. HIs Extracted from IC-DV Curves

Based on the electrochemical theory in [27,28], the shift in the IC curve towards lower voltage, identified as a loss of conductivity (LC), indicates collector corrosion or electrolyte decomposition inside the battery. The IC peak variation difference, identified as loss of active material (LAM), indicates possible electrode decomposition, electrolyte oxidation, active particle denaturation, lithium dendrite formation, or disordered crystal structure inside the battery. The shift in the DV curve towards lower capacity, identified as loss of lithium ion (LLI), indicates the possibility of electrolyte oxidation and decomposition or lithium dendrite formation inside the battery. The ith cycle degradation mode quantification is as follows.
L C i ( % ) = max ( V 0 ) max ( V i ) / max ( V 0 )
L A M i ( % ) = max ( d Q d V 0 ) max ( d Q d V i ) / max ( d Q d V 0 )
L L I i ( % ) = max ( Q 0 ) max ( Q i ) / max ( Q 0 )
where LCi, LAMi, and LLIi are quantified degradation modes. V0 and Q0 are initial voltage and capacity, respectively.

2.1.2. HIs Extracted from EIS

According to [29], the EIS shown in Figure 1 consists of four main components: (1) the high-frequency region: a semicircle associated with the diffusive migration of lithium ions through the SEI film on the surface of the active material particles. (2) The mid-high frequency region: a semicircle associated with the transport of electrons inside the active material particles. (3) The mid-frequency region: a semicircle associated with the charge transfer process. (4) The low-frequency region: a diagonal line associated with the solid diffusion process of the lithium ions of the active material particles.
The EIS can be refined into ohmic resistance (Rohm), SEI film resistance (RSEI), charge transfer resistance (Rct), and Warburg resistance (Rw). The Rohm is linear and independent of the current and battery type. Due to the ionic conductivity of the electrolyte, the Rohm is highly dependent on the temperature and varies greatly in the lifetime of the battery. The RSEI is the characterization of the diffusion migration process of the SEI films on the surface of the lithium ion active material particles. The Rct is primarily a reflection of the charge transfer in the solid electrolyte interface layer or the electrode and the electrode/electrolyte interface layer. The Rw reflects the solid diffusion process of the lithium ions of the active material particles. The CPE reflects the characteristics of the non-ideal capacitor.

2.1.3. Other HIs Extracted from OCV and Temperature

The HI extracted from OCV is the isobaric voltage drop time curve, which is the time of the battery voltage drop from 4.2 V to 3.6 V. The voltage drop is the value after 8 min of static state operation. The HI extracted from temperature is the surface average temperature value of the temperature at every cycle. The detailed HIs are shown in Section 4.
The above-mentioned HIs are based on the characteristics analysis of the battery, which is the input of the prediction model (introduced in Section 3). To achieve the accurate RUL prediction, the multi HIs are selected to train the prediction model. For adjustment to the multi HIs, the LightGBM-based prediction model is improved by adaptive loss.

2.2. Experimental Setup

2.2.1. Experimental System

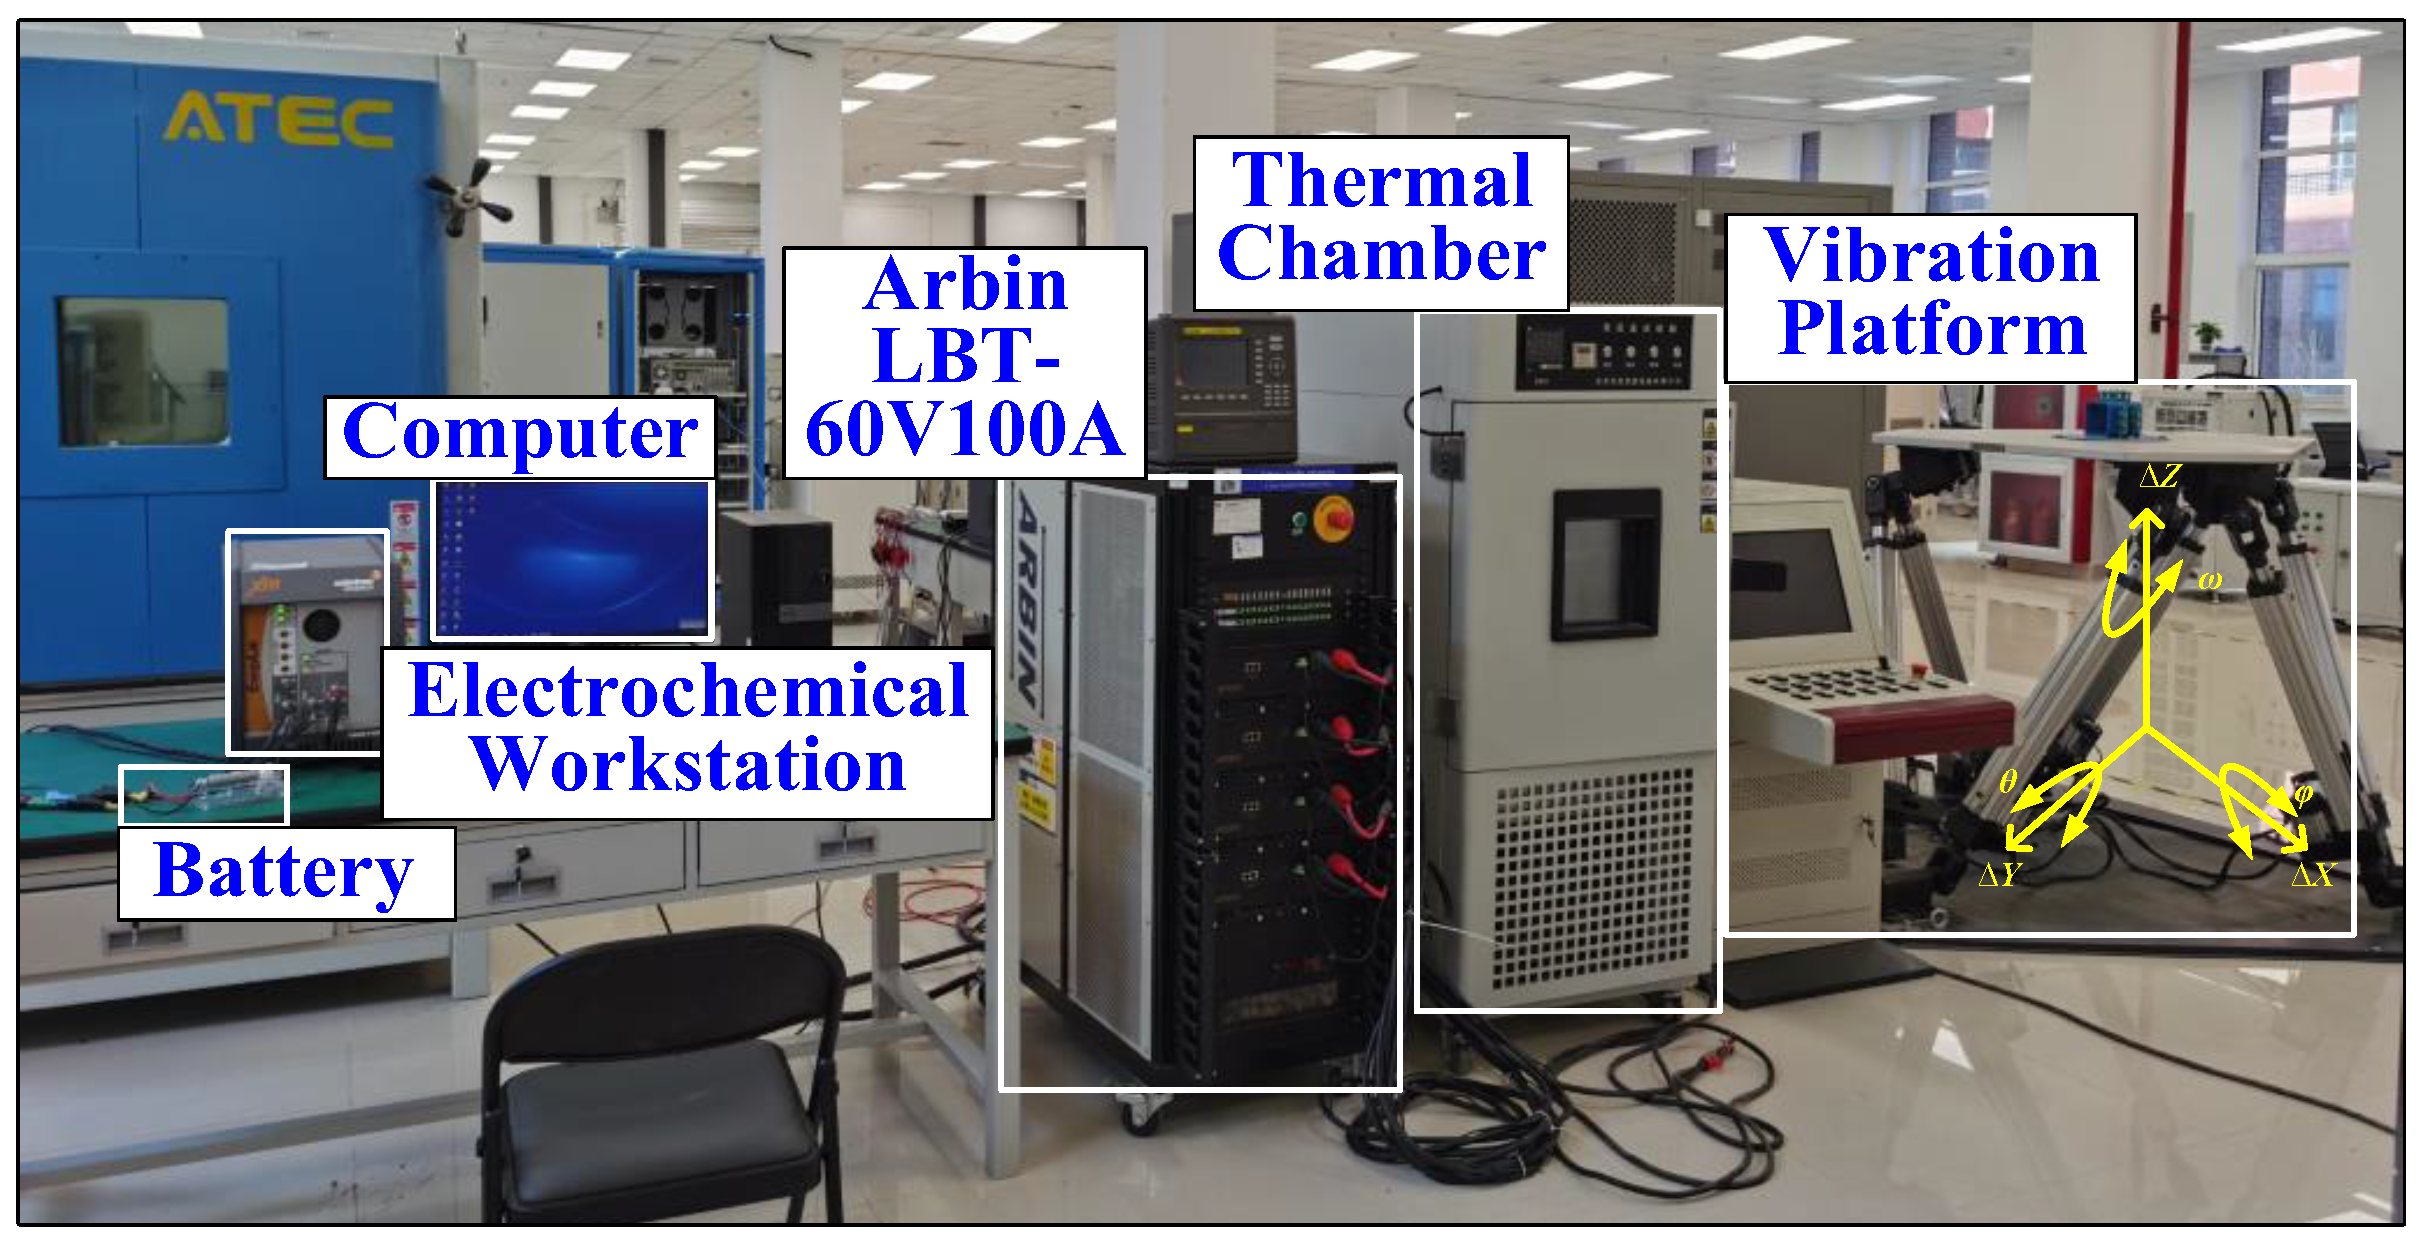
To establish a battery database for features extraction and validation of the proposed framework, the battery aging and testing experiment under vibration stress is carried out, and the IC-DV curves and the EIS are measured; this is based on the battery performance experimental bench, as shown in Figure 2. The selected battery has a 2.4 Ah nominal capacity with the positive electrode of LNCM and the negative electrode of graphite. Its lower/upper cutoff voltages are 3.0 V/4.2 V, as shown in Table 1.

2.2.2. Experimental Profile

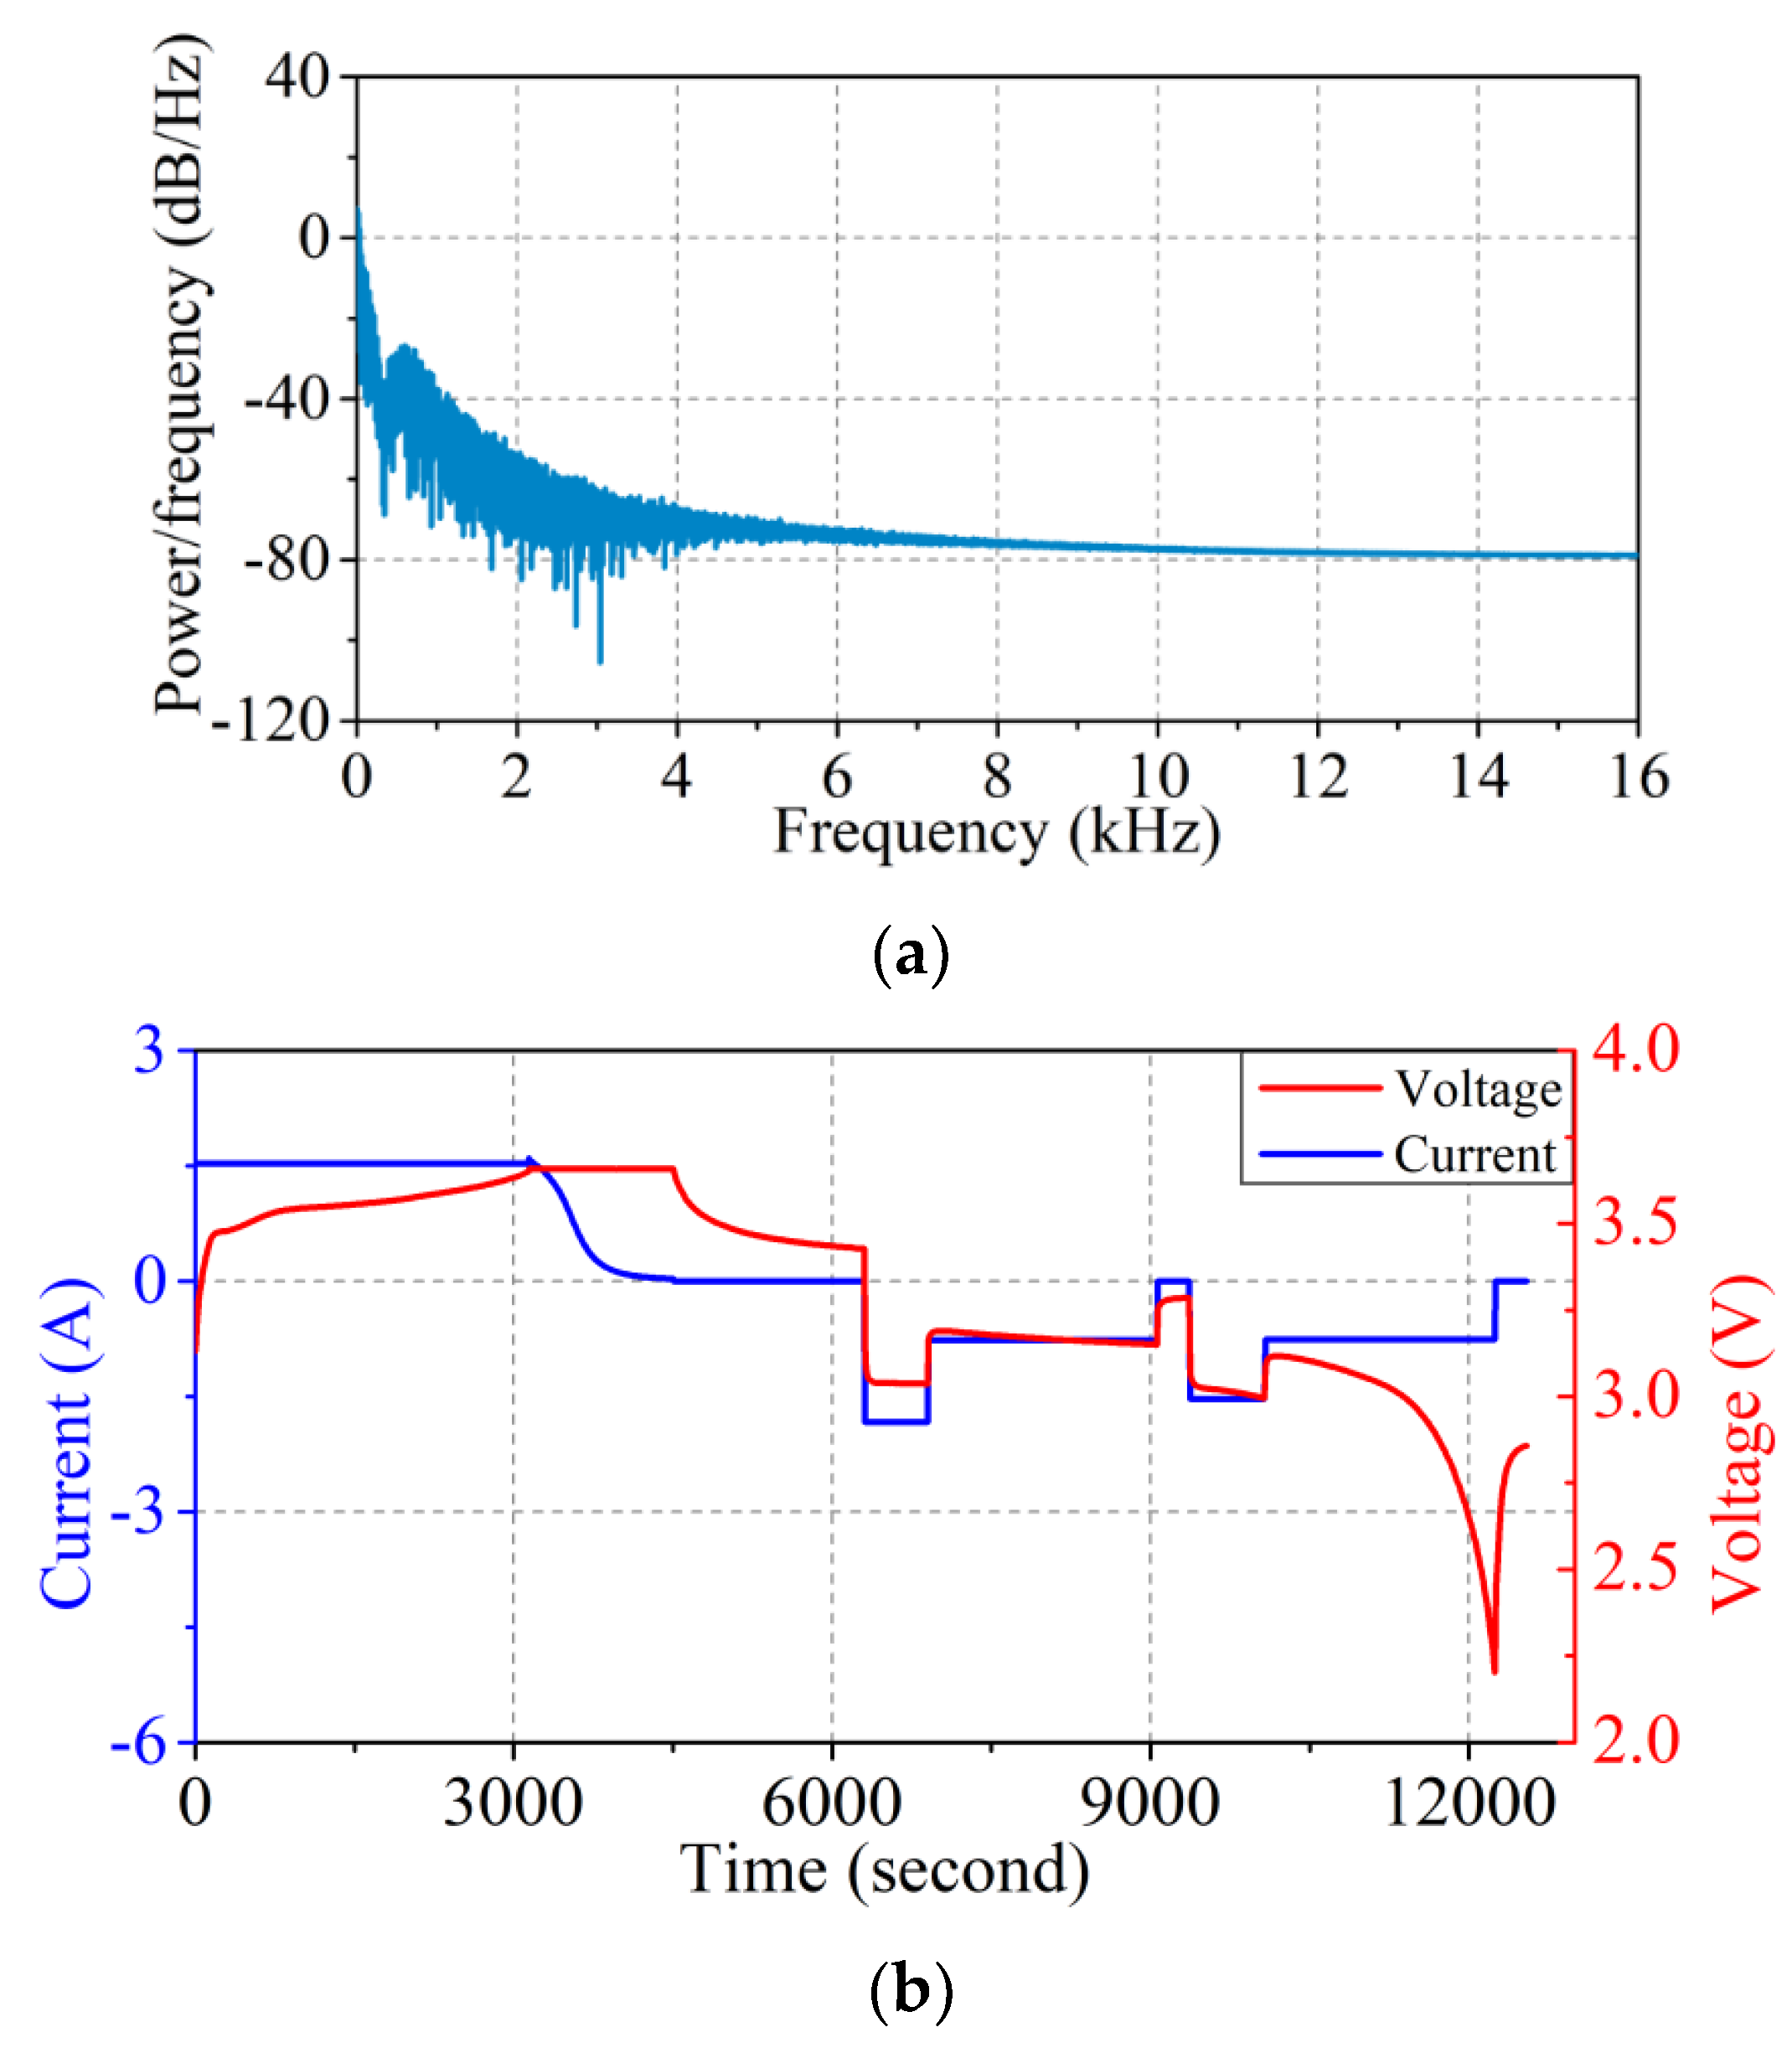
Here, the battery aging and performance testing experimental profiles are designed, including vibration conditions simulation, the cycling test, the capacity test, voltage measurement, surface temperature measurement, the IC-DV curves test, and the EIS test. The Arbin battery charger operates a charge–discharge profile based on the driving conditions illustrated in Figure 3a. The vibration platform simulates the vibration conditions illustrated in Figure 3b. The electrochemical workstation operates the EIS test. According to [30], the EIS test ranges from 0.01 k to 100 kHz. The computer controls the experimental profile and manages the data.
In [31], it is demonstrated that the road vibration on EVs can be equated to a six-degree-of-freedom model, which is widely used to simulate the vibration environment. The international standard ISO8608 illustrates that the power spectral density (PSD) spectrum shown in Table 2 and Figure 3a can reflect road vibration levels [17]. The vibration platform shown in Figure 2 simulates the component force of forward/backward, left/right, up/down, yaw, pitch, and roll as ΔX, ΔY, ΔZ, ω, θ, and ψ. The aging test profile shown in Figure 3b is conducted to simulate the idling, uniform speed, acceleration, and deceleration of real-world driving conditions [28].

3. Improved LightGBM-Based RUL Prediction Framework

3.1. Improved LightGBM

LightGBM is an integrated strong learner HT based on the gradient boosting decision tree (GBDT) as the base learner, which can be expressed as (4). LightGBM has the merits of fast prediction, low memory consumption, and high accuracy [21], which is available for the prediction model.
H T x = t = 1 T H t x , H t Θ
where Ht represents the t th learner, and Θ represents the set of all learners.
For the training dataset {x1, …, xn}, the performance of the learner Ht(x) is reinforced through multiple rounds of iterations. In the previous round of iteration, the learner Ht−1(x) and loss function L(y, Ht−1(x)) were obtained. This round of iteration is to train the weak learner ht−1(x) to minimize the loss function, which can be expressed as (5).
h t x = arg   min   h H L y , H t 1 x + h t x
For fast convergence, the negative gradient of the loss function is used to approximately replace the loss function in the iteration, which can be expressed as (6). In addition, this is also the reason why the first-order derivative of the loss function is required.
r t = L y , H t 1 x H t 1 x
where y is the RUL prediction value.
The root mean square error is an objective function, and the weak learner ht(x) can be expressed as follows.
h t x = arg   min   h H r t h t x 2
The learner in this round of iteration is obtained.
H t x = H t 1 x + h t x
When dealing with multi HIs, the conventional loss functions of the Cauchy loss, L1 norm loss, L2 norm loss, Welsch loss, and Geman–McClure loss [17] make it difficult to achieve adaptive adjustment and alter data characteristics. The loss function of the LightGBM model is improved by adaptive loss, as in (9). The adaptive loss can be expressed as (9), and the first-order derivative of the AR loss can be expressed as (10).
L A R x , α , c = 0.5 x / c 2 α = 2 log x / c 2 + 1 α = 0 1 exp 0.5 x / c 2 α = L x , α , c o t h e r s
f x x , α , c = x / c 2 α = 2 2 x / x 2 + 2 c 2 α = 0 x / c 2 exp 0.5 x / c 2 α = x / c 2 x / c 2 / α 2 + 1 α / 2 1 o t h e r s
where x is residual. a is the hyperparameter, which is used to adjust the different expressions of the loss function; the coordination parameter c is used to adjust the bending scale of the loss function at x = 0, which determines whether the loss function is suitable for the gradient-based prediction method.

3.2. The Proposed RUL Prediction Framework

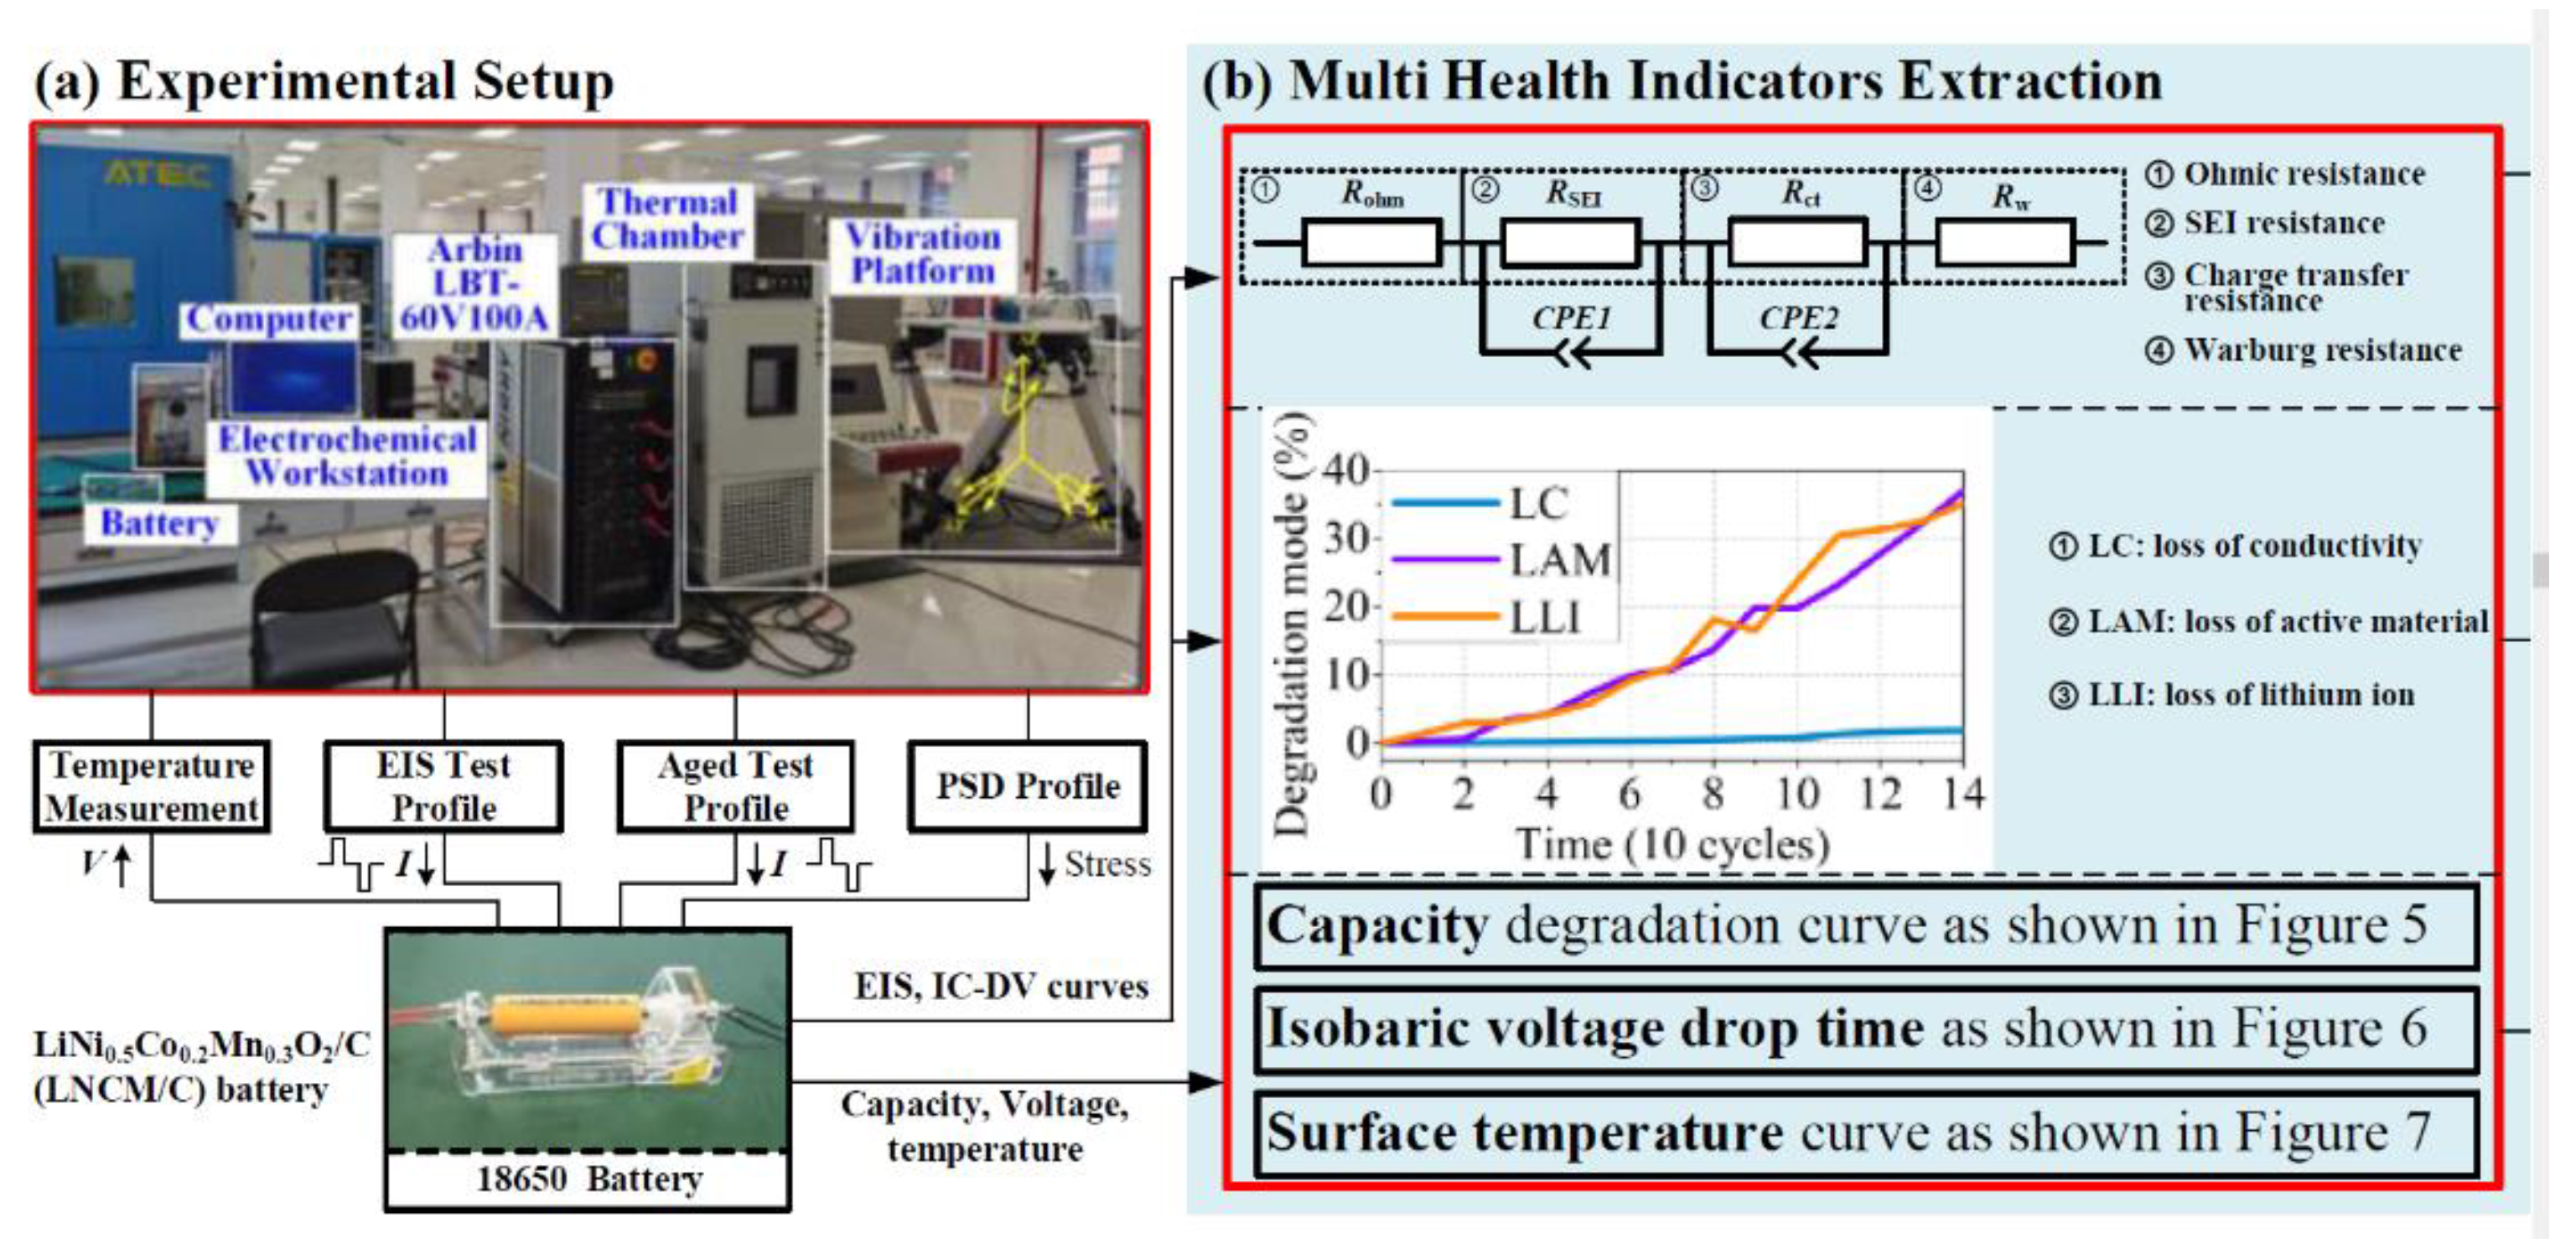
The proposed framework based on the improved LightGBM with Hyperopt (H-iLightGBM) is to learn multi HIs for battery RUL prediction, which is as shown in Figure 4, with the following steps.
Step 1. Experimental system establishment: battery aging and testing experimental profiles are designed, including vibration conditions simulation, the cycling test, the capacity test, voltage measurement, surface temperature measurement, the IC-DV curves test, and the EIS test.
Step 2. Multi Health Indicators extraction: based on electrochemical theory, the IC-DV curves, and the EIS from the battery aging and testing dataset are utilized to extract the loss modes and calculate the resistances. The isobaric voltage drop time and surface temperature are also regarded as HIs. The feature database is adopted to divide the dataset into the training dataset and the testing dataset for the RUL prediction model.
Step 3. Improved LightGBM model training and optimization: to adaptively adjust to multi HIs, the loss function of the LightGBM model is improved by the adaptive loss, expressed as (9) and (10). Based on the multithreaded parallel histogram strategy, each one-dimensional feature (the continuous floating-point datum) is transferred into discrete K ranges to obtain K “bins”. In addition, a histogram with a width of K is constructed, as shown in c) in Figure 3. The K-fold cross-validation is the validation procedure during the process of the prediction model training and the testing process [32]. To obtain an optimal prediction performance, the hyperparameter optimization is used to obtain the optimal parameters of the LightGBM model, and it sets the performance evaluation function (root mean square error, RMSE) as (11), which is used to describe the fitting degree between the real value and the predicted value. Hence, the RMSE is used to estimate the performance of the proposed RUL prediction model [33].
R M S E = 1 n i n y p r e d , i y t r u e . i 2
where ypred,i and ytrue,I are the capacity prediction value and real value at i th cycle, respectively, and n is lifetime cycles.
Step 4. RUL prediction under vibrationstress: the battery lifecycle capacity data under driving conditions are divided into the training set and the test set. The training set is used to train the model and obtain relevant parameters, and the test set is used to verify the effectiveness of the model.

4. Validation and Discussion

4.1. Experimental Results Analysis

4.1.1. IC-DV Curves

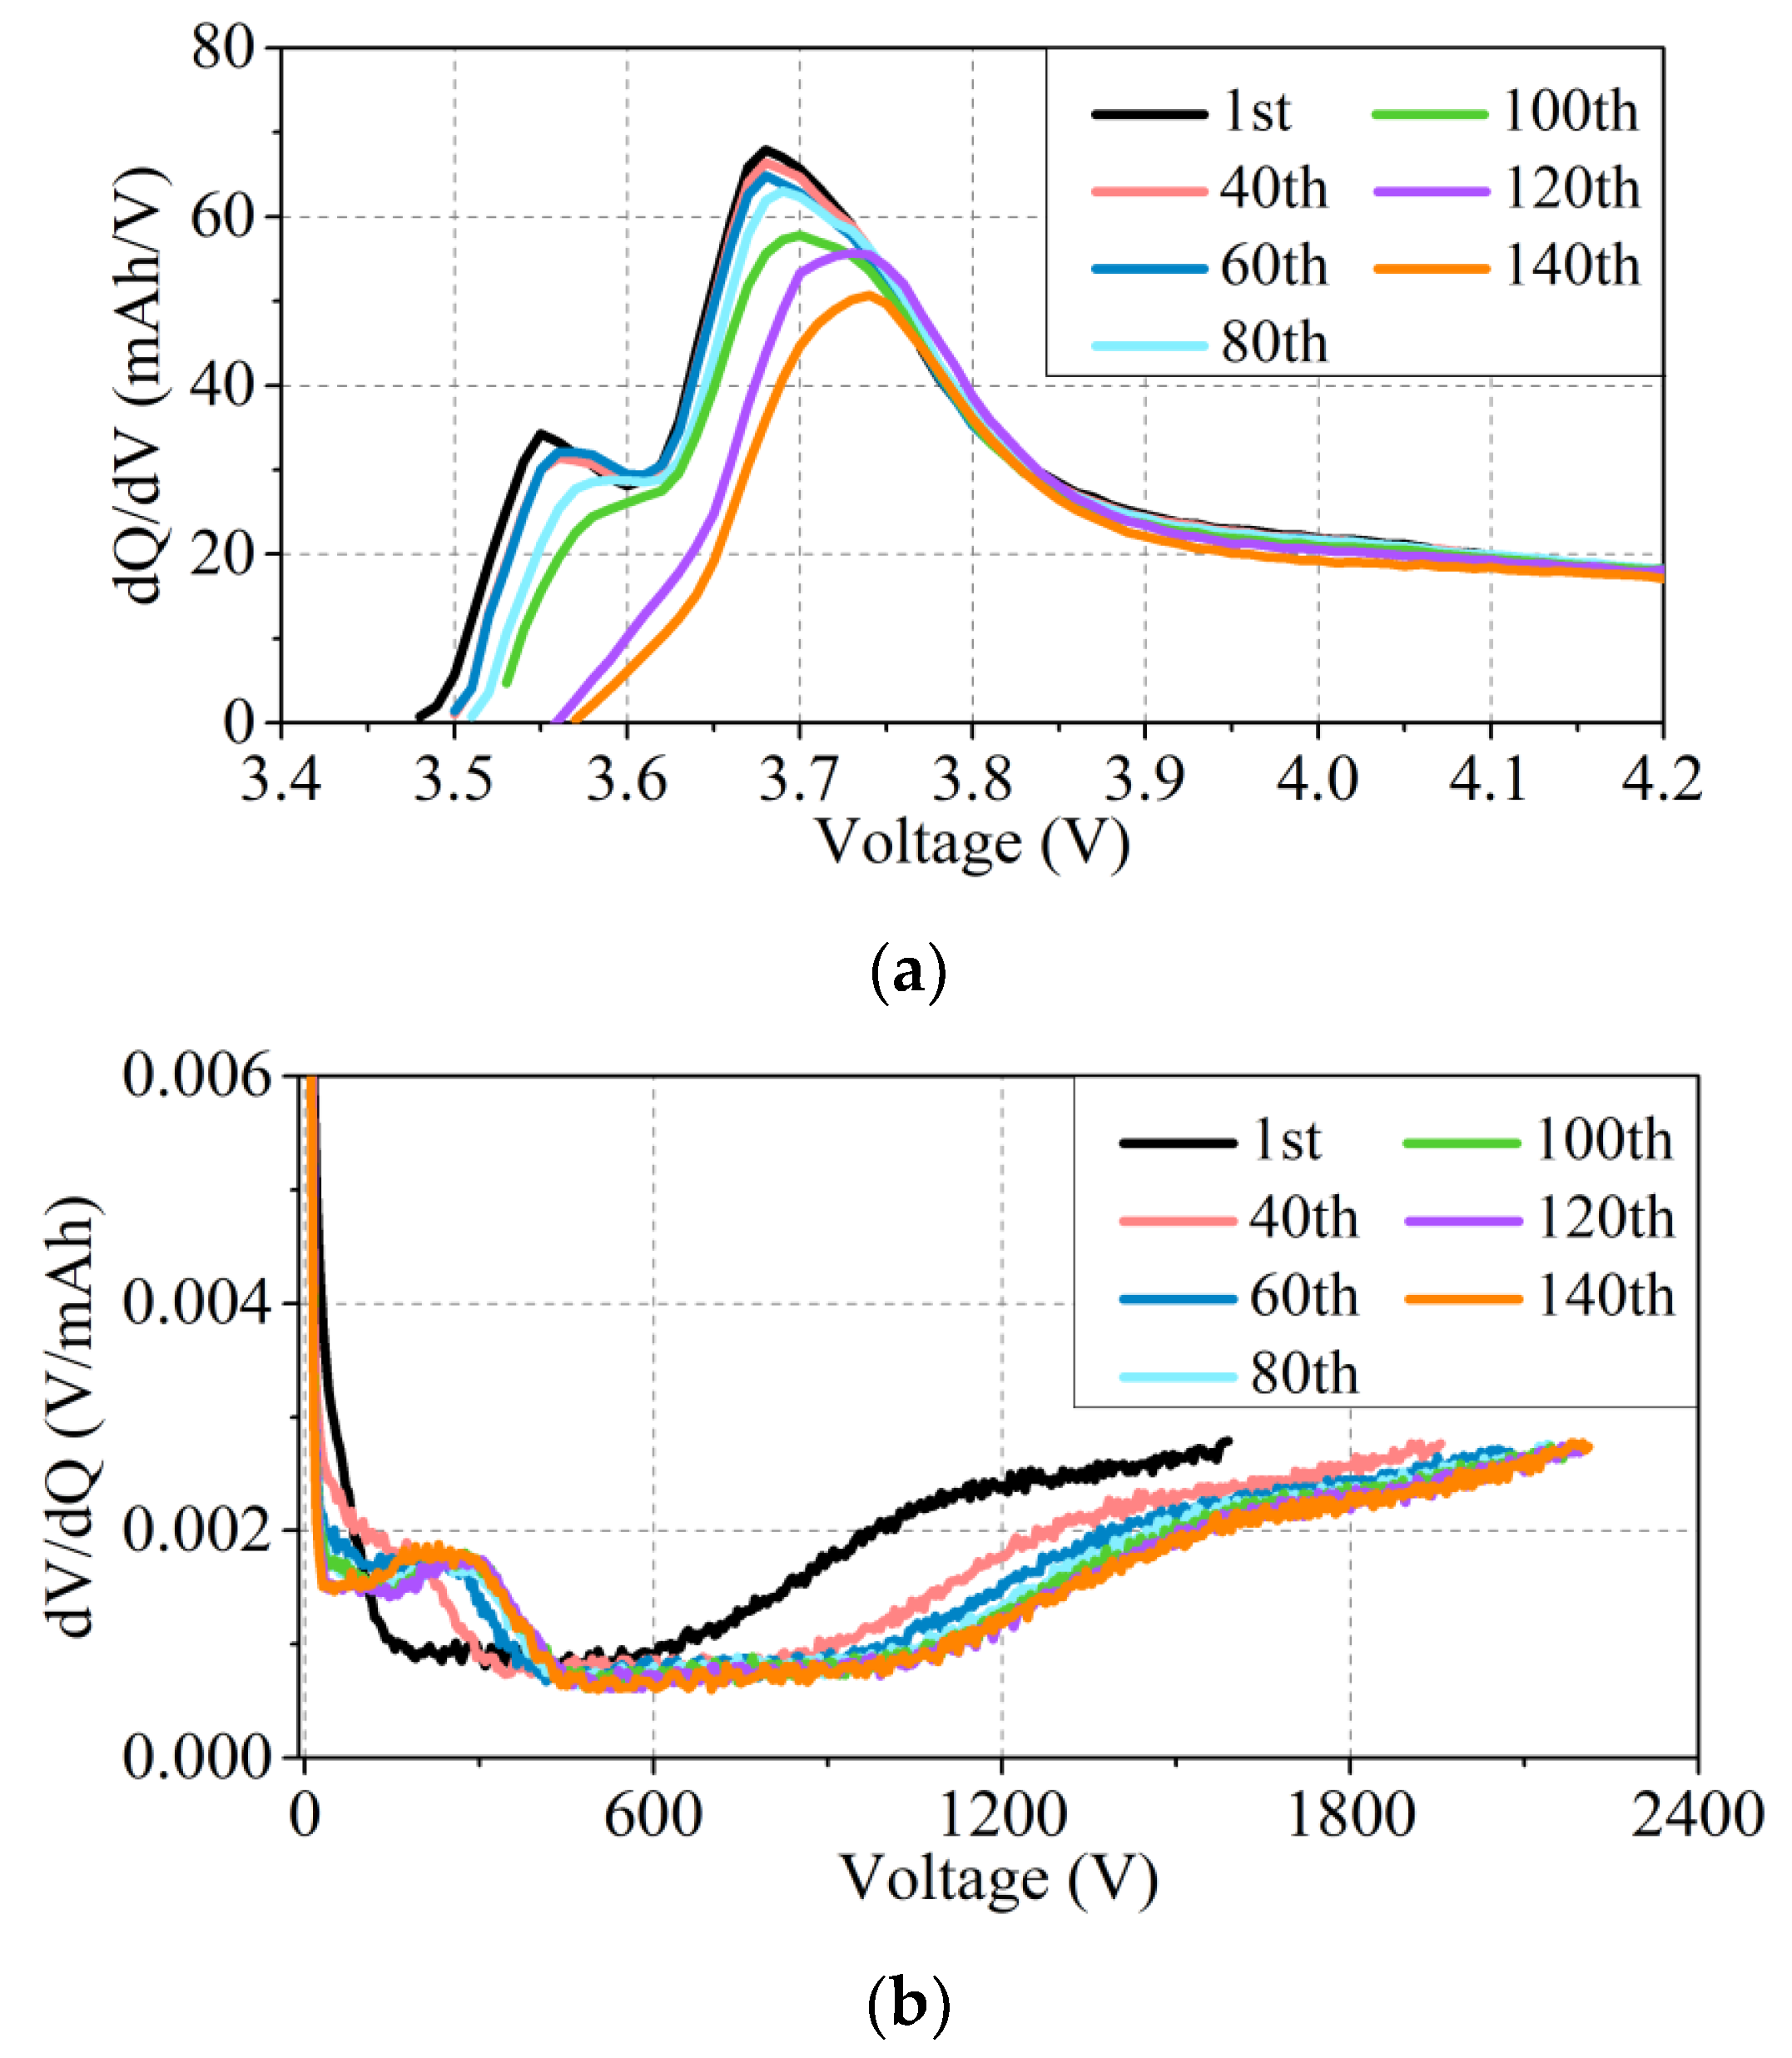
The IC curve and the DV curve have symmetrical shapes. The voltage corresponding to the peak value of the IC curve gradually increases, and the capacity corresponding to the valley value of the DV curve gradually decreases. The peak of the IC curve gradually decreases until it disappears at 3.52 V, which is shown in Figure 5.

4.1.2. Capacity Degradation Curve

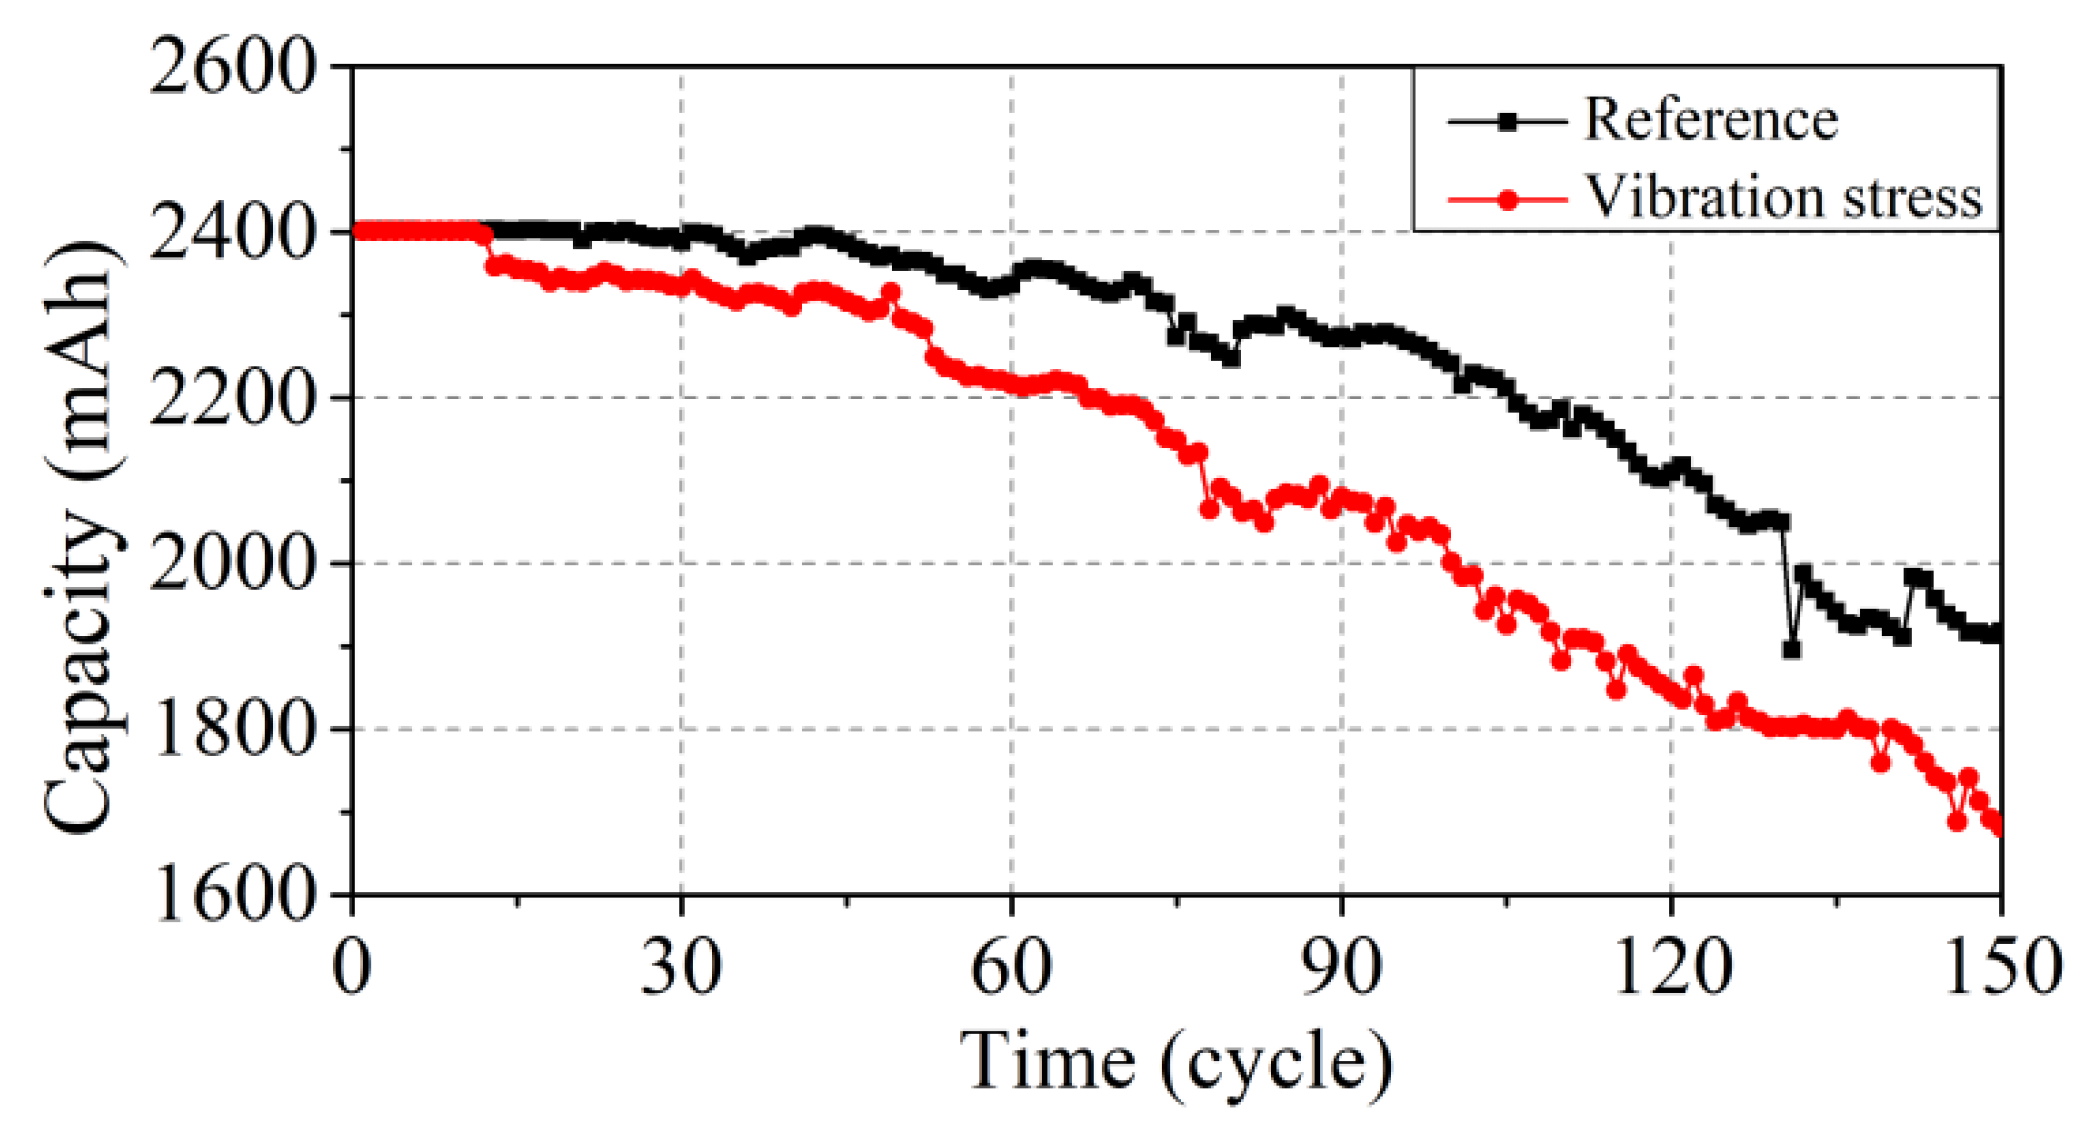
For the lithium-ion battery (LNCM) selected in this paper, during the charge–discharge process, besides the oxidation-reduction reaction caused by the lithium ion deinterlacing, there are also many side reactions, such as electrolyte decomposition, active substance dissolution, metal lithium deposition, etc. These side reactions lead to the degradation of the battery capacity in addition to the oxidation–reduction reaction caused by the lithium ion deintercalation; there are also many side reactions, such as electrolyte decomposition, active material dissolution, metal lithium deposition, etc. These side reactions lead to battery capacity degradation. When the capacity of the battery is up to 80% of the nominal capacity (end of life, EOL) [2], the test is stopped. The battery capacity degradation curve is shown in Figure 6.
Figure 6 shows that the battery capacity in the reference decays to EOL at about 150 cycles, and the battery capacity under vibration stress is about 140 cycles. In the first 50 cycles, there is no obvious difference in capacity decay between these two conditions. At this stage, the main cause of capacity decay may be due to SEI formation. As the number of cycles increases, the chemical reactions inside the battery are intensified, and the degradation modes are complicated by external factors. Hence, there is an increasingly noticeable difference in battery degradation between these two conditions.

4.1.3. Isobaric Voltage Drop Time and Surface Temperature

Figure 7 shows the isobaric voltage drop time curve, which is the time of the battery voltage drop from 4.2 V to 3.6 V. The voltage drop is the value at the interval of an 8 min static state. It can be seen that the isobaric voltage drop time increases and the voltage drop value decreases with the increase in charge–discharge cycles.
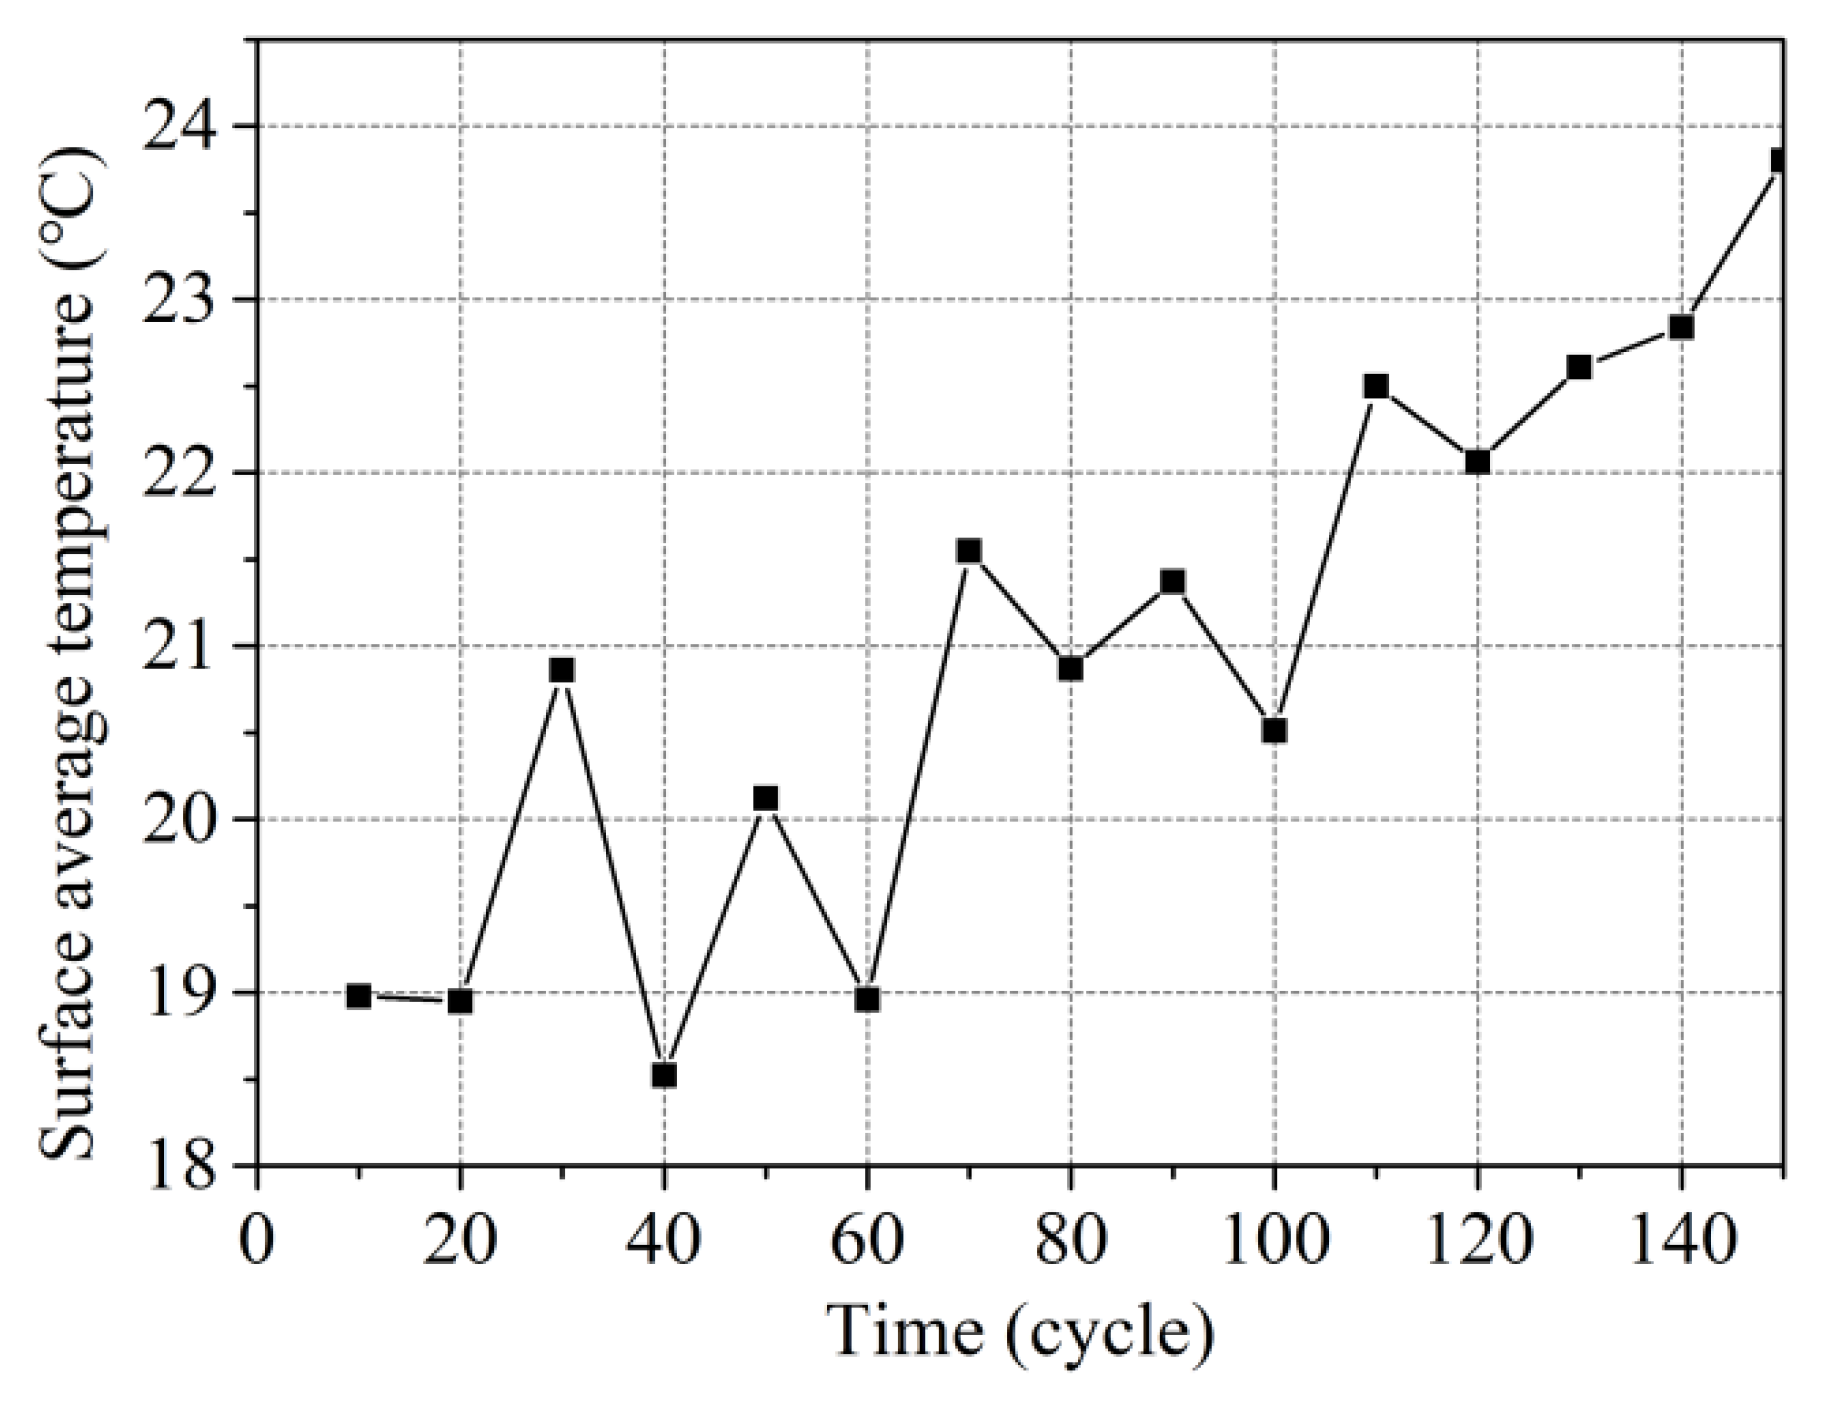
Figure 8 shows the surface average temperature, which is the average value of the temperature at every cycle. It can be seen that the surface temperature increases with the increase in charge–discharge cycles. At the EOL of the battery, the temperature is 5 °C higher than the original temperature.

4.2. Analysis of Health Indicators

4.2.1. Loss Modes

Extracting the loss modes by (1)–(3), as shown in Figure 9, the LCs in the two conditions are 1.63% and 1.90%, respectively. The LAMs are 22.08% and 36.94%, respectively. The LLIs are 27.87% and 35.12%, respectively. The increase in LAM and LLI is much greater than that of the LC. It is considered that LAM and LLI are the two main factors contributing to the RUL degradation [22].

4.2.2. Four Types of Resistances

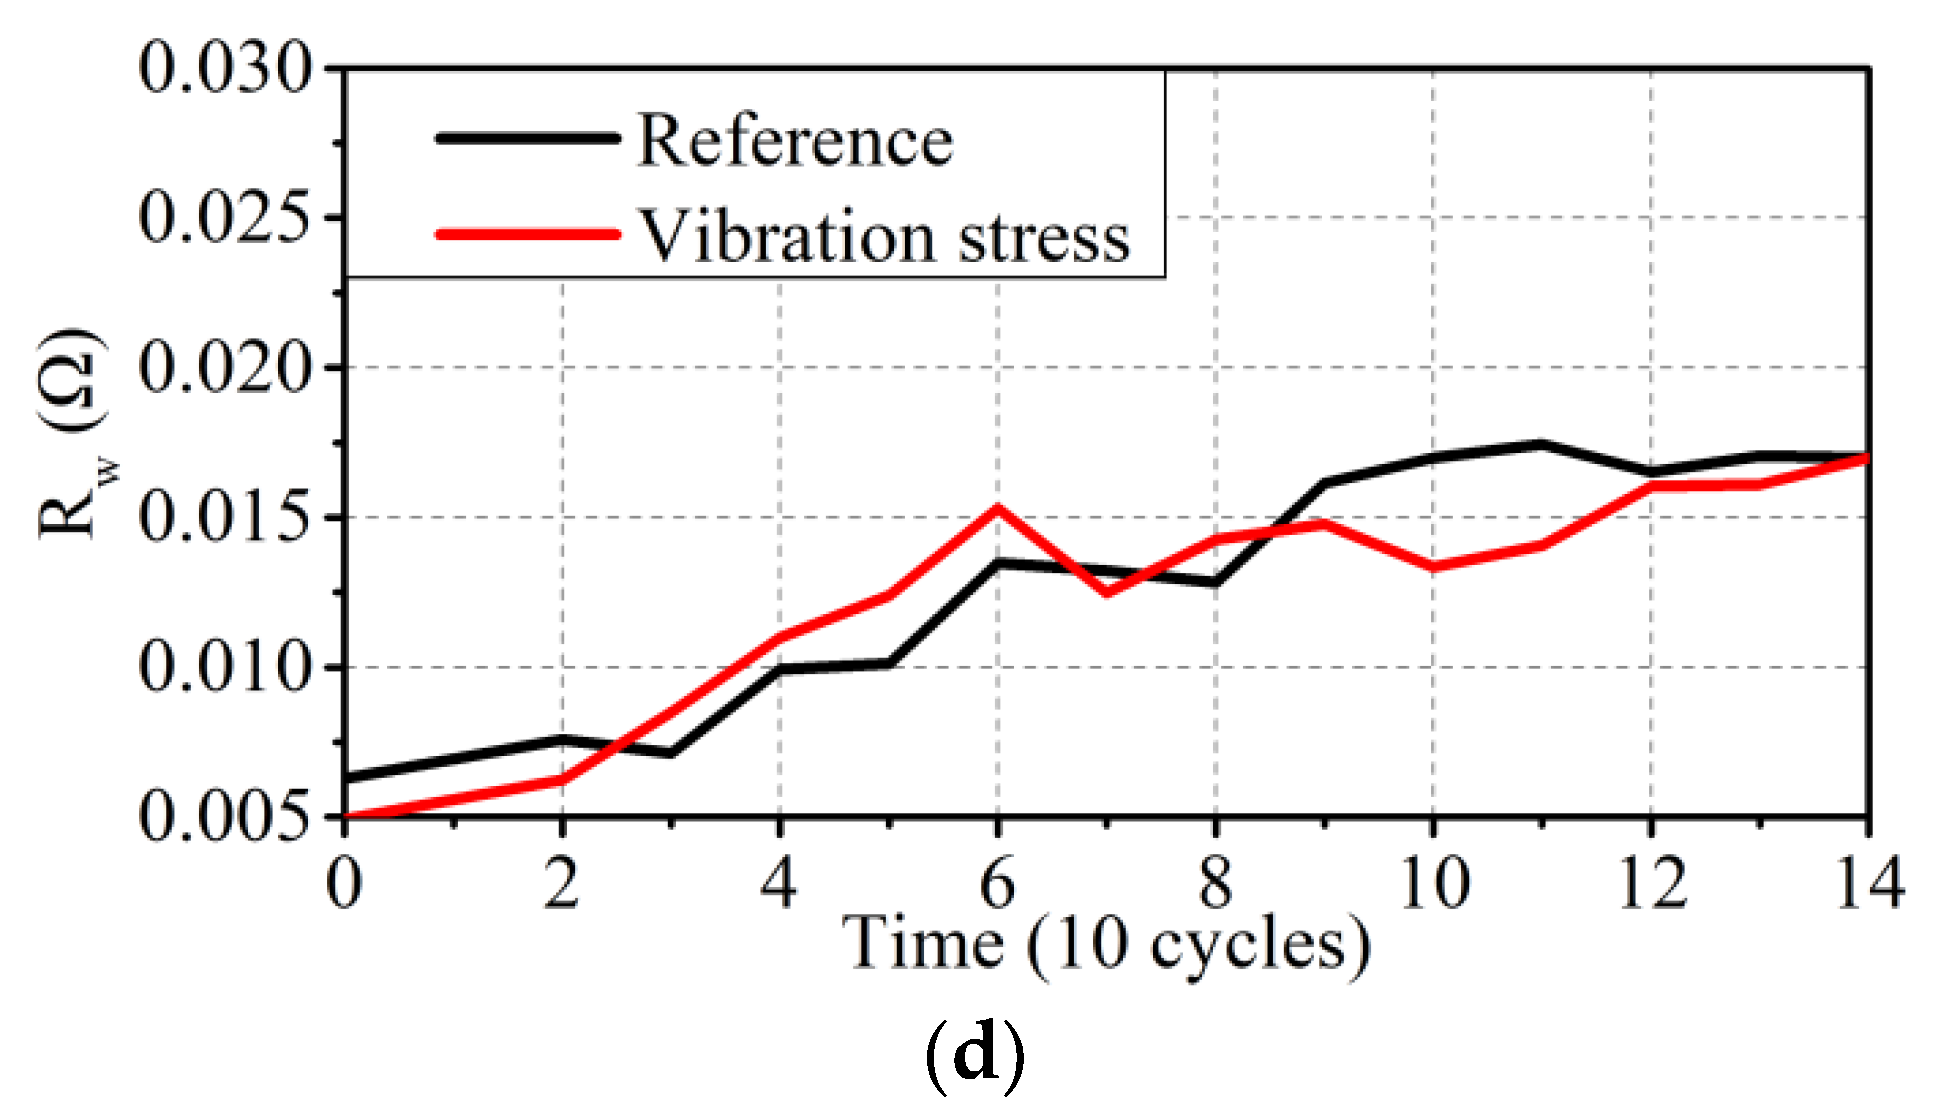
Based on electrochemical theory, Figure 10 shows the ohmic resistance (Rohm), SEI film resistance (RSEI), charge transfer resistance (Rct), and Warburg resistance (Rw) under the vibration stress and static condition, which is obtained through the second-order equivalent model (in Figure 1). The values of Rohm, Rct, and Rw gradually increase with the cycles, and Rct and Rw are the most obvious. There is no regular change in RSEI.

4.3. Validation of the Proposed Framework

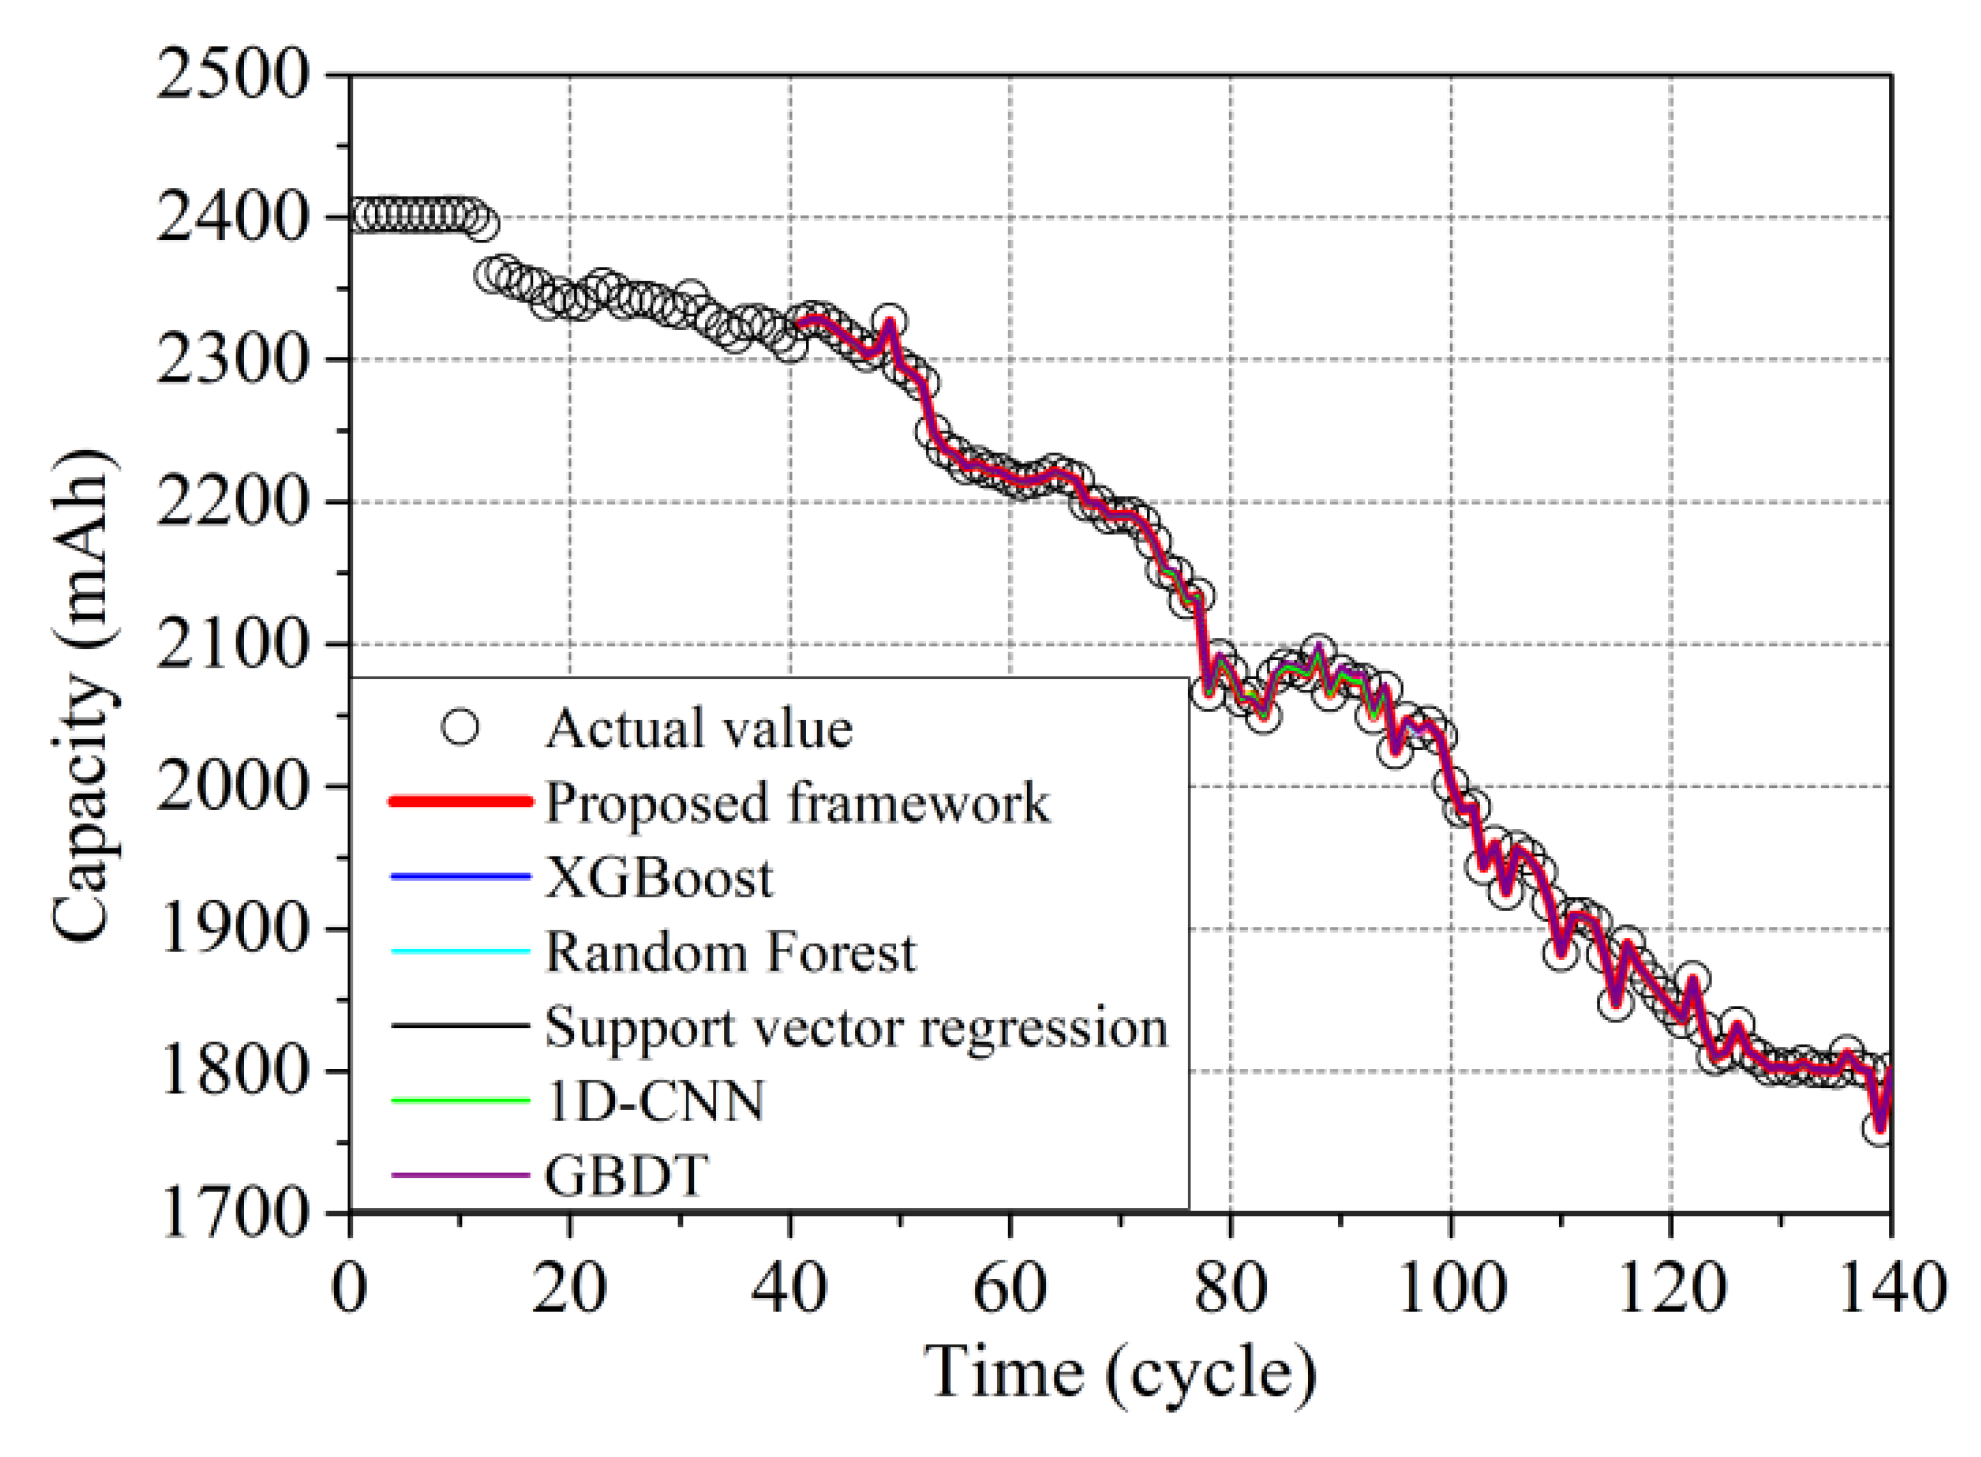
Figure 11 shows the RUL prediction results of the different methods under driving conditions. All the HIs mentioned above are used to validate the prediction performance of the GBDT [15]; the one-dimensional convolutional neural networks (1D-CNN) [18], the SVR [19], the RF [20], the XGBoost [21], and the proposed framework are compared to the RUL prediction under driving conditions. The parameters of those different RUL prediction models are shown in Table 2. The prediction results are shown in Figure 11, and the prediction errors are as follows: the proposed framework is 1.078%, XGBoost is 1.119%, RF is 1.476%, SVR is 1.510%, 1D-CNN is 1.308%, and GBDT is 1.893%, indicating that the proposed framework can achieve accurate RUL prediction under driving conditions. The performances of the different RUL prediction methods are provided in Table 3. It can be seen that the proposed framework has obvious merits of prediction speed and accuracy.
According to Table 4, the proposed framework has obvious merits of prediction speed over the other methods. Considering the heavy model training burden led by multi HIs, the different number of HIs are used for analysis to obtain the optimal number of HIs, which can guarantee both prediction accuracy and speed.
Figure 12 shows the RUL prediction performance of the different methods under different numbers of HIs (ohmic resistance, charge transfer resistance, SEI film resistance, Warburg resistance, LC, LAM, LLI, isobaric voltage drop time, and surface average temperature). It can be seen that the prediction accuracy is improved with the increase in the number of HIs. However, when the number of HIs is three, the prediction accuracy of XGBoost and the proposed framework is higher than that of the condition of the four HIs. It is considered that multi HIs may affect the selection of the split point or overfit to some extent. The proposed framework can achieve the best prediction accuracy (98.978%) under the HIs of resistances, loss modes, and isobaric voltage drop time.

5. Conclusions

An improved light gradient boosting machine (LightGBM)-based RUL prediction framework is proposed, which derives multi HIs extraction and an improved RUL prediction model to improve prediction accuracy and avoid low training efficiency. A series of comparative experiments and data analyses is conducted, and the conclusion can be summarized as follows:
(1) The battery aging and performance testing experimental system is established to extract multi HIs. The extracted HIs are mainly divided into indirect HIs (i.e., resistances from EIS and loss modes from IC-DV curves) and direct HIs (i.e., OCV and temperature). It can be concluded that vibration stress promotes the reactions inside the battery and mainly affects the LLI and LAM. The LC, LAM, and LLI are about 1.90%, 36.94%, and 35.12%, respectively.
(2) The proposed framework is validated by the database from the LNCM/C battery aging and testing experiments under vibration stress. Compared with the traditional RUL prediction methods under the total HIs, GBDT (1.893%, 4.324s), 1D-CNN (1.308%, 47.381s), SVR (1.510%, 80.333s), RF (1.476%, 852.075s), and XGBoost (1.119%, 24.912s), the RMSE and prediction time of the proposed framework are 1.078% and 15.728s, respectively. The results prove the effectiveness and merits of the proposed framework.
(3) The proposed framework can achieve the optimal prediction accuracy (98.978%) under the HI of resistances, loss modes, and isobaric voltage drop times. It can be concluded that the RUL prediction model trained by the appropriate HIs can achieve optimal prediction accuracy.
Considering that different experimental conditions can obtain different HIs, this paper discusses the RUL prediction results under training with different numbers of HIs. The results demonstrate that the proposed framework can realize the accurate and rapid RUL prediction through different HI training, which has proved applicable for different experimental conditions. As the battery RUL prediction is of significance in practice, further work will focus on the development and validation of this framework using some features conveniently obtained in real applications under different external factors.

Author Contributions

Conceptualization, H.L. and Q.X.; methodology, H.L. and Q.X.; software, H.L. and J.M.; validation, H.L. and J.M.; formal analysis, Y.J. and J.M.; investigation, Y.M. and H.J.; resources, H.L.; data duration, Y.J.; writing—original draft preparation, H.L.; writing—review and editing, H.L.; visualization, Q.X.; supervision, R.T.; project administration, H.J. and T.Z.; funding acquisition, Q.X. and T.Z. All authors have read and agreed to the published version of the manuscript.

Funding

This work was supported by the National Natural Science Foundation of China (No. 52107121), Seed Foundation of Tianjin University (No. 220675) and the joint project of NSFC of China and EPSRC of UK (No. 52061635103 and EP/T021969/1).

Institutional Review Board Statement

Not applicable.

Data Availability Statement

Not applicable.

Conflicts of Interest

The authors declare no conflict of interest.

Abbreviations

TermsAbbreviations
Electric vehicleEV
Remaining useful lifeRUL
Light gradient boosting machineLightGBM
Electrochemical impedance spectroscopyEIS
Incremental capacity-differential voltageIC-DV
Health indicatorHI
State of healthSOH
State of chargeSOC
Open circuit voltageOCV
Loss of conductivityLC
Loss of active materialLAM
Loss of lithium ionLLI
Gradient boosting decision treeGBDT
One-dimensional convolutional neural networks1D-CNN
Support vector regressionSVR
Random forestRF
Extreme gradient boostingXGBoost
End of lifeEOL

References

  1. Hu, X.; Liu, W.; Lin, X.; Xie, Y.; Foley, A.; Hu, L. A control-oriented electrothermal model for pouch-type electric vehicle batteries. IEEE Trans. Power Electron. 2021, 5, 5530–5544. [Google Scholar] [CrossRef]
  2. Nurdiawati, A.; Agrawal, T.K. Creating a circular EV battery value chain: End-of-life strategies and future perspective. Resour. Conser. Recycl. 2022, 185, 106484. [Google Scholar] [CrossRef]
  3. Meng, J.; Store, D.; Ricco, M.; Luo, G.; Teodorescu, R. A simplified model-based state-of-charge estimation approach for lithium-ion battery with dynamic linear model. IEEE Trans. Ind. Electron. 2019, 66, 7717–7727. [Google Scholar] [CrossRef]
  4. Sulzer, V.; Mohtat, P.; Aitio, A.; LEE, S.; Yeh, Y.T.; Steinbacher, F.; Khan, M.U.; Lee, J.W.; Siegel, J.B.; Stefanopoulou, A.J.; et al. The challenge and opportunity of battery lifetime prediction from field data. Joule 2021, 5, 1934–1955. [Google Scholar] [CrossRef]
  5. Qiu, Y.; Sun, J.; Shang, Y.; Wang, D. A fault diagnosis and prognosis method for lithium-ion batteries based on a nonlinear autoregressive exogenous neural network and boxplot. Symmetry 2021, 13, 1714. [Google Scholar] [CrossRef]
  6. Lu, L.; Han, X.; Li, J.; Hua, J.; Ouyang, M. A review on the key issues for lithium-ion battery management in electric vehicles. J. Power Sources 2013, 226, 272–288. [Google Scholar] [CrossRef]
  7. Hu, J.; Sun, Q.; Ye, Z.; Zhou, Q. Joint modeling of degradation and lifetime data for RUL prediction of deteriorating products. IEEE Trans. Ind. Inform. 2021, 7, 4521–4531. [Google Scholar] [CrossRef]
  8. Sadabadi, K.K.; Jin, X.; Rizzoni, G. Prediction of remaining useful life for a composite electrode lithium ion battery cell using an electrochemical model to estimate the state of health. J. Power Sources 2021, 481, 228861. [Google Scholar] [CrossRef]
  9. Wang, Q.; He, Y.; Shen, J.; Hu, S.; Ma, Z. State of charge-dependent polynomial equivalent circuit modeling for electrochemical impedance spectroscopy of lithium-ion batteries. IEEE Trans. Power Electron. 2018, 33, 8449–8460. [Google Scholar] [CrossRef]
  10. Zhang, Y.; Tang, Q.; Zhang, Y.; Wang, J.; Stimming, U.; Lee, A.A. Identifying degradation patterns of lithium ion bat-teries from impedance spectroscopy using machine learning. Nat. Commun. 2020, 11, 1706. [Google Scholar] [CrossRef]
  11. Feng, H.; Song, D. A health indicator extraction based on surface temperature for lithium-ion batteries remaining useful life prediction. J. Energy Storage 2021, 34, 102118. [Google Scholar] [CrossRef]
  12. Bai, L.; Cui, L.; Zhang, Z.; Xu, L.; Wang, Y.; Hancock, E.R. Entropic dynamic time warping kernels for co-evolving financial time series analysis. IEEE Trans. Neural Netw. Learn. Syst. 2020, 1–15. [Google Scholar] [CrossRef]
  13. Xu, L.; Hu, X.; Zhang, Y.; Yi, J.; Yu, Y.; Xiao, X.; Yu, Y. A highly sensitive and precise temperature sensor based on optoelectronic oscillator. Optics Commun. 2021, 483, 126625. [Google Scholar] [CrossRef]
  14. Li, W.; Jiao, Z.; Xiao, Q.; Meng, J.; Mu, Y.; Jia, H.; Teodorescu, R.; Blaabjerg, F. A study on performance characterization considering six- degree-of-freedom vibration stress and aging stress for electric vehicle battery under driving conditions. IEEE Access 2019, 7, 112180–112190. [Google Scholar] [CrossRef]
  15. Adam, S.A.; Jalil, N.A.A.; Rezali, K.A.M.; Ng, Y.G. The effect of posture and vibration magnitude on the vertical vibration transmissibility of tractor suspension system. Int. J. Ind. Ergonom. 2020, 80, 103014. [Google Scholar] [CrossRef]
  16. Hu, X.; Xu, L.; Lin, X.; Pccht, M. Battery lifetime prognostics. Joule 2020, 4, 310–346. [Google Scholar] [CrossRef]
  17. Wang, L.; Zhou, D.; Zhang, H.; Zhang, W.; Chen, J. Application of relative entropy and gradient boosting decision tree to fault prognosis in electronic circuits. Symmetry 2018, 10, 495. [Google Scholar] [CrossRef]
  18. Meng, J.; Cai, L.; Stroe, D.; Huang, X.; Peng, J.; Liu, T.; Teodorescu, R. An automatic weak learner formulation for lithium-ion battery state of health estimation. IEEE Trans. Ind. Electron. 2022, 3, 2659–2668. [Google Scholar] [CrossRef]
  19. Wang, Y.; Ni, Y.; Lu, S.; Wang, J.; Zhang, X. Remaining useful life prediction of lithium-ion batteries using support vector regression optimized by artificial bee colony. IEEE Trans. Veh. Technol. 2019, 10, 9543–9553. [Google Scholar] [CrossRef]
  20. Zhang, Y.; Xiong, R.; He, H.; Pecht, M.G. Lithium-ion battery remaining useful life prediction with Box-Cox transformation and monte carlo simulation. IEEE Trans. Ind. Electron. 2018, 2, 1585–1597. [Google Scholar] [CrossRef]
  21. Li, W.; Jiao, Z.; Du, L.; Fan, W.; Zhu, Y. An indirect RUL prognosis for lithium-ion battery under vibration stress using Elman neural network. Int. J. Hydrogen Energy 2019, 44, 12270–12276. [Google Scholar] [CrossRef]
  22. Yang, F.; Wang, D.; Xu, F.; Huang, Z.; Tsui, K.L. Lifespan prediction of lithium-ion batteries based on various extracted features and gradient boosting regression tree model. J. Power Sources 2020, 476, 228654. [Google Scholar] [CrossRef]
  23. Liu, W.; Xu, Y. Data-driven online health estimation of Li-ion batteries using a novel energy-based health indicator. IEEE Trans. Energy Convers. 2020, 35, 1715–1718. [Google Scholar] [CrossRef]
  24. Xiao, Q.; Jiao, Z.; Mu, Y.; Lu, W.; Jia, H. LightGBM based remaining useful life prediction of electric vehicle lithium-ion battery under driving conditions. Trans. China Electrotech. Soc. 2021, 36, 5176–5185. [Google Scholar] [CrossRef]
  25. Ansari, S.; Ayob, A.; Hossain Lipu, M.S.; Hussain, A.; Saad, M.H.M. Multi-channel profile based artificial neural network approach for remaining useful life prediction of electric vehicle lithium-ion batteries. Energies 2021, 14, 7521. [Google Scholar] [CrossRef]
  26. Wang, J.; Liu, S.; Wang, S.; Liu, Q.; Liu, H.; Zhou, H.; Tang, J. Multiple indicators-based health diagnostics and prognostics for energy storage technologies using fuzzy comprehensive evaluation and improved multivariate grey model. IEEE Trans. Power Electron. 2021, 36, 12309–12320. [Google Scholar] [CrossRef]
  27. Fernandez, C.P.; Uddin, K.; Chouchelamane, G.H.; Widanage, W.D.; Marco, J. A comparison between electrochemical impedance spectroscopy and incremental capacity-differential voltage as Li-ion diagnostic techniques to identify and quantify the effects of degradation modes within battery management systems. J. Power Sources 2017, 360, 301–318. [Google Scholar] [CrossRef]
  28. Qin, T.; Zeng, S.; Guo, J.; Skaf, Z. State of health estimation of Li-ion batteries with regeneration phenomena: A similar rest time-based prognostic framework. Symmetry 2017, 9, 4. [Google Scholar] [CrossRef]
  29. Jin, S.; Sui, X.; Huang, X.; Wang, S.; Teodorescu, R.; Stroe, D.-I. Overview of machine learning methods for lithium-ion battery remaining useful lifetime prediction. Electronics 2021, 10, 3126. [Google Scholar] [CrossRef]
  30. Chen, J.; Ren, D.; Hsu, H.; Wang, L.; He, X.; Zhang, C.; Feng, X.; Ouyang, M. Investigating the thermal runaway features of lithium-ion batteries using a thermal resistance network model. Appl. Energy 2021, 295, 117038. [Google Scholar] [CrossRef]
  31. Berg, P.; Spielbaauer, M.; Tillinger, M.; Merkel, M.; Jossen, A. Durability of lithium-ion 18650 cells under random vibration load with respect to the inner cell design. J. Energy Storage 2020, 31, 101499. [Google Scholar] [CrossRef]
  32. Braganca, H.; Colonna, J.G.; Oliveira, H.A.B.F.; Souto, E. How validation methodology influences human activity recognition mobile systems. Sensors 2022, 22, 2360. [Google Scholar] [CrossRef] [PubMed]
  33. Bhavsar, K.; Vakharia, V.; Chauddhari, R.; Vora, J.; Pimenov, D.Y.; Giasin, K. A comparative study to predict bearing degradation using discrete wavelet transform (DWT), tabular generative adversarial networks (TGAN) and machine learning models. Machines 2022, 10, 176. [Google Scholar] [CrossRef]
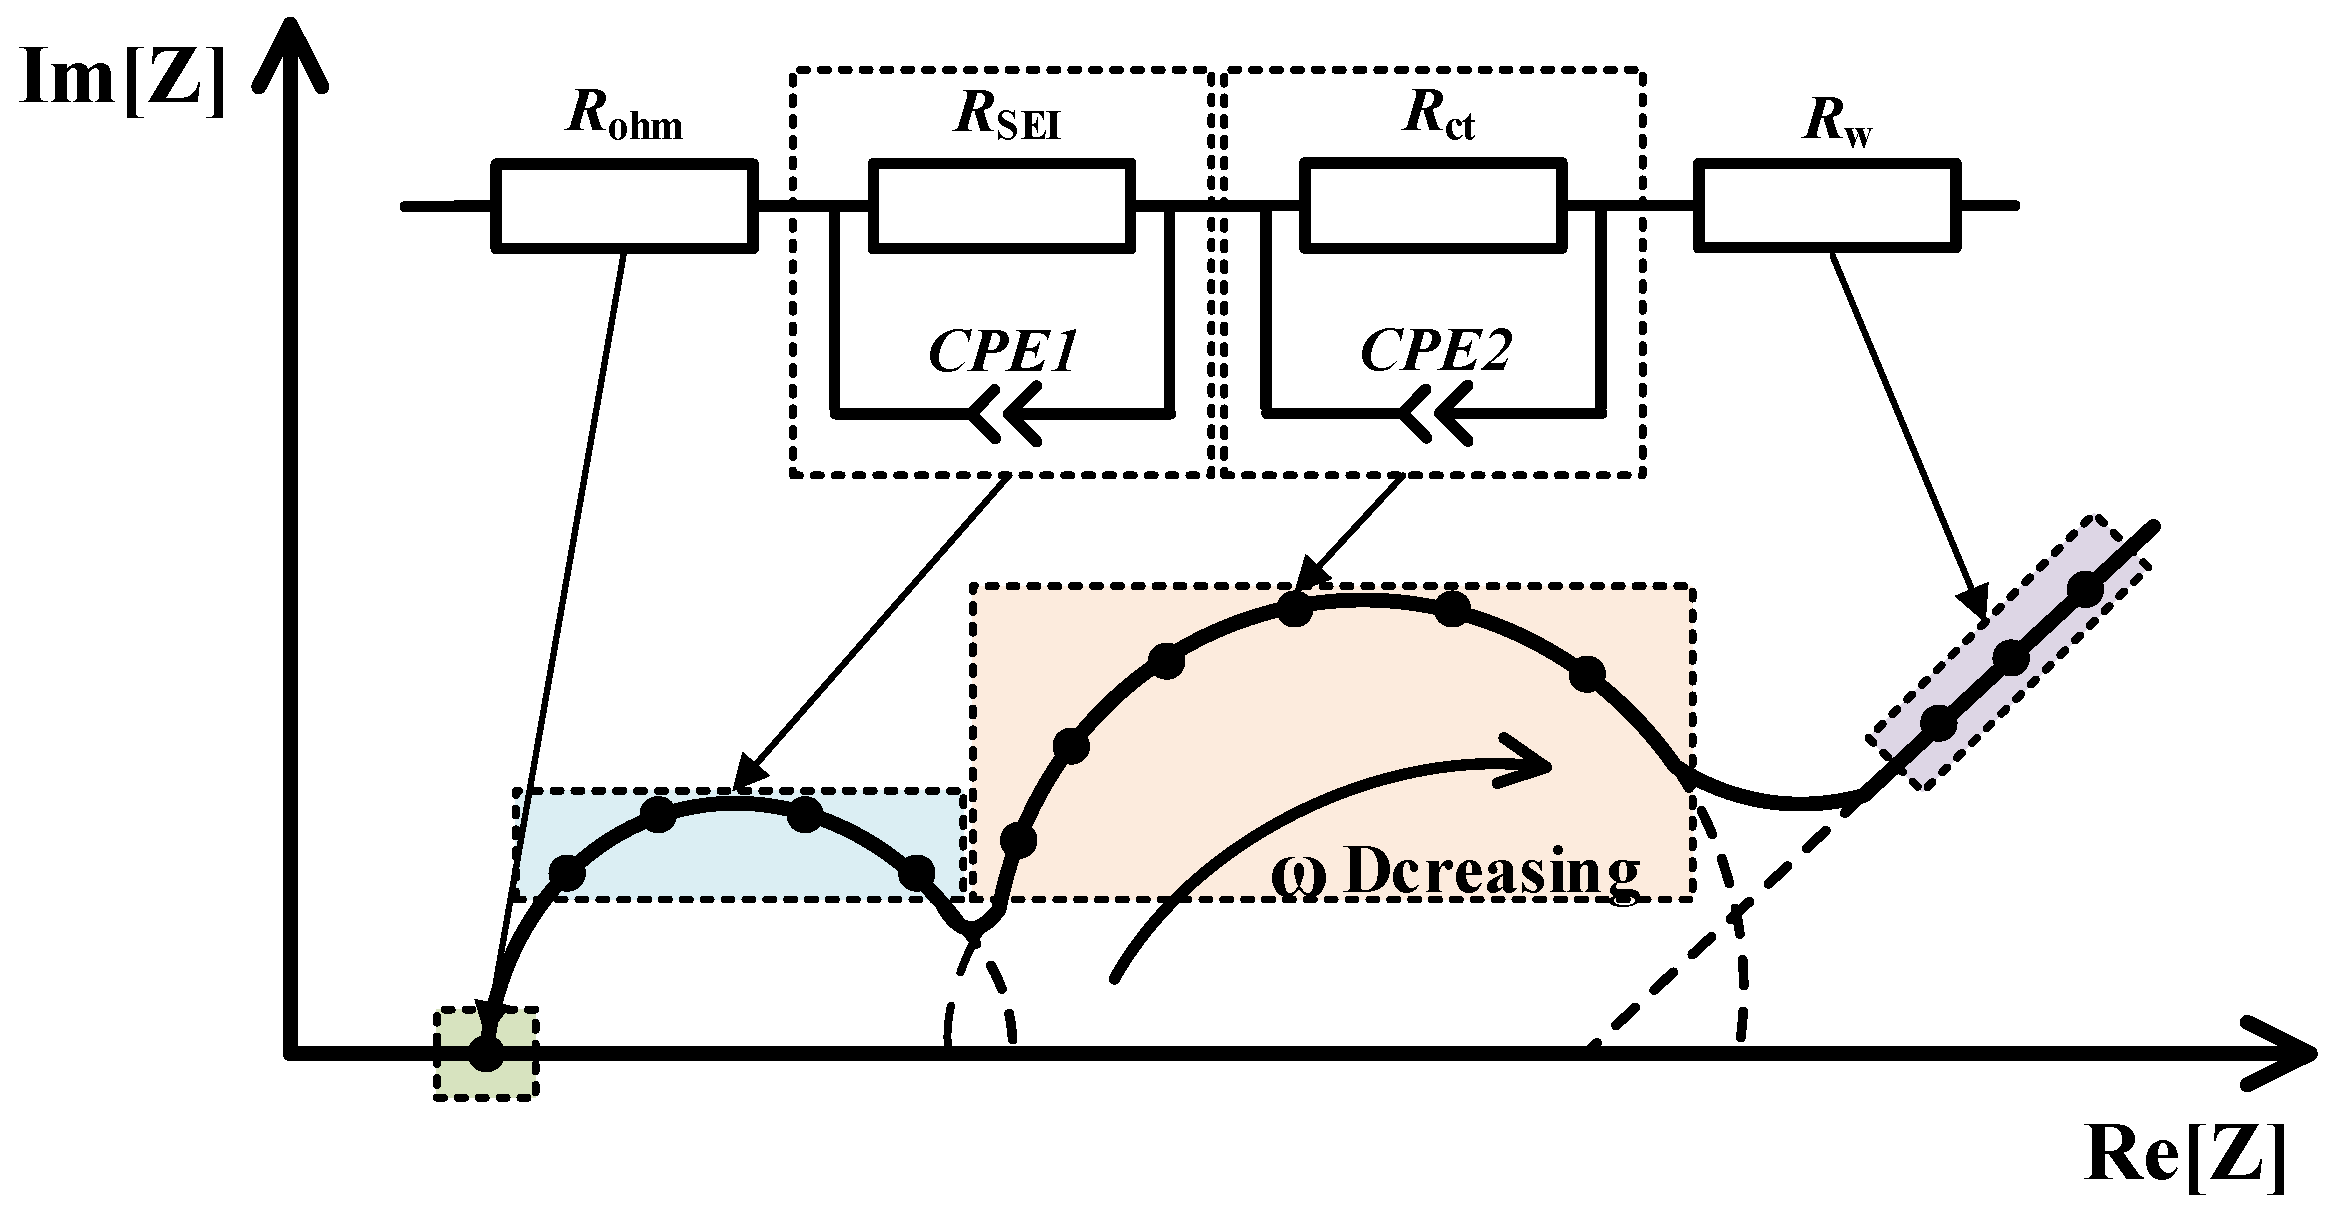
Figure 1. Schematic of electrochemical impedance spectroscopy.
Symmetry 14 01584 g001
Figure 2. Battery aging and performance testing experimental system.
Symmetry 14 01584 g002
Figure 3. Experimental profiles. (a) PSD profile. (b) Aging test profile.
Symmetry 14 01584 g003
Figure 4. Improved LightGBM-based framework for RUL prediction under driving conditions.
Symmetry 14 01584 g004
Figure 5. IC-DV curves. (a) IC curve. (b) DV curve.
Symmetry 14 01584 g005
Figure 6. Capacity degradation curves.
Symmetry 14 01584 g006
Figure 7. Isobaric voltage drop time.
Symmetry 14 01584 g007
Figure 8. Surface average temperature.
Symmetry 14 01584 g008
Figure 9. Quantified degradation modes in four cases.
Symmetry 14 01584 g009
Figure 10. Four resistances extracted from EIS. (a) Ohmic resistance. (b) SEI resistance. (c) Charge transfer resistance. (d) Warburg resistance.
Symmetry 14 01584 g010aSymmetry 14 01584 g010b
Figure 11. The RUL prediction results of different methods under driving conditions.
Symmetry 14 01584 g011
Figure 12. The RUL prediction performance under different number of HIs.
Symmetry 14 01584 g012
Table 1. Nominal specifications of lithium-ion battery.
SpecificationsParameters
Positive electrodeLiNi0.5Co0.2Mn0.3O2
Negative electrodeGraphite
Nominal capacity2.4 Ah
Lower/upper cutoff voltage3.0 V/4.2 V
Table 2. Vibration target spectrum parameters of lithium-ion battery.
ParametersValue
Acceleration effective value0.238031 g
Speed effective value8.684691 cm/s
Displacement effective value4.253971 mm
Acceleration peak value0.714093 g
Speed peak value26.0541 cm/s
Displacement peak value25.5238 mm
Table 3. Parameters of different RUL prediction models.
ParametersValue
The proposed method‘bagging_fraction’: 0.56, ‘num_threads’: 2
XGBoost‘feature_fraction’: 0.112, ‘max_depth’: 18,
GBDT‘lambda_l1′: 0.0001, ‘lambda_l2′: 0.0511
RF‘learning_rate’: 0.0511, ‘num_leaves’: 46
SVR‘min_data_in_leaf’: 34, ‘num_trees’: 588
1D-CINN‘min_sum_hessian_in_leaf’: 0.0511
The proposed method‘alpha’: 0.0512, ‘learning_rate’: 0.0510
XGBoost‘min_child_weight’: 4, ‘n_estimators’: 550
GBDT‘max_depth’: 20, ‘subsample’: 0.59
RF‘num_threads’: 2, ‘gamma’: 0.0, ‘lambda’: 0.0511
SVR‘alpha’: 0.9, ‘min_samples_leaf’: 57
1D-CINN(16,1) Convolution layer = 2, (64,1) Convolution layer = 2, activative function = ‘ReLu’, pooling layer = 1
Table 4. Performances of different RUL prediction methods.
ModelPrediction Time (Second)Prediction Accuracy (%)
GBDT4.32498.007
1D-CNN47.38198.692
SVR80.33398.490
RF852.07598.524
XGBoost24.91298.881
Proposed framework15.72898.922
Publisher’s Note: MDPI stays neutral with regard to jurisdictional claims in published maps and institutional affiliations.