Article

Dynamic Response Analysis of an Offshore Converter Platform with Valve Towers under Seismic Excitation

1
Key Laboratory of Far-Shore Wind Power Technology of Zhejiang Province, Hangzhou 311122, China
2
Power China Huadong Engineering Corporation Limited, Hangzhou 311122, China
3
Offshore Wind Power R&D Center of Power China Huadong, Hangzhou 311122, China
4
State Key Laboratory of Coastal and Offshore Engineering, Dalian University of Technology, Dalian 116024, China
*
Author to whom correspondence should be addressed.
Symmetry 2022, 14(8), 1635; https://doi.org/10.3390/sym14081635
Submission received: 30 June 2022 / Revised: 26 July 2022 / Accepted: 6 August 2022 / Published: 9 August 2022
(This article belongs to the Special Issue Test and Measurement Technology in Ocean Engineering)

Abstract

:
Converter valves are the core equipment of offshore wind power structures. However, they are highly vulnerable to vibration under strong earthquakes, which will affect normal operation of the offshore wind farm. Converter station is an axisymmetric structure with obvious asymmetry in its internal configuration of the superstructure. This study aimed to analyze the dynamic response of a supported converter valve in an offshore converter station under seismic excitation. The coupling model of the supported valve tower group and the converter station were established, and the distribution law of the valve tower dynamic response and foundation settlement were investigated. The dynamic response effect of the modal truncation, valve tower stiffness, and basic size on different areas and foundations of the valve towers were studied. The findings were as follows: (i) the effect of local vibration of the valve tower should not be simplified by using equivalent mass and node condensation; (ii) the structure–equipment coupling analysis method should be used to review the structural design scheme of the offshore converter station in the intensity VII region; (iii) the vertical higher-order modes should be considered during the vibration response calculation and its participation ratio in mass should not be lower than 90%; (iv) the frequency range that minimizes the vibration response is the characteristic frequency range of horizontal vibration, while the best vibration suppression effect cannot be obtained in both the horizontal and vertical directions; and (v) the stiffness of the valve tower itself should be adjusted and different stiffness designs of the valve tower in different positions should be adopted to realize effective vibration response control.

1. Introduction

Offshore wind power is one of the fastest growing renewable energy sources. The electrical energy produced by offshore wind farms is usually integrated into the state grid using high-voltage alternating current (HVAC) or high-voltage direct current (HVDC) technology [1]. HVDC is an emerging technology applicable to offshore wind farms with large capacities and at long distances from the coast. In addition, HVDC can improve power system stability and electrical power quality and reduce transmission losses [2,3,4,5,6,7]. HVDC technology for offshore wind farms requires the use of an offshore converter platform. The converter platform and internal electrical equipment are the core facilities of offshore wind farms. They should be reasonably designed to ensure operational safety, which is essential to ensure safe and stable output of electrical energy from offshore wind farms. Converter station is an axisymmetric structure from the appearance. However, the internal configuration of the superstructure has significant vertical and horizontal asymmetry. This results in the strong nonlinear response of the converter station structure under seismic load.
The converter valve is the core element of a DC transmission project. There is much research on converter valves focused on their electrical characteristics [8,9,10]. However, the support (or suspension) structure has poor overall stiffness, resulting in high vibration vulnerability under strong dynamic actions, such as earthquakes [11,12,13], which is obviously different from the vibration response and vibration vulnerability of the wind turbine tower or offshore jacket structure [14,15,16,17]. At present, existing research on the seismic performance of converter valve towers has mainly been performed using onshore substations. Ekström and Larder et al. [18,19] compared the structural features and anti-seismic performance of supported and suspended valve towers. They believed that a suspended valve tower could dramatically dampen the seismic action, although it underwent a large horizontal displacement. Enblom et al. [20] applied the response spectrum method to the numerical analysis of the valve tower structure. They recommended installing a damping device at the top and bottom of the suspended valve tower to reduce seismic hazards. Lan et.al [21] established simplified Finite element models of platform and converter valve and evaluated the effect of platform mass and stiffness on dynamic responses of converter valve under sea waves and earthquakes. In addition, the dynamic vibration absorber [22] or semi-active on-off damping controller [23] can also achieve response reduction for the valve. In general, existing studies on converter valve towers are mostly concerned with suspended valve towers, especially in terms of the response features of a single valve tower under seismic action. However, the sensitivity characteristics of the influencing factors of the seismic response have rarely been studied for multiple supported converter valve towers.
At present, the structural dynamic response of offshore structure, such as converter platforms, is mainly studied under adverse loads, including seismic action [24,25,26] and extreme wind and wave conditions [27], with structural safety prioritized and also for early warning [28]. The design methodology for electrical equipment on most offshore platforms is inherited from that of onshore platforms [29]. However, the local flexibility of the components has a significant impact on the natural frequency of vibration of the equipment and appendages [30]. At present, the converter valves used at most offshore converter platforms are of the vertical cantilever type, with their bottoms directly fixed to the valve hall floor. Their stiffness characteristics are significantly different from those of onshore valve towers directly fixed to the earth’s surface. Hence, dynamic response analysis of the valve towers of offshore converter platforms under seismic action can fill the research gaps in relevant fields.
In this study, the finite element model of the converter platform was first established for validity, and the dynamic analysis of the coupled model for several supported valve towers and the overall converter platform proved that the valve towers were non-ignorable. Then, model analysis was analyzed to extract vibration mode and natural frequency. Meanwhile, four inputs of earthquake ground-motion were chosen for simulating the dynamic response of the offshore converter platform and the valve towers. Additionally, the influence of different mode truncations, valve tower stiffnesses, and foundation dimensions on the dynamic response of the valve towers located in different regions and their foundations was further investigated. Finally, an optimized design for vibration control was proposed. The findings provide a scientific basis for designing electrical equipment and the corresponding structures in similar large-scale offshore substations.

2. Materials and Methods

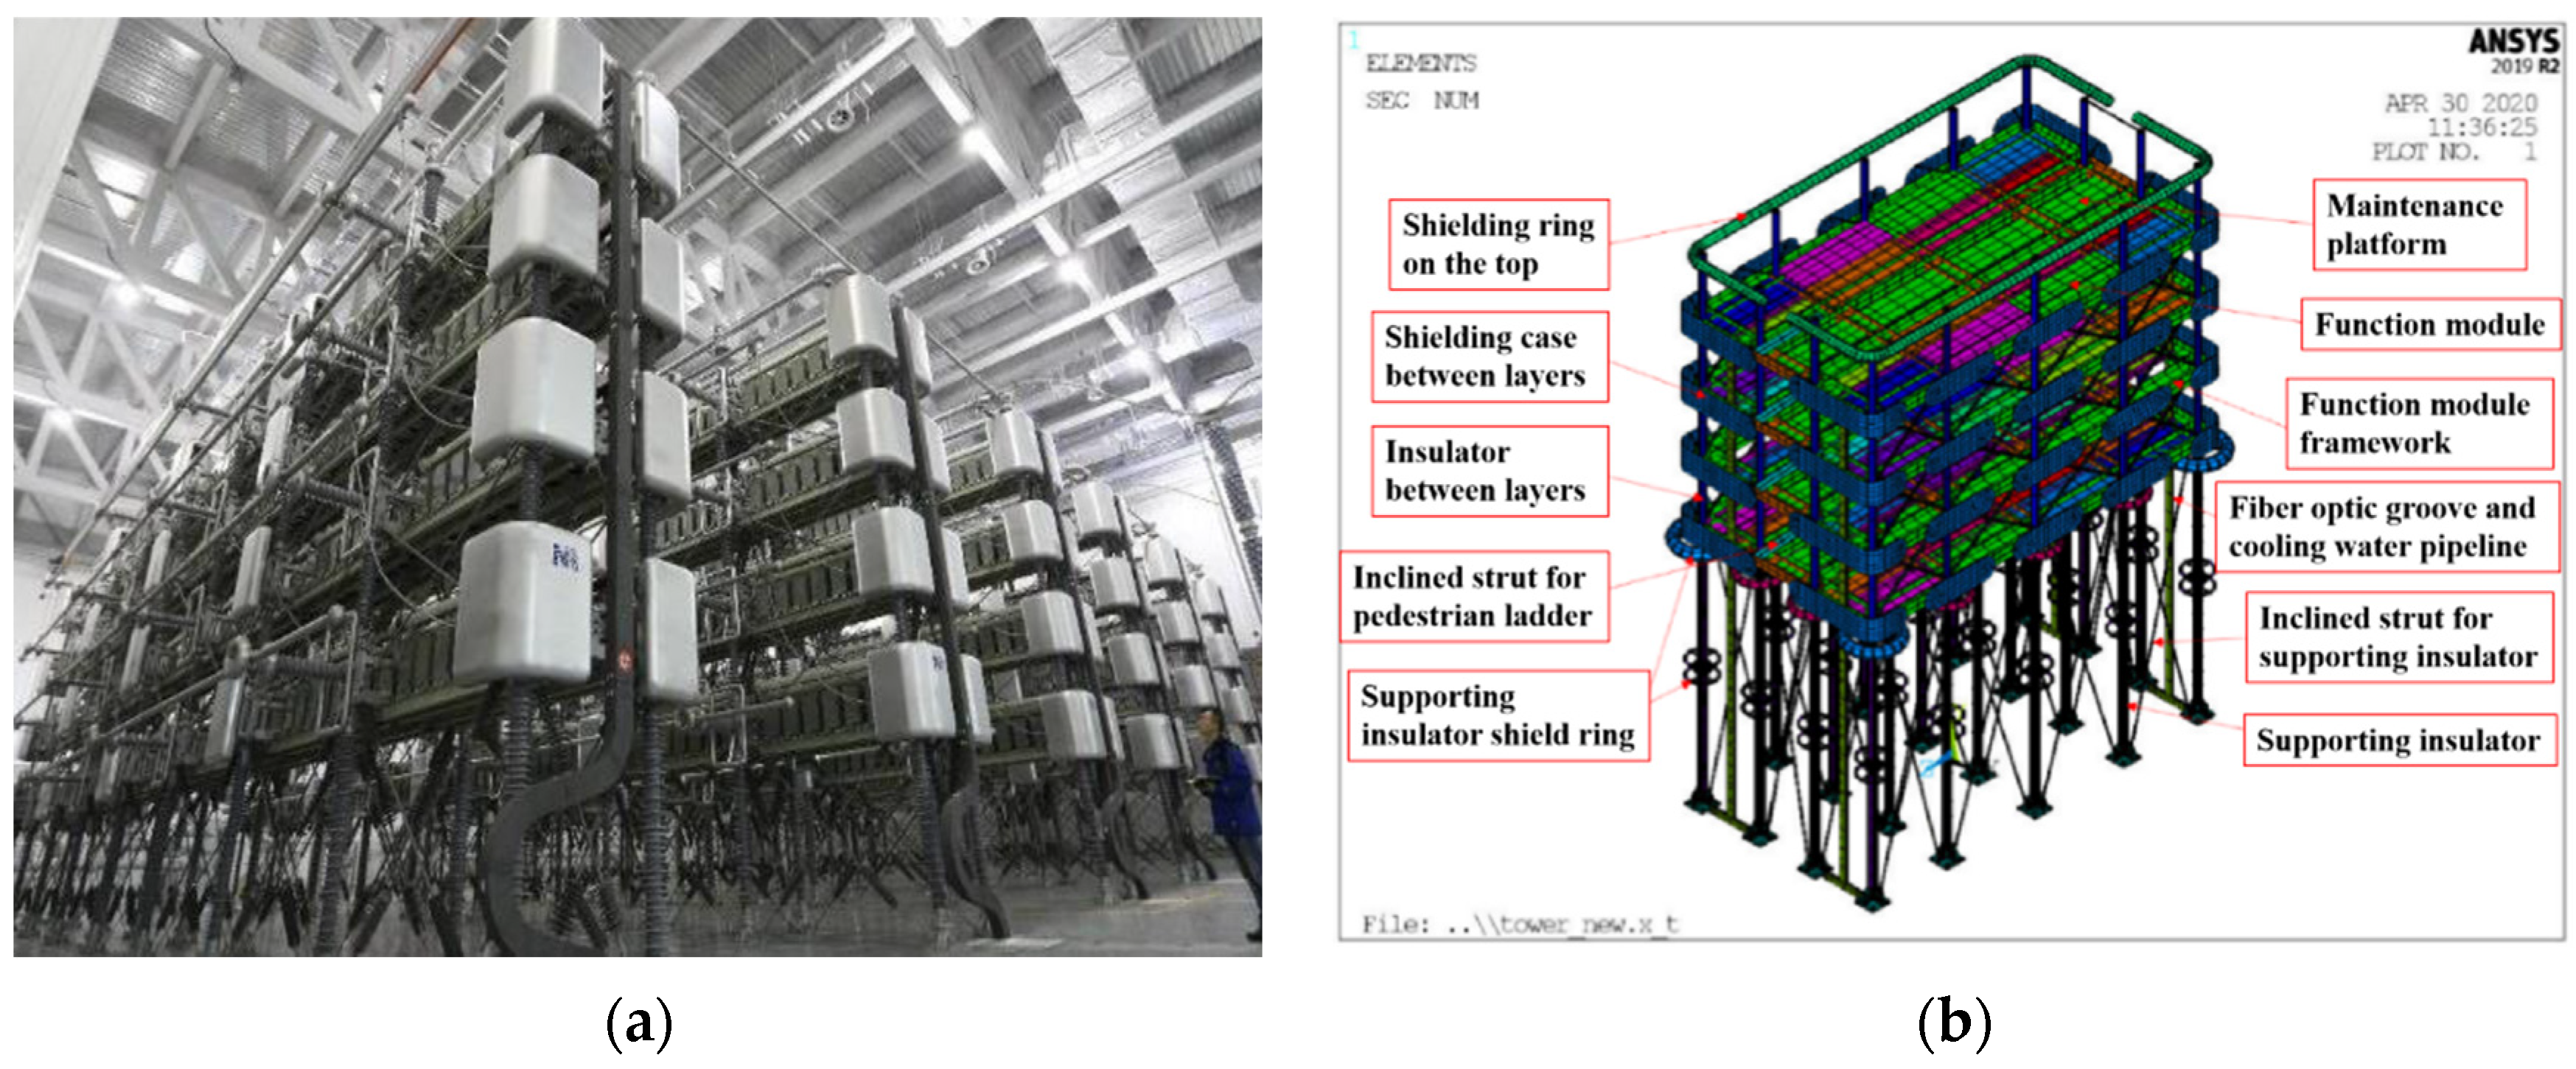
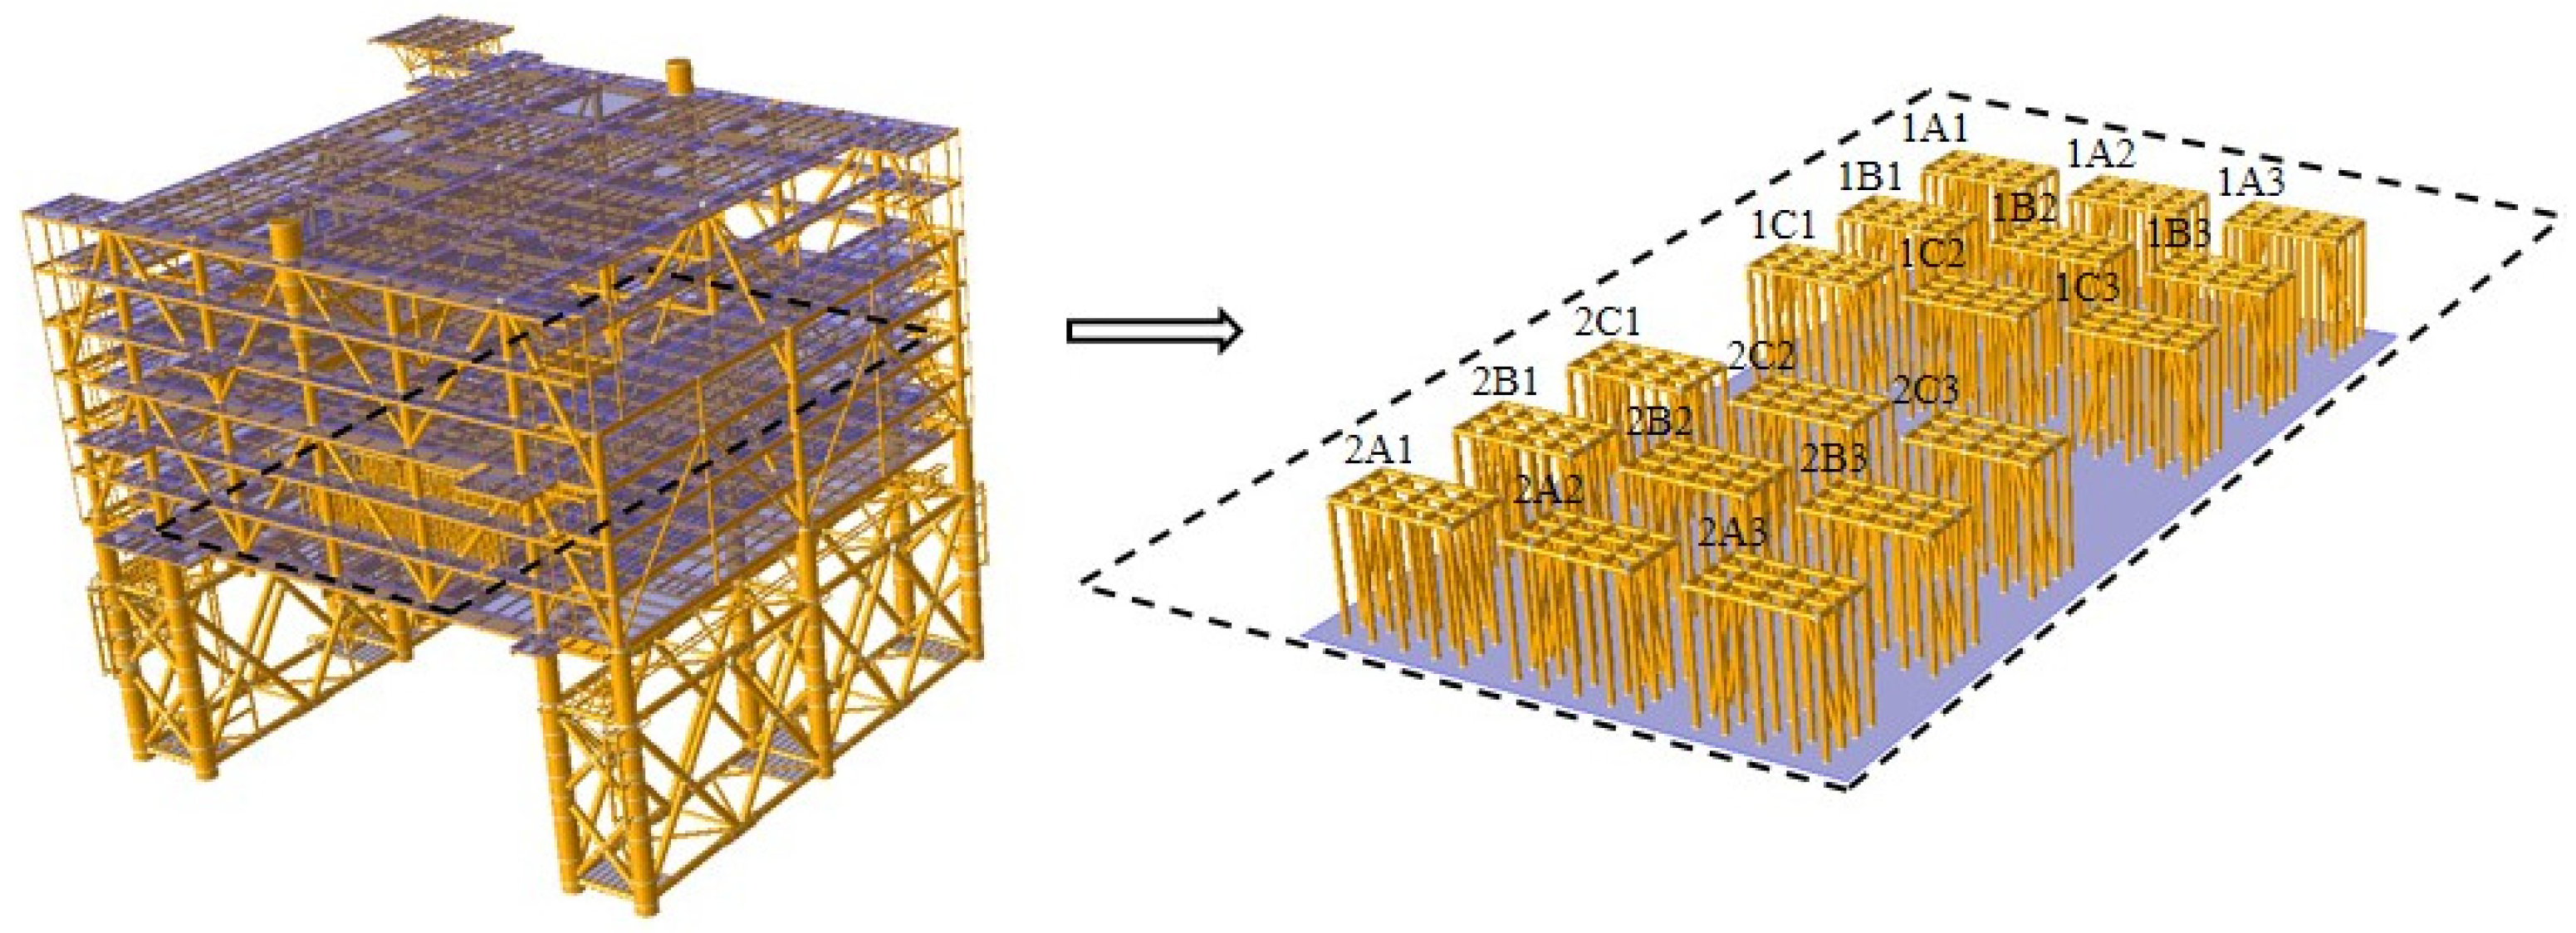
2.1. Numerical Model

This study focused on the dynamic response of an offshore converter platform-valve tower under the conditions of frequently occurring earthquakes. The transient response of the structure was solved using the modal dynamic method. For any structural system, the equilibrium equation for free vibration has the following form:
M X ¨ + K X = 0 ,
where M and K are the mass and stiffness matrix of the structure, respectively, and X is the nodal displacement vector. Offshore converter platforms usually have a complex structural style. It is necessary to simplify the equation by reducing the degrees of freedom. That is, the master degree of freedom r preserved for the node needs to be separated from the condensed, subordinate degree of freedom s. Equation (1) can thus be rewritten as
[ M r r M r s M s r M s s ] [ X r ¨ X s ¨ ] + [ K r r K r s K s r K s s ] [ X r X s ] = [ 0 0 ]
For any jth order mode, X s is expressed in terms of X r and introduced into Equation (1) to obtain:
( K λ j 2 M ) [ I D ] X r = 0 ,
where the matrix D = ( K s s λ j 2 M s s ) 1 ( K s r λ j 2 M s r ) ; I is the identity matrix of the rth order, and λj is the undamped natural frequency of the jth order, solved by the determinantal equation | ( K λ j 2 M ) [ I D ] | = 0 .
At moment t, when an external load is present in the time domain, for any jth order mode of the structure, Equation (4) holds true:
q j ¨ + 2 ξ j λ j q j ˙ + λ j 2 q j = 1 m j f j , b ,
where q j is the generalized coordinate of the jth order vibration mode and ξ j is the critical damping ratio. In the seismic analysis, the critical damping ratio was set to 5% for each order of vibration. The mass for the jth order mode was m j = ρ j T M ρ j , where ρ j is the dimensionless mode shape of the rth order f j , b = ρ j T P b , and P b is the action force driven by earthquake ground motion at the base of the structure. The earthquake ground motion is characterized by the acceleration time history a ( t ) ; thus,
P b = M K f f 1 K f b a ( t ) ,
where K f f and K f b are the submatrices of the stiffness matrix K . Subscripts f and b refer to the degrees of freedom of the non-base and base nodes, respectively.
Duhamel’s integral was applied to Equation (4) to calculate q j for each order. Next, the modes of the first N orders are superimposed according to Equation (6). The displacement response Q ( t ) of the structure is obtained as follows:
Q ( t ) = r = 1 N 1 m r ρ r q r ( t ) ,

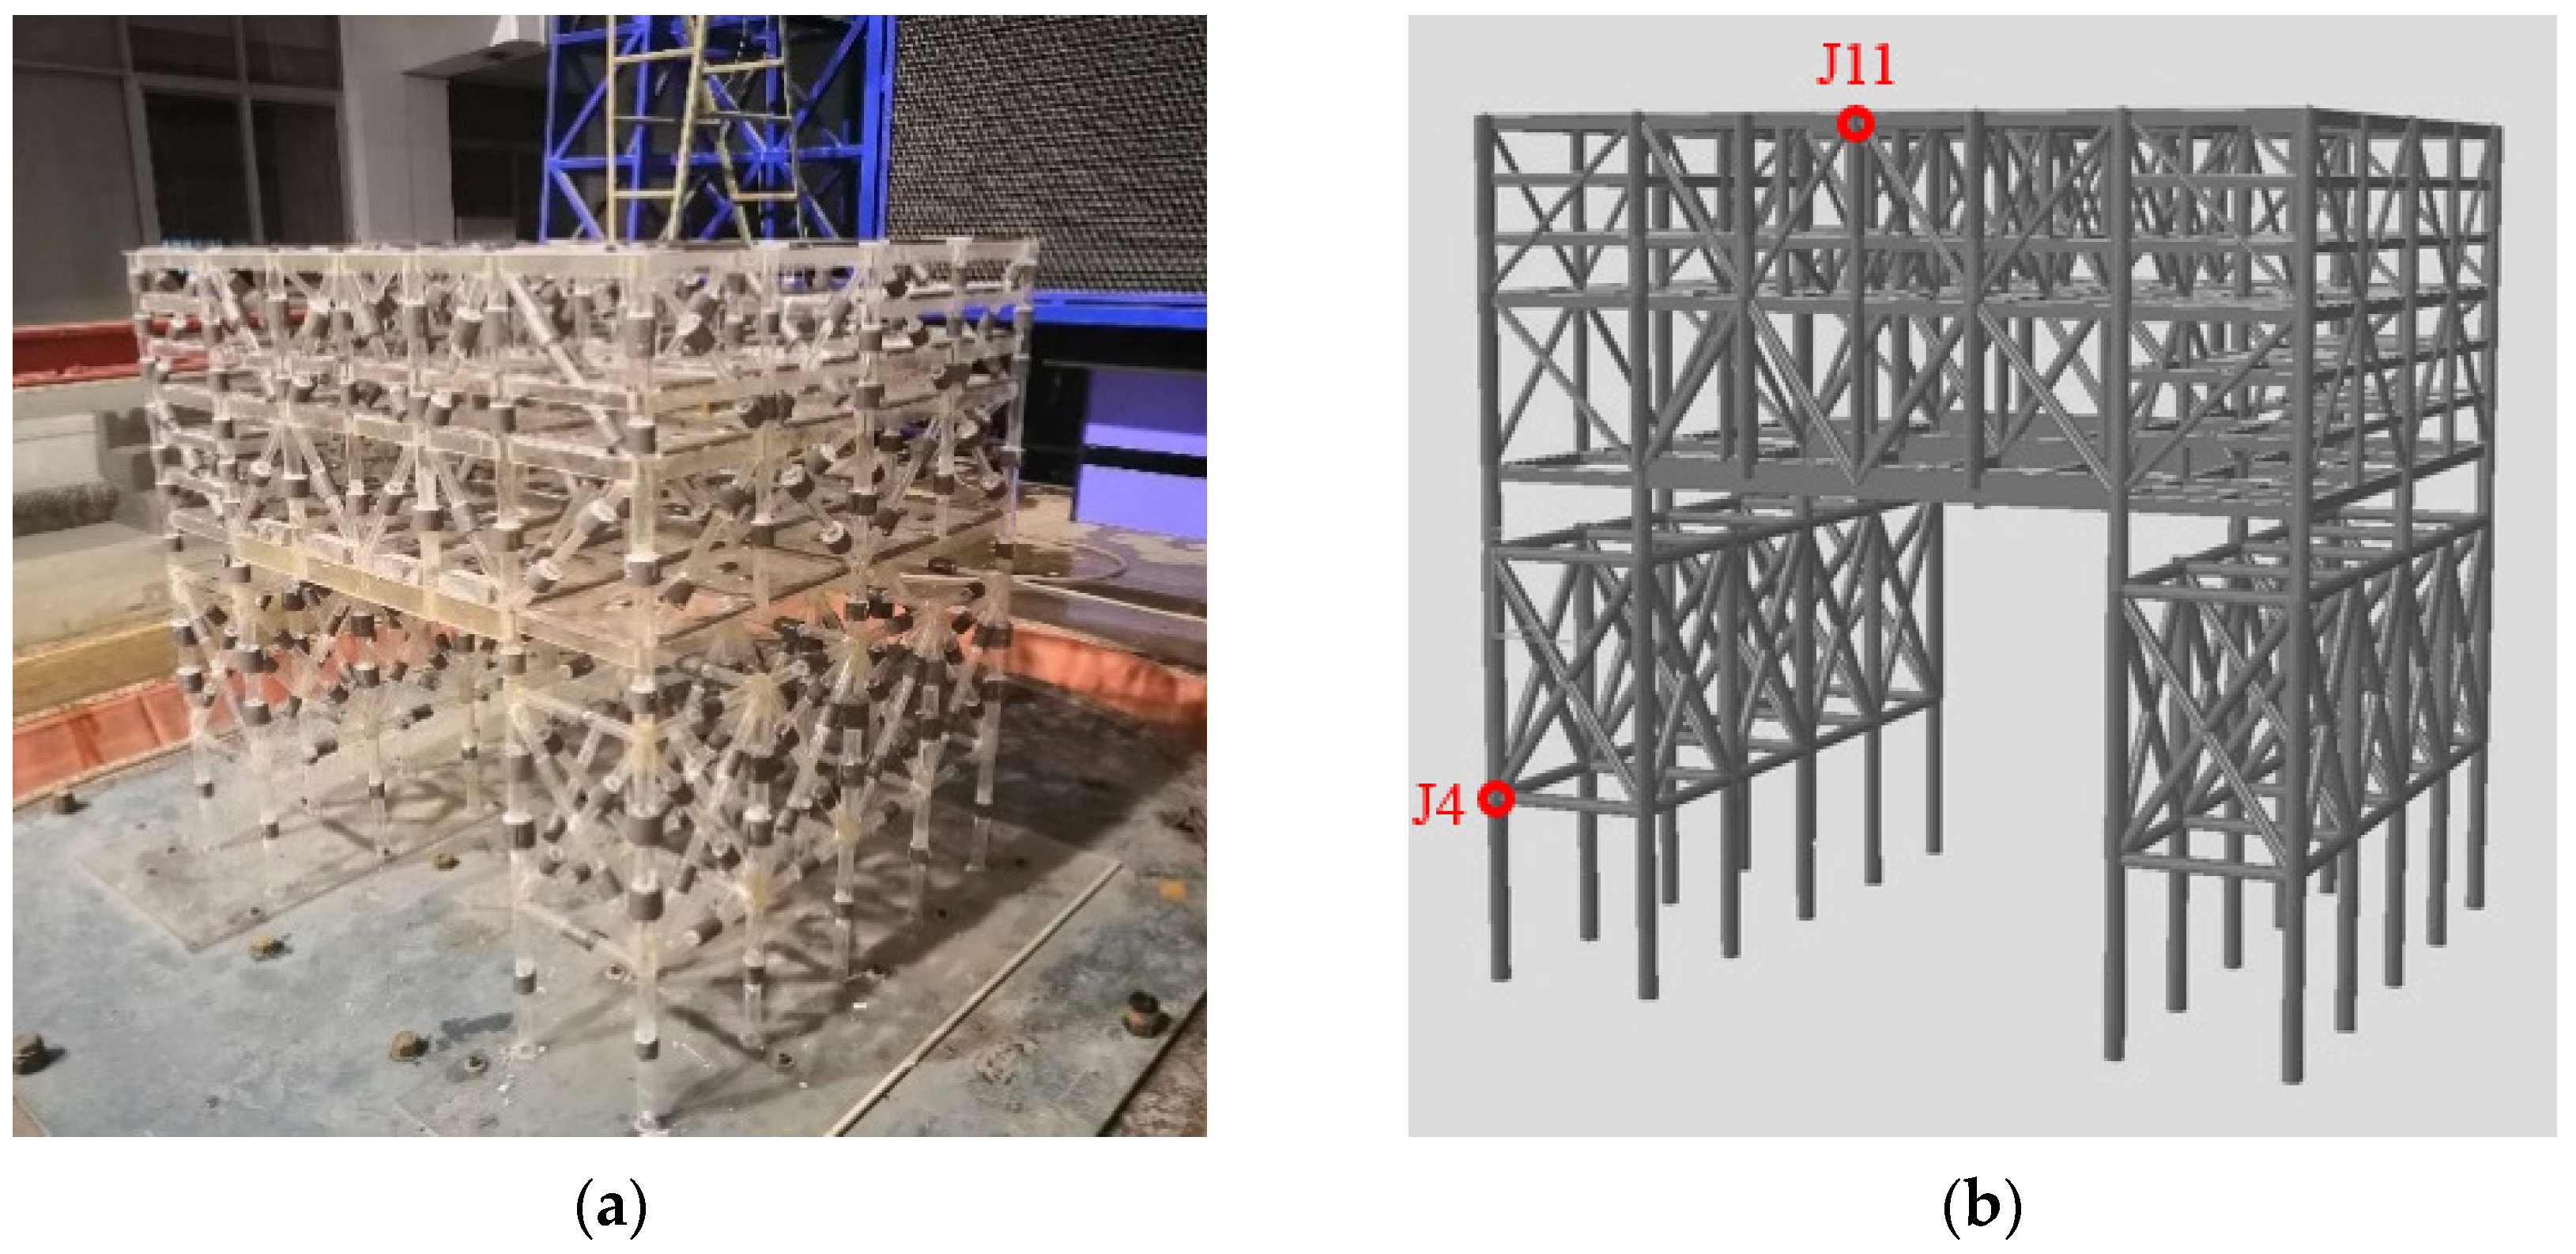
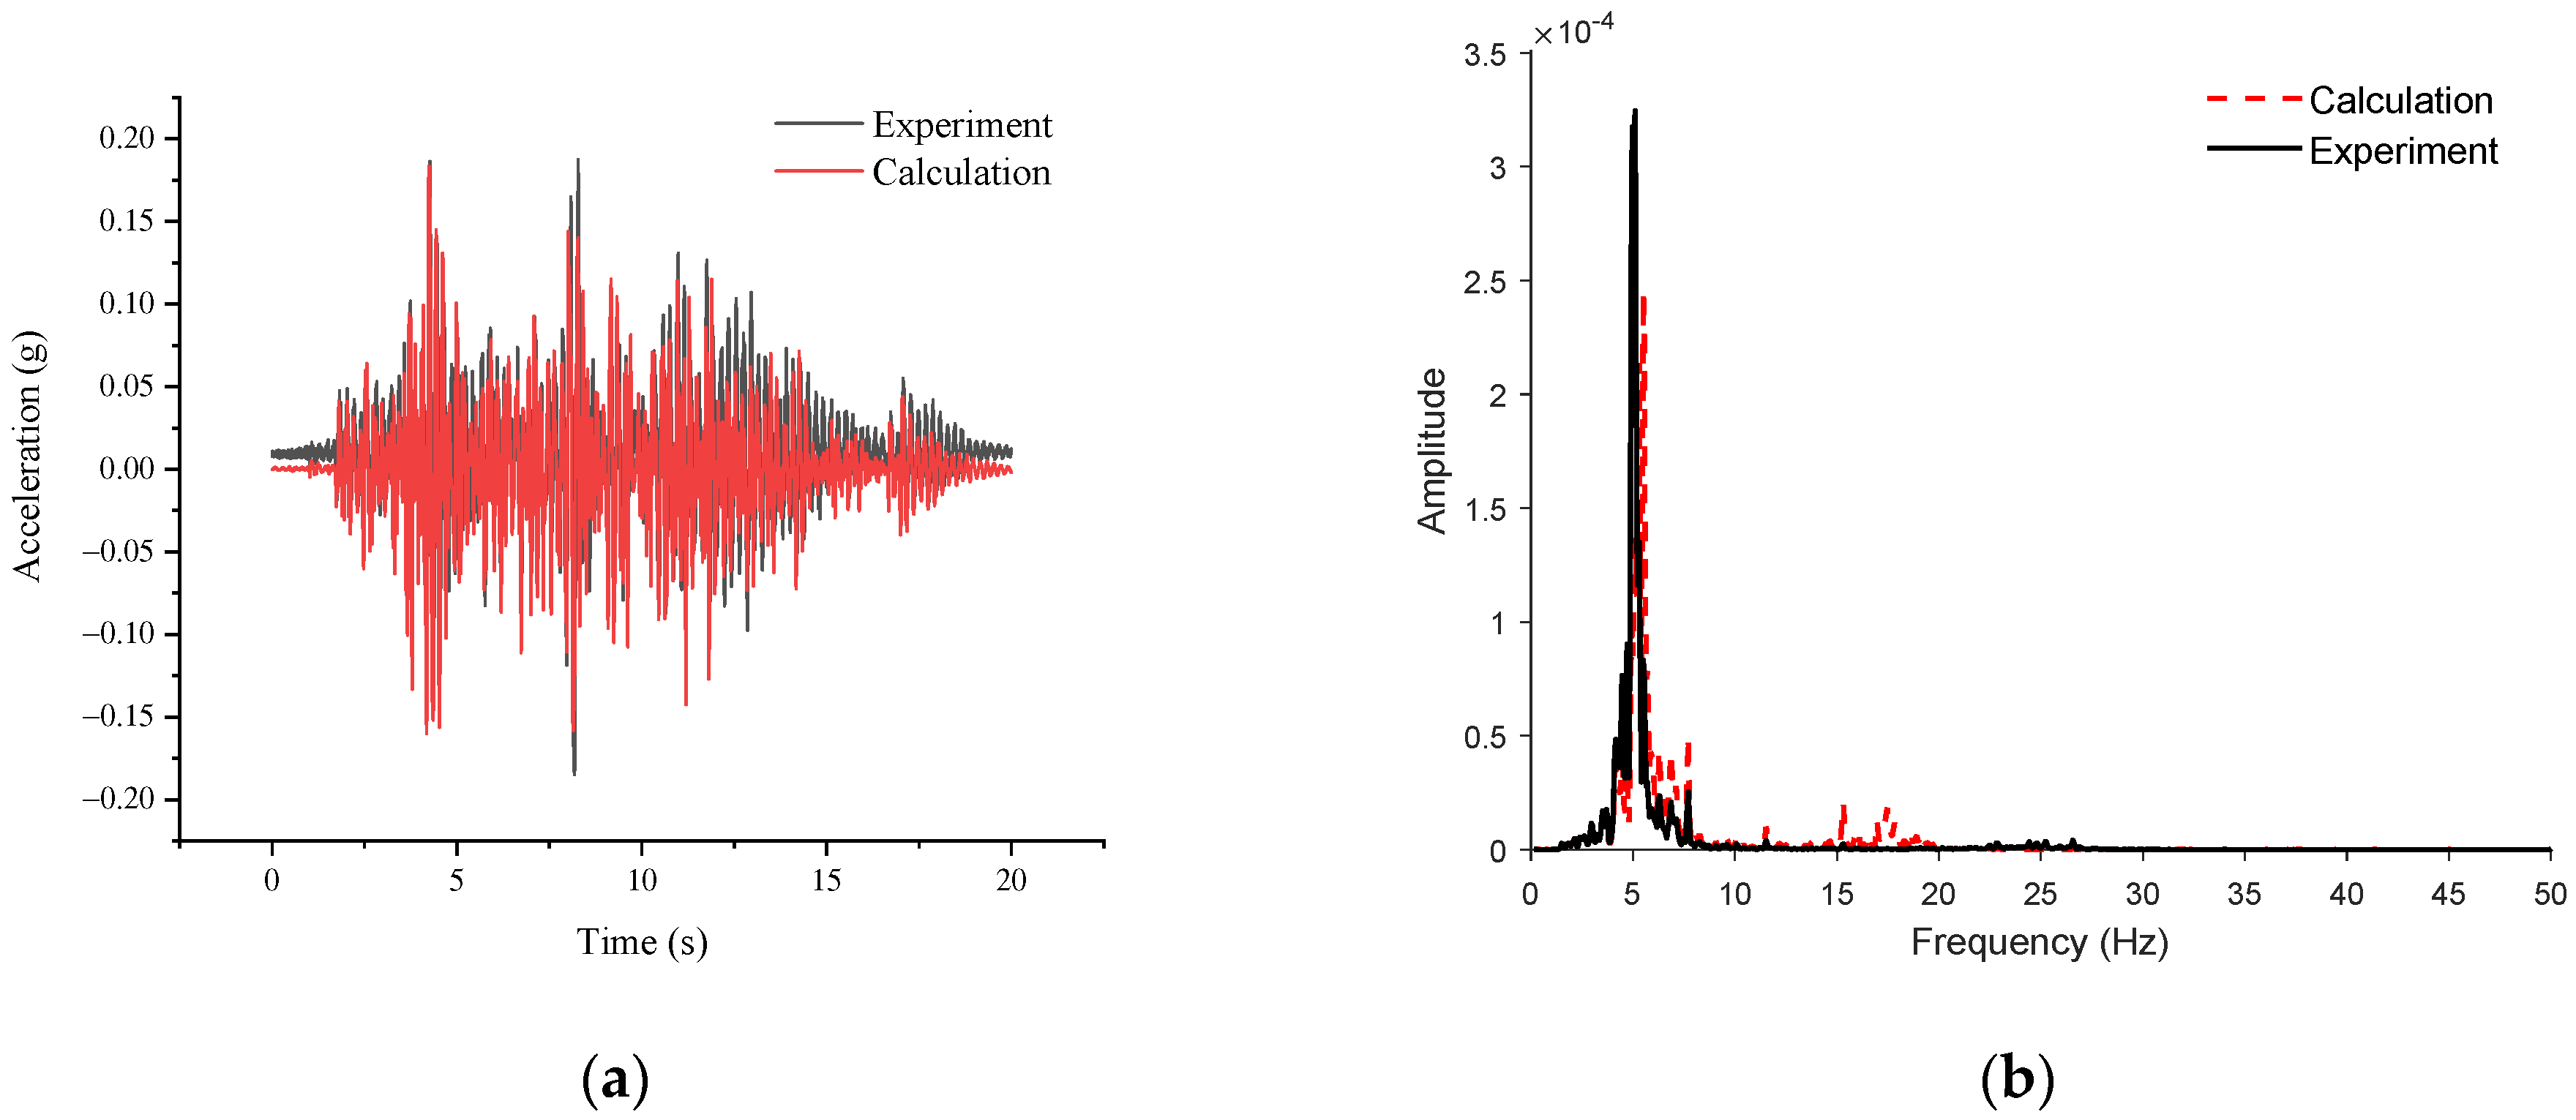
2.2. Experimental Validation

A physical model experiment was conducted to verify the numerical model of the offshore converter platform project. The model parameters were calculated based on the similarity law for elasticity with a geometric scale of 1:60. The physical model is shown in the left image and the numerical model was built using SACS 15.0 (Bentley Systems, Incorporated, Louisiana, USA) in the right image in Figure 1.
A specific acceleration of the seismic waves was chosen as the input for the experiment, which was API spectrum seismic wave with an acceleration peak value of 0.25 g. Thus, the acceleration response of measurement point J11 was obtained. The calculated and measured acceleration responses of this node in the time and frequency domains were compared in Figure 2. Good agreement was observed between the numerical and experimental results.

2.3. Evaluation of Valve Tower Effect

A typical valve tower structure used in offshore converter platforms and its finite element model were shown in Figure 3. Lower-order translational motion was the dominant natural vibration of the structure. Therefore, each valve tower was simplified into a cantilever beam with a single mass point at the end. The size and elastic modulus of the beam member were determined based on the similarity scale of the frequency.
An overall model of the offshore converter platform was built to analyze the coupling relationship between the converter platform structure and the valve towers. Node J4 in the platform jacket and node J11 in the upper component were chosen for observation to exclude the influence of the detailed model of the valve tower itself on the vibration features. As shown, the acceleration responses of the overall structure with and without the valve tower were in agreement (see Figure 4). This indicates that the detailed modeling of the valve tower had little impact on the overall structure.
The acceleration response of base node 1037 in the valve tower in the Y- and Z-directions is shown in Figure 5. The vibration features of the valve tower were found to have a significant impact on the acceleration response of the base node of the valve in the Z-direction. Therefore, neglecting the vibration features of the valve tower itself directly resulted in the deviation of the local vibration response solved, thus would misguide engineers in real-world engineering design.

3. Results

3.1. Model and Modality

An equivalent valve tower model was incorporated into the overall model shown in Figure 6 (using SACS 15.0). The section above the supporting insulators of the valve tower was equivalent to two points of concentrated mass (one layer in the plane frame and the other in the central position). Except for the center of weight and gravity, the simplified model of the valve tower is consistent with the master frequencies of translational motion in two directions when the valve tower was completely immobilized on the floor. The action points of the concentrated mass in the valve tower and the corresponding nodes in the foundation were not condensed to account for the vibration features of the valve tower itself. The accumulated mass participation ratio for the first 100 orders of the overall structure is shown in Figure 7.
The first- and second-order modes of vibration of the offshore converter platform were translational motion in the X- and Y-directions, respectively. These two vibration modes were dominant, and their accumulated mass participation ratios were 92% and 89%, respectively. The frequencies of the corresponding modes were 0.52 Hz and 0.66 Hz, respectively. However, in the Z-direction, the accumulated participation ratio in mass did not reach 90% before the 82nd order.

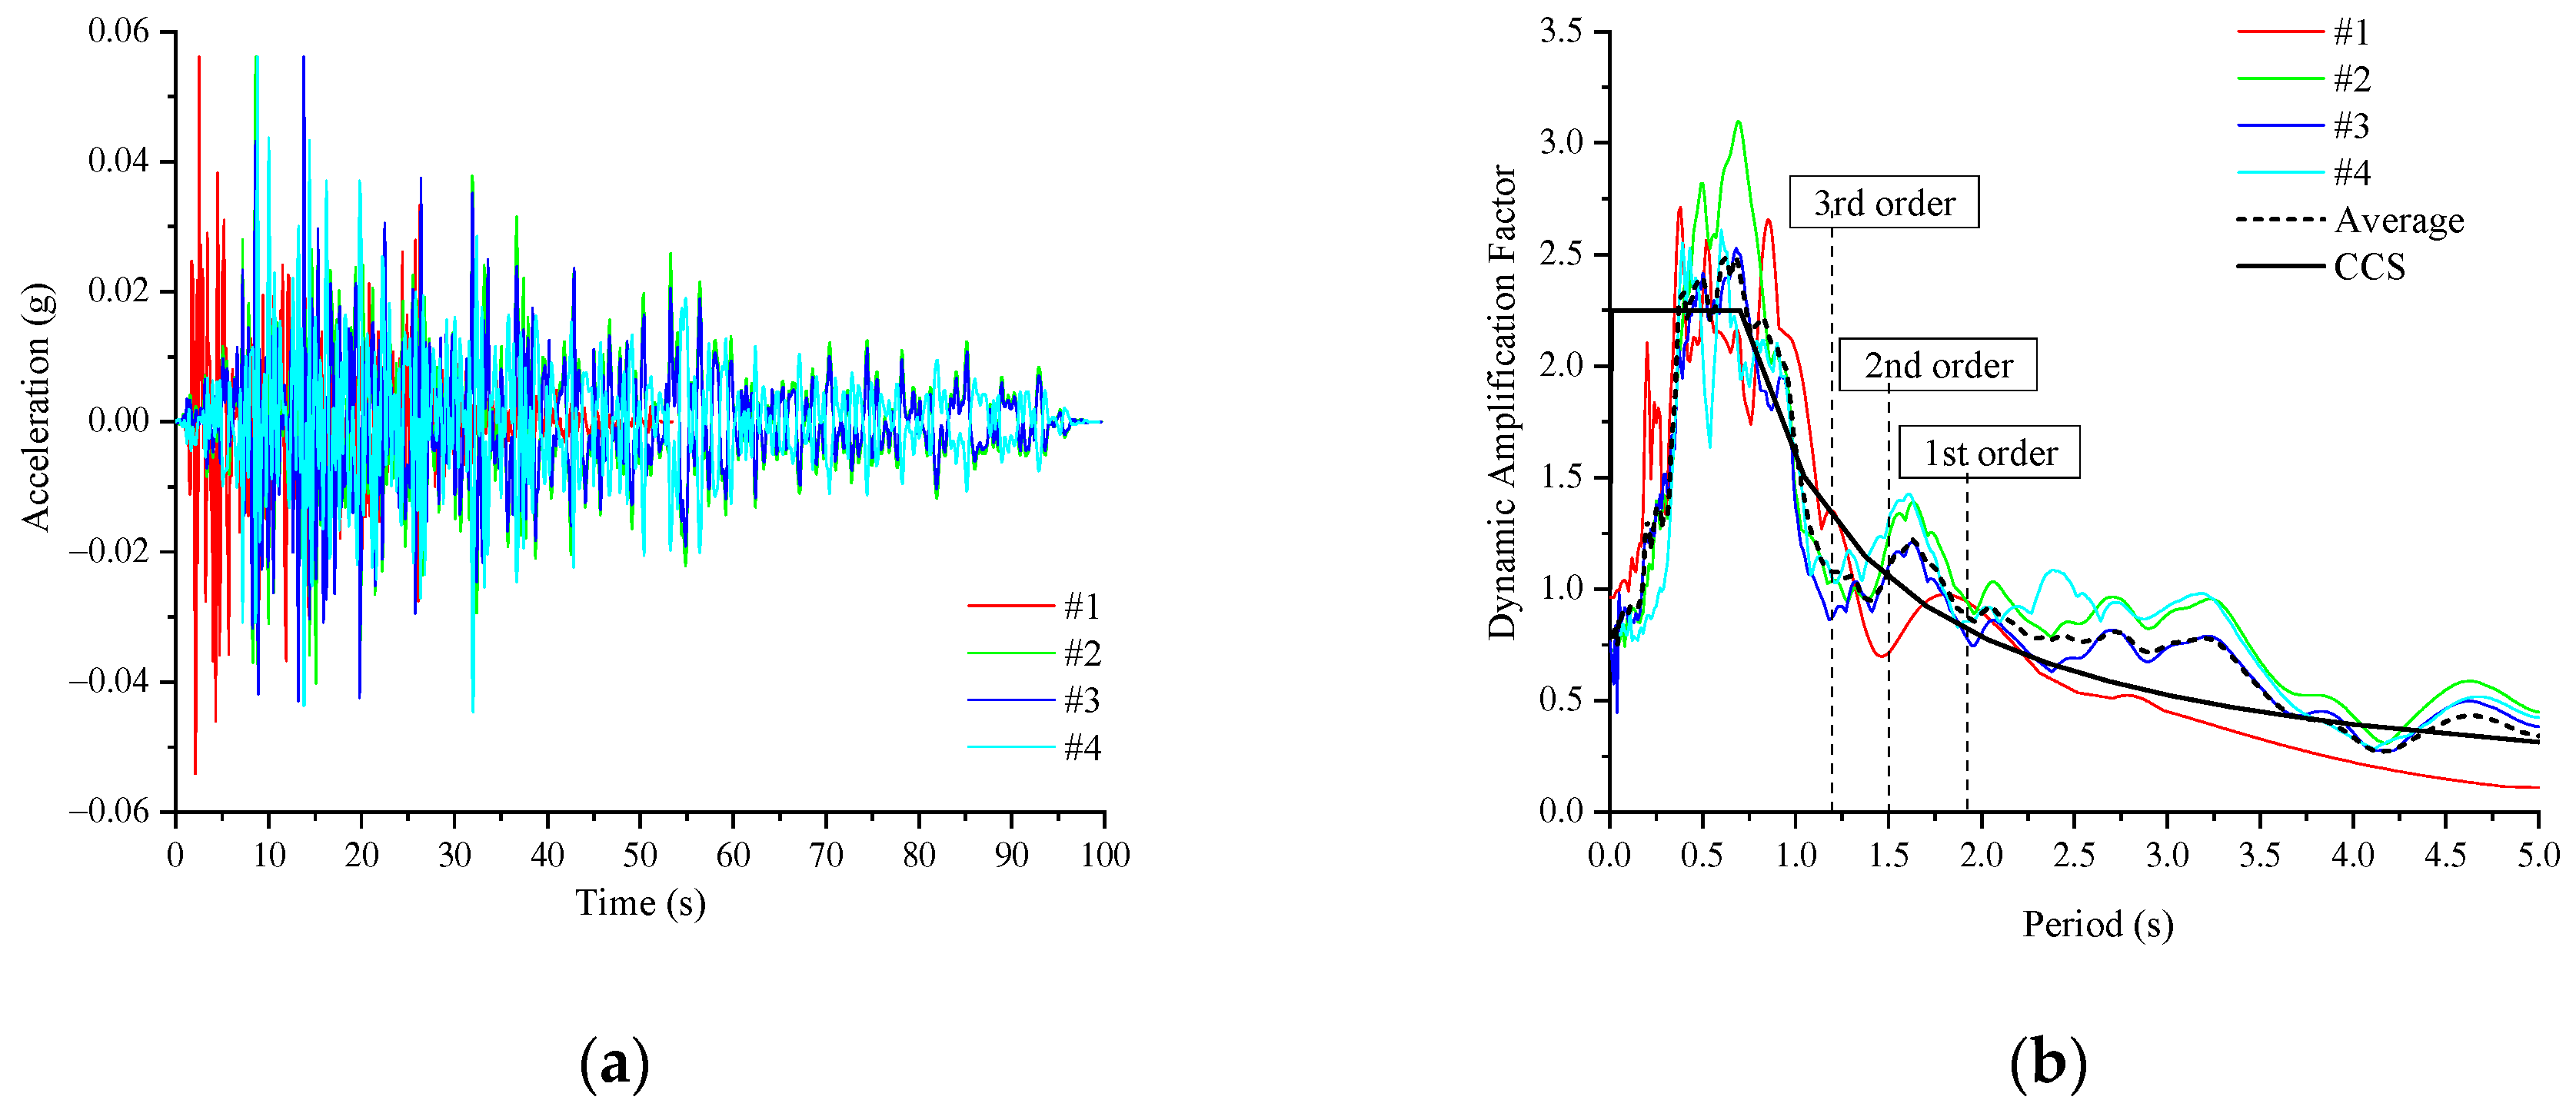
3.2. Inputs for Time-History and Response

The four inputs of earthquake ground-motion time-history were real records of earthquake ground-motion acceleration that were statistically consistent with the China Classification Society (CCS) response seismic spectrum for the project site. The peak was adjusted to 55 gal (0.056 g) according to the ground-motion intensity of frequently occurring earthquakes, as shown in Figure 8. In the three principal directions of the structure, the ground-motion intensity was assigned at a ratio of 1:1:0.5. One hundred modes were truncated for the calculation to improve the precision. The damping ratio of the structure was set to 5%.
The calculation with ground-motion input #1 was taken as an example. The peak acceleration responses in the valve tower foundation are shown in Figure 9. In the X-direction, the peak acceleration response of the valve tower foundation stabilized at 0.05–0.07 g. In the Y-direction, the peak acceleration response stabilized at 0.05 g, which is comparable to the peak input (0.056 g). In the Z-direction, the peak acceleration response gradually increased from 0.08 g on the margin of the valve hall to 0.19 g at the center. A dynamic magnification coefficient of nearly 7 was present at the center compared to the peak input (0.056 g/2). The peak acceleration responses of valve tower 2B2 and 2B3 in the X-, Y-, and Z-directions are shown in Table 1.
The aforementioned analysis showed that the dynamic response of the valve tower and its foundation in the valve hall of the offshore converter platform varied. The dynamic response features also varied in different directions. The maximum response to horizontal and vertical vibration occurred at central node V108 (top of valve tower 2B3) and V088 (top of valve tower 2B2), respectively.
Furthermore, the most adverse load action on the valve tower is the relative subsidence of the foundation nodes. This load action was explored by comparing the peak difference in vertical displacement between two adjacent nodes among a total of 20 nodes in each group of the valve tower, as shown in Figure 10. The results showed that the maximum relative subsidence was 1.3‰ in the X-direction and 0.9‰ in the Y-direction. This finding implies that it is necessary to improve the structural strength of the valve tower itself or the foundation stiffness under deadweight working conditions (e.g., the relative subsidence of the foundation is required to be lower than 1‰–2‰) when applying conventional performance requirements (e.g., the relative subsidence of the foundation is required to be lower than 2‰–3‰) for the onshore valve tower to the offshore converter platform.

4. Discussion

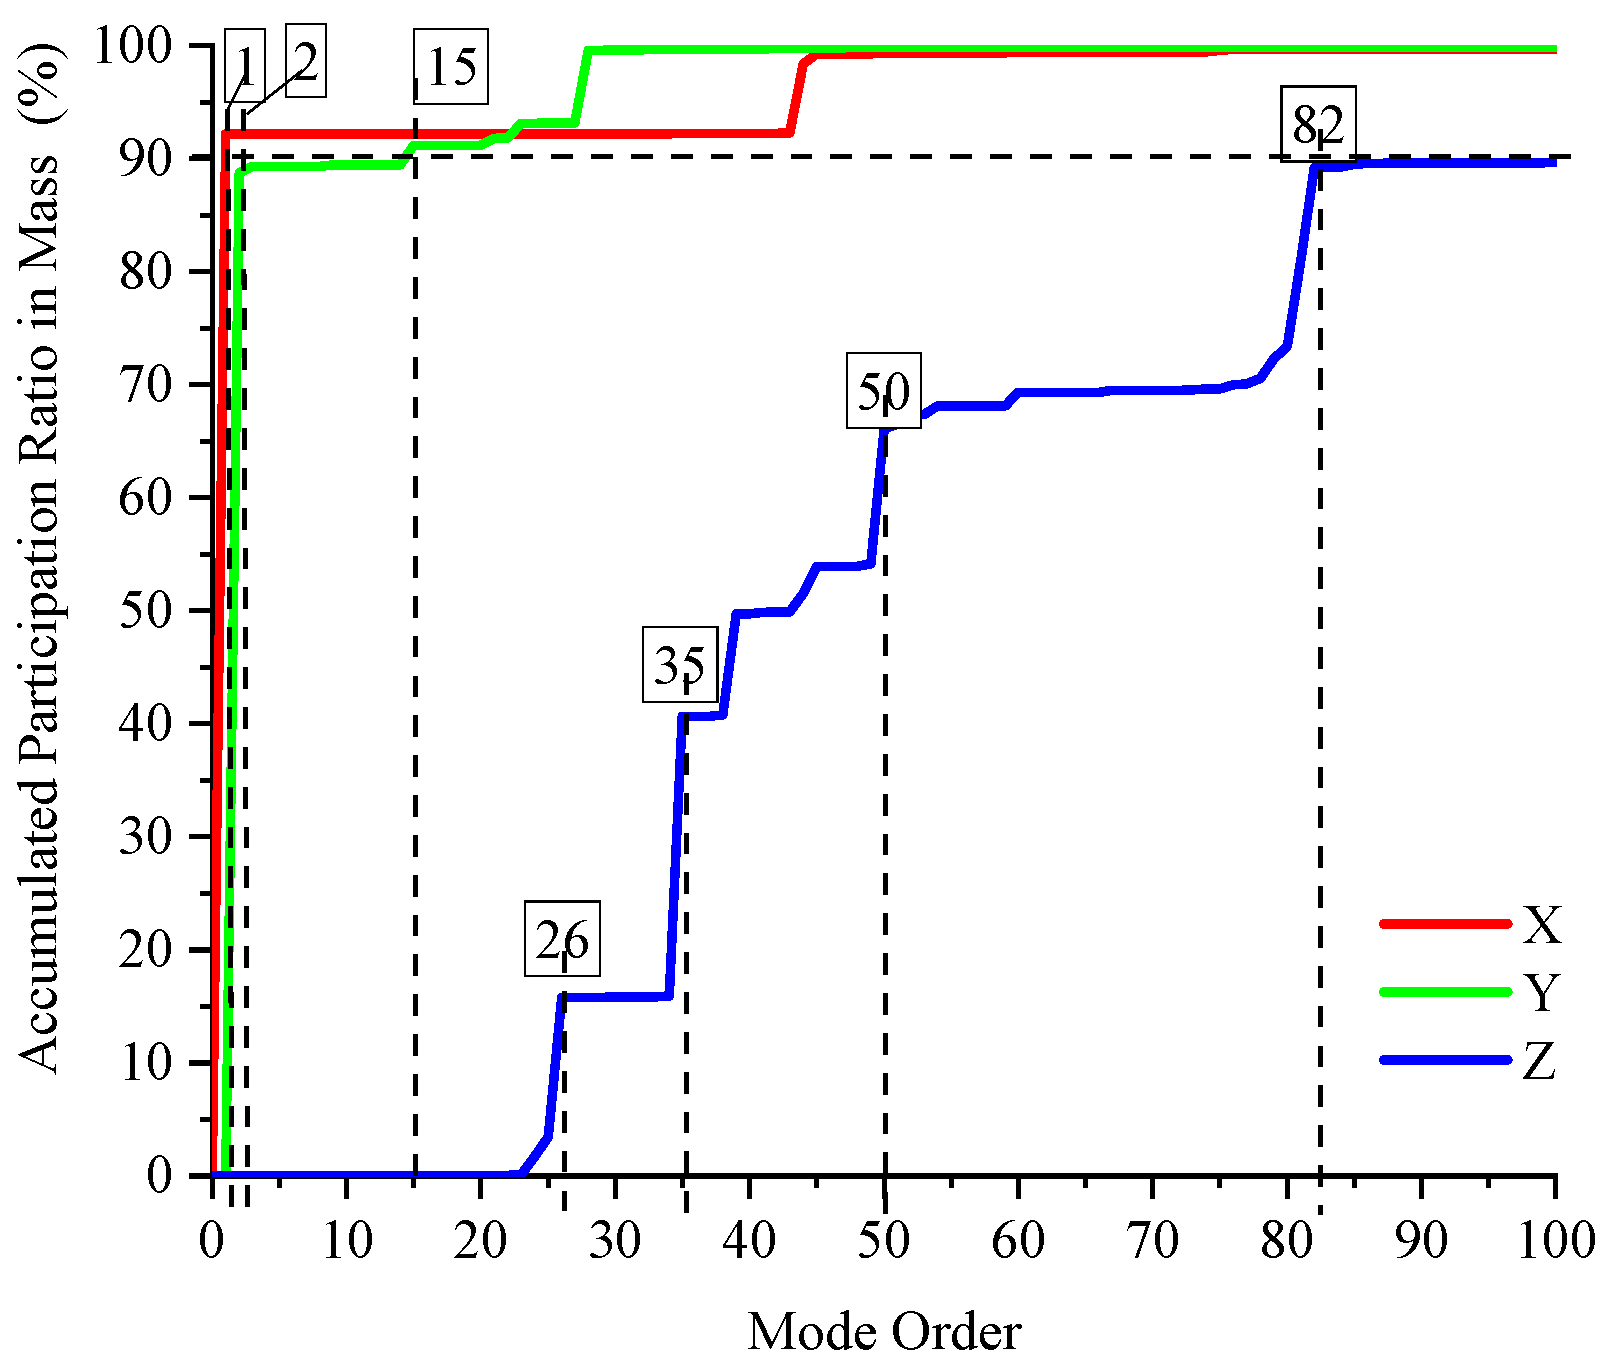
4.1. Mode Truncation Analysis

According to the basic rationale in Section 2.1, the structural response was the result of the modal superposition of different orders. The influence of the number of truncated modes N on the calculation results needs to be estimated first [31]. Under input ground motion #1, N was set to 3, 21, 26, 35, 39, 50, and 82 according to Figure 7, showing that the order of modes makes a significant contribution. The representative positions for observation were nodes in the central foundation of the typical valve towers 2B2 and 2B3 (Nos. F088 and F109), and the nodes at the top (Nos. V088 and V108). Next, the sensitivity was analyzed using the peak acceleration responses in the X- and Z-directions as the evaluation indicators (see Table 2).
In theory, the greater the value of N, the closer it is to the true solution. As for the horizontal motion of the nodes on the valve hall floor, the first-order mode was overwhelmingly dominant. It was less affected by the higher-order modes. However, the vertical vibration response in the upper and lower parts of the valve tower increased dramatically as the higher-order modes in the vertical direction were considered. In addition, the horizontal vibration response of the upper and lower parts of the noncentral valve tower (2B3) was magnified by more than 50%. These results indicate that the horizontal components of the higher-order vertical modes of vibration at the margin of the valve hall were also non-negligible.

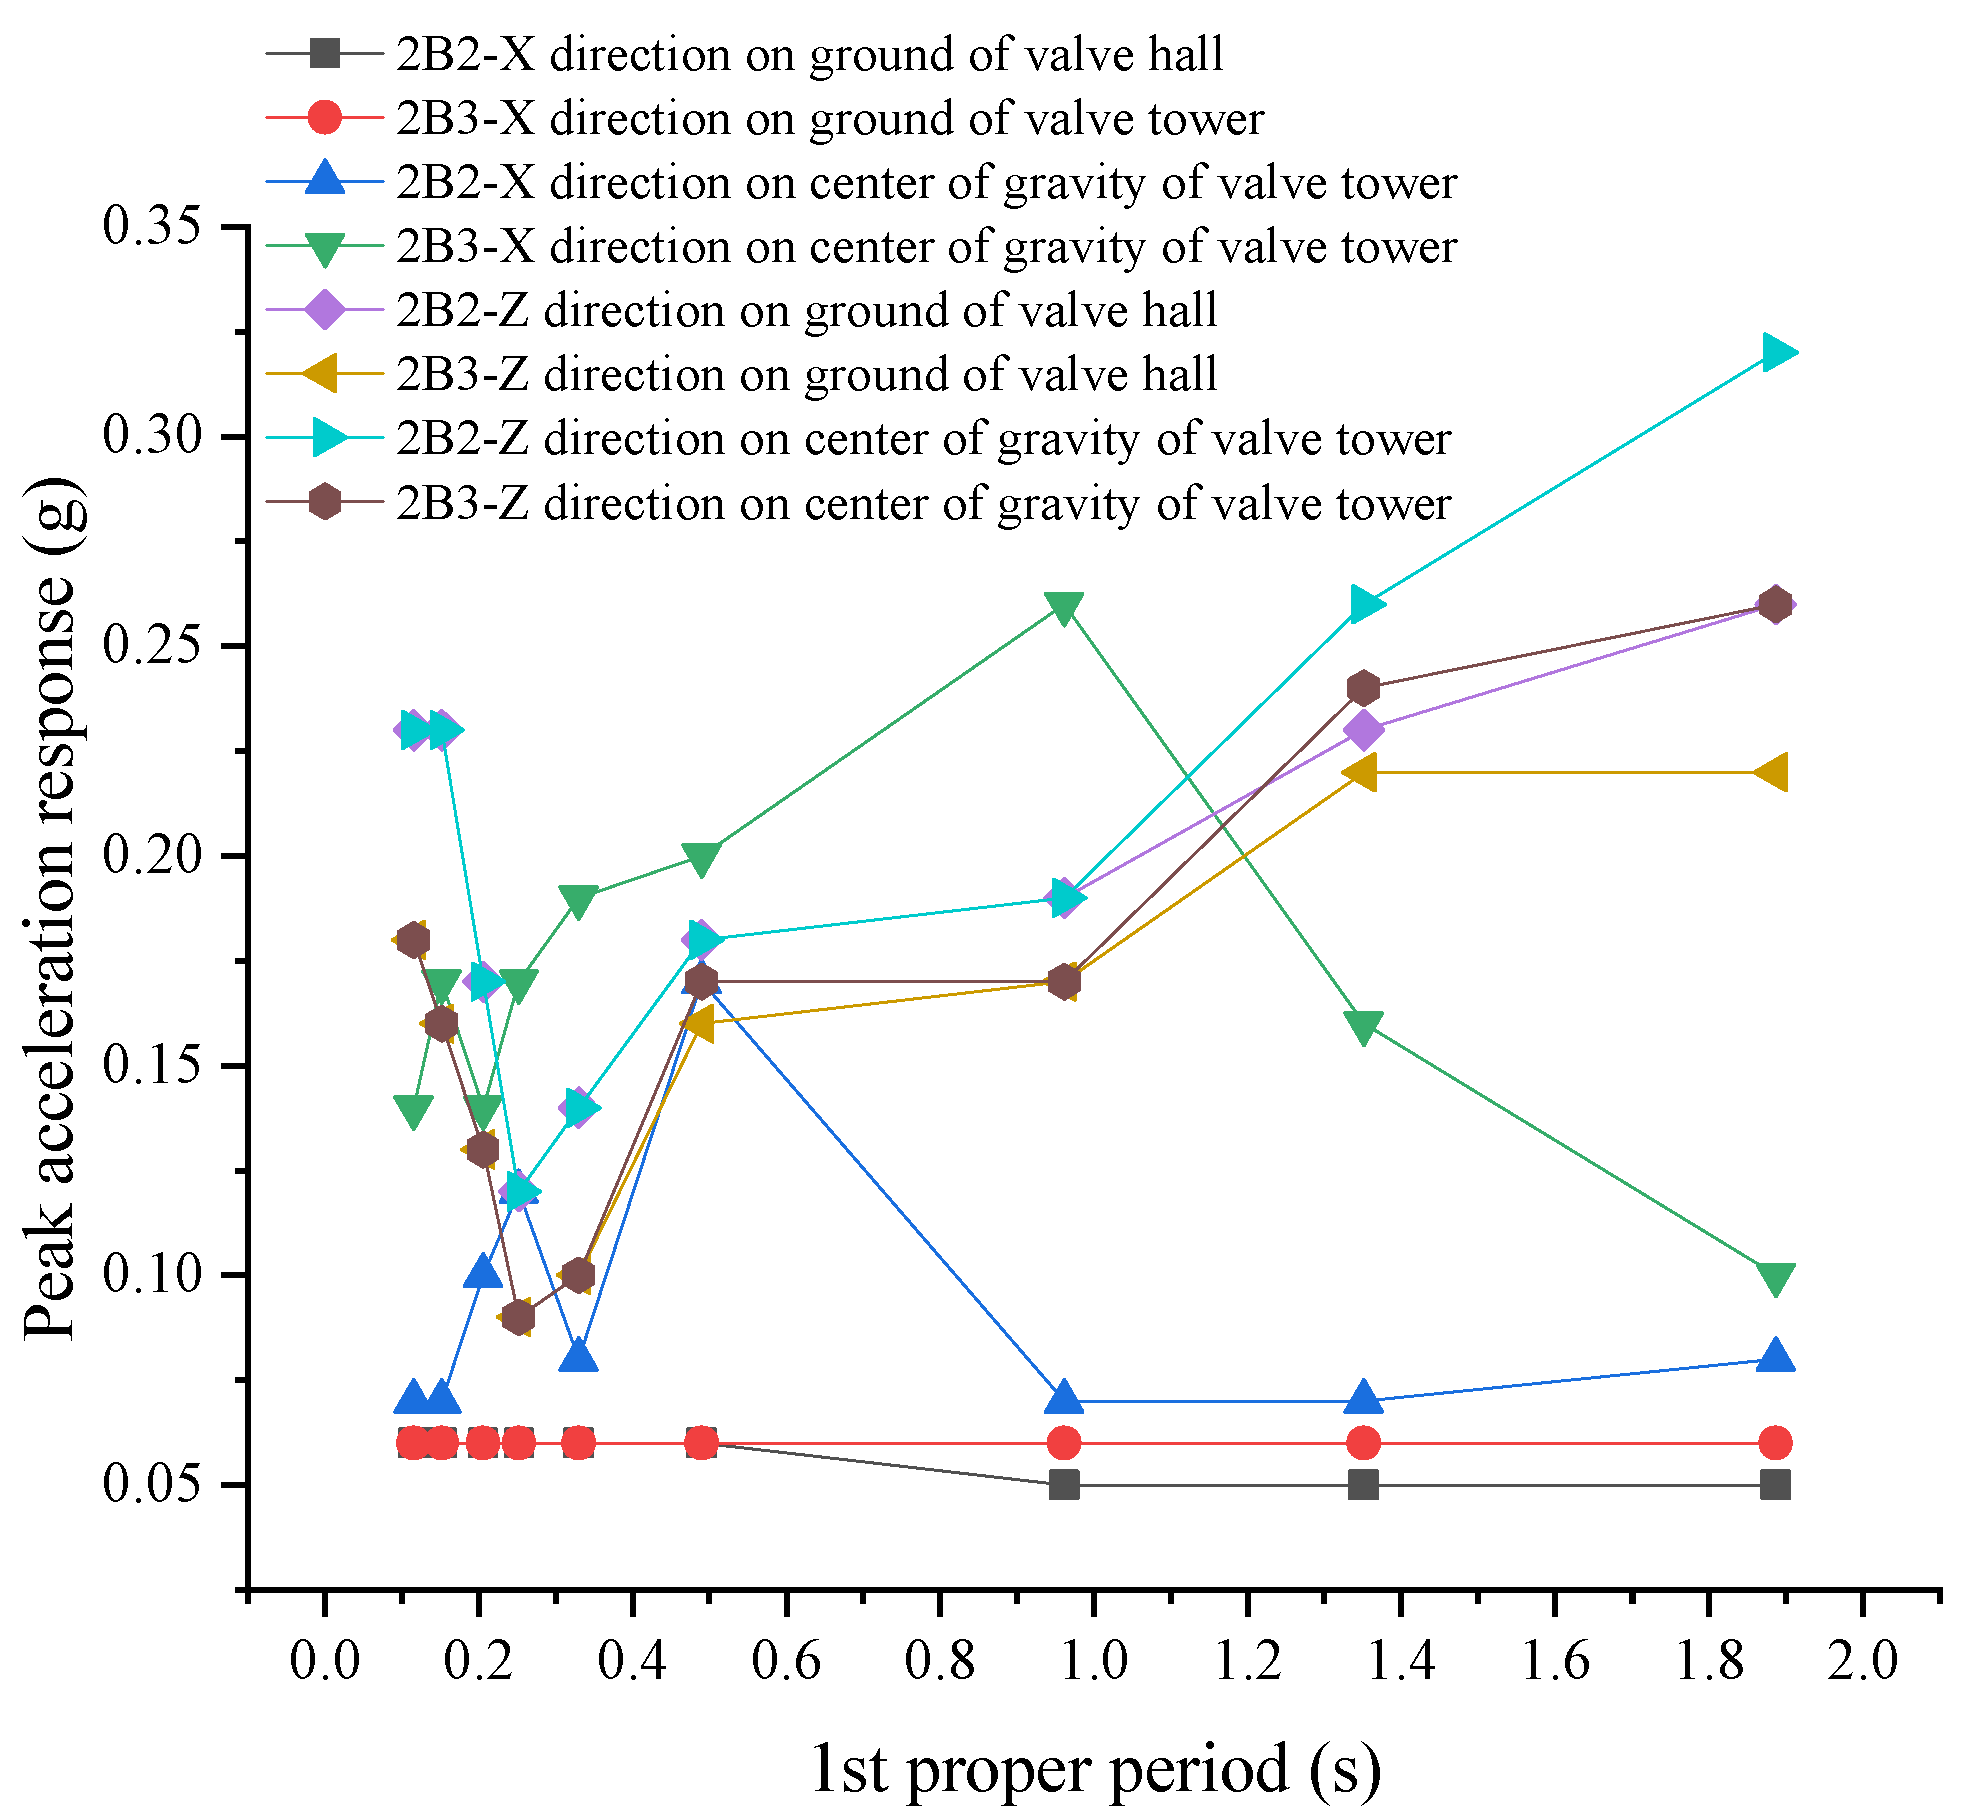
4.2. Stiffness of the Valve Tower

While ensuring that sufficient truncated modes were present for the calculation (N = 100), the influence of the valve tower stiffness on the calculation results was further explored. Different from the study of Günay and Mosalam on the influence of support structure stiffness on the seismic response of insulator posts [32], this paper carries out a sensitivity analysis on the stiffness of the whole valve tower. Table 3 shows the first-order natural frequency (X-direction) of the valve tower when the elastic modulus changes. The floor response spectra are plotted on this basis, as shown in Figure 11. When the valve stiffness could be appropriately improved based on the existing engineering design such that the first-order natural frequency fell within the interval (2.0 Hz, 5.0 Hz), the acceleration response at each site and in each direction could be controlled within 0.2 g.
The findings showed that (i) the stiffness and natural vibration features of the valve tower itself barely influenced the horizontal vibration of the valve hall floor. The presence of the valve tower made little contribution to the horizontal stiffness of the main converter platform. (ii) The horizontal vibration response for the center of gravity of the valve tower was related to the stiffness of itself. The peak acceleration response first increased and then decreased with an increase in the natural frequency of the valve tower. An analogy was made between the variation trend of the peak acceleration response and the response spectrum of the dynamic magnification coefficient, as shown in Figure 8. (iii) As long as the valve tower stiffness was not too small, the valve tower could be approximated as a rigid body in the vertical direction. The peak responses of the floor and the center of gravity were consistent. (iv) The stiffness and natural vibration features of the valve tower had a significant impact on the vertical vibration response of the valve hall. However, unlike the features of the horizontal vibration response, the peak acceleration response in the vertical direction first decreased and then increased with an increase in the stiffness of the valve tower. The most favorable frequency probably fell within the interval of the characteristic frequency of the horizontal vibration response. Therefore, it was theoretically impossible to achieve optimal vibration suppression in two directions simultaneously.

4.3. Foundation Dimension

The analysis in Section 4.2 showed that the natural vibration features of the valve tower itself had a significant impact on the dynamic response of the overall converter platform. However, according to engineering practices, the valve tower stiffness can only be adjusted within a limited range owing to the limitations of the system function and process conditions. Moreover, adopting different stiffness designs for valve towers at different positions is not economically feasible. The stiffness of the platform can also change the dynamic responses of the valve towers [21,33]. So, one solution is to adaptively design the beam member in the valve tower foundation to achieve the best anti-seismic performance.
In the original design scheme, the main support beams in the transverse (X-direction) foundation below the valve towers 2B2 and 2B3 located in the middle of the valve hall were welded steel H sections measuring 120 cm in height and 40 cm in width. The welded steel H section is a commonly used steel beam in engineering practice. Support beams of foundations of different sizes were tested. The results for sensitivity analysis are presented in Table 4. B300 × 100 in the table refers to the double-web box beams, measuring 300 cm in height and 100 cm in width.
The calculation results were compared and analyzed, and the following conclusions were drawn: (i) The horizontal vibration of the nodes on the valve hall floor was unaffected by the varying sizes of the foundation beam, and the peak response barely changed. (ii) As the size of the foundation beam increased (i.e., the stiffness of the valve hall floor increased), the peak response of the center of gravity of the marginal valve tower in the horizontal direction gradually decreased. The peak response of the center of gravity of the central valve tower in the horizontal direction barely changed. (iii) The vertical vibration of the valve tower foundation and the center of gravity was insensitive to the changing stiffness of the valve hall floor. The peak response changed very slightly. In general, within the allowable range of parameter values, the dimensions of the foundation support beam had less impact on the vibration response than the stiffness of the valve tower itself.

4.4. Summary and Optimization

The influence patterns of the three sensitivity factors in this section are summarized in Table 5. Thus, the original design scheme was optimized as follows, considering economic efficiency and feasibility. The valve tower stiffness was improved so that the first-order natural frequency increased from 1.0 to 2.0 Hz. The dimensions of the transverse foundation beam at the center of the valve hall on the north and south sides increased from H120 × 40 to H150 × 50. The peak acceleration response in the three directions at each node in the valve tower foundation was calculated under ground-motion input #1 (shown in Figure 12). Comparing Figure 9 with Figure 12 showed that the peak acceleration response at each key position, including the valve tower foundation and the center of gravity, did not exceed 0.2 g in any direction. A dramatic reduction occurred in comparison to the original design. This result shows that an appropriate design of the parameters of the valve tower and its foundation effectively controlled the vibration of the core equipment in the offshore converter platform. More importantly, this improvement did not dramatically increase the weight of the main structure or the equipment cost.
The results of this study are mainly dependent on the structural characteristics of electrical platform and valve tower as well as the external seismic excitation. The structure design is in good conformity with international standards. In addition, the API (American Petroleum Institute) spectrum seismic waves used in this study are widely applicable. Therefore, the application of the present results is not limited to specific countries and regions but has good universality.
Due to the heavy superstructure of the electrical platform, the dynamic response of the structure will produce a significant whipping effect [34,35]; that is, with the increase of elevation, the amplitude of the acceleration response of the structure tends to increase. Considering the whipping effect, it is suggested that during the layout design of the electrical equipment, the valve tower should be arranged on the bottom deck of the platform to reduce the influence of external excitation on the electrical equipment.

5. Conclusions

In this study, a coupling model of the supported valve towers and the converter platform was established using finite element method. The dynamic response of the coupling model was analyzed under seismic excitation. Valve towers in offshore converter platforms are an integral part of valve halls and the overall structure, and the influence of the local vibration of the valve towers should not be simplified by using equivalent mass and node condensation. The coupling analysis should be particularly used to review the structural design scheme of the offshore converter station in the intensity VII region. For achieving reasonable calculations, the vertical higher-order modes should be considered during the vibration response calculation of offshore converter platforms (the participation ratio in mass should not be less than 90%). Additionally, the horizontal vibration response between the valve hall and valve towers of the offshore converter platform is similar to that of an ordinary single-degree-of-freedom system, while the vertical vibrations are integrated. Specifically, the vertical vibration response between the valve hall and valve towers is jointly controlled by multiple orders of vibration modes of the valve hall. A structure that is too rigid or too flexible is unfavorable. The structure-equipment coupling analysis allows for the estimation of a more reasonable frequency interval to minimize the vibration response. Moreover, the stiffness of the valve tower of the offshore converter station itself and that of the foundation jointly determine the peak vibration response. The matched design of the two can effectively suppress the vibration response. It is preferable to adjust the stiffness of the valve tower and apply different stiffness design at different positions for vibration response control. Future research will focus on the physical model test of the dynamic characteristics of the integrated structure of an offshore electrical platform and its internal electrical equipment. Besides the seismic load, the effects of extreme wave and collision load during float-over installation on the dynamic response of the structure will be considered.

Author Contributions

Conceptualization, Z.S. and S.Z.; methodology, Z.S.; software, Z.S.; validation, Z.S., C.B. and Q.C.; formal analysis, S.H.; investigation, J.C. and Q.C.; resources, C.B.; data curation, J.C.; writing—original draft preparation, Z.S. and C.B.; writing—review and editing, C.B. and Q.C.; visualization, J.C. All authors have read and agreed to the published version of the manuscript.

Funding

This research was funded by National Key R&D Program of China (No. 2021YFB2400605), Natural Science Foundation of Zhejiang Province (No. LQ21E090010), Open Fund from the State Key Laboratory of Coastal and Offshore Engineering (No. LP2018) and National Natural Science Foundation of China (NSFC), Grant No. 31972843.

Conflicts of Interest

The authors declare no conflict of interest.

References

  1. Soares-Ramos, E.P.P.; De Oliveira-Assis, L.; Sarrias-Mena, R.; Fernández-Ramírez, L.M. Current status and future trends of offshore wind power in Europe. Energy 2020, 202, 117787. [Google Scholar] [CrossRef]
  2. Mitra, P.; Zhang, L.-D.; Harnefors, L. Offshore wind integration to a weak grid by VSC-HVDC links using power-synchronization control: A case study. IEEE Trans. Power Deliv. 2014, 29, 453–461. [Google Scholar] [CrossRef]
  3. Rehana, R.; Nand, K.; Mohanty, S.R. Off-shore wind farm development: Present status and challenges. Renew. Sustain. Energy Rev. 2014, 29, 780–792. [Google Scholar]
  4. Kalair, A.; Abas, N.; Khan, N. Comparative study of HVAC and HVDC transmission systems. Renew. Sustain. Energy Rev. 2016, 59, 1653–1675. [Google Scholar] [CrossRef]
  5. Ruddy, J.; Meere, R.; O’Donnell, T. Low frequency AC transmission for offshore wind power: A review. Renew. Sustain. Energy Rev. 2016, 56, 75–86. [Google Scholar] [CrossRef]
  6. Mahfouz, M.M.A.; El-Sayed, M.A.H. One-end protection algorithm for offshore wind farm HVDC transmission based on travelling waves and cross-alienation. Electr. Power Syst. Res. 2020, 185, 106355. [Google Scholar] [CrossRef]
  7. Xie, L.-J.; Yao, L.-Z.; Fan, C.; Li, Y.; Liang, S. Coordinate control strategy for stability operation of offshore wind farm integrated with diode-rectifier HVDC. Glob. Energy Interconnect. 2020, 3, 205–216. [Google Scholar] [CrossRef]
  8. Gou, R. Research on 1100 kV/5500 A ultra-high voltage thyristor valve key technology and its application. IEEE Trans. Power Deliv. 2019, 34, 1052410533. [Google Scholar] [CrossRef]
  9. Zhu, R.; Lin, N.; Dinavahi, V.; Liang, G. An accurate and fast method for con-ducted EMI modeling and simulation of MMC-Based HVdc converter station. IEEE Trans. Power Deliv. 2020, 35, 4689–4702. [Google Scholar] [CrossRef]
  10. Liu, X.; Chen, M.; Liang, C.-J.; Tang, H.; Zhang, Q.-G. Investigation on distribution of electro-thermal coupled field and improved design of +1100 kV converter valve-side bushing. IET Sci. Meas. Technol. 2020, 14, 188–197. [Google Scholar] [CrossRef]
  11. Yang, Z.-Y.; Xie, Q.; Zhou, Y.; Mosalam, K.M. Seismic performance and restraint system of suspended 800 kV thyristor valve. Eng. Struct. 2018, 169, 179–187. [Google Scholar] [CrossRef]
  12. He, C.; Xie, Q.; Yang, Z.-Y.; Xue, S.-T. Seismic performance evaluation and improvement of ultra-high voltage wall bushing-valve hall system. J. Constr. Steel Res. 2019, 154, 123–133. [Google Scholar] [CrossRef]
  13. Bang, S.; Kim, H.-S.; Koo, J.-H.; Lee, B.-W. Consideration of the insulation design method on a ±200 kV converter valve unit in an HVDC converter hall. Energies 2021, 14, 2296. [Google Scholar] [CrossRef]
  14. Liu, F.-S.; Li, H.-J. A two-step mode shape expansion method for offshore jacket structures with physical meaningful modelling errors. Ocean Eng. 2013, 63, 26–34. [Google Scholar] [CrossRef]
  15. Liu, F.-S.; Li, H.-J.; Li, W.; Wang, B. Experiment study of improved modal strain energy method for damage localization in jacket-type offshore wind turbines. Renew. Energy 2014, 72, 174–181. [Google Scholar] [CrossRef]
  16. Chen, J.-L.; Zhan, G.-Y.; Zhao, Y. Application of spherical tuned liquid damper in vibration control of wind turbine due to earthquake excitations. Struct. Des. Tall Spec. Build. 2016, 25, 431–443. [Google Scholar] [CrossRef]
  17. Chen, J.-L.; Li, J.-W.; Wang, D.-W.; Feng, Y.-Q. Seismic response analysis of steel-concrete hybrid wind turbine tower. J. Vib. Control 2021, 1–14. [Google Scholar] [CrossRef]
  18. Ekstrom, A.; Eklund, L. HVDC thyristor valve development. IEEE Trans. Power Electron. 1987, PE-2, 177–185. [Google Scholar] [CrossRef]
  19. Larder, R.A.; Gallagher, R.P.; Nilsson, B. Innovative seismic design aspects of the intermountain power project converter stations. IEEE Trans. Power Deliv. 1989, 4, 1708–1714. [Google Scholar] [CrossRef]
  20. Enblom, R.; Coad, J.N.O.; Berggren, S. Design of HVDC converter station equipment subject to severe seismic performance requirements. IEEE Trans. Power Deliv. 1993, 8, 1766–1772. [Google Scholar] [CrossRef]
  21. Lan, D.-N.; Li, J.; Xu, Q.; Chen, J.-Y. Influence of the offshore electrical platform on the dynamic responses of converter valve under sea waves and earthquakes. Ships Offshore Struct. 2021, 16, 1–14. [Google Scholar] [CrossRef]
  22. Tondl, A.; Nabergoj, R. Dynamic absorbers for an externally excited pendulum. J. Sound Vib. 2000, 234, 611–624. [Google Scholar] [CrossRef]
  23. La, V.D. Semi-active on-off damping control of a dynamic vibration absorber using Coriolis force. J. Sound Vib. 2012, 331, 3429–3436. [Google Scholar] [CrossRef]
  24. Sun, Z.-Z.; Bi, C.-W.; Zhao, S.-X.; Dong, G.-H.; Yu, H.-F. Experimental analysis on dynamic responses of an electrical platform for an offshore wind farm under earthquake load. J. Mar. Sci. Eng. 2019, 7, 279. [Google Scholar] [CrossRef] [Green Version]
  25. Zhao, S.-X.; Bi, C.-W.; Sun, Z.-Z. Engineering analysis of the dynamic characteristics of an electrical jacket platform of an offshore wind farm under seismic loads. Appl. Ocean Res. 2021, 112, 102692. [Google Scholar] [CrossRef]
  26. Sun, Z.-Z.; Yu, Y.; Wang, H.-K.; Huang, S.-S.; Chen, J.-F. Dynamic response analysis of offshore converter station based on Vector Form Intrinsic Finite Element (VFIFE) method. J. Mar. Sci. Eng. 2022, 10, 749. [Google Scholar] [CrossRef]
  27. Zhang, D.-L.; Bi, C.-W.; Wu, G.-Y.; Zhao, S.-X.; Dong, G.-H. Laboratory experimental investigation on the hydrodynamic responses of an extra-large electrical platform in wave and storm conditions. Water 2019, 11, 2042. [Google Scholar] [CrossRef] [Green Version]
  28. Wang, J.; Liu, X.; Li, W.; Liu, F.; Hancock, C. Time-frequency extraction model based on variational mode decomposition and Hilbert-Huang transform for offshore oil platforms using MIMU data. Symmetry 2021, 13, 1443. [Google Scholar] [CrossRef]
  29. DNVGL-ST-0145; Offshore Substations. DNV GL AS: Norge, Oslo, 2020.
  30. ISO 19901-3; Petroleum and Natural Gas Industries-Specific Requirements for Offshore Structures-Part 3: Topsides Structure. Interantional Organisation for Standardisation: Geneva, Switzerland, 2014.
  31. Hansteen, O.E.; Bell, K. On the accuracy of mode superposition analysis in structural dynamics. Earthq. Eng. Struct. Dyn. 1979, 7, 405–411. [Google Scholar] [CrossRef]
  32. Günay, S.; Mosalam, K.M. Seismic performance evaluation of high-voltage disconnect switches using real-time hybrid simulation: II. Parametric study. Earthq. Eng. Struct. Dyn. 2014, 43, 1223–1237. [Google Scholar] [CrossRef]
  33. Zhang, B.L.; Han, Q.L.; Zhang, X.M. Recent advances in vibration control of offshore platforms. Nonlinear Dyn. 2017, 89, 755–771. [Google Scholar] [CrossRef]
  34. Cao, Y.; He, E.; Furrer, M. Whipping effect of the seismic response of unbraced tied arch bridges. In Proceedings of the IABSE Conference–Structural Engineering: Providing Solutions to Global Challenges, Geneva, Switzerland, 23–25 September 2015; IABSE Rep. 105. pp. 1679–1686. [Google Scholar]
  35. Yang, L.J.; Liu, D.W.; Guo, Z.L.; Li, J.; Dai, B.H. Engineering mechanics in whipping effect of high-rise building. Appl. Mech. Mater. 2014, 540, 173–176. [Google Scholar]
Figure 1. A physical and finite element model of the offshore converter platform: (a) Physical model; (b) Finite element model.
Symmetry 14 01635 g001
Figure 2. A comparison of the acceleration response of J11 in the time and frequency domains: (a) Time domain; (b) Frequency domain.
Symmetry 14 01635 g002
Figure 3. The valve tower and its finite element model: (a) Valve tower; (b) Finite element model of the valve tower.
Symmetry 14 01635 g003
Figure 4. A comparison of the acceleration responses: (a) Node J4; (b) Node J11.
Symmetry 14 01635 g004
Figure 5. A comparison of the acceleration responses of the base node in valve tower: (a) Y-direction; (b) Z-direction.
Symmetry 14 01635 g005
Figure 6. A finite element model of the converter.
Symmetry 14 01635 g006
Figure 7. The accumulated participation ratio in mass of the offshore converter platform for the vibration modes of the first 100 orders.
Symmetry 14 01635 g007
Figure 8. A comparison of the four inputs of earthquake ground-motion and their spectral features versus CCS spectra: (a) Earthquake ground-motion inputs; (b) Spectral features versus CCS spectra.
Symmetry 14 01635 g008
Figure 9. The peak acceleration response of the foundation and the center of gravity of the valve tower under earthquake ground motion #1: (a) X-direction; (b) Y-direction; (c) Z-direction.
Symmetry 14 01635 g009
Figure 10. The peak difference in vertical displacement at adjacent nodes in the foundation of the valve tower under earthquake ground motion #1: (a) X-direction; (b) Z-direction.
Symmetry 14 01635 g010
Figure 11. The floor response spectra of the valve tower at different positions.
Symmetry 14 01635 g011
Figure 12. The peak acceleration response of the nodes in the foundation of the valve tower under earthquake ground-motion #1 input after optimization: (a) X-direction; (b) Y-direction; (c) Z-direction.
Symmetry 14 01635 g012aSymmetry 14 01635 g012b
Table 1. The peak acceleration responses under different earthquake ground-motion inputs.
Measuring PointEarthquake Ground MotionAcceleration Response (g)
XYZ
Center of foundation of valve tower 2B2#10.050.050.19
#20.050.070.16
#30.050.060.15
#40.050.070.16
Average0.050.060.17
Center of gravity of valve tower 2B3#10.260.100.17
#20.210.120.16
#30.220.110.15
#40.170.130.16
Average0.220.120.16
Table 2. The sensitivity of the peak acceleration response (g) to the order of the truncated modes in the X-direction.
Node No.N
32126355082100
X-directionF0880.050.050.050.050.050.050.05
F1080.050.050.050.050.050.060.06
V0880.060.060.070.070.070.070.07
V1080.060.060.120.200.260.260.26
Z-directionF0880.020.020.060.120.180.190.19
F1080.020.020.040.090.160.170.17
V0880.020.020.060.120.190.200.19
V1080.020.020.040.090.170.170.17
Table 3. The sensitivity of the peak acceleration response (g) to the stiffness of the valve tower.
ParameterValue
Modulus of elasticity0.25E0.50E1.0E4.0E9.0E16E25E50E100E
First-order frequency (Hz)0.530.741.042.053.033.974.876.598.68
X-directionF0880.050.050.050.060.060.060.060.060.06
F1080.060.060.060.060.060.060.060.060.06
V0880.080.070.070.170.080.120.100.070.07
V1080.100.160.260.200.190.170.140.170.14
Z-directionF0880.260.230.190.180.140.120.170.230.23
F1080.220.220.170.160.100.090.130.160.18
V0880.320.260.190.180.140.120.170.230.23
V1080.260.240.170.170.100.090.130.160.18
Table 4. The sensitivity of the peak acceleration response (g) to the stiffness of the valve tower.
Parameter Value
Dimension of the foundation steelH120 × 40H150 × 50H180 × 60H220 × 80H250 × 90B300 × 100
X-directionF0880.050.050.050.050.050.05
F1080.060.050.060.060.060.05
V0880.070.080.080.070.070.09
V1080.260.240.230.220.210.19
Z-directionF0880.190.200.210.210.210.20
F1080.170.170.180.180.180.17
V0880.190.210.220.220.220.21
V1080.170.180.190.190.190.18
Table 5. The sensitivity of the peak acceleration response (g) to the stiffness of the valve tower.
Response/Sensitivity FactorTruncated Mode NStiffness of the Valve Tower EDimension of the Foundation Steel D
SensitivityTrendSensitivityTrendSensitivityTrend
Foundation of the central valve towerHorizontalWeak-Weak-Weak-
VerticalStrongPositively correlatedStrongTrending to a minimumWeak-
Foundation of the marginal valve towerHorizontalWeak-Weak-Weak-
VerticalStrongPositively correlatedStrongTrending to a minimumWeak-
Center of gravity of the central valve towerHorizontalWeak-WeakTrending to a maximumWeak-
VerticalStrongPositively correlatedStrongTrending to a minimumWeak-
Center of gravity of the marginal valve towerHorizontalStrongPositively correlatedStrongTrending to a maximumStrongNegatively correlated
VerticalStrongPositively correlatedStrongTrending to a minimumWeak-
Publisher’s Note: MDPI stays neutral with regard to jurisdictional claims in published maps and institutional affiliations.

