Article

Effects of Tip Clearance and Impeller Eccentricity on the Aerodynamic Performance of Mixed Flow Fan

Department of Mechanical and Energy Engineering, Zhejiang University of Science and Technology, Hangzhou 310023, China
*
Author to whom correspondence should be addressed.
Symmetry 2023, 15(1), 201; https://doi.org/10.3390/sym15010201
Submission received: 2 December 2022 / Revised: 5 January 2023 / Accepted: 6 January 2023 / Published: 10 January 2023
(This article belongs to the Special Issue Symmetry in CFD: Convection, Diffusion and Dynamics)

Abstract

:
The tip clearance and eccentricity of the impeller will affect the aerodynamic performance of the fan, and the impeller installation and vibration characteristics are relatively highly required if the tip clearance is too small. A reasonable tip clearance and excellent coaxially are necessary to ensure that the impeller does not rub with the shell and has superior aerodynamic performance when the fan is working. In the current study, a mixed flow fan was taken as the object and experimental explorations were performed on the C-type test rig designed according to GB/T1236 2000 Industrial fans-performance testing using standardized airways. By moving the airways to change the tip clearance, it was found that an overlarge tip clearance made the fan efficiency decrease significantly, and the efficiency change gradient was large. However, the gradient of efficiency change became smaller when reaching a certain clearance. Similarly, as the eccentricity became larger, the efficiency also decreased. To explore the influence of the optimal clearance and eccentricity of the fan on the fan’s performance, numerical simulations of the flow field inside the fan were carried out using FLUENT software corresponding to the experimental conditions. The influence of the tip clearance and eccentricity on the aerodynamic performance of the fan was revealed from the energy leakage perspective. Through theoretical and experimental analysis, we try to provide guidance on the design, installation and commissioning of fan tip clearance.

1. Introduction

As a kind of cooling device, mixed flow fans have been widely used in machinery, petroleum, mining, and other fields. The problems of tip clearance and rotor misalignment frequently occur during installation, since the fan blades and impeller cover are conical. The eccentricity due to rotor misalignment and tip clearance are important parameters affecting fan performance and are indispensable measurement parameters for fan development and testing [1]. Excessively small clearances or overlarge eccentricities can cause the blade tip to touch and rub against the impeller cover [2,3], while high speed mechanical friction can damage the entire engine hardware [4,5]. In the past decades, scholars have conducted intensive research and made significant progress on this issue.
Jung and Luo et al. argued that tip clearance has a significant impact on fan performance [6,7]. Pelz and Suriyanarayanan et al. exposed that variation in tip clearance affects stability boundaries and performance [8,9]. Li et al. studied the effect of tip clearance leakage flow on a rotating stall, and found that mixed flow pumps are more likely to stall under small tip clearances. With the increase of tip clearance, tip leakage vortices develop radially towards the middle of the flow passage, and severe flow separation occurs in the downstream passage, leading to deep stall [10]. Pretorius believed that the tip vortex can be reduced to improve fan performance and experimentally found that increasing the tip clearance imposes a negative impact on the static pressure efficiency of the fan [11]. The axial fan tip vortex system was analyzed by Moghadam via high resolution large vortex simulations. It was pointed out that as the tip clearance grows, tip leakage, separation, and induced vortices occur in the tip clearance region, thereby decreasing the fan efficiency [12]. This is because as a rotating component, the power of the fan impeller depends on the airflow flowing through the blade area. The presence of tip clearance causes a portion of the airflow to flow away without doing any work and damaging the flow path, and the efficiency of the fan is subsequently decreased [13]. Meanwhile, strong tip leakage vortices lead to premature rotational instability [14]. Therefore, in order to improve fan performance, it is necessary to minimize the tip leakage flow through the clearance as much as possible [15]. Yet, too small tip clearance can cause blade deformation due to friction with the casing, and its structural health can be compromised [16].
In the actual manufacture of rotating machinery, quality asymmetries caused by casting, machining accuracy, and assembly errors will lead to the presence of some eccentricity [17,18]. Ren et al. used a combination of a separated vortex simulation and an acoustic finite element method to investigate the aerodynamic noise of a centrifugal fan with an eccentric impeller and found that the rotational frequency due to the eccentric effect of the impeller was significantly higher under eccentric conditions [19]. Tao et al. added a small eccentricity to the impeller in their simulation of a mixed-flow pump, capturing a 50 Hz pressure pulsation in both computational and experimental results that were not predicted in the simulation using a normal impeller [20]. Cao et al. investigated the effect of impeller eccentricity on centrifugal pump performance and verified that efficiency decreased with increasing eccentricity.
In this paper, a mixed flow fan was taken as the object and experimental explorations were performed on a C-type test rig designed according to GB/T1236 2000 Industrial fans-performance testing using standardized airways. By moving the airways to change the tip clearance, it was found that an overlarge tip clearance made the fan efficiency decrease significantly, and the efficiency change gradient was large. However, the gradient of efficiency change became smaller when reaching a certain clearance. Similarly, with an increase of eccentricity, the efficiency also decreases. To deeply understand the influence of these two factors on the fan performance and reveal the cause of energy leakage caused by clearance and eccentricity, FLUENT software was used to conduct numerical simulations of the flow field inside the fan corresponding to the experimental conditions. The calculation and analysis of the internal flow field further enhance the understanding of the physical phenomena of the flow in the fan. A reasonable clearance range and eccentric error range are given through theoretical and experimental analysis, which guides the design, installation, and commissioning of fan blade tip clearance.

2. Experimental Scheme and Result Analysis
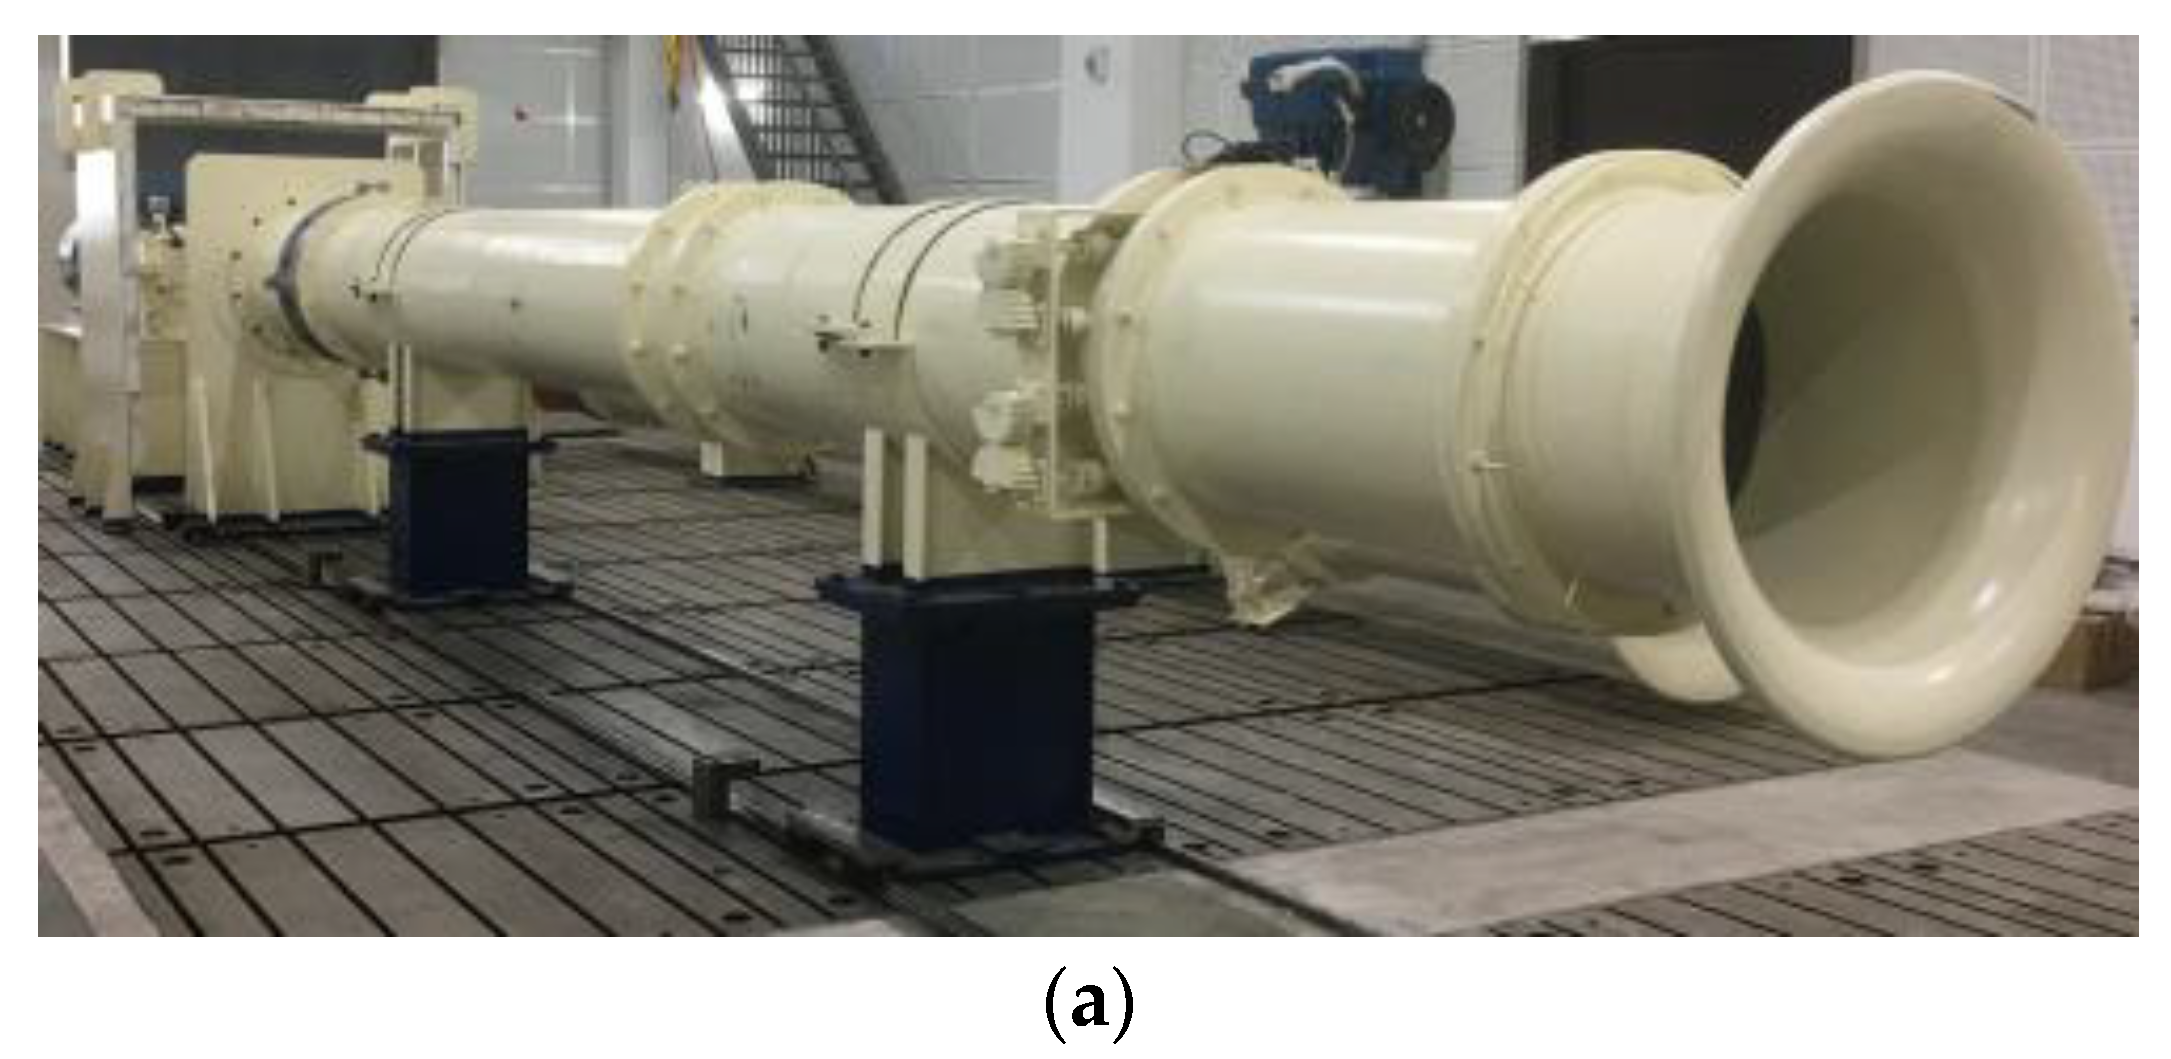
2.1. Test Device

Based on the GB/T1236 2000 Industrial fans-performance testing using standardized airways, a test rig was the designed, of which the C-type test rig, airways inlet, and free outlet are shown in Figure 1.
The whole device consisted of an inlet, flow control valve, airways, rectifier grid, torque meter, fan, drive motor, and other components. The following parameters were measured by sensors: atmospheric pressure, temperature and humidity, flow rate, and static pressure of the fan inlet. The measured results were calculated and processed using the system software for the collected signals, and the parameters to be measured are demonstrated in Table 1.
The experiment realized various automatic detection of fan performance parameters, including flow rate adjustment, processing of experimental data, drawing of performance curves, and measurement of fan vibration. The experimental conditions are shown in Table 2.
Each sensor converts the detected physical quantities, such as pressure, temperature, humidity, torque, and noise, into electrical signals, which are transmitted to the computer via analog-to-digital conversion. The system software calculates and processes the collected signals and saves them as fan performance parameters. When a working point test is completed, the automatic adjustment of the fan working condition is realized by the flow adjustment device. After the parameters are stabilized, the data collection of the next working point will be started, and the above process will be repeated until the tes0t data collection of all working points is completed. After the test, the performance parameters of each working point of the fan are calculated from the original data, and then according to the set standard atmospheric parameters and rated speed.
After the performance conversion of each performance parameter to the standard state, (detailed formula see GB/T1236 2000 Industrial fans-performance testing using standardized airways), the fan is used in the standard state of the performance parameters with a sample interpolation method for curve fitting, enabling the drawing of a fan performance curve.
The impeller diameter of the mixed flow fan used was 0.62 m, and equipped with 9 blades (a hub diameter of 0.11 m). There was no guide vane before or after the fan, the inlet area and the outlet area were respectively 0.283 m2 and 0.221 m2, and the fan speed was set at 5000 rpm.

2.2. Experimental Setup

To realize the function of changing the impeller’s installation position relative to the housing, the airways support mechanism was made into a split type and divided into an upper part and a lower part. As shown in Figure 1a, the lower part of the airways was fixed on the guiding straight of the ground guide, thus realizing the front and rear sliding to adjust the bearing position. The eccentricity between the impeller and the housing was changed by adding padded rubber pads between the two split devices above (Figure 2b).

2.3. Experimental Results

2.3.1. Effect of Clearance on Fans-Performance Testing

The airways were moved closer to the impeller so that the installation clearance was 7.2 mm, 5 mm, 4 mm, 3 mm, 2.5 mm, 2 mm, and 1.5 mm in that order.
In accordance with the measured parameters (e.g., inlet differential pressure, downstream inlet static pressure, torque, and rotational speed), the fan performance parameters were calculated and converted to the standard condition. The performance curve was plotted using Hermite’s differential equation based on cubic Hermite polynomials, ensuring that the curve did not exceed the target value and would not produce large oscillations.
The comparison of total pressure efficiency and static pressure efficiency under different clearances is shown in Figure 3.
It can be seen that the tip clearance has little effect on the total pressure efficiency and static pressure efficiency under a flow rate of 0~4 m3/s. As the flow rate increased, the static pressure efficiency and total pressure efficiency first increased to the highest efficiency point and then declined. Smaller clearances had higher static and total pressure efficiency, but clearance and efficiency do not show a linear relationship.
At a flow rate greater than 4 m3/s, increasing the clearance beyond 3 mm has a great impact on the gradient of fan efficiency change. Increasing the clearance size from 3 mm to 7.2 mm reduces the maximum static pressure efficiency and maximum total pressure efficiency by 18.68% and 30.04%, respectively. If the clearance is less than 2.5 mm, increasing the clearance has less effect on the gradient of fan efficiency change. At the same time, increasing the clearance size from 2 mm to 2.5 mm results in the maximums of static pressure efficiency and total pressure efficiency decreasing by 2.7% and 4%, respectively. When the clearance size increases from 1.5 mm to 2 mm, the efficiency curves remain extremely close.
During the installation process, minimizing the clearance at the tip of the leaves is conducive to improving the aerodynamic performance of the fan. Considering that the vibration generated by the fan work will lead to touch rubbing, and combined with comprehensive experimental results, the recommended installation clearance is between 1.5 mm and 2.5 mm.

2.3.2. Effect of Eccentricity on Fans-Performance Testing

The total pressure efficiency and static pressure efficiency of the fan at different eccentricity rates are depicted in Figure 4. From the figure, it is apparent that the size of eccentricity has little effect on the total pressure efficiency or static pressure efficiency of the fan when the eccentricity is 0~5 m3/s. As the flow rate increases, the static pressure efficiency and total pressure efficiency increase to the maximum value but decline subsequently. In addition, the smaller the eccentricity, the higher the static pressure efficiency and total pressure efficiency.
When the flow rate is greater than 5 m3/s, increasing the eccentricity beyond 20% imposes a huge impact on the gradient of fan efficiency change, the eccentricity increases from 20% to 60%, and the maximum static pressure efficiency and the maximum total pressure efficiency decrease by 8.28% and 15.73%, respectively. When the eccentricity increases from 10% to 20%, the fan efficiency change gradient is smaller, and the maximum static pressure efficiency and the maximum total pressure efficiency decrease by 0.77% and 5.36%, respectively. Hence, reducing the eccentricity is beneficial to improve the aerodynamic performance of the fan when installing the impeller, and the eccentricity error should preferably be controlled within 10%.

3. Modeling and Simulation

To reveal the characteristics of clearance and eccentricity on flow losses, numerical simulations are performed under the same operating conditions. The computational analysis of the internal flow field further enhances the understanding of the physical phenomena of the internal flow of the fan [21,22], thus providing a basis for the design as well as the installation and commissioning of the fan.

3.1. Numerical Simulation Method

3.1.1. Modeling

When constructing the impeller model, the model is simplified to not only ensure that the mesh near the impeller is close to the impeller, but also ensure the quality of the mesh. Geometric features, such as grooves on the impeller hub, and small geometric structures, such as small fillets, small chamfers, small holes, on the model are removed. As shown in Figure 5, the hub is replaced by a cone.
After the model was simplified in the UG, it was imported into Design Modeler (DM) software. This imported model is repaired with small features, and the fluid domain is extracted in DM. As observed in Figure 6, the fluid domain is divided into inlet fluid domain, outlet fluid domain, and impeller rotating fluid domain due to the different requirements for the grid quality of the different fluid domains.

3.1.2. Mesh Division

In the meshing of the inlet section, structured meshes are used for the inlet section, and unstructured meshes are used in the conical section for better connection with the impeller area mesh.
It is difficult to achieve the complex shape of the impeller rotating fluid domain using a structured mesh. In order for the mesh to fit the blade surface better, an unstructured mesh of 8 mm is used for this region, further encryption is needed in the tip region, and curvature is used for the blade.
The outlet section area mainly provides several grid encryptions at the exit of the impeller outer cover. Therefore, the region is divided at the exit of the impeller outer cover, and an unstructured grid of 8 mm is used for local encryption in this region.
The overall grid side length is set to 60 mm, and the overall grid number is about 7.6 million grids.

3.1.3. Solution Method and Boundary

There is no heat exchange during the flow, thus the energy conservation equation is not considered. This stems from the idea that the air is considered an incompressible fluid. The gas is in a steady-state flow, thus constant calculations are used and the effect of gravity on the flow field is neglected. The realizable k-ε model is selected as the turbulence model [23], and the standard wall function is used at the near wall surface, and the simple algorithm is used for the pressure-velocity coupling [24]. The momentum equation, turbulent kinetic energy phase, and turbulent dissipative phase, are discretized by means of a first-order windward format method. The convergence criterion is defined as the residuals of all monitoring terms being less than 1 × 10⁻³.
Boundary setting:
  • The inlet is set as mass flow inlet, and the velocity direction is perpendicular to the inlet boundary.
  • A pressure outlet is used for the outlet and the static pressure is set at zero.
  • The fixed walls all adopt the no-slip boundary condition.
Zone settings:
  • The inlet section and outlet section are stationary zones, the impeller zone is rotating zone, and the stationary and rotating zones are connected using the intersection interface.
  • The rotational speed of the impeller region is set to 5000 rpm, and the impeller wall surface is used as the rotational coordinate system and moves with the rotational region.

3.1.4. Grid Independence Verification

In the process of the numerical simulations of the model, the verification of grid independence is required. For each scenario, the same boundary conditions and solvers are used for the simulation calculations, and the simulation results are processed to obtain the total pressure efficiency for each scenario, as shown in Table 3.

3.2. Numerical Simulation Results

3.2.1. Efficiency Calculation of Fan

The total pressure of the fan is defined as the sum of the static pressure difference between the cross section of the fan’s import and export and the axial dynamic pressure difference, while the rotating dynamic pressure of the fan’s export is not counted in the total pressure of the fan; thus Equation (1) can be obtained:
p t = p s t 2 p s t 1 + 1 2 ρ [ ( q v A 2 ) 2 ( q v A 1 ) 2 ]
where pst2 and pst1 are the static pressure at the outlet and inlet of the fan, respectively; ρ denotes the air density; qv represents the volume flow; A2 and A1 are the outlet and inlet area of the fan, respectively.
The shaft power of the fan is:
P a = T n 9550
where T and n represent the torque and speed of the fan, respectively.
Total pressure efficiency is:
η t = p t q v 1000 P a
Static pressure efficiency is:
η t s = ( p s t 2 p s t 1 ) q v 1000 P a

3.2.2. Analysis of the Effect of Tip Clearance on Fans-Performance Testing

The chosen sizes of the tip clearances are 1.5 mm, 2 mm, 2.5 mm, 3 mm, 4.2 mm, 5.4 mm, and 7.2 mm. At each clearance, the inlet flow is equal to 4.90 m3/s, 6.53 m3/s, 8.16 m3/s, 9.00 m3/s, 9.80 m3/s, 11.42 m3/s, 12.24 m3/s, and 14.70 m3/s.
As shown in Figure 7, based on the calculation results processed with the help of CFD-post, the total pressure efficiency and static pressure efficiency of the fan are further obtained.
When the air flow is small, the clearance has few effects on the static pressure and total pressure efficiencies. The static pressure efficiency and total pressure efficiency both increase and then decrease with an increase in flow rate. At the same time, the smaller the clearance, the higher the static pressure efficiency and total pressure efficiency. When the tip clearance increased from 1.5 mm to 2.5 mm, the maximum static pressure efficiency and maximum total pressure efficiency decreased by 1.26% and 1.76%, respectively. The maximum static pressure efficiency and maximum total pressure efficiency decreased by 18.87% and 22.84%, respectively, when the tip clearance ulteriorly increased from 3 mm to 7.2 mm. The static pressure efficiency curves of the blade tip clearance between 1.5–2.5 mm are closer to each other, which is closer to the experimental results.
To analyze the influence of clearance on speed, the longitudinal section of the impeller is taken to observe the velocity distribution at the tip clearance of the impeller in the circle out position, as shown in Figure 8.
The velocity distributions at the tip clearances of 1.5 mm, 2.5 mm, 3 mm, 4.2 mm, and 7.2 mm at a flow rate of 9.8 m3/s are shown in Figure 9. It is evident that the flow direction at the tip clearance is opposite to the mainstream direction, i.e., the formation of backflow phenomenon. Meanwhile, a vortex is generated on the suction surface of the impeller. This can be attributed to the airflow at the tip area of the impeller flowing from the impeller pressure surface through the tip clearance to the impeller suction surface. A leakage flow at the tip clearance leads to a leakage vortex near the clearance.
Simultaneously, the discharge capacity, the size of the leakage vortex, and the affected area become larger with an increase in tip clearance. This leads to the movement of the vortex nucleus along the radial center, and the obstruction of the vortex nucleus to the main stream increases, resulting in increased flow loss. When the clearance is located in a range of 1.5 mm to 2.5 mm, the leakage vortex size is similar, indicating that the energy consumption is similar. Hence, the effect on the efficiency is very small.
Since the leakage flow forms leakage vortices of different sizes in the impeller passage under different clearances, it has a large impact on the flow field of the impeller. Therefore, the influence of leakage flow with different clearances on the flow field is investigated. In order to observe the turbulent kinetic energy at the clearance, the transverse section of the impeller is taken as shown in Figure 10.
The turbulent kinetic energy distributions of the impeller cross-section at a flow rate of 9.8 m3/s and at different clearances are depicted in Figure 11.
The turbulent kinetic energy increases with the increase of tip clearance. As a result of the influence of leakage flow at the clearance, when the clearance increases, the leakage vortex also increases accordingly.
The analysis of the numerical simulation results shows that too large of a tip clearance will lead to more airflow with pressure flowing towards the suction surface and the formation of a larger leakage vortex, thus leading to a decrease in fan efficiency. When the clearance is 1.5~2.5 mm, the efficiency of the fan is less affected by the clearance. This is almost consistent with the conclusion of the above experimental results. Therefore, the tip clearance should be installed in this clearance range, whenever possible, to improve the aerodynamic performance of the fan.

3.2.3. Analysis of the Effect of Eccentric on Fans-Performance Testing

Keeping the clearance at 3 mm and the inlet flow rate at 9.8 m3/s, the size of the eccentricity distance (e) can be changed to analyze the fan performance changes at different eccentricity rates (0%, 10%, 30%, 50%, and 60%). At each eccentricity, the inlet flow is 4.90 m3/s, 6.53 m3/s, 8.16 m3/s, 9.00 m3/s, 9.80 m3/s, 11.42 m3/s, 12.24 m3/s, and 14.70 m3/s.
The total pressure efficiency and static pressure efficiency of the fan are obtained by processing the calculation results through CFD-post (Figure 12). The total pressure efficiency and static pressure efficiency of the fan decrease with the increase in eccentricity of the impeller. When the flow rate is too small or too large, the eccentricity has little effect on the static pressure and total pressure efficiency. Nevertheless, at the highest efficiency point, which is also the working point of the fan, the eccentricity has a great influence on the efficiency. An increase in eccentricity from 0% to 10% decreased the maximum static efficiency and maximum full-pressure efficiency by 0.23% and 0.14%, respectively. Subsequently, the maximum static pressure efficiency and maximum total pressure efficiency decreased by 1.31% and 1.54%, respectively, due to the increase in eccentricity from 20% to 60%. Therefore, the requirements for the coaxiality during installation are relatively increased.
To analyze the effect of eccentricity on the velocity, the cross section shown in Figure 13 is intercepted and the velocity distribution of the impeller is observed at the circled position.
The velocity and streamline distribution of the impeller corresponding to the position indicated in Figure 13 with eccentricities of 10%, 30%, and 60% are described in Figure 14. It is obvious that the downward eccentricity of the impeller leads to the increase of the leakage at the clearance of the upper part of the impeller. The airflow from the pressure surface to the suction surface at the clearance of upper part of the impeller increases, and the size and range of the leakage vortex increases, as the eccentricity increases.
Figure 15 shows the turbulent kinetic energy diagrams of the impeller at the cross-section of Figure 13 for eccentricities of 10%, 30%, and 60%. With regard to this figure, it can be seen that the turbulent kinetic energy in the upper part of the impeller is larger than that in the lower part of the impeller. The larger the eccentricity, the higher the turbulent kinetic energy at the clearance of the upper part of the impeller. This stems from the downward eccentricity of the impeller, which causes the clearance in the upper part of the impeller to be larger than the clearance in the lower part, resulting in more airflow in the upper part of the impeller passing through the clearance and leaking to the suction surface, and thus the size and scope of the leakage vortex are larger.
It is also found that the larger the eccentricity, the larger the turbulent kinetic energy at the clearance of the upper part of the impeller. This is because with the increase of eccentricity, the clearance in the upper half of the impeller expands further, which leads to the increase of leakage volume and the increase of leakage vortex.

4. Conclusions

In this study, the influence of tip clearance and eccentricity on the aerodynamic experimental performance of a fan were analyzed from both experimental and numerical calculations, and the following conclusions are obtained:
(1) As the tip clearance becomes larger, both the fan’s total pressure efficiency and static pressure efficiency decrease. The turbulent kinetic energy increases with the increase of tip clearance. The airflow at the blade tip area flows from the impeller pressure surface to the impeller suction surface through the blade tip clearance. A leakage flow at the tip clearance leads to a leakage vortex near the clearance. As the flow rate increases, the influence of the backflow vortex in the tip clearance on the total pressure efficiency and static pressure efficiency increases. The efficiency curves are closer when the tip clearance is approximately 1.5 mm–2.5 mm, indicating that the effect of clearance on efficiency becomes weaker. Considering that the clearance is too small, the risk of impeller and wall rubbing will be increased, resulting in damage to the test system. Therefore, in accordance with comprehensive consideration, 1.5–2.5 mm is deemed as the recommended installation clearance.
(2) The larger eccentricity of the impeller, the lower total pressure efficiency and static pressure efficiency of the fan. The downward eccentricity of the impeller leads to a larger clearance in the upper part of the impeller than in the lower part, resulting in more airflow through the clearance to the suction surface in the upper part, and a larger leakage vortex size and range. It is also found that the larger the eccentricity, the larger the turbulent kinetic energy at the clearance of the upper part of the impeller. This is because with the increase of eccentricity, the clearance in the upper half of the impeller expands further, which leads to the increase of leakage volume and the increase of leakage vortex. Regardless of whether the flow rate is too small or too large, the eccentricity has little effect on the static pressure and total pressure efficiency. However, the highest efficiency point is also the working point of the fan, and the eccentricity still has a greater impact on the efficiency. Hence, the coaxiality requirements of the installation are increased, and controlling the eccentricity within 10% is the most appropriate.

Author Contributions

Conceptualization, S.L., Y.G. and Y.Z.; Methodology, S.L., Y.G. and Y.Z.; Software, Y.G. and Y.Z.; Validation, Y.G. and C.G.; Formal Analysis, S.L. and Y.G.; Investigation, S.L. and L.Y.; Resources, S.L. and L.Y.; Data curation, Y.G. and Y.Z.; Writing—original draft preparation, Y.G.; Writing—review and editing, S.L. and Y.G.; Visualization, S.L., Y.G. and C.G.; Supervision, S.L.; Project administration, Y.G., Y.Z. and C.G.; Funding acquisition, S.L. and L.Y. All authors have read and agreed to the published version of the manuscript.

Funding

This research was funded by National Research Fund for Studying Abroad (2014-1685): Research on fluid structure coupling method of rotor bearing system including journal inclination.

Data Availability Statement

The data supporting reported results by the authors can be sent by e-mail.

Conflicts of Interest

The authors declare no conflict of interest.

References

  1. Satish, T.N.; Rao, A.N.V.; Nambiar, A.S.; Uma, G.; Umapathy, M.; Chandrashekhar, U.; Petley, V.U. Investigation into the Development and Testing of a Simplex Capacitance Sensor for Rotor Tip Clearance Measurement in Turbo Machinery. Exp. Tech. 2018, 42, 575–592. [Google Scholar] [CrossRef]
  2. John, A.; Qin, N.; Shahpar, S. The Impact of Realistic Casing Geometries and Clearances on Fan Blade Tip Aerodynamics. J. Turbomach. 2018, 140, 061002. [Google Scholar] [CrossRef]
  3. Mokhtari, N.; Pelham, J.G.; Nowoisky, S.; Bote-Garcia, J.L.; Gühmann, C. Friction and wear monitoring methods for journal bearings of geared turbofans based on acoustic emission signals and machine learning. Lubricants 2020, 8, 29. [Google Scholar] [CrossRef] [Green Version]
  4. Satish, T.N.; Murthy, R.; Singh, A.K. Analysis of uncertainties in measurement of rotor blade tip clearance in gas turbine engine under dynamic condition. Proc. Inst. Mech. Eng. Part G-J. Aerosp. Eng. 2014, 228, 652–670. [Google Scholar] [CrossRef]
  5. Fan, T.; Behdinan, K. The Evaluation of Linear Complementarity Problem Method in Modeling the Fluid Cavitation for Squeeze Film Damper with Off-Centered Whirling Motion. Lubricants 2017, 5, 46. [Google Scholar] [CrossRef] [Green Version]
  6. Jung, U.-H.; Kim, J.-H.; Kim, S.; Kim, J.-H.; Choi, Y.-S. Analyzing the shape parameter effects on the performance of the mixed-flow fan using CFD & Factorial design. J. Mech. Sci. Technol. 2016, 30, 1149–1161. [Google Scholar] [CrossRef]
  7. Luo, D.; Huang, D.; Sun, X.; Chen, X.; Zheng, Z. A Computational Study on the Performance Improvement of Low-Speed Axial Flow Fans with Microplates. J. Appl. Fluid. Mech. 2017, 10, 1537–1546. [Google Scholar] [CrossRef]
  8. Pelz, P.F.; Saul, S.; Broetz, J. Efficiency Scaling: Influence of Reynolds and Mach Numbers on Fan Performance. J. Turbomach. 2022, 144, 061001. [Google Scholar] [CrossRef]
  9. Suriyanarayanan, V.; Rendu, Q.; Vahdati, M.; Salles, L. Effect of Manufacturing Tolerance in Flow Past a Compressor Blade. J. Turbomach. 2022, 144, 041005. [Google Scholar] [CrossRef]
  10. Li, W.; Ji, L.; Li, E.; Zhou, L.; Agarwal, R.K. Effect of Tip Clearance on Rotating Stall in a Mixed-Flow Pump. J. Turbomach. 2021, 143, 091013. [Google Scholar] [CrossRef]
  11. Pretorius, J.P.; Erasmus, J.A. Effect of Tip Vortex Reduction on Air-Cooled Condenser Axial Flow Fan Performance: An Experimental Investigation. J. Turbomach. 2022, 144, 031001. [Google Scholar] [CrossRef]
  12. Moghadam, S.M.A.; Meinke, M.; Schroeder, W. Analysis of tip-leakage flow in an axial fan at varying tip-gap sizes and operating conditions. Comput. Fluids 2019, 183, 107–129. [Google Scholar] [CrossRef]
  13. Yu, B.; Ke, H.; Shen, E.; Zhang, T. A review of blade tip clearance-measuring technologies for gas turbine engines. Meas. Control. 2020, 53, 339–357. [Google Scholar] [CrossRef] [Green Version]
  14. Fan, C.; Adjei, R.A.; Wu, Y.; Wang, A. Parametric study on the aerodynamic performance of a ducted-fan rotor using free-form method. Aerosp. Sci. Technol. 2020, 101, 105842. [Google Scholar] [CrossRef]
  15. Lee, S.I.; Kang, Y.J.; Kim, W.J.; Kwak, J.S.; Kim, T.S.; Kim, D.H.; Jung, I.Y. Effects of tip clearance, number of teeth, and tooth front angle on the sealing performance of straight and stepped labyrinth seals. J. Mech. Sci. Technol. 2021, 35, 1539–1547. [Google Scholar] [CrossRef]
  16. Miguel Gil-Garcia, J.; Zubia, J.; Aranguren, G. Architecture for Measuring Blade Tip Clearance and Time of Arrival with Multiple Sensors in Airplane Engines. Int. J. Aerosp. Eng. 2018, 2018, 3756278. [Google Scholar] [CrossRef] [Green Version]
  17. Cao, W.D.; Yao, L.J.; Liu, B.; Zhang, Y.N. The influence of impeller eccentricity on centrifugal pump. Adv. Mech. Eng. 2017, 9, 1687814017722496. [Google Scholar] [CrossRef] [Green Version]
  18. Huang, H.-C.; Yang, S.-H. Thrust-Bearing Layout Design of a Large-Sized Hydrostatic Rotary Table to Withstand Eccentric Loads for Horizontal Boring Machine Applications. Lubricants 2022, 10, 49. [Google Scholar] [CrossRef]
  19. Ren, K.-X.; Shuai, Z.-J.; Wang, X.; Jian, J.; Yu, T.; Dong, L.-Y.; Li, W.-Y.; Jiang, C.-X. Aerodynamic noise prediction of a high-speed centrifugal fan considering impeller-eccentric effect. Eng. Appl. Comp. Fluid. 2022, 16, 780–803. [Google Scholar] [CrossRef]
  20. Tao, R.; Xiao, R.F.; Liu, W.C. Investigation of the flow characteristics in a main nuclear power plant pump with eccentric impeller. Nucl. Eng. Des. 2018, 327, 70–81. [Google Scholar] [CrossRef]
  21. Lun, Y.X.; Lin, L.M.; He, H.J.; Ye, X.X.; Zhu, Z.C.; Wei, Y.K. Effects of vortex structure on performance characteristics of a multiblade fan with inclined tongue. Proc. Inst. Mech. Eng. Part A-J. Power Energy 2019, 233, 1007–1021. [Google Scholar] [CrossRef]
  22. Zhu, T.; Carolus, T.H. Axial fan tip clearance noise: Experiments, Lattice-Boltzmann simulation, and mitigation measures. Int. J. Aeroacoust. 2018, 17, 159–183. [Google Scholar] [CrossRef]
  23. Akin, A.; Kahveci, H.S. Effect of turbulence modeling for the prediction of flow and heat transfer in rotorcraft avionics bay. Aerosp. Sci. Technol. 2019, 95, 105453. [Google Scholar] [CrossRef]
  24. Zhu, L.F.; Jin, Y.Z.; Li, Y.; Jin, Y.Z.; Wang, Y.P.; Zhang, L. Numerical and Experimental Study on Aerodynamic Performance of Small Axial Flow Fan with Splitter Blades. J. Therm. Sci. 2013, 22, 333–339. [Google Scholar] [CrossRef]
Figure 1. Fan performance test rig. (a) Physical drawing of test rig. (b) Structural diagram, where: 1, inlet; 2, inlet differential pressure measuring hole; 3, flow control valve; 4, rectifying grid; 5, anemometer propulsion device; 6, static pressure measuring hole; 7, conical connecting pipe; 8, protective cover; 9, test fan; 10, connecting shaft; 11, torque meter; 12, high-speed gearbox; 13, AC variable frequency motor; 14, fan support; 15, motor base.
Symmetry 15 00201 g001aSymmetry 15 00201 g001b
Figure 2. Schematic diagram of tip clearance and impeller eccentricity: (a) tip clearance; (b) impeller eccentricity.
Symmetry 15 00201 g002
Figure 3. Comparison of efficiency under different clearances: (a) comparison of static pressure efficiency under different clearances; (b) Comparison of total pressure efficiency under different clearances; (c) comparison of peak efficiency under different clearances.
Symmetry 15 00201 g003
Figure 4. Comparison of efficiency under different eccentricities: (a) comparison of static pressure efficiency under different eccentricities; (b) comparison of total pressure efficiency under different eccentricities; (c) comparison of peak efficiency under different eccentricities.
Symmetry 15 00201 g004
Figure 5. Impeller model.
Symmetry 15 00201 g005
Figure 6. Fluid domain.
Symmetry 15 00201 g006
Figure 7. Comparison of efficiency under different clearances: (a) comparison of static pressure efficiency under different clearances; (b) comparison of total pressure efficiency under different clearances; (c) comparison of peak efficiency under different clearances.
Symmetry 15 00201 g007
Figure 8. Section position.
Symmetry 15 00201 g008
Figure 9. Tip clearance velocity distribution: (a) clearance: 1.5 mm; (b) clearance: 2.5 mm; (c) clearance: 3 mm; (d) clearance: 4.2 mm; (e) clearance: 7.2 mm.
Symmetry 15 00201 g009
Figure 10. Impeller section.
Symmetry 15 00201 g010
Figure 11. Turbulent kinetic energy diagram of tip clearance: (a) 1.5 mm; (b) 2.5 mm; (c) 3 mm; (d) 4.2 mm; (e) 7.2 mm.
Symmetry 15 00201 g011
Figure 12. Comparison of efficiency under different eccentricities: (a) comparison of static pressure efficiency under different eccentricities; (b) comparison of total pressure efficiency under different eccentricities; (c) comparison of peak efficiency under different eccentricities.
Symmetry 15 00201 g012
Figure 13. Impeller eccentricity diagram.
Symmetry 15 00201 g013
Figure 14. Velocity distribution at the clearance with different eccentricity: (a) 10%; (b) 30%; (c) 60%.
Symmetry 15 00201 g014
Figure 15. Turbulent kinetic energy at different eccentricities: (a) 10%; (b) 30%; (c) 60%.
Symmetry 15 00201 g015
Table 1. Test parameters.
Serial NumberMeasurement Parameters (Units)
1Atmospheric pressure (Pa)
2Temperature (°C)
3Humidity (RH)
4Static pressure at fan inlet (Pa)
5Pipeline downstream pressure (Pa)
6Rotational speed (r/min)
7Torque (N∙m)
Table 2. Experimental condition.
Measurement ParametersValueMeasurement ParametersValue
Atmospheric temperature (°C)26.3Standard speed (rpm)5000
Saturated vapor pressure (Pa)3422.59Airways diameter (mm)600
Relative humidity (%)20.74Impeller diameter (mm)620
Atmospheric pressure (Pa)101,655
Table 3. Grid division scheme.
ScenarioNumber of GridsTotal Pressure Efficiency
13,343,36557.01%
26,396,62764.78%
36,814,08565.17%
47,601,49065.24%
58,565,47465.29%
Disclaimer/Publisher’s Note: The statements, opinions and data contained in all publications are solely those of the individual author(s) and contributor(s) and not of MDPI and/or the editor(s). MDPI and/or the editor(s) disclaim responsibility for any injury to people or property resulting from any ideas, methods, instructions or products referred to in the content.

