Review

Transport Barriers in Geophysical Flows: A Review

by
Sergey Prants
V.I. Il’ichev Pacific Oceanological Institute, Russian Academy of Sciences, 43 Baltiyskaya St., 690041 Vladivostok, Russia
Symmetry 2023, 15(10), 1942; https://doi.org/10.3390/sym15101942
Submission received: 19 August 2023 / Revised: 25 September 2023 / Accepted: 17 October 2023 / Published: 20 October 2023
(This article belongs to the Special Issue Geophysical Fluid Dynamics and Symmetry)

Abstract

:
In the Lagrangian approach, the transport processes in the ocean and atmosphere are studied by tracking water or air parcels, each of which may carry different tracers. In the ocean, they are salt, nutrients, heat, and particulate matter, such as plankters, oil, radionuclides, and microplastics. In the atmosphere, the tracers are water vapor, ozone, and various chemicals. The observation and simulation reveal highly complex patterns of advection of tracers in turbulent-like geophysical flows. Transport barriers are material surfaces across which the transport is minimal. They can be classified into elliptic, parabolic, and hyperbolic barriers. Different diagnostics in detecting transport barriers and the analysis of their role in the dynamics of oceanic and atmospheric flows are reviewed. We discuss the mathematical tools, borrowed from dynamical systems theory, for detecting transport barriers in simple kinematic and dynamic models of vortical and jet-like flows. We show how the ideas and methods, developed for simple model flows, can be successfully applied for studying the role of barriers in oceanic and atmospheric flows. Special attention is placed on the significance of transport barriers in important practical issues: anthropogenic and natural pollution, advection of plankton, cross-shelf exchange, and propagation of upwelling fronts in coastal zones.

1. Introduction

Transport in fluid flows involves the advection of water (or air) parcels along with their conserved properties due to the fluid’s bulk motion. Barriers to transport provide valuable information about the flow. Transport barriers (TBs) can be defined as material surfaces with zero transverse flux. This definition is formally correct but its usefulness in analyzing transport problems in fluid flows is questionable because the normal flux across any material surface is zero. Ideas and methods of the theory of dynamical systems have been successfully applied to investigate transport in hydrodynamic flows and geophysical flows. The key phase space barriers in steady and time-periodic flows are periodic, quasiperiodic, homoclinic, and heteroclinic trajectories because trajectories cannot cross each other (e.g., [1,2,3,4]). In aperiodic flows, material lines are unsteady, making the definition of TBs with zero transverse flux meaningless.
Real geophysical flows are aperiodic and defined on finite space and time grids. The identification of TBs in such flows is a challenge. A few heuristic diagnostics have been proposed to identify TBs in geophysical flows. These diagnostics may be Eulerian or Lagrangian. The first ones are based on the direct observation of the currents. In the Lagrangian approach, one tracks the behavior of fluid elements. The finite-time and finite-size Lyapunov exponents (FTLE and FSLE, respectively) are the most common Lagrangian diagnostics used in extracting TBs. Since FTLE and FSLE are relatively easy to compute, they were quickly adopted as proxies of locations of material TBs (see, e.g., [5,6,7] and many others).
Transport barriers can be operationally defined as exceptional material lines or surfaces that deform less than their neighbors [8]. These definitions generalize the concept of Lagrangian coherent structures (LCSs) [9,10] from hyperbolic material lines (surfaces) [11] to elliptic and parabolic ones. It is applicable to all barriers in two-dimensional (2D) and three-dimensional (3D) flows, including stable and unstable manifolds of fixed points, KAM curves, and steady shear jets in time-periodic flows. Transport barriers, hidden in the flow, organize a flow and define the motion of advected tracers. This is especially important in observing the dispersal of various tracers in the ocean and atmosphere.
We review different diagnostics in detecting elliptic, parabolic, and hyperbolic transport barriers (ETB, PTB, and HTB, respectively), and analyze their role in the dynamics of oceanic and atmospheric flows and some important practical issues. The formation and destruction of ETBs are considered in the second section based on the simple kinematic model with a fixed-point vortex embedded in a time-periodic flow. The advances in the detection of ETBs for real eddies in the ocean and atmosphere, including the recently proposed LCS method for detecting eddy boundaries, are considered in Section 3. In Section 4, the identification of the central invariant curves (CIC), the destruction of PTBs, and cross-jet transport (CJT) are discussed using a dynamically consistent model with a meandering jet flow. Some ideas and methods, developed for simple model flows, have been successfully applied for studying the role of HTBs in oceanic flows. These issues, which include a brief description of the numerical procedure for solving advection equations in altimetrically and numerically generated velocity fields, are discussed in Section 5. Section 6 reviews the role of TBs in a variety of practical issues: the dispersal of oil spills and radioactive tracers, the advection of plankton, cross-shelf transport, and the propagation of upwelling fronts in coastal zones. Recent achievements in the identification of ETBs and HTBs in 3D unsteady flows are briefly discussed in Section 7. In the Supplementary Materials, we describe the numerical methods for calculating the maximum Lyapunov exponents.

2. Elliptic Barriers around Vortices and Their Destruction

2.1. Chaotic Advection and Stable and Unstable Manifolds

Methods and tools of the dynamical systems theory have been used in the last 40 years to investigate transport and mixing processes in fluid flows on different space and time scales. Passive particles, which do not affect the flow properties, are described by simple equations
d r d t = v ( r , t ) ,
where r = ( x , y , z ) and v = ( u , v , w ) are the position and velocity vectors at the point ( x , y , z ) , respectively. Trajectories of the vector Equation (1) lie in the physical space for advected particles.
It is well known that trajectories of nonlinear deterministic equations can be chaotic in the sense of the exponential sensitivity of trajectories. Aref [12,13] was the first who realized that 2D advection equations have a Hamiltonian form. The velocity components in incompressible planar flows can be expressed in terms of a stream function, allowing us to represent Equation (1) in the Hamiltonian form
d x d t = u ( x , y , t ) = Ψ y , d y d t = v ( x , y , t ) = Ψ x ,
where the stream function Ψ is a Hamiltonian, and particle coordinates (x, y) are canonically conjugated variables.
Let us write the stream function in the form
Ψ ( t ) = Ψ 0 + ξ Ψ 1 ( t ) ,
where Ψ 0 is its stationary part, Ψ 1 ( t ) is a perturbation with a small amplitude ξ and the period T 0 . To illustrate the fundamental cause of the onset of chaos in low-dimensional deterministic dynamical systems, let us consider a periodic flow with the phase portrait shown in Figure 1a.
Following [14], in Figure 1 we present an illustration of the proof of splitting and the transversal intersection of stable and unstable manifolds associated with a single saddle point. Let W s and W u denote the intersection of those manifolds with the plane at t = 0 . If W s and W u do not intersect with each other under a small perturbation, then there should be a small gap between them (Figure 1b). Let us consider segment δ 0 with one end lying on W s and the other end on W u . Segment δ 0 shifts counter-clockwise after the period of perturbation T 0 to become segment δ 1 with both ends lying on W s and W u . If so, the initial area D + Δ reduces to D , contradicting the area conservation law for Hamiltonian systems. The contradiction can be resolved if stable W s and unstable manifolds W u intersect with each other transversally, as shown in Figure 1c. Taking into account the numerous hyperbolic points in fluid flows and the associated invariant manifolds for each point, transversal crossings result in multiple foldings of material lines, leading to chaotic mixing. The splitting of separatrices has another important consequence; impermeable barriers break down, providing transport between domains that do not communicate in an unperturbed flow.

2.2. Simple Model with a Fixed-Point Vortex in a Time-Periodic Flow

To illustrate the destruction of TBs around eddies in the ocean and atmosphere with a simple example, we consider the kinematic model with a fixed-point vortex in a flow with steady and time-periodic components. The model was introduced in [15] to simulate the basic features of transport and mixing at the so-called topographical eddies over seamounts. The corresponding normalized stream function has a simple form:
Ψ = ln x 2 + y 2 + x ( ϵ + ξ sin t ) .
The phase portrait of the unperturbed system is a set with bounded and unbounded streamlines separated by a separatrix loop, as shown in Figure 1a. Particles moving along these lines either rotate inside the loop or encompass the vortex along infinite streamlines outside the loop (Figure 1b). The stable and unstable manifolds of the saddle point transverse under a perturbation, as schematically shown in Figure 1c.
A detailed analysis of the invariant sets of the kinematic flow was conducted in [7]. The periodic and quasiperiodic orbits around the center of the point vortex form a vortex core. Other invariant curves form “islands” characterized by regular motion inside the core and mixing domains outside. Islands of first-order nonlinear resonances are surrounded by smaller, higher-order resonance islands, forming chains with narrow stochastic layers in between (see, e.g., [16]). The vortex core is a robust structure. The boundaries of all the islands are Kolmogorov–Arnold–Moser (KAM) tori, preventing transport across them.
Transport and mixing processes may be very complex even in the simple model flow considered here. The formation and destruction of TBs have also been studied in more complex models with an ellipsoidal vortex [17,18,19], in dynamical models of the vortical flow [20], and in models of the flows above submerged obstacles [21,22].
Perturbations, which are unavoidable in real flows, can destroy impenetrable ETBs around eddies, providing both the extraction of material from the vortex core and the penetration of tracers from the eddy periphery inside the core. This exchange of material is a dynamical process that may occur in the form of filaments, intrusions, lobes, and other features, which are discussed in the next section pertaining to oceanic and atmospheric flows.

3. Detection of Elliptic Barriers for Eddies

3.1. The Problem of Identifying Eddy Boundaries

Eddies—energetic, swirling, and robust—populate the deep ocean, seas, gulfs, and bays. They significantly contribute to the transport of water salt, heat, and different tracers, such as nutrients, biota, and pollutants. By a horizontal scale, they are usually subdivided into submesoscale eddies with a lateral size of < 10 20 km, and mesoscale eddies with larger sizes. Isolated mesoscale eddies consist of a core and periphery separated by an imperfect material barrier in between. The core is a coherent water mass that retains its properties (temperature, salinity, chemical elements, biota, etc.) for some time. The periphery is the surrounding water rotating around the eddy’s center in the form of streamers.
The majority of mesoscale eddies persist for months and even longer, sometimes reaching a few km downward, and transporting salinity, heat, and momentum over hundreds of kilometers from their places of origin, with a strong impact on climate, weather, and ecology (see, e.g., [23,24,25,26,27,28]. Apart from the eddies with a prominent signature on the ocean surfaces, intrathermoclinic eddies exist, which are manifested inside the thermocline [29,30,31,32,33]. A variety of different types of eddies also exist, including specific ones like hetons [33,34,35], which are pairs of eddies of opposite polarity, one over another. Quasi-stationary eddies exist, stagnating in a restricted area for a comparatively long time, and drifting eddies advected by background currents, wind, and the β -effect. The β -effect drags mesoscale eddies westward in the northern hemisphere (e.g., [36,37]).
In steady and time-periodic flows, the outermost KAM curve is a material eddy boundary, i.e., it is an ETB. This result can be extended to 2D time–quasiperiodic flows, in which KAM curves are closed material lines, deforming quasi-periodically [38]. The identification of eddy boundaries (ETBs) in aperiodic flows is a long-standing problem. The majority of material lines in chaotic flows typically stretch at an exponential rate. Lagrangian TBs are supposed to be exceptional material lines, which exhibit the least local stretching over time. The boundary of a coherent eddy in such flows retains its general shape without significant stretching, folding, or filamentation, unlike a typical closed material line in an unsteady flow. Theoretical vortices have a strong gradient of vorticity at the core boundary, allowing us to determine the core of a theoretical vortex. Eddies in the ocean typically do not have a significant jump in vorticity. The vorticity gradually decreases with distance from the center. According to the classical axiom of continuum mechanics, a vortex must be invariant under rotations and translations of the coordinate frame [39,40]. However, vorticity, which is the primary diagnostic for identifying structures in fluid mechanics, varies depending on the frames that rotate and translate relative to each other. So, observers in different frames may identify distinct flow structures as coherent ones.
Various methods have been used to identify eddies in the ocean. The Eulerian ones are based on instantaneous snapshots of the velocity field, whereas Lagrangian ones are based on particle trajectories. The Eulerian methods have been applied to calculate subjective thresholds, like the Okubo–Weiss parameter, closed contours of sea level anomalies, and others [41,42,43]. These methods cannot objectively determine the boundary of the core from which water cannot escape. The majority of Lagrangian methods, using FTLE, FSLE, and other Lagrangian diagnostics, are also unable to objectively determine the boundaries of ocean eddies since they do not have strict mathematical criteria for separating coherent vortical structures. The Eulerian and Lagrangian methods, in fact, subjectively determine the boundaries of vortices, and there is no certainty that through this boundary there is no exchange of water with the environment. As a rule, they overestimate the size and lifetime of oceanic eddies [44]. Therefore, the estimates of the heat and salt, transported by eddies over long distances, can be strongly overestimated, distorting estimates of the ocean warming.
It was not easy to detect eddies in the deep ocean before the satellite epoch. Different current satellite missions provide us with global data at sea level height, surface temperature, salinity, and chlorophyll concentrations, with high resolution in space and time (e.g., [45,46]). This allowed researchers to fulfill the global (e.g., [41,47]) and regional (e.g., [48,49,50]) census of eddies using different algorithms for tracking eddies (e.g., [43,51]). Despite the success of the altimetry-based identification of mesoscale eddies in the ocean, the questions of finding boundaries of coherent eddies and transport barriers around them are still open.

3.2. The LCS Method for Detecting Eddy Boundaries and Elliptic Barriers

G. Haller and coauthors [40] proposed a method for detecting the boundaries of coherent eddies based on the calculation of the Lagrangian-averaged vorticity deviation (LAVD).
L A V D t 0 t 0 + T ( x 0 ) = t 0 t 0 + T | ω [ x ( s ; x 0 ) , s ] ω ¯ ( s ) | d s ,
where ω [ x ( s ; x 0 ) , s ] is the vorticity of a water parcel at time s along its trajectory, ω ( s ) is the instantaneous spatial mean vorticity over the fluid volume, and T is the Lagrangian-coherence time. The ETBs can be considered as the outermost closed contours of the LAVD.
This method provides the identification of the boundaries of coherently rotating 2D and 3D structures from Lagrangian trajectory data [40]. At time t 0 , a study area is populated by a large number of particles employing a dense mesh with a higher resolution than that for the velocity field. Their trajectories are integrated forward in time, using surface geostrophic velocities or the outputs of numerical circulation models, until time t 0 + T 0 , where T 0 is the lifetime of an eddy in days. Data on particle positions and relative vorticity are recorded. The LAVD is averaged over particle trajectories and maps back to the initial positions, x 0 . The LAVD maxima are located at the vortex centers. After finding a local LAVD maximum, one searches for the largest closed and convex curves around the LAVD maxima, which are ETBs. This approach has been applied to detect vortex structures in global [27,52] and regional eddy transport studies [53].

3.3. Atmospheric Flows

Stable stratification in the atmosphere typically suppresses vertical motion. In the stratospheric flows between 10 and 50 km, trajectories of air parcels are constrained to remain on the isentropic surfaces with an approximately constant potential temperature on the timescale on the order of ≈10 days. As a result, transport can be considered quasi-horizontal. Water vapor, ozone, various chemicals, and potential vorticity are the most important passive tracers in the atmosphere.
During winter, sharp gradients of potential vorticity on isentropic surfaces inhibit horizontal air exchange across the boundaries of the Antarctic and Arctic stratospheric polar vortices [54]. The Antarctic vortex is generally more stable and isolated compared to the Arctic vortex [55]. A high-latitude zonal jet around the polar vortices plays the role of a meridional TB. The impermeability of this ETB is important, particularly for the springtime ozone depletion in the polar stratosphere known as “Antarctic and Arctic ozone holes” (e.g., Refs. [56,57] and references therein). Strong mixing occurs outside the polar vortex [54], where air parcels can travel long distances away from the vortex, forming complex patterns with stretching and folding. The breaking of the Rossby wave pulls material filaments of the vortex edge and enhances mixing with the surroundings. Such a process makes the vortex edge a barrier to horizontal transport.
Tools from dynamical systems and chaos theory have been used to identify transport barriers on isentropic surfaces in a kinematic model [58] and a numerical circulation model of a zonal atmospheric flow [59]. In Refs. [55,60,61,62], the authors used wind fields based on observation data to study chaotic mixing. These and other authors (see references in the cited papers) have applied FTLE, FSLE, and other Lagrangian diagnostics to detect hyperbolic trajectories and the associated stable and unstable manifolds, as well as identify TBs. When ETBs break down due to a weakening of the zonal jet, transport pathways appear between domains with ozone-depleted polar air and ozone-rich mid-latitude air. This process results in reducing the ozone hole size. Thus, the dynamical system theory tools provide valuable insights for describing various dynamic processes in the atmosphere.

4. Identification and Destruction of Parabolic Barriers in Zonal Jets

4.1. Model of a Zonal Jet with Rossby Waves

Powerful currents in the ocean and atmosphere are often meandering jet currents that separate water/air masses with distinct physical, chemical, and biological properties. The Gulf Stream in the North Atlantic and the Kuroshio in the North Pacific play very important roles in climates in large regions. Stratospheric jets provide the transport and mixing of chemical substances, including the ozone. Such flow currents may be considered as jets perturbed by running waves with different values of length and phase velocities. The Gulf Stream and the Kuroshio, which are “rivers” of warm water in cold surroundings with a width of 100 km, seem to provide effective barriers to cross-jet transport (CJT). However, some ocean floats have been found to cross these jet currents, especially in depth, given that they are not fully impermeable barriers. The cross-jet transport may have far-going sequences for climate, weather, ozone layer depletion, and biota.
Transport across jets can be straightforwardly found in numerical circulation models after computing trajectories of particles launched on one side of the jet and tracking them on the other side. The kinematic and dynamic models, conserving potential vorticity, are less realistic and do not pretend to estimate quantitatively CJT in real oceanic and atmospheric flows. However, they allow us to elaborate methods for the identification of TBs and to find the mechanisms of their destruction and the onset of CJT in real geophysical flows. The cross-jet transports have been investigated with kinematic models [63,64,65,66,67,68] and dynamic models, conserving potential vorticity [58,68,69,70,71,72,73]. A few laboratory experiments with meandering jets have been carried out in rotating tanks [74,75] to simulate zonal geophysical flows. The stream function of a simple model of a meandering jet, conserving potential vorticity, is sought in the following form:
Ψ = Ψ 0 + Ψ int = Ψ 0 ( y ) + j Φ j ( y ) e i k j ( x c j t ) ,
where Ψ 0 describes a zonal flow, and Ψ int is a superposition of running Rossby waves. After substituting (6) in the potential vorticity equation and its linearization, one obtains the so-called Rayleigh–Kuo equation [76] with two neutrally stable solutions:
Φ j ( y ) = A j u max L sech 2 y L , j = 1 , 2 ,
if the velocity profile is chosen in the form of the Bickley jet
u 0 ( y ) = u max sech 2 y L ,
where u max is the maximum velocity, L is the jet width and A j are wave amplitudes. Equations (8) and (7) are compatible if the phase velocities satisfy the following condition:
c 1 , 2 = u max 3 ( 1 ± α ) , α 1 β * , β * 3 L 2 β 2 u max .
The wave numbers and phase velocities satisfy the dispersion relation c 1 , 2 = u max L 2 k 1 , 2 2 / 6 . Two neutrally stable Rossby waves exist if the condition β L 2 / u max < 2 / 3 is fulfilled.
Following Ref. [73], we consider the geometry of the model flow, allowing a comparison of numerical results with the laboratory experiments in rotating tanks [74,75], in which an azimuthal jet at the radius R perturbed by the Rossby-like waves with wave numbers n 1 and n 2 was produced:
k 1 , 2 = n 1 , 2 R , c 1 , 2 = u max L 2 6 R 2 n 1 , 2 2 .
After the normalization, we obtain the model stream function in the frame of reference moving with the phase velocity of the first wave:
Ψ ( x , y , t ) = tanh y + A 1 sech 2 y cos ( N 1 x ) + A 2 sech 2 y cos ( N 2 x + ω t ) + C 2 y ,
where
ω 2 N 2 ( N 1 2 N 2 2 ) 3 ( N 1 2 + N 2 2 ) , C 2 2 N 1 2 3 ( N 1 2 + N 2 2 )
and the wave numbers are represented as n 1 = m N 1 and n 2 = m N 2 , where m 1 is the greatest common divisor and N 1 / N 2 is an irreducible fraction. The stream function (11) has two main control parameters, N 1 and N 2 , which are defined, in turn, by the following parameters of the flow: u max , β , L, and R. The corresponding Hamiltonian advection equations are integrable if A 2 = 0 .
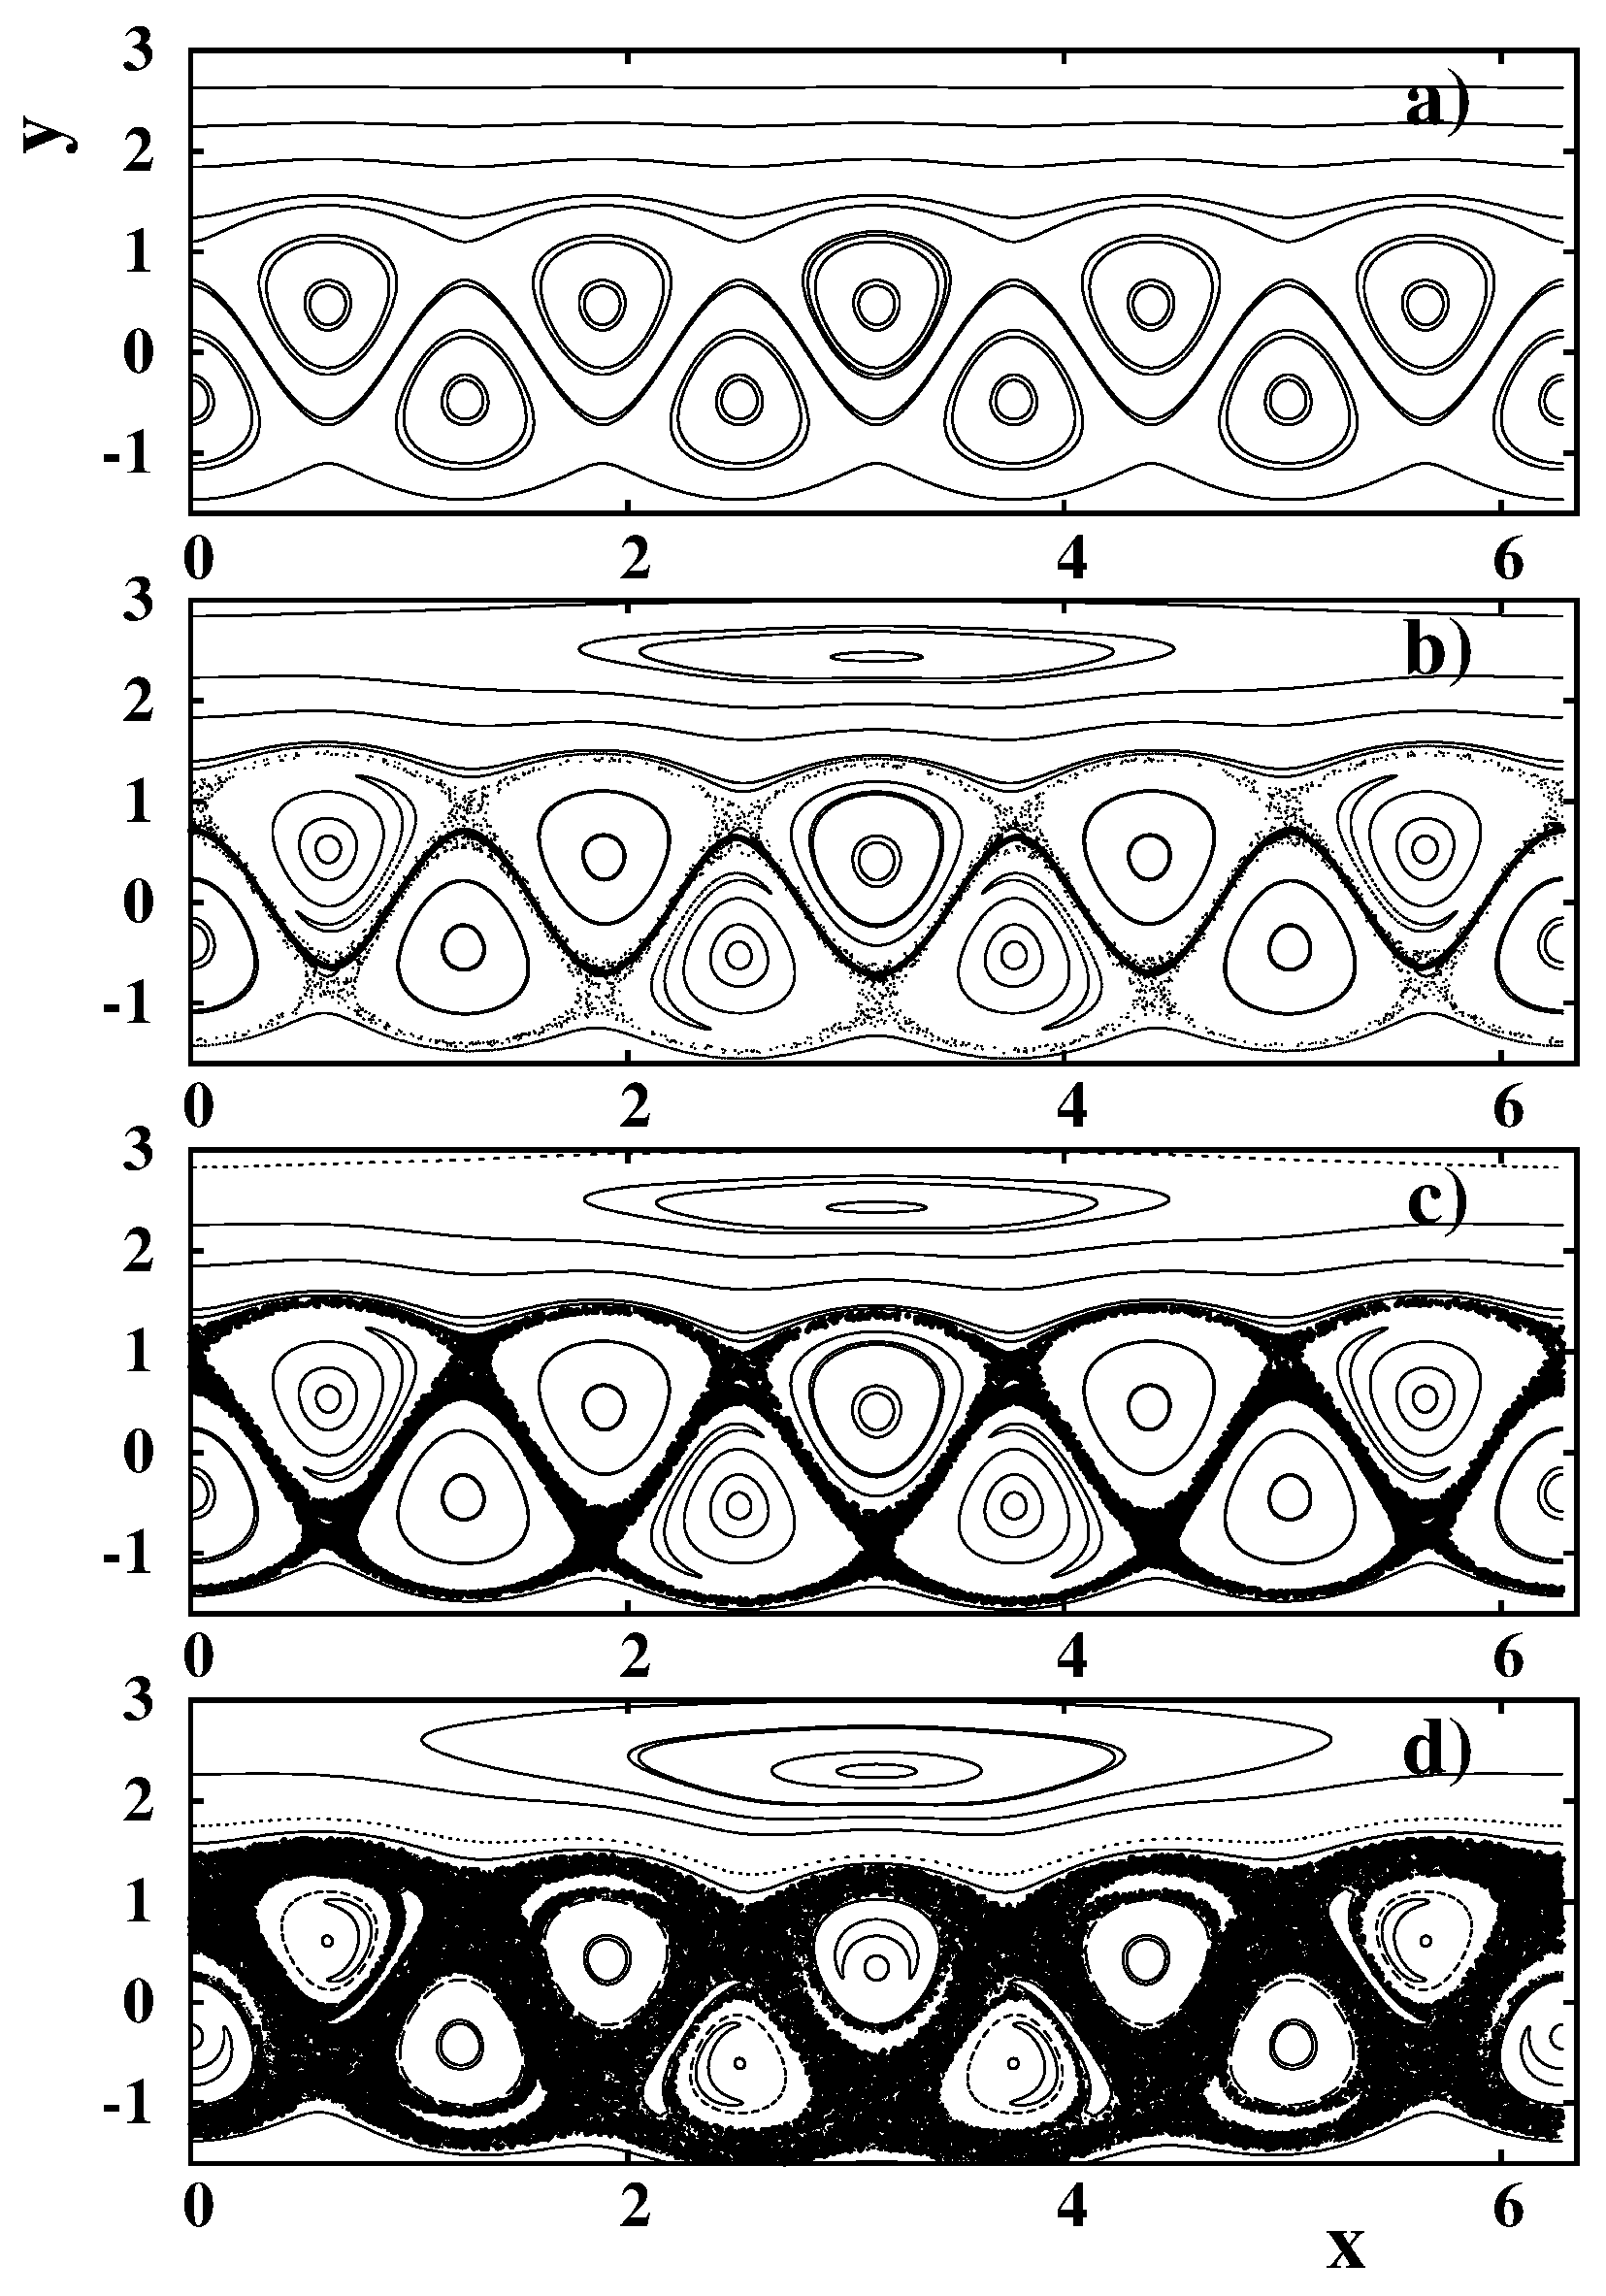
The phase portrait of the steady flow is shown in Figure 2a in the presence of a single wave. An eastward jet meanders between two chains of vortices in the moving frame. The flows on both sides of the jet are westward in this frame. The flow is steady at A 2 = 0 , and particles move along streamlines. If A 2 > 0 , chaos may occur due to a breakdown of the unperturbed separatrices, acting as PTBs, and the appearance of stochastic layers in their place.

4.2. Chaotic Cross-Jet Transport

In the identification and destruction of PTBs in the kinematic and dynamic models of meandering jet flows, the important role plays the so-called “central invariant curve” (CIC), which can be detected if advection equations have the following symmetry:
S ^ : x = π + x , y = y
and the time-reversal symmetry
I ^ 0 : x = x , y = y .
Both the symmetries are involutions, i.e., S ^ 2 = 1 and I ^ 0 2 = 1 . By definition, CIC is a curve that is invariant under operators S ^ and G ^ T 0 [72,73].
Since the curves invariant under G ^ T 0 cannot intersect with each other, CIC is the only curve with a local extremum on the winding number profile, with an irrational value of the winding number w (the winding number, w, by definition, is a ratio of perturbation frequency to natural frequency. Periodic orbits, for example, have rational values of w, whereas quasiperiodic orbits have irrational values of w). This curve provides a barrier to global transport, but it should not be thought of as the curve from a family of invariant curves that breaks down in the last turn under increasing perturbation values. Sometimes this is not the case. The significance of CIC is that it is a good indicator of the presence of a PTB.
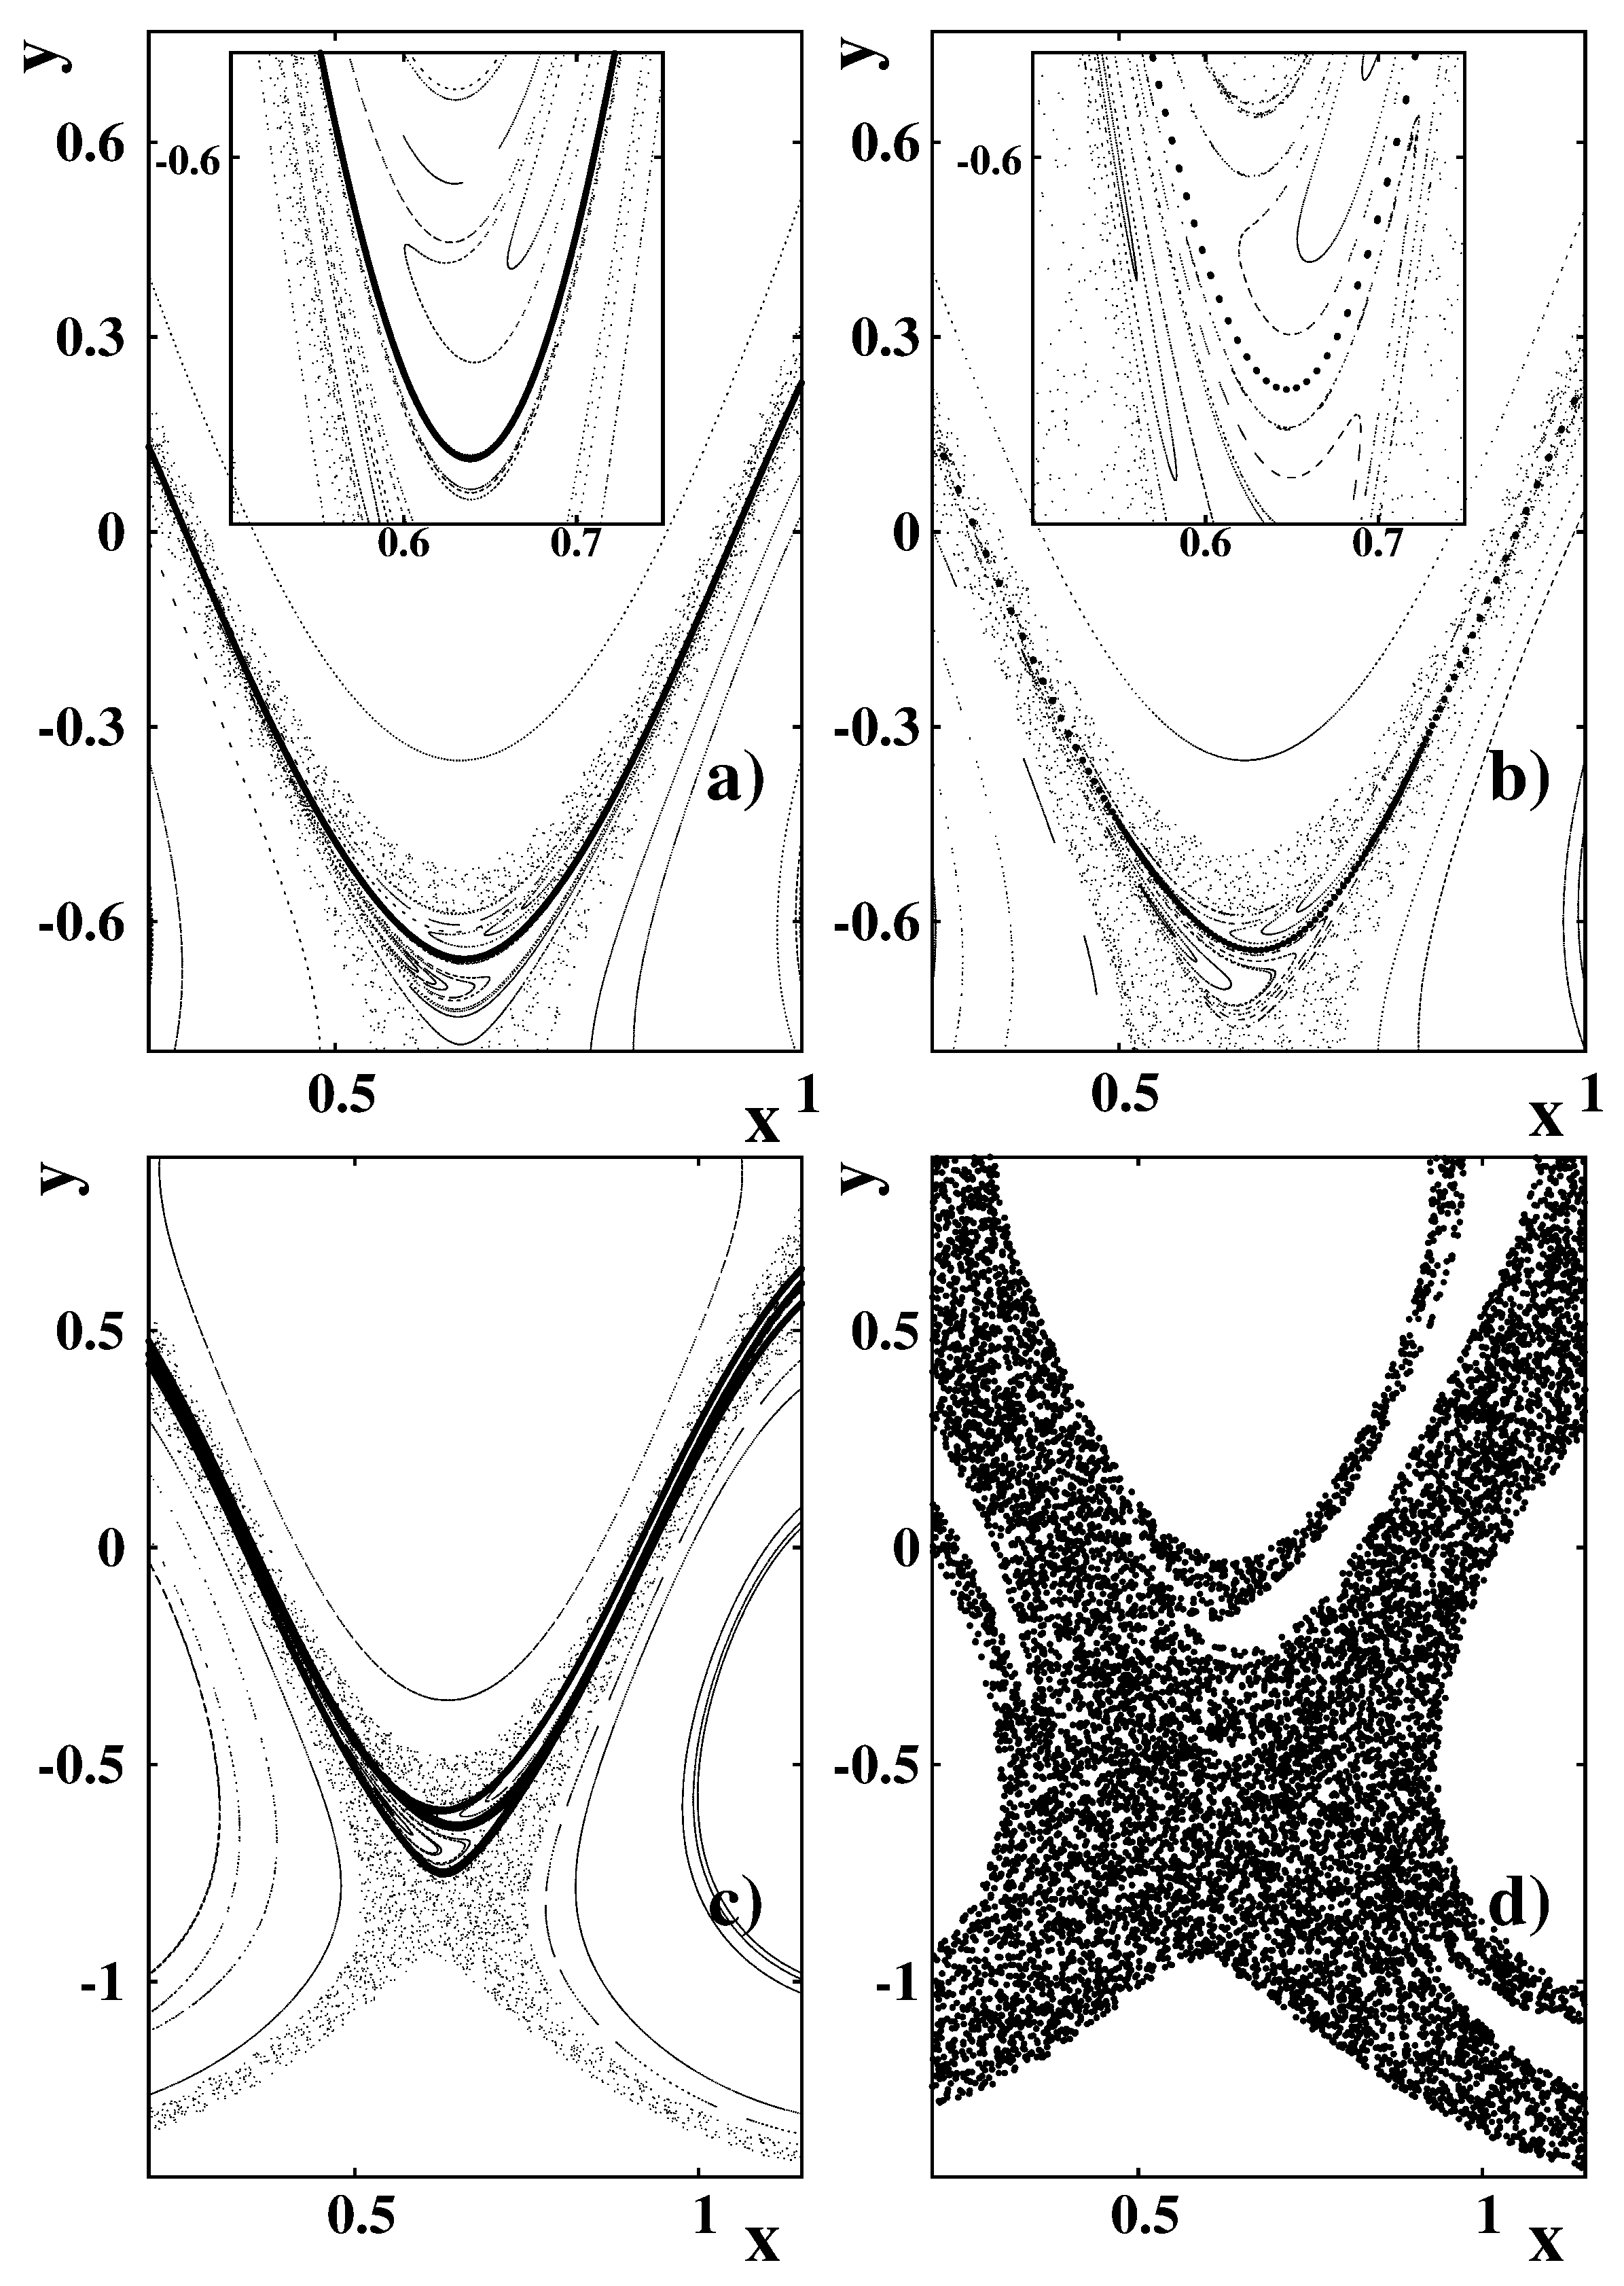
The central invariant curve is shown in Figure 2b with the stochastic layers on both sides of the jet where chaotic transport takes place. With the increasing amplitude A 2 , CIC begins to break down and is replaced by a stochastic layer (Figure 2c) that is confined between the invariant curves. Its average width increases with the increasing perturbation values. The local chaotic CJT arises inside this layer, which becomes global one upon further increasing of A 2 (Figure 2d).
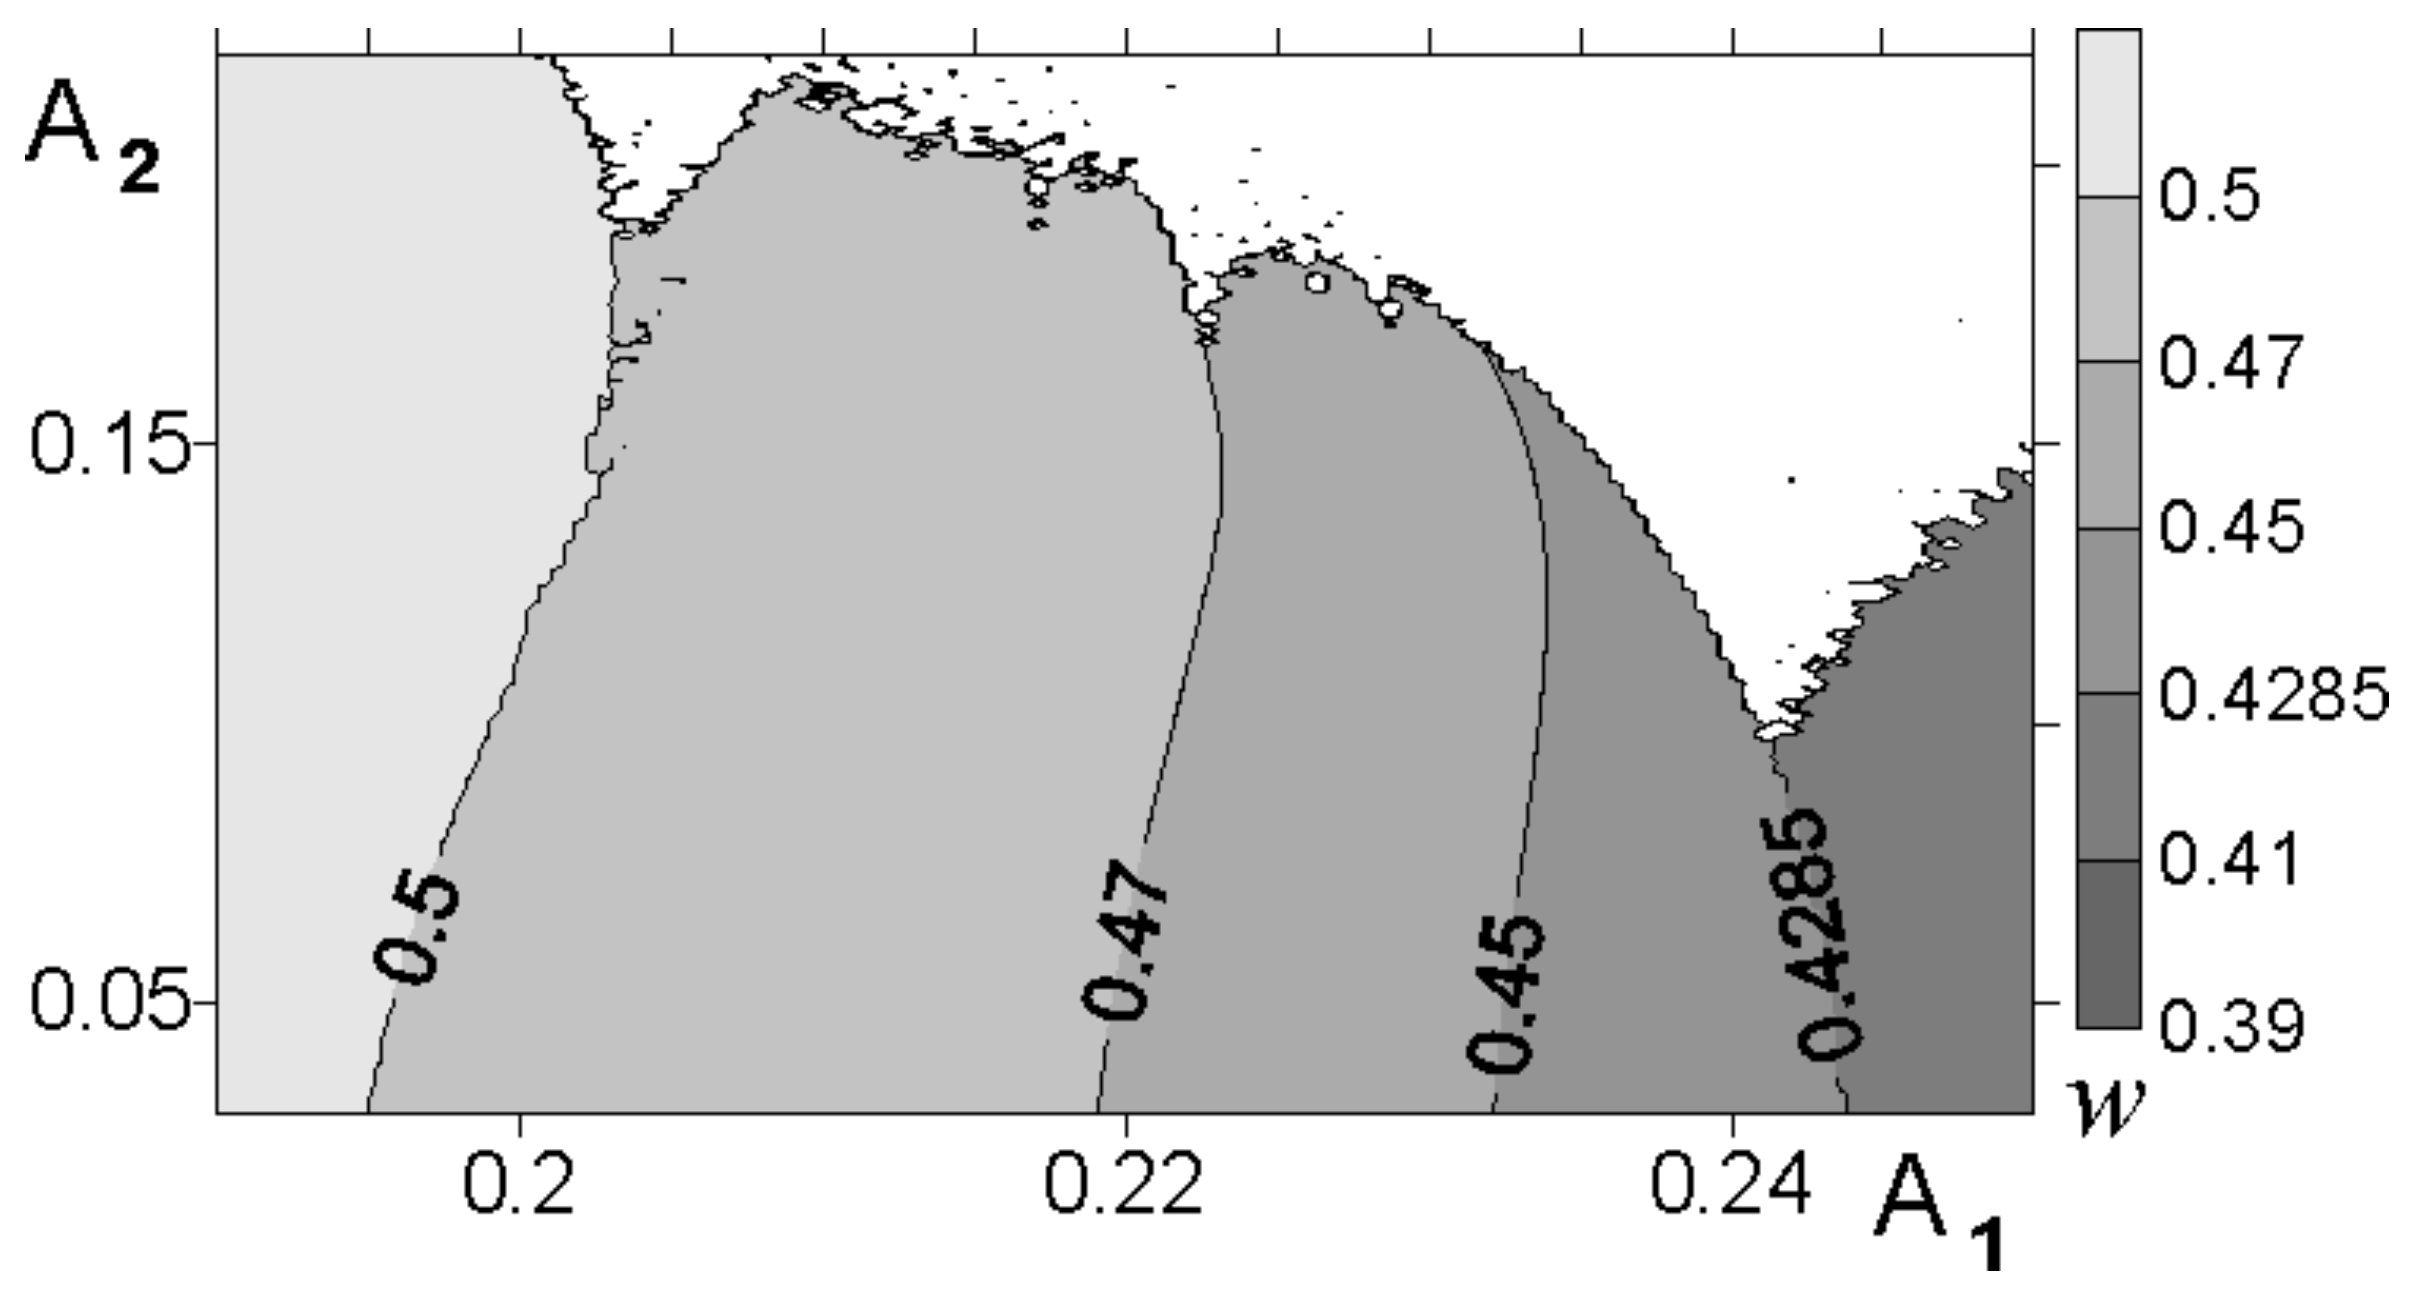
The authors of [72,73] have analyzed two mechanisms involving the breaking of PTB and the appearance of the chaotic CJT. As the values of amplitudes of the Rossby wave gradually increase, the stochastic layers on both sides of CIC become wider. At a certain threshold value, these layers overlap and CIC disappears. This mechanism (e.g., the breakdown of CIC and the onset of chaotic CJT) may be called an amplitude mechanism. It is illustrated in Figure 3 and typically provides a global transport.
Alternatively, the breakdown of CIC may occur via a resonance mechanism with arbitrarily small values of the Rossby wave amplitudes. The CIC rotation number varies under the variation of amplitude values (see Figure 3). If the rotation number becomes rational, CIC breaks down with the onset of a local chaotic CJT. The authors of [77] estimated the CIC rotation number, which is valid at small values of the wave amplitudes:
w f 1 ω N 1 2 + 3 N 2 2 2 N 2 ( N 1 2 N 2 2 ) .
Setting the right-hand side in this formula to be a rational number, one can find values of N 1 and N 2 , at which CIC is affected by a relevant resonance. In this case, CJT becomes possible at relatively small values of the perturbation amplitudes.
With the Rossby wavenumbers represented as n 1 = m N 1 and n 2 = m N 2 , where m 1 is the greatest common divisor of n 1 and n 2 (i.e., N 1 / N 2 is an irreducible fraction), one obtains two flow classes [73]: (1) flows with odd values of N 1 and N 2 and (2) flows with even–odd pairs of N. The case with even n 1 and n 2 is equivalent to one of them. In the first case, advection equations possess symmetry S ^ (13), allowing one to identify CIC by calculating iterations of an indicator point [78]. Flows vary, depending on the set of iteration dimensions: some have a present CIC, while others exhibit a broken CIC and a chaotic CJT (Figure 3).
The theory created in Refs. [72,73] allows studying CJT with different combinations of the wave number values n 1 and n 2 that can be created in laboratory experiments by adjusting the experimental parameters of the flow. In a typical experiment [74,75,79], a jet modulated by Rossby-like waves has been created, approximately satisfying the stream function (11). It was found that a dye, injected on one side, rapidly mixed along the jet, was not able to cross the jet. In other words, the jet provided a PTB. A single mode was generated with the wavenumber values in the range between 3 and 8, depending on the values of experimental parameters. The experimental results with the 5 4 and 5 6 wavenumber pairs have been compared with a numerical simulation with the same wavenumber pairs. The simulation shows that unrealistically large values of the wave amplitudes are required in order to destroy PTBs in the flows with even–odd wavenumber pairs (Figure 4 implies that the experimental conditions were not suitable for destroying the PTB).
However, the transport barrier could be destroyed in laboratory experiments in rotating tanks by creating a jet current with odd–odd wavenumbers, e.g., 3 1 or 5 1 (see Figure 7 in Ref. [73]). In this case, there may exist resonances that are able to destroy CIC and provide CJT at comparatively small wave amplitudes. Varying the values of one of the wave amplitudes in the experiment, the evidence of destruction of the PTB could be found by observing dye filaments crossing the jet.

5. Hyperbolic Barriers in Geophysical Flows and Their Extraction

5.1. Identification of Hyperbolic Barriers Using Lagrangian Coherent Structures

The elliptic and parabolic TBs, considered above, are invariant manifolds associated with coherent features, like vortices and jets. The analysis of their destruction in simplified models was based on a temporal periodicity of perturbation. The majority of geophysical flows are not periodic in time. Nevertheless, hyperbolic points of a transient nature exist in quasi-turbulent flows, and their “effective” stable and unstable manifolds can be identified. Stable and unstable manifolds in steady and (quasi)-time-periodic flows are defined in the infinite time limit, whereas the effective manifolds in real geophysical flows “live” for a finite time. They partition a flow in dynamically and topologically distinct domains. In particular, the unstable effective manifolds are TBs, albeit temporary, which may separate water/air masses with different characteristics. Tracers cannot cross such barriers by purely advective processes, whereas there are strong gradients of tracers close to barriers with enhanced mixing in their vicinity.
The strict mathematical basis of using effective manifolds in aperiodic flows with the velocity defined for finite-time intervals was developed by G. Haller et al. [9,10,80], who introduced the concept of the so-called Lagrangian coherent structures (LCSs). Lagrangian coherent structures are defined as the material surfaces or curves that attract or repel particles at the highest local rate relative to other material surfaces nearby. Any flow is composed of a continuum of material surfaces, and the problem is to identify the surfaces with the strongest stability. Lagrangian coherent structures are those repelling and attracting structures that dominate in advection.
Lagrangian coherent structures consist of the same fluid elements, which is why they are Lagrangian. They exist longer and are more robust than adjacent material surfaces, which is why they are coherent. Figure 5 schematically illustrates how a blob with tracers, chosen near a repelling (stable) LCS, is advected toward the associated hyperbolic point over time. When approaching that point, the blob stretches along the attracting (unstable) manifold. The Lagrangian coherent structures are frame-invariant, whereas the unsteady velocity field may depend strongly on the reference frame.
P. Pierrehumbert [58,59] introduced the computation of FTLE in geophysical velocity fields as a measure of chaotic mixing. G. Haller posited that, in 2D flows, ridges with locally maximal FTLE values approximate the locations of repelling and attracting LCSs in forward and backward time, respectively. These ridges can be operationally defined as local FTLE/FSLE extrema and have been proven to be almost Lagrangian with a small flux across them [9,10,80].

5.2. Some Remarks on the Simulation of Transport and Mixing Processes in Satellite-Derived Velocity Fields

The progress in satellite monitoring and development of high-resolution, eddy-resolving circulation models opened up new possibilities to study the transport and mixing in geophysical flows. A microwave satellite radar measures the distance to the ocean surface to obtain anomalies of the sea-surface level, allowing one to infer the velocity field in the geostrophic approximation where horizontal pressure gradients balance the Coriolis force. The resulting velocity field is altimetric. Daily geostrophic velocities, such as those from AVISO/CMEMS http://aviso.altimetry.fr are freely accessible from from 1 January 1993 to the present time. They are provided at a spatial resolution of, at minimum, 1 / 4 × 1 / 4 , and have a daily time step. These data are commonly used to calculate the advection of tracers in the ocean.
In the Lagrangian approach, advection equations are integrated for a substantial number of particles using either the altimetric velocity field or the velocity fields from circulation models and reanalyses provided on a discrete grid. Before solving these equations, numerical algorithms are necessary. In the 2D scenario, the equation takes a simple form:
λ ˙ = u ( λ , ϕ , t ) , ϕ ˙ = v ( λ , ϕ , t ) ,
where u and v are angular zonal and meridional velocities, which are convenient to use for solving advection equations on the Earth sphere, ϕ and λ are the latitude and longitude, respectively. The following procedure is commonly used [4]:
  • Bicubic interpolation of the velocity components in space, and time interpolation using third-order Lagrangian polynomials, conducted independently of each other.
  • Substituting the interpolated velocity values in Equation (16), which are integrated using the fourth order Runge–Kutta method.
  • Calculating the relevant Lagrangian indicators and representing their values on a geographic map of the study region.
Using the altimetric velocity field with relatively coarse resolution, the simulation results typically resolve mesoscale features. Moreover, this field is an approximation to the “real” velocity field in the ocean. It has been theoretically shown [9] that LCSs are robust to inevitable errors in velocity fields if LCSs are strong and exist for a sufficiently long time. Although simulated trajectories may diverge exponentially from “true” trajectories near a repelling LCS, the very LCSs are not expected to be perturbed to the same degree because numerical errors grow along the LCS. The FTLE/FSLE diagnostics in the altimetric velocity field are reliable at detecting mesoscale features and even smaller features if the latter ones evolve due to advection. The developing surface water and ocean topography (SWOT) mission provides the velocity field at much higher resolutions, down to a few kms, allowing to catch some submesoscale processes and features.
The Lagrangian simulation results are based not on individual trajectories but on hundreds of thousands and millions of trajectories. No one can guarantee that he/she is able to compute “true” chaotic trajectories of individual particles. The shadowing lemma in the theory of dynamical systems states that, roughly speaking, every numerically computed trajectory in strongly chaotic systems stays close to a “true” trajectory with a slightly altered initial position.

5.3. Lyapunov Exponents as Lagrangian Diagnostics

One of the commonly used Lagrangian diagnostics to quantify mixing in geophysical flows is a maximal Lyapunov exponent. The finite-time Lyapunov exponent can be calculated by different methods from advection equations. Following Ref. [81], FTLE in a 2D case is defined as follows (for details, see the Supplementary Materials):
Λ ( t , t 0 ) = ln σ 1 ( t , t 0 ) t t 0 ,
where σ 1 ( t , t 0 ) is the largest singular value of the evolution matrix, specifying how far away initially close particles diverge from each other over time, and t t 0 is the integration time.
The finite-scale Lyapunov exponent is calculated until the moment of time τ , when two particles, initially separated by a distance δ 0 , diverge over a distance δ f [5,6]:
Λ s = ln ( δ f / δ 0 ) τ .
Both the diagnostics provide similar results.
To identify HTBs in geophysical flows, the spatial distributions of the FTLE (FSLE) values are computed forward and backward in time. A study area in the ocean or atmosphere is populated with a large number of artificial particles on a grid. The FTLE/FSLE values are computed using the flow map gradient [80,82] or following Equation (17) [81] for all close-by grid points during a given period of time or separation distance, depending on the assigned task. The values of these quantities are graduated by color and plotted on a geographic map of the study area. In a dynamically active region, one obtains a complex pattern with ridges, defined as curves with locally maximal Λ values in the transverse direction [82], and “valleys” with minimal FTLE (FSLE) values. Forward-in-time integration allows one to extract repelling LCSs, which approximate locations of the influential stable manifolds, whereas backward-in-time integration yields attracting LCSs that approximate the influential unstable manifolds.

6. The Role of Barriers in Tracer Transport

Temperature and salinity are physical tracers, which are used to track cross-shelf transport in bays and gulfs and the upwelling process, in which cold water rises toward the surface from the depth. From an ecological point of view, the most important anthropogenic tracers are spilled oil and radionuclides and some natural tracers, e.g., harmful algae. The tracers may be conservative, remaining constant following fluid parcels, and reactive, growing, or decaying with time. In this section, we briefly review the significance of TBs for a variety of practical problems in the transport of different kinds of pollutants. The Lagrangian diagnostics provide an extremely useful platform for studying the tracer transport.

6.1. Oil Spill Dispersal

Oil spill incidents with tankers, offshore platforms, and port terminals affect ecosystems, commercial fisheries, tourist infrastructure, and marine aquaculture. Oil spills have occurred more frequently in recent years (see, e.g., [83]), requiring immediate and effective responses, which, in turn, require good knowledge of potential transport pathways in the region where the oil spill occurred. Lagrangian particle-tracking numerical experiments with the direct integration of equations of motion have been actively applied in recent years to simulate the dispersion of oil spills in different seas and oceans (e.g., [84,85,86,87,88]).
The hypothetical oil spill from the Kozmino oil terminal is discussed in this section, following reference [88], where oil drops have been simulated as passive particles, which have been advected by the currents and the wind. The Kozmino, the main oil port near Vladivostok, is located at the coast of the Peter the Great Bay (Japan Sea). The biodegradation and evaporation processes have been involved in the regional ocean modeling system (ROMS) with high horizontal and vertical resolutions and accommodations of real hydrological and meteorological parameters. The biodegradation and evaporation remove part of the oil from the spill. The wind regime over the Peter the Great Bay is monsoon-like. The cold northwesterly, westerly, and northerly winds from the Siberian continent prevail in the winter. In the summer, southerly, southeasterly, and southwesterly winds blow, mainly, from the sea.
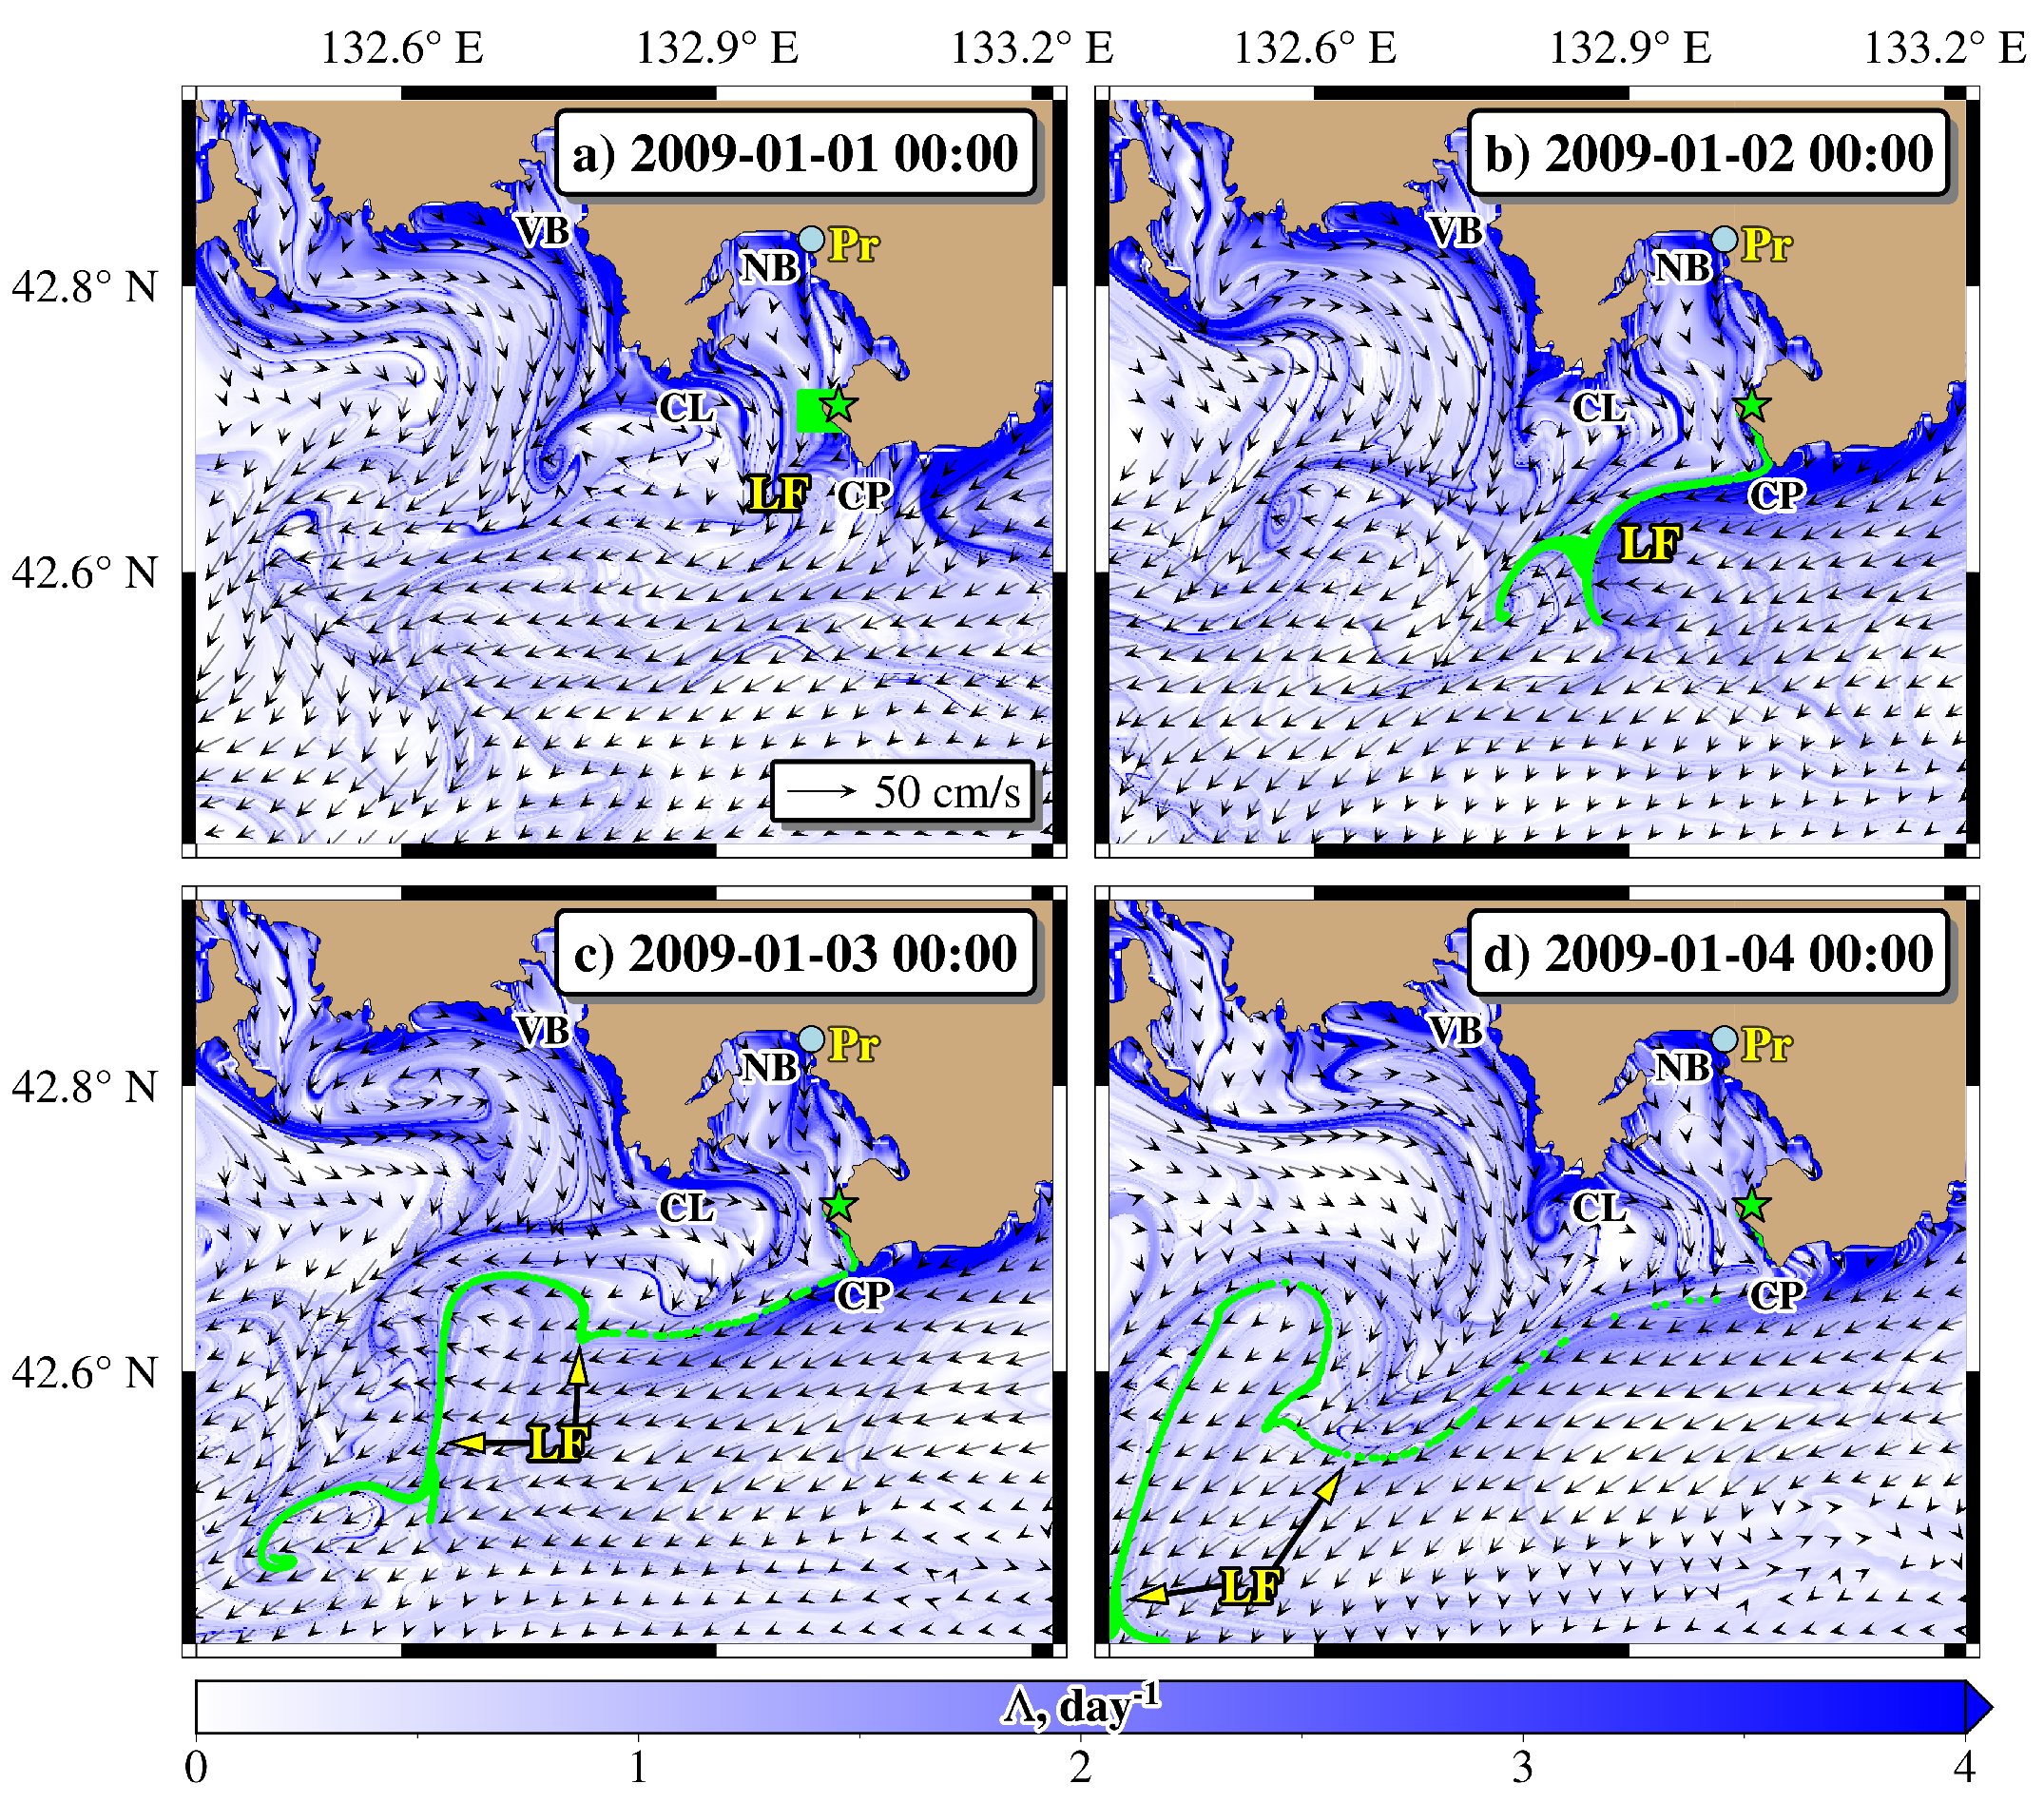
In the cold season, the typical scenario of the dispersal and deformation of the surface oil slick is illustrated in Figure 6, with the FTLE field calculated following (17). The green particles were deployed at 00:00 GMT on 1 January 2009. The location of the strongest HTB coincided with the location of the prominent FTLE ridge formed by the end of the first day after deployment (see LF in Figure 6). In time, the oil was gradually distributed along this HTB (Figure 6b). Due to the strong northwesterly/westerly winds during these days, the HTB drifted quickly away from the coast, providing a stretch of the oil slick (Figure 6c). By the beginning of the fourth day, the perimeter of the slick had increased significantly. The slick was stretched and carried away from the coast, with its head splitting in the directions of two HTBs (Figure 6d). Thus, in the first scenario, the oil was quickly removed from the spill site within the initial three days after deployment.
The behavior of the spilled oil is cardinally different in the warm season when winds blow, mainly from the sea. Figure 7 shows the dispersion and deformation of the oil slick after the deployment of green particles at 00:00 GMT on 1 June 2009. The strong HTB, formed by the beginning of 1 June (see LF in Figure 7a), has drifted gradually to the north, preventing dispersion of the spilled oil to the open sea (Figure 7b–d) because the oil particles could not cross this near-coastal barrier transversally due to purely advective processes. Over time, the tracers gravitated toward this HTB, causing the oil slick to stretch along the coast of Nakhodka Bay (NB in Figure 7) for five days after the deployment.
Simulation of the dispersion of oil spills is a complex task. It is governed by different processes, including currents, temperature, salinity, wind, and waves. Moreover, the oil undergoes evaporation, emulsification, biodegradation, and other processes acting simultaneously, changing its physicochemical properties. The FTLE/FSLE diagnostics have been used to detect locations of HTBs and analyze their role in the dispersion of oil spills after catastrophic accidents in the Gulf of Mexico in April 2010 [89,90], in the East China Sea in 2018, and in the Mediterranean Sea in 2021 [91].
The oil spill accidents require an immediate response that ideally requires information on the location of transport barriers and potential transport pathways in the area. However, the transport barriers evolve over time, sometimes in a complicated manner, as illustrated in Figure 6 and Figure 7. The possibility of anticipating the location of HTBs, even for a short time, would be very important to forecast the dispersion of oil slicks. The Lagrangian diagnostics could help with this task because they allow predicting the locations of strong HTBs on timescales that are inverse to the values of FTLE/FSLE. The point is that it can be conducted based only on the velocity data without a velocity forecast [89].
The method for predicting the speed of drifting Lagrangian fronts, situated along HTBs, has been proposed in Ref. [91]. This method uses the theoretical property of zero flux across TBs. Whenever a TB appears to be transverse to the direction of a smooth velocity field, imposing local displacement of the barrier by the velocity field component orthogonal to it is sufficient to maintain a zero flux. The drifting speed of the barrier and associated Lagrangian front at a given point is calculated as the orthogonal projection of the current velocity vector. Applying that to all points near the barrier, it is possible to calculate the future displacement of the barrier for a comparatively short time without the need for forecast velocity data.

6.2. Radioactive Tracers

The presence of TBs of different kinds strongly affects the dispersion of radioactive tracers in the ocean. The Lagrangian particle tracking has been actively used to simulate the propagation of radionuclides in the ocean, especially after the tsunami on 11 March 2011, followed by heavy damage to the Fukushima Nuclear Power Plant (e.g., [92,93,94,95,96]). In particular, it has been shown that contaminated water has been trapped by mesoscale eddies during their formation processes near the Fukushima location after the accident [96]. The increased concentration of the 137 Cs isotope was in the research vessel cruise [95] during the summer of 2012, 1.5 years after the accident. It was found in the cores of certain anticyclonic mesoscale eddies at depths ranging from 100 to 500 m due to the subduction of surface water. The ETBs around these eddies have prevented the release of the trapped radionuclides out of the eddy core and facilitated the process of their subduction to greater depths. We briefly consider the significance of HTBs in the dispersal of radioactive material following another lesser-known nuclear accident.
The accident with a nuclear submarine reactor occurred at 11:55 h local time on 10 August 1985 in Chazhma Bay (Peter the Great Bay, Japan Sea). This was accompanied by the radioactive pollution of seawater and air. The potential transport pathways on the sea surface and at different depths have recently been retrospectively simulated for the first time only [97] using the Lagrangian approach and the ROMS output data on the velocity field. Apart from the direct contamination of seawater in Chazhma Bay, radioactive material was deposited on the sea surface of the neighboring Ussuri Bay from the atmosphere, approximately half an hour after the explosion [98].
The retrospective ROMS simulation in [97] has shown that three eddies, a cyclone centered at ( 42.9 N, 131.15 E) and two anticyclones ( 43.1 N, 132.2 E) and ( 42.7 N, 132.1 E), formed after 12 August. Unstable manifolds, associated with the hyperbolic points between these eddies (see the crosses in Figure 8 at ( 42.9 N, 131.15 E), ( 43.1 N, 132.1 E), induced a strong deformation of the radioactive plume. To explain the dispersal of the radioactive tracers, the FTLE field was computed (17). The FTLE map in Figure 8 is shown at 7:00 h on 14 August at a depth of 10 m. The FTLE was calculated for seven days prior to that date. The plume stretched strongly along the attractive manifold, approximated by the colorful ridge shown in this figure. The black ridge, encompassing the cyclonic eddy, is an ETB that prevents the penetration of contaminated water inside the core of this eddy (Figure 8), whereas the colorful Λ -like ridge around this eddy is an HTB associated with the hyperbolic points mentioned above. The simulated radioactive tracers adhered to the attractive manifold, which evolved at a much slower pace compared to the velocity field. This fact allows the forecasting of radioactive tracer dispersion in the model velocity field after the identification of the influential hyperbolic points, which can be distinguished by the maximum singular values σ 1 of the evolution matrix in Equation (17).

6.3. Cross-Shelf and Coastal Barriers

The cross-shelf exchange at meso- and submesoscales, specifically the exchange of nutrients, biota, materials, and heat between the continental shelf and the open ocean (or sea), is a central issue in coastal physical oceanography [99]. The cross-shelf gradients of hydrological properties are usually much greater as compared with the alongshore gradients. The barriers for the lateral transport of passive tracers can also affect the dispersal of pollutants, as shown in the preceding sections, and have very important biological consequences. The Lagrangian approach, based on the integration of particle trajectories and identifying coherent structures, is the most suitable one for analyzing cross-shelf transport. In the coastal zones, where the satellite altimetry does not work well, it is preferable to use the velocity fields produced by numerical models of circulation with high temporal and space resolutions or the coastal radar systems (see, e.g., [100]) that measure surface currents with horizontal resolutions of 100 m and accuracies of a few cm/s.
The impact of cross-shelf TBs on anthropological and natural pollution has been studied in a few gulfs and bays in different seas, from the Lagrangian point of view. The authors of [101] used radar-derived velocity field data along the southeastern Florida coast in order to extract LCSs there. They have shown that understanding the location of TBs can be used to minimize the effect of coastal pollution. A realization of the proposed algorithm can be applied to reduce the impact of a polluting source in a coastal area under certain conditions.
The FTLE diagnostic, based on the output of the hybrid-coordinate ocean model (HYCOM) with the 0.04 horizontal resolution, allowed revealing the presence of a cross-shelf HTB [102] near the boundary of the so-called “forbidden zone” [103] on the western Florida shelf. This zone has been detected by tracking the drifting floats deployed outside of it, which did not visit the zone. The presence of the barrier is important for the dispersal of pollutants and for the dispersion of toxic algae blooms. The Lagrangian simulation has shown that chaotic mixing dominates over turbulent mixing on time scales of up to two months [104]. The authors of [105] used FTLE and other Lagrangian indicators to identify stagnation areas, transport pathways, and TBs in the Peter the Great Bay (Japan Sea). The Lagrangian diagnostics allowed those authors to distinguish between different modes of water motion: recirculation, stagnation, and escape from the Bay [105].
The authors of [106] used FTLE and FSLE diagnostics in order to detect TBs in the Gulf of Trieste in the Mediterranean Sea. These diagnostics were calculated using the surface velocity field obtained by coastal radars. A comparison between the FTLE and FSLE diagnostics, used for detecting TBs, led to comparable results, confirming that these two measures provide similar results. These diagnostics also allowed the authors to find transport corridors along which the transport of particles is likely to occur. When comparing the results of LCS location calculations with the numerical trajectories of single passive particles, it has been shown that LCSs are robust against inaccuracies of the velocity fields. The average difference between the trajectories of drifters launched in the area and LCSs was estimated to be approximately 1.5 km, compared with a 7 km difference for numerical trajectories. Temporary TBs with with a width of 100 m, and a lifespan of a few days, have been observed in the Gulf of Eilat (Red Sea), based on observations of surface currents using high-frequency radar and aerial photographs [107].
Algae are small plants that live in both the sea and freshwater. Sometimes, they grow out of control and produce toxic effects on fish, birds, and other organisms. This phenomenon is called a harmful algal bloom or “red tides”, which can result in the widespread death of marine life (e.g., [108]). The authors of [104] proposed using simulated LCSs and associated HTBs to trace potential early locations of the development of algal blooms before drifting to an area where they could be detected on satellite images. Based on the results obtained before [102], they hypothesized that the presence of such HTB, inhibiting cross-shelf transport on the western Florida shelf, supports a considerable increase in the concentration of nutrients on the shoreside of the TB. This barrier behaves as a trap for nutrient demarcating “the forbidden zone” (see above), where the most frequent and abundant harmful algal blooms occur in the Gulf of Mexico. The LCS, constituting the HTB, was extracted from the surface and subsurface velocity currents produced by a data-assimilative HYCOM simulation over several years. These findings, as well as the results of particle-tracking numerical experiments, show that this HTB is a two-dimensional rather than a one-dimensional feature.

6.4. Transport Barriers in Advection of Plankton

Phytoplankton distribution on satellite images in different seas and oceans (electronic resource: https://oceancolor.gsfc.nasa.gov/SeaWiFS/) often looks like complicated patterns with swirls, filaments, and lobes. Phytoplankton, consisting of small plants with chlorophyll pigments, are advected by currents as passive impurities. The chlorophyll content on the sea surface can be measured from satellites. This allows for a comparison of the chlorophyll patterns on consecutive satellite images with the simulated movement of passive particles advected by the altimetric velocity field or by the surface velocity fields produced by numerical circulation models and reanalyses.
Transport barriers might have an unexpected impact on a long-standing problem in aquatic biology known as “the paradox of the plankton”: How it is possible for many phytoplankton species to coexist on limited resources in spite of the competition? In other words, how does a limited range of resources support an unexpectedly large number of coexisting plankton species, as revealed in many in situ observations? Starting from the seminal paper [109], a variety of solutions have been proposed to resolve this paradox invoking chaotic advection [110] and many other concepts. The coexistence of numerous phytoplankton species likely results from the simultaneous actions of multiple mechanisms, among which, there is room for TBs to create separated ecological niches.
Eddies in the ocean can transport water over long distances due to the presence of ETBs (see Section 3) that prevent water exchange between the eddy core and periphery. As shown in [111], if an eddy traps a less-fit plankton species during its formation, this species can survive for several months and be transported by the eddy over a long distance. The trapped species will come, of course, into contact with species outside, sooner or later, due to small-scale turbulent water exchange across imperfect ETBs and the finite eddy’s lifespan. In such cases, the ETBs can temporarily protect less-fit plankton species from competition with more adaptive ones.
Different phytoplankton species have different pigments. Information about the phytoplankton community can be extracted from the spectral properties of backscattered radiation using specific algorithms (see, e.g., [112]). The authors of [113] used the altimetric velocity field to simulate the advection of particles representing four species of phytoplankton, which were identified in the confluence zone of the Brazilian and Malvinas currents in the South Atlantic using ocean color data. The plankton species were processed using the algorithm developed in [112] to show that horizontal stirring stretches initial large-scale surface patches of simulated species into elongated submesoscale filaments, which are delineated by sharp horizontal gradients forming Lagrangian fronts. Mesoscale advection organizes phytoplankton communities into a mosaic of ecological niches with coexisting phytoplankton species separated by transport barriers. Altimetry-based daily calculations of the locations of these barriers allow tracking changes in the distribution of these ecological niches.

7. Barriers in 3D Flows

Most studies of TBs in geophysical flows were confined to 2D flows, where they were characterized as curves. Any material surface in a 3D flow is an invariant manifold and, hence, cannot be crossed by trajectories in the extended phase space. To detect special material surfaces, which act as observable TBs, i.e., 2D structures embedded in a 3D volume, different methods have been elaborated on using simple model flows [80,114,115,116]. Starting with the question—what objective property makes TBs observable?—Blazevski and Haller [117] proposed that a time-evolving material surface is an observed TB if “it imposes locally extreme deformation on nearby sets of initial conditions”. Studies of TBs in 3D geophysical flows are rare (see, however, [118,119,120,121]).
With growing progress in the accuracy of numerical circulation models and reanalyses, the extension of the 2D Lagrangian tools to 3D flows is on the agenda.
A few works have studied chaotic transport in 3D atmospheric flows. Tang et al. [118] used the FTLE diagnostic to extract and distinguish PTBs and HTBs from the 3D atmospheric dataset of a forecasting model for the case of a subtropical jet over Hawaii that was bounded by two PTBs that contributed to the creation of optical turbulence. This result was obtained by comparing the location of the barriers with the highest peaks of the refractive index obtained from balloon measurements. Curbelo et al. [122] studied 3D LCSs in the Antarctic stratospheric polar vortex using a reanalysis dataset. They analyzed and visualized these structures using a Lagrangian descriptor function M [123] that was able to delineate the boundary between the stratosphere and troposphere.
As for oceanic flows, Bettencourt et al. [119] studied 3D TBs in the Benguela upwelling system using the FSLE field in a region characterized by strong mixing. They focused on a cyclonic eddy at the upwelling front, obtained from an ROMS output, with the aim of knowing if there truly exists a barrier to particle transport at any depth. The boundaries of the eddy were composed of the intersections of repelling and attracting LCSs, which facilitated water exchange between the eddy and its surroundings, down to a maximum depth of 600 m, the depth at which the FSLE field was calculated.
Oxygen minimum zones are the areas where the interplay between physical and biological processes decreases the oxygen concentration, restricting water with low O 2 concentrations from mixing with surrounding waters. These zones are found worldwide at different depths, depending on local circumstances. One of the most pronounced and permanent oxygen minimum zones lies in the region off of Peru. The FSLE diagnostic was applied in [120], using the combination of ROMS and a biogeochemical model, with the aim of calculating the FSLE maxima and correlations between the average O 2 concentration at different depths. Because the FSLE maxima act as HTBs, large gradients of oxygen should be observed across them. The authors have revealed the boundaries of the mesoscale eddies and fronts as ETBs and HTBs that control water interchange and determine the edges of the Peruvian oxygen minimum zone.
Bettencourt et al. [121] investigated 3D LCSs and the cross-shore transport properties in the Iberian upwelling system. Computing the FSLE values from a 3D model velocity field, they extracted the FSLE maxima to study the spatial distribution and temporal evolution of the TBs evolving around the simulated upwelling filament. The strongest curtain-like LCSs delineate the boundaries of this structure and match large gradients of temperature and salinity, providing isolation of water inside the filament.

8. Conclusions

This paper summarizes different studies on transport barriers in the ocean and atmosphere from the Lagrangian point of view, which is the most natural one for detecting such barriers and analyzing their significance in the dispersal of different kinds of tracers. Elliptic transport barriers exist, mainly at the boundaries of vortex cores, preventing water (or air) exchange between the core and its surroundings. Parabolic barriers prevent cross-jet transport in meandering currents. Both types of barriers can be identified in different ways. Identifying the (partial) destruction of these barriers requires special methods borrowed from dynamical systems and chaos theories, which have been discussed using simple analytic models.
Hyperbolic barriers are less evident. They are the most influential repelling and attracting material lines (or surfaces in 3D cases) with the strongest local stability, which can be identified in real oceanic and atmospheric flows by calculating the maximal Lyapunov exponents. The transport barriers are fundamental features controlling the movement of anthropogenic and natural pollutants, plankton, cross-shelf exchange, and the propagation of upwelling fronts in coastal zones. Special attention was given to the discussion of the role of hyperbolic transport barriers in ecological issues.
There is, however, still a lot to understand about the significance of transport barriers. The majority of studies were carried out with 2D flows, for which the methods to identify and track these barriers in changing environments are well-elaborated. The investigation of transport barriers in 3D unsteady flows is currently underway. The application of Lagrangian methods to study the importance of transport barriers for the feeding and foraging behavior of pelagic fish, mammals, squid, and seabirds is particularly promising (as seen in a recent review [124]).

Supplementary Materials

The following supporting information can be downloaded at: https://www.mdpi.com/article/10.3390/sym15101942/s1, Figure S1: Geometric meaning of the singular-value decomposition of a 2 × 2 matrix.

Funding

The work was supported by the Russian Science Foundation (project no. 23-17-00068) with the help of a high-performance computing cluster at the Pacific Oceanological Institute and numerical codes elaborated within State Task no. 121021700341-2.

Data Availability Statement

The data and codes are available upon request to the author.

Conflicts of Interest

The author declares no conflict of interest.

Abbreviations

The following abbreviations are used in this manuscript:
TBtransport barrier
LCSLagrangian coherent structure
ETBelliptic transport barrier
PTBparabolic transport barrier
HTBhyperbolic transport barrier
VAVDLagrangian-averaged vorticity deviation
CJTcross-jet transport
CICcentral invariant curve
FTLEfinite-time Lyapunov exponent
FSLEfinite-size Lyapunov exponent

References

  1. Arnold, V.I.; Kozlov, V.V.; Neishtadt, A.I. Mathematical Aspects of Classical and Celestial Mechanics, 3rd ed.; Encyclopaedia of Mathematical Sciences; Springer: New York, NY, USA, 2006; Volume 3, p. XIII, 505. [Google Scholar] [CrossRef]
  2. Wiggins, S. Chaotic Transport in Dynamical Systems; Interdisciplinary Applied Mathematics; Springer: New York, NY, USA, 1992; Volume 2, p. 301. [Google Scholar] [CrossRef]
  3. Meiss, J.D. Symplectic maps, variational principles, and transport. Rev. Mod. Phys. 1992, 64, 795–848. [Google Scholar] [CrossRef]
  4. Prants, S.V.; Uleysky, M.Y.; Budyansky, M.V. Lagrangian Oceanography: Large-Scale Transport and Mixing in the Ocean; Physics of Earth and Space Environments; Springer: Berlin/Heidelberg, Germany, 2017; p. XIV, 273. [Google Scholar] [CrossRef]
  5. Boffetta, G.; Lacorata, G.; Redaelli, G.; Vulpiani, A. Detecting barriers to transport: A review of different techniques. Phys. D Nonlinear Phenom. 2001, 159, 58–70. [Google Scholar] [CrossRef]
  6. d’Ovidio, F.; Fernández, V.; Hernández-García, E.; López, C. Mixing structures in the Mediterranean Sea from finite-size Lyapunov exponents. Geophys. Res. Lett. 2004, 31, L17203. [Google Scholar] [CrossRef]
  7. Budyansky, M.; Uleysky, M.; Prants, S. Chaotic scattering, transport, and fractals in a simple hydrodynamic flow. J. Exp. Theor. Phys. 2004, 99, 1018–1027. [Google Scholar] [CrossRef]
  8. Haller, G.; Beron-Vera, F.J. Geodesic theory of transport barriers in two-dimensional flows. Phys. D Nonlinear Phenom. 2012, 241, 1680–1702. [Google Scholar] [CrossRef]
  9. Haller, G. Lagrangian coherent structures from approximate velocity data. Phys. Fluids 2002, 14, 1851–1861. [Google Scholar] [CrossRef]
  10. Haller, G. Lagrangian Coherent Structures. Annu. Rev. Fluid Mech. 2015, 47, 137–162. [Google Scholar] [CrossRef]
  11. Haller, G. A variational theory of hyperbolic Lagrangian Coherent Structures. Phys. D Nonlinear Phenom. 2011, 240, 574–598. [Google Scholar] [CrossRef]
  12. Aref, H. Stirring by chaotic advection. J. Fluid Mech. 1984, 143, 1–21. [Google Scholar] [CrossRef]
  13. Aref, H. The development of chaotic advection. Phys. Fluids 2002, 14, 1315–1325. [Google Scholar] [CrossRef]
  14. Kozlov, V. Symmetries, Topology and Resonances in Hamiltonian Mechanics; UdGU: Izhevsk, Russia, 1995; p. 432. (In Russian) [Google Scholar]
  15. Budyansky, M.V.; Prants, S.V. A mechanism of chaotic mixing in an elementary deterministic flow. Tech. Phys. Lett. 2001, 27, 508–510. [Google Scholar] [CrossRef]
  16. Zaslavsky, G.M. Hamiltonian Chaos and Fractional Dynamics; Oxford University Press: New York, NY, USA, 2005. [Google Scholar]
  17. Zhmur, V.V.; Ryzhov, E.A.; Koshel, K.V. Ellipsoidal vortex in a nonuniform flow: Dynamics and chaotic advections. J. Mar. Res. 2011, 69, 435–461. [Google Scholar] [CrossRef]
  18. Koshel, K.V.; Ryzhov, E.A.; Zhmur, V.V. Diffusion-affected passive scalar transport in an ellipsoidal vortex in a shear flow. Nonlinear Process. Geophys. 2013, 20, 437–444. [Google Scholar] [CrossRef]
  19. Koshel, K.V.; Ryzhov, E.A. Parametric resonance in the dynamics of an elliptic vortex in a periodically strained environment. Nonlinear Process. Geophys. 2017, 24, 1–8. [Google Scholar] [CrossRef]
  20. Izrailsky, Y.G.; Koshel, K.V.; Stepanov, D.V. Determination of optimal excitation frequency range in background flows. Chaos Interdiscip. J. Nonlinear Sci. 2008, 18, 013107. [Google Scholar] [CrossRef]
  21. Koshel, K.V.; Sokolovskiy, M.A.; Davies, P.A. Chaotic advection and nonlinear resonances in an oceanic flow above submerged obstacle. Fluid Dyn. Res. 2008, 40, 695–736. [Google Scholar] [CrossRef]
  22. Ryzhov, E.A.; Koshel’, K.V. Chaotic transport and mixing of a passive admixture by vortex flows behind obstacles. Izv. Atmos. Ocean. Phys. 2010, 46, 184–191. [Google Scholar] [CrossRef]
  23. Owen, R.W. Fronts and Eddies in the Sea: Mechanisms, Interactions and Biological Effects. In Analysis of Marine Ecosystems; Longhurst, A.R., Ed.; Academic Press Inc.: London, UK, 1981; pp. 197–233. [Google Scholar]
  24. Dong, C.; McWilliams, J.C.; Liu, Y.; Chen, D. Global heat and salt transports by eddy movement. Nat. Commun. 2014, 5, 3294. [Google Scholar] [CrossRef]
  25. Prants, S.V. Trench Eddies in the Northwest Pacific: An Overview. Izv. Atmos. Ocean. Phys. 2021, 57, 341–353. [Google Scholar] [CrossRef]
  26. Zhao, D.; Xu, Y.; Zhang, X.; Huang, C. Global chlorophyll distribution induced by mesoscale eddies. Remote Sens. Environ. 2021, 254, 112245. [Google Scholar] [CrossRef]
  27. Xia, Q.; Li, G.; Dong, C. Global Oceanic Mass Transport by Coherent Eddies. J. Phys. Oceanogr. 2022, 52, 1111–1132. [Google Scholar] [CrossRef]
  28. Ueno, H.; Bracco, A.; Barth, J.A.; Budyansky, M.V.; Hasegawa, D.; Itoh, S.; Kim, S.Y.; Ladd, C.; Lin, X.; Park, Y.G.; et al. Review of oceanic mesoscale processes in the North Pacific: Physical and biogeochemical impacts. Prog. Oceanogr. 2023, 212, 102955. [Google Scholar] [CrossRef]
  29. Dugan, J.P.; Mied, R.P.; Mignerey, P.C.; Schuetz, A.F. Compact, intrathermocline eddies in the Sargasso Sea. J. Geophys. Res. Oceans 1982, 87, 385–393. [Google Scholar] [CrossRef]
  30. Gordon, A.L.; Giulivi, C.F.; Lee, C.M.; Furey, H.H.; Bower, A.; Talley, L. Japan/East Sea Intrathermocline Eddies. J. Phys. Oceanogr. 2002, 32, 1960–1974. [Google Scholar] [CrossRef]
  31. Hormazabal, S.; Combes, V.; Morales, C.E.; Correa-Ramirez, M.A.; Di Lorenzo, E.; Nuñez, S. Intrathermocline eddies in the coastal transition zone off central Chile (31–41 S). J. Geophys. Res. Ocean. 2013, 118, 4811–4821. [Google Scholar] [CrossRef]
  32. Sokolovskiy, M.A.; Filyushkin, B.N.; Carton, X.J. Dynamics of intrathermocline vortices in a gyre flow over a seamount chain. Ocean Dyn. 2013, 63, 741–760. [Google Scholar] [CrossRef]
  33. Sokolovskiy, M.A.; Verron, J. Dynamics of Vortex Structures in a Stratified Rotating Fluid; Atmospheric and Oceanographic Sciences Library; Springer International Publishing: New York, NY, USA, 2014; Volume 47. [Google Scholar] [CrossRef]
  34. Sokolovskiy, M.A.; Verron, J. Finite-core hetons: Stability and interactions. J. Fluid Mech. 2000, 423, 127–154. [Google Scholar] [CrossRef]
  35. Sokolovskiy, M.A.; Carton, X.J. Baroclinic multipole formation from heton interaction. Fluid Dyn. Res. 2010, 42, 045501. [Google Scholar] [CrossRef]
  36. Carton, X.J. Hydrodynamical modeling of oceanic vortices. Surv. Geophys. 2001, 22, 179–263. [Google Scholar] [CrossRef]
  37. Cushman-Roisin, B.; Beckers, J.M. Introduction to Geophysical Fluid Dynamics, Physical and Numerical Aspects, 2nd ed.; International Geophysics; Academic Press: Cambridge, MA, USA, 2011; Volume 101. [Google Scholar]
  38. Jorba, A.; Simo, C. On Quasi-Periodic Perturbations of Elliptic Equilibrium Points. SIAM J. Math. Anal. 1996, 27, 1704–1737. [Google Scholar] [CrossRef]
  39. Peacock, T.; Haller, G. Lagrangian coherent structures: The hidden skeleton of fluid flows. Phys. Today 2013, 66, 41–47. [Google Scholar] [CrossRef]
  40. Haller, G.; Hadjighasem, A.; Farazmand, M.; Huhn, F. Defining coherent vortices objectively from the vorticity. J. Fluid Mech. 2016, 795, 136–173. [Google Scholar] [CrossRef]
  41. Chelton, D.B.; Schlax, M.G.; Samelson, R.M. Global observations of nonlinear mesoscale eddies. Prog. Oceanogr. 2011, 91, 167–216. [Google Scholar] [CrossRef]
  42. Dong, C.; Nencioli, F.; Liu, Y.; McWilliams, J.C. An Automated Approach to Detect Oceanic Eddies From Satellite Remotely Sensed Sea Surface Temperature Data. IEEE Geosci. Remote. Sens. Lett. 2011, 8, 1055–1059. [Google Scholar] [CrossRef]
  43. Le Vu, B.; Stegner, A.; Arsouze, T. Angular Momentum Eddy Detection and Tracking Algorithm (AMEDA) and Its Application to Coastal Eddy Formation. J. Atmos. Ocean. Technol. 2018, 35, 739–762. [Google Scholar] [CrossRef]
  44. Wang, Y.; Beron-Vera, F.J.; Olascoaga, M.J. The life cycle of a coherent Lagrangian Agulhas ring. J. Geophys. Res. Ocean. 2016, 121, 3944–3954. [Google Scholar] [CrossRef]
  45. Fu, L.L. Pattern and velocity of propagation of the global ocean eddy variability. J. Geophys. Res. Ocean. 2009, 114, C11017. [Google Scholar] [CrossRef]
  46. Abdalla, S.; Kolahchi, A.A.; Ablain, M.; Adusumilli, S.; Bhowmick, S.A.; Alou-Font, E.; Amarouche, L.; Andersen, O.B.; Antich, H.; Aouf, L.; et al. Altimetry for the future: Building on 25 years of progress. Adv. Space Res. 2021, 68, 319–363. [Google Scholar] [CrossRef]
  47. Faghmous, J.H.; Frenger, I.; Yao, Y.; Warmka, R.; Lindell, A.; Kumar, V. A daily global mesoscale ocean eddy dataset from satellite altimetry. Sci. Data 2015, 2, 150028. [Google Scholar] [CrossRef]
  48. Prants, S.V.; Budyansky, M.V.; Uleysky, M.Y. How Eddies Gain, Retain, and Release Water: A Case Study of a Hokkaido Anticyclone. J. Geophys. Res. Ocean. 2018, 123, 2081–2096. [Google Scholar] [CrossRef]
  49. Budyansky, M.V.; Prants, S.V.; Uleysky, M.Y. Odyssey of Aleutian eddies. Ocean Dyn. 2022, 72, 455–476. [Google Scholar] [CrossRef]
  50. Udalov, A.; Budyansky, M.; Prants, S. A census and properties of mesoscale Kuril eddies in the altimetry era. Deep. Sea Res. Part I Oceanogr. Res. Pap. 2023, 200, 104129. [Google Scholar] [CrossRef]
  51. Liu, Y.; Dong, C.; Guan, Y.; Chen, D.; McWilliams, J.; Nencioli, F. Eddy analysis in the subtropical zonal band of the North Pacific Ocean. Deep. Sea Res. Part I Oceanogr. Res. Pap. 2012, 68, 54–67. [Google Scholar] [CrossRef]
  52. Liu, T.; Abernathey, R. A global Lagrangian eddy dataset based on satellite altimetry. Earth Syst. Sci. Data 2023, 15, 1765–1778. [Google Scholar] [CrossRef]
  53. Abernathey, R.; Haller, G. Transport by Lagrangian Vortices in the Eastern Pacific. J. Phys. Oceanogr. 2018, 48, 667–685. [Google Scholar] [CrossRef]
  54. McIntyre, M.; Palmer, T. The ‘surf zone’ in the stratosphere. J. Atmos. Terr. Phys. 1984, 46, 825–849. [Google Scholar] [CrossRef]
  55. Bowman, K.P. Large-scale isentropic mixing properties of the Antarctic polar vortex from analyzed winds. J. Geophys. Res. 1993, 98, 23013–23027. [Google Scholar] [CrossRef]
  56. Shepherd, T.G. Transport in the Middle Atmosphere. J. Meteorol. Soc. Jpn. Ser. II 2007, 85, 165–191. [Google Scholar] [CrossRef]
  57. Manney, G.L.; Santee, M.L.; Rex, M.; Livesey, N.J.; Pitts, M.C.; Veefkind, P.; Nash, E.R.; Wohltmann, I.; Lehmann, R.; Froidevaux, L.; et al. Unprecedented Arctic ozone loss in 2011. Nature 2011, 478, 469–475. [Google Scholar] [CrossRef]
  58. Pierrehumbert, R.T. Chaotic mixing of tracer and vorticity by modulated travelling Rossby waves. Geophys. Astrophys. Fluid Dyn. 1991, 58, 285–319. [Google Scholar] [CrossRef]
  59. Pierrehumbert, R.T.; Yang, H. Global Chaotic Mixing on Isentropic Surfaces. J. Atmos. Sci. 1993, 50, 2462–2480. [Google Scholar] [CrossRef]
  60. Joseph, B.; Legras, B. Relation between Kinematic Boundaries, Stirring, and Barriers for the Antarctic Polar Vortex. J. Atmos. Sci. 2002, 59, 1198–1212. [Google Scholar] [CrossRef]
  61. de la Cámara, A.; Mancho, A.M.; Ide, K.; Serrano, E.; Mechoso, C.R. Routes of Transport across the Antarctic Polar Vortex in the Southern Spring. J. Atmos. Sci. 2012, 69, 741–752. [Google Scholar] [CrossRef]
  62. Olascoaga, M.J.; Brown, M.G.; Beron-Vera, F.J.; Koçak, H. Brief communication “Stratospheric winds, transport barriers and the 2011 Arctic ozone hole”. Nonlinear Process. Geophys. 2012, 19, 687–692. [Google Scholar] [CrossRef]
  63. Bower, A.S. A Simple Kinematic Mechanism for Mixing Fluid Parcels across a Meandering Jet. J. Phys. Oceanogr. 1991, 21, 173–180. [Google Scholar] [CrossRef]
  64. Samelson, R.M. Fluid Exchange across a Meandering Jet. J. Phys. Oceanogr. 1992, 22, 431–444. [Google Scholar] [CrossRef]
  65. Raynal, F.; Wiggins, S. Lobe dynamics in a kinematic model of a meandering jet. I. Geometry and statistics of transport and lobe dynamics with accelerated convergence. Phys. D Nonlinear Phenom. 2006, 223, 7–25. [Google Scholar] [CrossRef]
  66. Prants, S.V.; Budyansky, M.V.; Uleysky, M.Y.; Zaslavsky, G.M. Chaotic mixing and transport in a meandering jet flow. Chaos Interdiscip. J. Nonlinear Sci. 2006, 16, 033117. [Google Scholar] [CrossRef]
  67. Uleysky, M.Y.; Budyansky, M.V.; Prants, S.V. Genesis and bifurcations of unstable periodic orbits in a jet flow. J. Phys. A Math. Theor. 2008, 41, 215102. [Google Scholar] [CrossRef]
  68. Koshel’, K.V.; Prants, S.V. Chaotic advection in the ocean. Phys.-Uspekhi 2006, 49, 1151–1178. [Google Scholar] [CrossRef]
  69. del Castillo-Negrete, D.; Morrison, P.J. Chaotic transport by Rossby waves in shear flow. Phys. Fluids A Fluid Dyn. 1993, 5, 948–965. [Google Scholar] [CrossRef]
  70. Rypina, I.I.; Brown, M.G.; Beron-Vera, F.J.; Koçak, H.; Olascoaga, M.J.; Udovydchenkov, I.A. On the Lagrangian Dynamics of Atmospheric Zonal Jets and the Permeability of the Stratospheric Polar Vortex. J. Atmos. Sci. 2007, 64, 3595–3610. [Google Scholar] [CrossRef]
  71. Haynes, P.H.; Poet, D.A.; Shuckburgh, E.F. Transport and Mixing in Kinematic and Dynamically Consistent Flows. J. Atmos. Sci. 2007, 64, 3640–3651. [Google Scholar] [CrossRef]
  72. Uleysky, M.Y.; Budyansky, M.V.; Prants, S.V. Mechanism of destruction of transport barriers in geophysical jets with Rossby waves. Phys. Rev. E 2010, 81, 017202. [Google Scholar] [CrossRef] [PubMed]
  73. Uleysky, M.Y.; Budyansky, M.V.; Prants, S.V. Chaotic transport across two-dimensional jet streams. J. Exp. Theor. Phys. 2010, 111, 1039–1049. [Google Scholar] [CrossRef]
  74. Sommeria, J.; Meyers, S.D.; Swinney, H.L. Laboratory model of a planetary eastward jet. Nature 1989, 337, 58–61. [Google Scholar] [CrossRef]
  75. Solomon, T.H.; Holloway, W.J.; Swinney, H.L. Shear flow instabilities and Rossby waves in barotropic flow in a rotating annulus. Phys. Fluids A Fluid Dyn. 1993, 5, 1971–1982. [Google Scholar] [CrossRef]
  76. Kuo, H.l. Dynamic instability of two-dimensional nondivergent flow in a barotropic atmosphere. J. Meteorol. 1949, 6, 105–122. [Google Scholar] [CrossRef]
  77. Budyansky, M.V.; Uleysky, M.Y.; Prants, S.V. Detection of barriers to cross-jet Lagrangian transport and its destruction in a meandering flow. Phys. Rev. E 2009, 79, 056215. [Google Scholar] [CrossRef]
  78. Shinohara, S.; Aizawa, Y. The Breakup Condition of Shearless KAM Curves in the Quadratic Map. Prog. Theor. Phys. 1997, 97, 379–385. [Google Scholar] [CrossRef]
  79. Behringer, R.P.; Meyers, S.D.; Swinney, H.L. Chaos and mixing in a geostrophic flow. Phys. Fluids A Fluid Dyn. 1991, 3, 1243–1249. [Google Scholar] [CrossRef]
  80. Haller, G. Distinguished material surfaces and coherent structures in three-dimensional fluid flows. Phys. D Nonlinear Phenom. 2001, 149, 248–277. [Google Scholar] [CrossRef]
  81. Prants, S.V.; Budyansky, M.V.; Ponomarev, V.I.; Uleysky, M.Y. Lagrangian study of transport and mixing in a mesoscale eddy street. Ocean Model. 2011, 38, 114–125. [Google Scholar] [CrossRef]
  82. Shadden, S.C.; Lekien, F.; Marsden, J.E. Definition and properties of Lagrangian coherent structures from finite-time Lyapunov exponents in two-dimensional aperiodic flows. Phys. D Nonlinear Phenom. 2005, 212, 271–304. [Google Scholar] [CrossRef]
  83. Michel, J.; Fingas, M. Oil Spills: Causes, Consequences, Prevention, and Countermeasures. In Fossil Fuels; Crawley, G.M., Ed.; World Scientific: Singapore, 2016; Volume 1, Chapter 7; pp. 159–201. [Google Scholar] [CrossRef]
  84. Varlamov, S.M.; Yoon, J.H.; Hirose, N.; Kawamura, H.; Shiohara, K. Simulation of the oil spill processes in the Sea of Japan with regional ocean circulation model. J. Mar. Sci. Technol. 1999, 4, 94–107. [Google Scholar] [CrossRef]
  85. Ono, J.; Ohshima, K.I.; Uchimoto, K.; Ebuchi, N.; Mitsudera, H.; Yamaguchi, H. Particle-tracking simulation for the drift/diffusion of spilled oils in the Sea of Okhotsk with a three-dimensional, high-resolution model. J. Oceanogr. 2013, 69, 413–428. [Google Scholar] [CrossRef]
  86. Qiao, F.; Wang, G.; Yin, L.; Zeng, K.; Zhang, Y.; Zhang, M.; Xiao, B.; Jiang, S.; Chen, H.; Chen, G. Modelling oil trajectories and potentially contaminated areas from the Sanchi oil spill. Sci. Total. Environ. 2019, 685, 856–866. [Google Scholar] [CrossRef]
  87. Korotenko, K.; Mamedov, R.; Kontar, A.; Korotenko, L. Particle tracking method in the approach for prediction of oil slick transport in the sea: Modelling oil pollution resulting from river input. J. Mar. Syst. 2004, 48, 159–170. [Google Scholar] [CrossRef]
  88. Prants, S.V.; Budyansky, M.V.; Fayman, P.A.; Uleysky, M.Y.; Didov, A.A. Lagrangian Oil Spill Simulation in Peter the Great Bay (Sea of Japan) with a High-Resolution ROMS Model. Pure Appl. Geophys. 2023, 180, 551–568. [Google Scholar] [CrossRef]
  89. Olascoaga, M.J.; Haller, G. Forecasting sudden changes in environmental pollution patterns. Proc. Natl. Acad. Sci. USA 2012, 109, 4738–4743. [Google Scholar] [CrossRef]
  90. Duran, R.; Beron-Vera, F.J.; Olascoaga, M.J. Extracting quasi-steady Lagrangian transport patterns from the ocean circulation: An application to the Gulf of Mexico. Sci. Rep. 2018, 8, 5218. [Google Scholar] [CrossRef] [PubMed]
  91. Fifani, G.; Baudena, A.; Fakhri, M.; Baaklini, G.; FaugÚre, Y.; Morrow, R.; Mortier, L.; d’Ovidio, F. Drifting Speed of Lagrangian Fronts and Oil Spill Dispersal at the Ocean Surface. Remote Sens. 2021, 13, 4499. [Google Scholar] [CrossRef]
  92. Prants, S.V.; Uleysky, M.Y.; Budyansky, M.V. Numerical simulation of propagation of radioactive pollution in the ocean from the Fukushima Dai-ichi nuclear power plant. Dokl. Earth Sci. 2011, 439, 1179–1182. [Google Scholar] [CrossRef]
  93. Tsumune, D.; Tsubono, T.; Aoyama, M.; Hirose, K. Distribution of oceanic 137Cs from the Fukushima Dai-ichi Nuclear Power Plant simulated numerically by a regional ocean model. J. Environ. Radioact. 2012, 111, 100–108. [Google Scholar] [CrossRef]
  94. Rossi, V.; Sebille, E.V.; Gupta, A.S.; Garçon, V.; England, M.H. Multi-decadal projections of surface and interior pathways of the Fukushima Cesium-137 radioactive plume. Deep Sea Res. Part I Oceanogr. Res. Pap. 2013, 80, 37–46. [Google Scholar] [CrossRef]
  95. Budyansky, M.V.; Goryachev, V.A.; Kaplunenko, D.D.; Lobanov, V.B.; Prants, S.V.; Sergeev, A.F.; Shlyk, N.V.; Uleysky, M.Y. Role of mesoscale eddies in transport of Fukushima-derived cesium isotopes in the ocean. Deep Sea Res. Part I Oceanogr. Res. Pap. 2015, 96, 15–27. [Google Scholar] [CrossRef]
  96. Prants, S.V.; Budyansky, M.V.; Uleysky, M.Y. Lagrangian simulation and tracking of the mesoscale eddies contaminated by Fukushima-derived radionuclides. Ocean Sci. 2017, 13, 453–463. [Google Scholar] [CrossRef]
  97. Budyansky, M.; Fayman, P.; Uleysky, M.; Prants, S. The impact of circulation features on the dispersion of radionuclides after the nuclear submarine accident in Chazhma Bay (Japan Sea) in 1985: A retrospective Lagrangian simulation. Mar. Pollut. Bull. 2022, 177, 113483. [Google Scholar] [CrossRef]
  98. Sarkisov, A.A.; Vysotskii, V.L.; Pripachkin, D.A. Reconstruction of the Radioactive Contamination Occurring in the Environment in Primorskii Krai as a Result of a Nuclear Accident on a Submarine in Bukhta Chazhma. At. Energy 2020, 127, 159–165. [Google Scholar] [CrossRef]
  99. Brink, K. Cross-Shelf Exchange. Annu. Rev. Mar. Sci. 2016, 8, 59–78. [Google Scholar] [CrossRef]
  100. Paduan, J.D.; Washburn, L. High-Frequency Radar Observations of Ocean Surface Currents. Annu. Rev. Mar. Sci. 2013, 5, 115–136. [Google Scholar] [CrossRef]
  101. Lekien, F.; Coulliette, C.; Mariano, A.J.; Ryan, E.H.; Shay, L.K.; Haller, G.; Marsden, J. Pollution release tied to invariant manifolds: A case study for the coast of Florida. Phys. D Nonlinear Phenom. 2005, 210, 1–20. [Google Scholar] [CrossRef]
  102. Olascoaga, M.J.; Rypina, I.I.; Brown, M.G.; Beron-Vera, F.J.; Koçak, H.; Brand, L.E.; Halliwell, G.R.; Shay, L.K. Persistent transport barrier on the West Florida Shelf. Geophys. Res. Lett. 2006, 33, L22603. [Google Scholar] [CrossRef] [PubMed]
  103. Yang, H.; Weisberg, R.H.; Niiler, P.; Sturges, W.; Johnson, W. Lagrangian circulation and forbidden zone on the West Florida Shelf. Cont. Shelf Res. 1999, 19, 1221–1245. [Google Scholar] [CrossRef]
  104. Olascoaga, M.J.; Beron-Vera, F.J.; Brand, L.E.; Koçak, H. Tracing the early development of harmful algal blooms on the West Florida Shelf with the aid of Lagrangian coherent structures. J. Geophys. Res. Ocean. 2008, 113, C12014. [Google Scholar] [CrossRef] [PubMed]
  105. Prants, S.V.; Ponomarev, V.I.; Budyansky, M.V.; Uleysky, M.Y.; Fayman, P.A. Lagrangian analysis of mixing and transport of water masses in the marine bays. Izv. Atmos. Ocean. Phys. 2013, 49, 82–96. [Google Scholar] [CrossRef]
  106. Enrile, F.; Besio, G.; Stocchino, A.; Magaldi, M.; Mantovani, C.; Cosoli, S.; Gerin, R.; Poulain, P. Evaluation of surface Lagrangian transport barriers in the Gulf of Trieste. Cont. Shelf Res. 2018, 167, 125–138. [Google Scholar] [CrossRef]
  107. Gildor, H.; Fredj, E.; Steinbuck, J.; Monismith, S. Evidence for Submesoscale Barriers to Horizontal Mixing in the Ocean from Current Measurements and Aerial Photographs. J. Phys. Oceanogr. 2009, 39, 1975–1983. [Google Scholar] [CrossRef]
  108. Landsberg, J.H. The Effects of Harmful Algal Blooms on Aquatic Organisms. Rev. Fish. Sci. 2002, 10, 113–390. [Google Scholar] [CrossRef]
  109. Hutchinson, G.E. The Paradox of the Plankton. Am. Nat. 1961, 95, 137–145. [Google Scholar] [CrossRef]
  110. Károlyi, G.; Péntek, A.; Scheuring, I.; Tél, T.; Toroczkai, Z. Chaotic flow: The physics of species coexistence. Proc. Natl. Acad. Sci. USA 2000, 97, 13661–13665. [Google Scholar] [CrossRef] [PubMed]
  111. Bracco, A.; Provenzale, A.; Scheuring, I. Mesoscale vortices and the paradox of the plankton. Proc. R. Soc. Lond. Ser. B Biol. Sci. 2000, 267, 1795–1800. [Google Scholar] [CrossRef] [PubMed]
  112. Alvain, S.; Moulin, C.; Dandonneau, Y.; Loisel, H. Seasonal distribution and succession of dominant phytoplankton groups in the global ocean: A satellite view. Glob. Biogeochem. Cycles 2008, 22, GB3001. [Google Scholar] [CrossRef]
  113. d’Ovidio, F.; De Monte, S.; Alvain, S.; Dandonneau, Y.; Levy, M. Fluid dynamical niches of phytoplankton types. Proc. Natl. Acad. Sci. USA 2010, 107, 18366–18370. [Google Scholar] [CrossRef]
  114. Sulman, M.H.M.; Huntley, H.S.; Lipphardt, B.L.; Kirwan, A.D. Leaving flatland: Diagnostics for Lagrangian coherent structures in three-dimensional flows. Phys. D Nonlinear Phenom. 2013, 258, 77–92. [Google Scholar] [CrossRef]
  115. Mancho, A.M.; Wiggins, S.; Curbelo, J.; Mendoza, C. Lagrangian descriptors: A method for revealing phase space structures of general time dependent dynamical systems. Commun. Nonlinear Sci. Numer. Simul. 2013, 18, 3530–3557. [Google Scholar] [CrossRef]
  116. Bettencourt, J.H.; López, C.; Hernández-García1, E. Characterization of coherent structures in three-dimensional turbulent flows using the finite-size Lyapunov exponent. J. Phys. A Math. Theor. 2013, 46, 254022. [Google Scholar] [CrossRef]
  117. Blazevski, D.; Haller, G. Hyperbolic and elliptic transport barriers in three-dimensional unsteady flows. Phys. D Nonlinear Phenom. 2014, 273–274, 46–62. [Google Scholar] [CrossRef]
  118. Tang, W.; Mathur, M.; Haller, G.; Hahn, D.C.; Ruggiero, F.H. Lagrangian Coherent Structures near a Subtropical Jet Stream. J. Atmos. Sci. 2010, 67, 2307–2319. [Google Scholar] [CrossRef]
  119. Bettencourt, J.H.; Lopez, C.; Hernandez-Garcia, E. Oceanic three-dimensional Lagrangian coherent structures: A study of a mesoscale eddy in the Benguela upwelling region. Ocean Model. 2012, 51, 73–83. [Google Scholar] [CrossRef]
  120. Bettencourt, J.; López, C.; Hernández-García, E.; Montes, I.; Sudre, J.; Dewitte, B.; Paulmier, A.; Garçon, V. Boundaries of the Peruvian oxygen minimum zone shaped by coherent mesoscale dynamics. Nat. Geosci. 2015, 8, 937–940. [Google Scholar] [CrossRef]
  121. Bettencourt, J.H.; Rossi, V.; Hernández-García, E.; Marta-Almeida, M.; López, C. Characterization of the structure and cross-shore transport properties of a coastal upwelling filament using three-dimensional finite-size Lyapunov exponents. J. Geophys. Res. Ocean. 2017, 122, 7433–7448. [Google Scholar] [CrossRef]
  122. Curbelo, J.; GarcÃa-Garrido, V.J.; Mechoso, C.R.; Mancho, A.M.; Wiggins, S.; Niang, C. Insights into the three-dimensional Lagrangian geometry of the Antarctic polar vortex. Nonlinear Process. Geophys. 2017, 24, 379–392. [Google Scholar] [CrossRef]
  123. Madrid, J.A.J.; Mancho, A.M. Distinguished trajectories in time dependent vector fields. Chaos Interdiscip. J. Nonlinear Sci. 2009, 19, 013111. [Google Scholar] [CrossRef]
  124. Prants, S. Marine life at Lagrangian fronts. Prog. Oceanogr. 2022, 204, 102790. [Google Scholar] [CrossRef]
Figure 1. The illustration of the destruction of a transport barrier in a Hamiltonian system under a small perturbation. (a) The separatrix loop (dashed curve) with the stream function Ψ su is a transport barrier between two domains in the phase space. Two trajectories of fluid particles “b” and “e” inside and outside the loop (thin curves) with the stream functions Ψ 0 ( b ) and Ψ 0 ( e ) are shown. (b) Splitting of the stable W s and unstable W u manifolds associated with the saddle point under perturbation that breaks down the transport barrier, allowing particles to quit the domain with finite motion. Particle “b” goes outside from the separatrix loop (the bold curve in panel (a)). (c) The transversal intersection scheme of the invariant manifolds on the Poincaré section.
Symmetry 15 01942 g001
Figure 2. Poincaré sections of the model flow with two propagating Rossby waves (10) with N 1 = 5 and N 2 = 1 in the moving reference frame ( A 1 = 0.2416 , N 1 = 5 and N 2 = 1 ). The perturbation amplitude (a) A 2 = 0 (steady flow). (b) A 2 = 0.09 (stochastic layers appear on both sides of the jet, but CIC, shown in bold, provides a barrier to CJT). (c) A 2 = 0.095 (CIC is destroyed and replaced by the stochastic layer, where a local chaotic CJT is observed). (d) A 2 = 0.2 (onset of the global chaotic CJT).
Symmetry 15 01942 g002
Figure 3. Breakdown of CIC and chaotic CJT at A 1 = 0.2418 , N 1 = 5 , and N 2 = 1 . (a,b) The indicator point iterations are located along CIC ( A 2 = 0.067 ) and along the almost periodic central orbit ( A 2 = 0.08703 ), respectively. (c) CIC is destroyed, and the iterations lay inside the stochastic layer with a local chaotic CJT ( A 2 = 0.088 ). (d) CIC is destroyed, and the iterations are located inside the stochastic layer with a global chaotic CJT ( A 2 = 0.2 ). The insets are zooms of the phase space near the 7:3 resonance islands.
Symmetry 15 01942 g003
Figure 4. The map of winding numbers vs. the amplitudes of Rossby waves with N 1 / N 2 = 5 / 1 . The value of w is coded in gray. The area in white corresponds to a CJT regime.
Symmetry 15 01942 g004
Figure 5. The illustration of an HTB near the associated hyperbolic point (cross). (a) The blobs with tracers approach this point along the repelling stable manifold W s (b) and then are advected away from it along the attracting unstable manifold W u . (c) The unstable manifold attracts all nearby fluid particles, stretches out the blobs to adopt its shape, and acts as an HTB for the tracers.
Symmetry 15 01942 g005
Figure 6. The FTLE maps, typical for the cold season, show fast removal of the spilled oil from the terminal. The oil slick, composed of green particles, which were released at 00:00 GMT on 1 January, 2009, spreads along the HTB. This HTB, acting as a Lagrangian front (LF), is drifting away from the coast. The Λ values are given in days 1 . ★ = Kozmino oil port. SB = Strelok Bay; VB = Vostok Bay; NB = Nakhodka Bay; CL = Cape Likhachev; CP = Cape Povorotny; Pr is the mouth of the Razdolnaya River. Adapted from [88] with the permission from Springer Nature. The panels (ad) show the spilled oil on the 1st, 2nd, 3rd and 4th January, 2009.
Symmetry 15 01942 g006
Figure 7. The FTLE maps, typical for the warm season, show the trapping of the spilled oil near the coast after the deployment at 00:00 GMT on 1 June 2009. The HTB, acting as a drifting Lagrangian front (LF), prevents the spread of the oil slick to the open sea. The panels (ad) show the spilled oil on the 1st, 2nd, 3rd and 5th June, 2009. Adapted from [88] with the permission from Springer Nature.
Symmetry 15 01942 g007
Figure 8. The FTLE map with imposed velocity field at a depth of 10 m at 7:00 h on 14 August of 1985. The colors show the values of the initial concentration of the radionuclides deposited on the sea surface, with the bright colors meaning higher concentrations (see Figure 4 in [97]). The upward (downward) oriented triangles are the centers of the anticyclones (cyclones) on this date, and the crosses are hyperbolic points. The Λ values are given in days 1 .
Symmetry 15 01942 g008
Disclaimer/Publisher’s Note: The statements, opinions and data contained in all publications are solely those of the individual author(s) and contributor(s) and not of MDPI and/or the editor(s). MDPI and/or the editor(s) disclaim responsibility for any injury to people or property resulting from any ideas, methods, instructions or products referred to in the content.