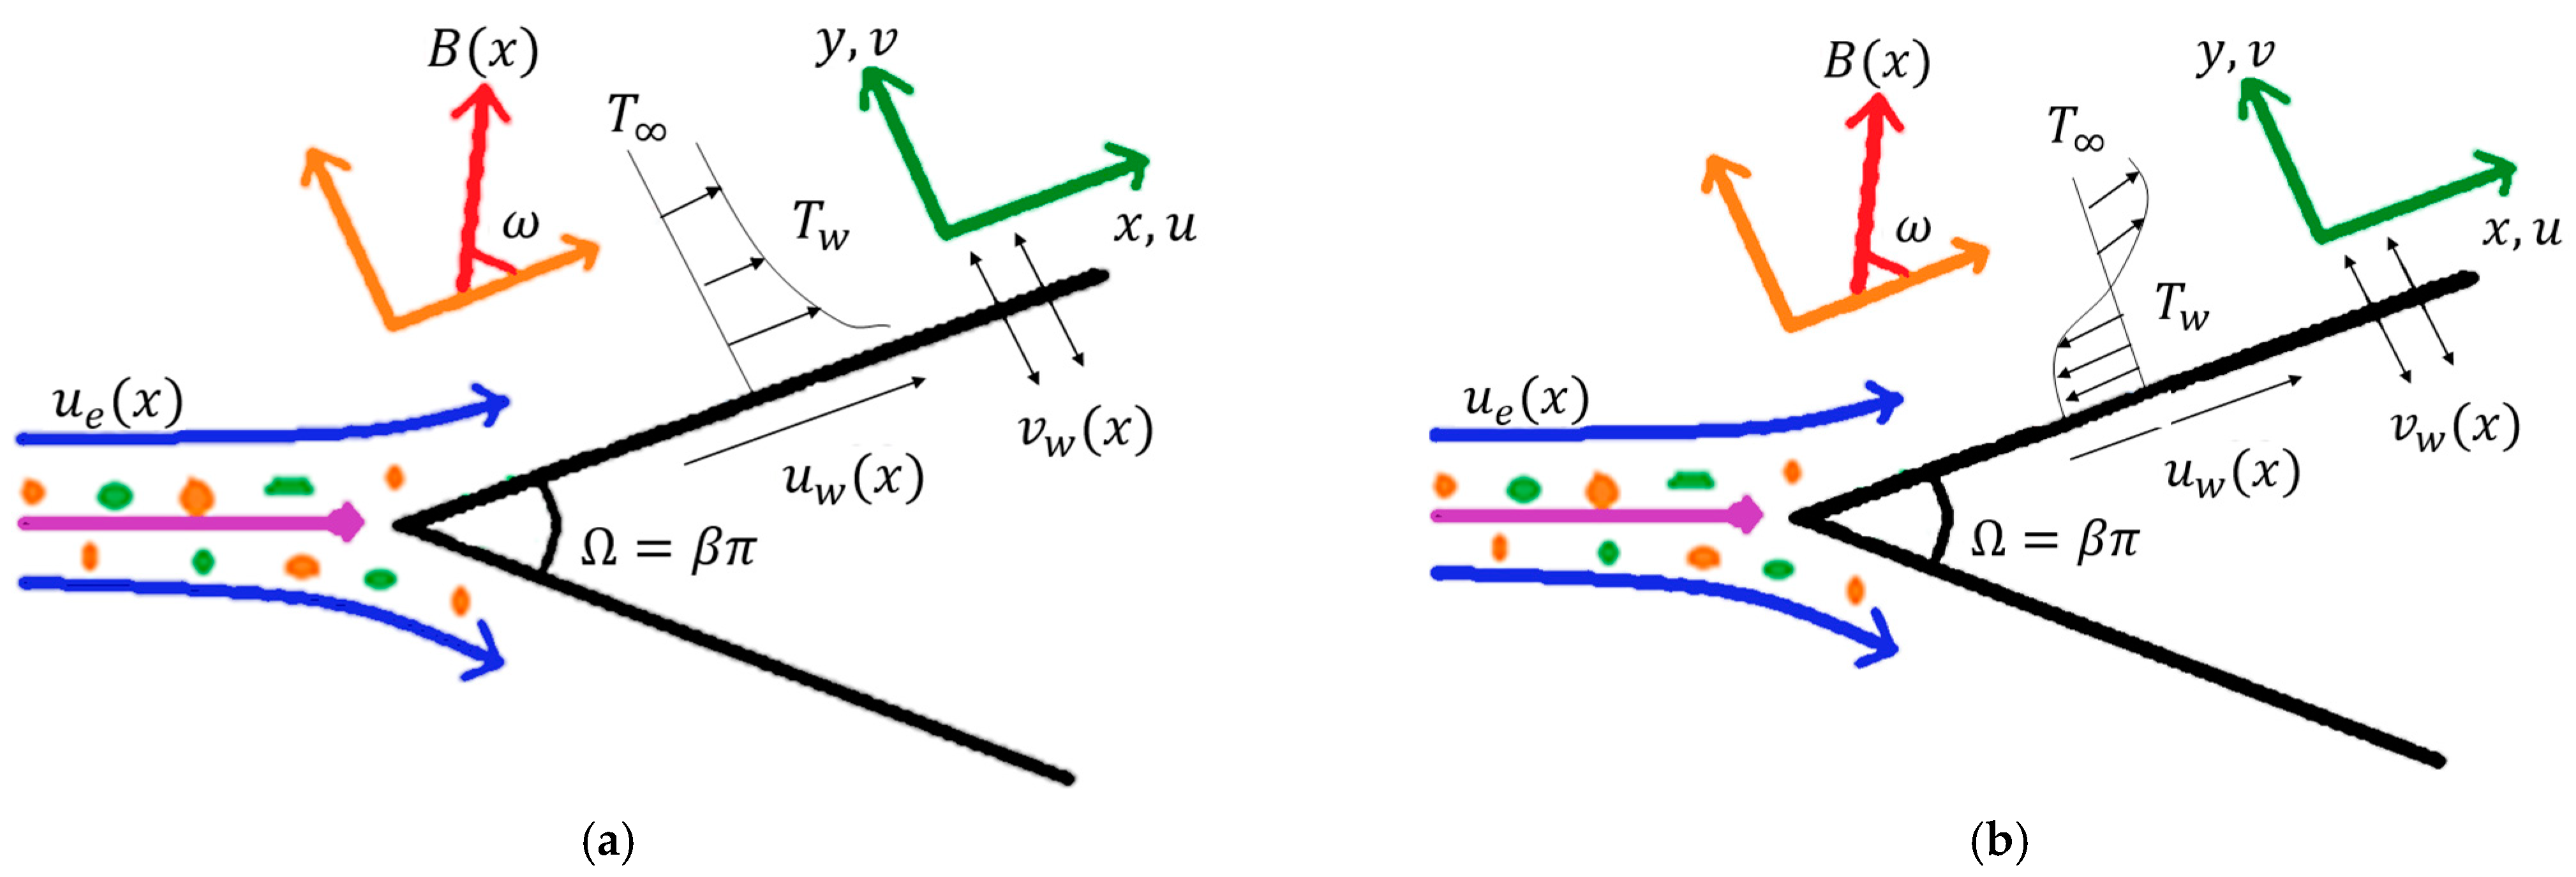
Figure 1.
Geometrical representation of flow model for (a) stretching wedge and (b) shrinking wedge with suction/injection (), temperature of the flow (), magnetic field , angle of inclined for magnetic field , and angle between two surfaces .
Figure 1.
Geometrical representation of flow model for (a) stretching wedge and (b) shrinking wedge with suction/injection (), temperature of the flow (), magnetic field , angle of inclined for magnetic field , and angle between two surfaces .
Figure 2.
Flow chart procedure of BVP4C scheme.
Figure 2.
Flow chart procedure of BVP4C scheme.
Figure 3.
Velocity profile increasing for shrinking wedge case and increasing in the case of stretching wedge by rising . The arrow direction points to the increase and decrease in by rising
Figure 3.
Velocity profile increasing for shrinking wedge case and increasing in the case of stretching wedge by rising . The arrow direction points to the increase and decrease in by rising
Figure 4.
Velocity profile increasing for shrinking wedge case and increasing in the case of stretching wedge by rising . The arrow direction points to the increase and decrease in by rising
Figure 4.
Velocity profile increasing for shrinking wedge case and increasing in the case of stretching wedge by rising . The arrow direction points to the increase and decrease in by rising
Figure 5.
Velocity profile increasing for shrinking wedge case and increasing in the case of stretching wedge by improving viscosity indicator . The arrow points to increments as well as decrements in by rising
Figure 5.
Velocity profile increasing for shrinking wedge case and increasing in the case of stretching wedge by improving viscosity indicator . The arrow points to increments as well as decrements in by rising
Figure 6.
Velocity profile increasing for shrinking wedge case and increasing in the case of stretching wedge by rising suction/injection effect . The arrow direction points to the increase and decrease in by rising
Figure 6.
Velocity profile increasing for shrinking wedge case and increasing in the case of stretching wedge by rising suction/injection effect . The arrow direction points to the increase and decrease in by rising
Figure 7.
Temperature profile increase for both shrinking wedge case and stretching wedge case by rising Brownian diffusion parameter . The arrow direction points upward which reflects an increment in
Figure 7.
Temperature profile increase for both shrinking wedge case and stretching wedge case by rising Brownian diffusion parameter . The arrow direction points upward which reflects an increment in
Figure 8.
Temperature profile increase for both shrinking wedge case and stretching wedge case by rising Brownian diffusion parameter . The arrow direction points upward which reflects an increment in
Figure 8.
Temperature profile increase for both shrinking wedge case and stretching wedge case by rising Brownian diffusion parameter . The arrow direction points upward which reflects an increment in
Figure 9.
Temperature profile decrease for both shrinking wedge case and stretching wedge case by rising Prandtl number . The arrow direction points downward which reflects a decrement in
Figure 9.
Temperature profile decrease for both shrinking wedge case and stretching wedge case by rising Prandtl number . The arrow direction points downward which reflects a decrement in
Figure 10.
Temperature profile increase for both shrinking wedge case and stretching wedge case by rising heat generation . The arrow direction points upward which reflects an increment in
Figure 10.
Temperature profile increase for both shrinking wedge case and stretching wedge case by rising heat generation . The arrow direction points upward which reflects an increment in
Figure 11.
Concentration profile increase for both shrinking wedge case and stretching wedge case by rising . The arrow direction points upward which reflects an increment in
Figure 11.
Concentration profile increase for both shrinking wedge case and stretching wedge case by rising . The arrow direction points upward which reflects an increment in
Figure 12.
Concentration profile decrease for both shrinking wedge case and stretching wedge case by rising . The arrow direction points downward which reflects a decrement in
Figure 12.
Concentration profile decrease for both shrinking wedge case and stretching wedge case by rising . The arrow direction points downward which reflects a decrement in
Figure 13.
Concentration profile decrease for both shrinking wedge case and stretching wedge case by rising . The arrow direction points downward which reflects a decrement in
Figure 13.
Concentration profile decrease for both shrinking wedge case and stretching wedge case by rising . The arrow direction points downward which reflects a decrement in
Figure 14.
Concentration profile increase for both shrinking wedge case and stretching wedge case by rising . The arrow direction points upward which reflects an increment in
Figure 14.
Concentration profile increase for both shrinking wedge case and stretching wedge case by rising . The arrow direction points upward which reflects an increment in
Figure 15.
Influence of on skin friction.
Figure 15.
Influence of on skin friction.
Figure 16.
Influence of on skin friction.
Figure 16.
Influence of on skin friction.
Figure 17.
Impact of We on the drag friction coefficient.
Figure 17.
Impact of We on the drag friction coefficient.
Figure 18.
Impact of on the Nusselt number.
Figure 18.
Impact of on the Nusselt number.
Figure 19.
Investigation of on the Nusselt number.
Figure 19.
Investigation of on the Nusselt number.
Figure 20.
Impact of on the Sherwood number.
Figure 20.
Impact of on the Sherwood number.
Figure 21.
Entropy profile decreases for both shrinking wedge case and stretching wedge case by rising wedge parameter . The arrow direction is downward which reflects a decrement in
Figure 21.
Entropy profile decreases for both shrinking wedge case and stretching wedge case by rising wedge parameter . The arrow direction is downward which reflects a decrement in
Figure 22.
Entropy profile decreases for both shrinking wedge case and stretching wedge case by rising magnetic parameter . The arrow direction is downward which reflects a decrement in
Figure 22.
Entropy profile decreases for both shrinking wedge case and stretching wedge case by rising magnetic parameter . The arrow direction is downward which reflects a decrement in
Figure 23.
Entropy profile increases for both shrinking wedge case and stretching wedge case by rising Reynold’s number . The arrow direction is upward which reflects a magnification in
Figure 23.
Entropy profile increases for both shrinking wedge case and stretching wedge case by rising Reynold’s number . The arrow direction is upward which reflects a magnification in
Figure 24.
Entropy profile amplifies for both shrinking wedge case and stretching wedge case by rising Brinkman number . The arrow direction is upward which reflects an amplification in
Figure 24.
Entropy profile amplifies for both shrinking wedge case and stretching wedge case by rising Brinkman number . The arrow direction is upward which reflects an amplification in
Figure 25.
Display of grid independence test for the case of the velocity field.
Figure 25.
Display of grid independence test for the case of the velocity field.
Figure 26.
Display of grid independence test for the case of temperature field.
Figure 26.
Display of grid independence test for the case of temperature field.
Figure 27.
Sketch of grid independence test for the case of concentration field.
Figure 27.
Sketch of grid independence test for the case of concentration field.
Table 1.
Comparison value of with shooting and the bvp4c technique.
Table 1.
Comparison value of with shooting and the bvp4c technique.
| |
|---|
| | bvp4c | Shooting |
|---|
| −0.25 | 1.4022312 | 1.402239 |
| 0.5 | 1.4956754 | 1.4956751 |
| 0.75 | 1.4893101 | 1.4893100 |
Table 2.
Explanation of Nusselt and Sherwood numbers with diverse factors.
Table 2.
Explanation of Nusselt and Sherwood numbers with diverse factors.
| | | | | | | | | | | Nusselt | Sherwood |
|---|
| 0.1 | 0.1 | 1.0 | 0.1 | 0.1 | 0.1 | 0.1 | 0.1 | 1.0 | 0.1 | 0.1 | 0.344320612 | 0.1834829632 |
| 0.5 | | | | | | | | | | | 0.324243015 | 0.1775615516 |
| 1.0 | | | | | | | | | | | 0.315423431 | 0.1556769698 |
| | 0.3 | | | | | | | | | | 0.329543408 | 0.1447945862 |
| | 0.5 | | | | | | | | | | 0.283345738 | 0.1119622309 |
| | 0.7 | | | | | | | | | | 0.262434168 | 0.0994615741 |
| | | 1.5 | | | | | | | | | 0.414575904 | 0.2535225451 |
| | | 2 | | | | | | | | | 0.433567440 | 0.3056406214 |
| | | 2.5 | | | | | | | | | 0.458845732 | 0.3327873918 |
| | | | 0.03 | | | | | | | | 0.314334516 | 0.8748902999 |
| | | | 0.05 | | | | | | | | 0.303683767 | 0.4820998666 |
| | | | 0.07 | | | | | | | | 0.293035589 | 0.3150687602 |
| | | | | 0.3 | | | | | | | 0.338681524 | 0.7631274542 |
| | | | | 0.5 | | | | | | | 0.325240819 | 1.3244840332 |
| | | | | 0.7 | | | | | | | 0.311736857 | 1.8773234221 |
| | | | | | 0.2 | | | | | | 0.341532334 | 0.1784728556 |
| | | | | | 0.3 | | | | | | 0.320710634 | 0.1530214045 |
| | | | | | 0.4 | | | | | | 0.319682856 | 0.1151556567 |
| | | | | | | 0.3 | | | | | 0.344509678 | 0.3078724134 |
| | | | | | | 0.5 | | | | | 0.368587645 | 0.5047518223 |
| | | | | | | 0.7 | | | | | 0.387216734 | 0.9160354134 |
| | | | | | | | 0.4 | | | | 0.384703634 | 0.2078327256 |
| | | | | | | | 0.7 | | | | 0.419121312 | 0.2286164678 |
| | | | | | | | 0.9 | | | | 0.432678934 | 0.2395599654 |
| | | | | | | | | 1.5 | | | 0.375807956 | 0.2210585056 |
| | | | | | | | | 2.0 | | | 0.402131778 | 0.2423321763 |
| | | | | | | | | 2.5 | | | 0.429709689 | 0.2528432846 |
| | | | | | | | | | 0.3 | | 0.452379458 | 0.2177648752 |
| | | | | | | | | | 0.5 | | 0.460345120 | 0.1843719876 |
| | | | | | | | | | 0.7 | | 0.468490564 | 0.1708341522 |
| | | | | | | | | | | 0.3 | 0.428850934 | 0.2054387919 |
| | | | | | | | | | | 0.5 | 0.413857820 | 0.1814483108 |
| | | | | | | | | | | 0.7 | 0.407429531 | 0.1628356190 |
Table 3.
Effect of and on heat transfer number in the presence and absence of nanofluid parameters having value and
Table 3.
Effect of and on heat transfer number in the presence and absence of nanofluid parameters having value and
| Parameters | Presence of Nanofluid | Absence of Nanofluid | |
|---|
| 0.65361 | 0.55532 | 15.03% |
| 0.76406 | 0.61715 | 19.22% |
| 0.93086 | 0.70118 | 24.67% |
| 0.68242 | 0.58485 | 14.30% |
| 0.76081 | 0.56502 | 25.73% |
| 0.87240 | 0.67879 | 22.19% |
Table 4.
Grid independence test for the case of skin friction coefficient and Nusselt number.
Table 4.
Grid independence test for the case of skin friction coefficient and Nusselt number.
| Common Mesh 50 | Medium Mesh 110 | Suitable Mesh 200 |
|---|
| | | | | |
|---|
| 0.1 | 0.48738 | 1.33178 | 0.48738 | 1.33178 | 0.48738 | 1.33178 |
| 0.2 | 0.49213 | 1.35694 | 0.49213 | 1.35694 | 0.49213 | 1.35694 |
| 0.3 | 0.50663 | 1.36805 | 0.50663 | 1.36805 | 0.50663 | 1.36805 |
| 0.4 | 0.51654 | 1.38364 | 0.51654 | 1.38364 | 0.51654 | 1.38364 |
| 0.5 | 0.52614 | 1.39872 | 0.52614 | 1.39872 | 0.52614 | 1.39872 |
Table 5.
Time analysis in the case of an increment in the number of meshes in terms of heat transfer analysis.
Table 5.
Time analysis in the case of an increment in the number of meshes in terms of heat transfer analysis.
| No of Meshes | Time Consumed | |
|---|
| 100 | 5.031 s | 0.78019 |
| 150 | 6.276 s | 0.78276 |
| 200 | 8.054 s | 0.79513 |
| 300 | 8.376 s | 0.79967 |
Table 6.
Residual error and mesh analysis computation for the case of heat transfer analysis due to variation in sundry parameters.
Table 6.
Residual error and mesh analysis computation for the case of heat transfer analysis due to variation in sundry parameters.
| Scenarios | Case 1 | Case 2 | Case 3 | Case 4 |
|---|
| 1 | | | | |
| 2 | | | | |
| 3 | | | | |
| 4 | | | | |
Table 7.
Residual error computation for different dimensionless quantities in terms of heat transfer analysis Nusselt number.
Table 7.
Residual error computation for different dimensionless quantities in terms of heat transfer analysis Nusselt number.
| Scenarios | Case 1 | Case 2 | Case 3 | Case 4 |
|---|
| 1 | 1.446 × 10⁻⁹ | 4.135 × 10⁻⁹ | 3.872 × 10⁻⁹ | 2.401 × 10⁻⁹ |
| 2 | 3.712 × 10⁻⁹ | 1.801 × 10⁻⁹ | 3.821 × 10⁻⁹ | 2.001 × 10⁻⁹ |
| 3 | 2.213 × 10⁻⁹ | 1.432 × 10⁻⁹ | 1.275 × 10⁻⁹ | 2.182 × 10⁻⁹ |
| 4 | 3.170 × 10⁻⁹ | 2.115 × 10⁻⁹ | 2.120 × 10⁻⁹ | 1.913 × 10⁻⁹ |
Table 8.
Mesh point computation for different cases.
Table 8.
Mesh point computation for different cases.
| Scenarios | Case 1 | Case 2 | Case 3 | Case 4 |
|---|
| 1 | 1240 | 1248 | 1270 | 1365 |
| 2 | 1120 | 1340 | 1115 | 1025 |
| 3 | 1170 | 1140 | 1092 | 1002 |
| 4 | 1170 | 1225 | 1300 | 1217 |
Table 9.
BC function computation for different cases.
Table 9.
BC function computation for different cases.
| Scenarios | Case 1 | Case 2 | Case 3 | Case 4 |
|---|
| 1 | 126 | 128 | 129 | 130 |
| 2 | 124 | 121 | 110 | 132 |
| 3 | 104 | 105 | 118 | 108 |
| 4 | 126 | 135 | 129 | 125 |
Table 10.
ODE function computation for different cases.
Table 10.
ODE function computation for different cases.
| Scenarios | Case 1 | Case 2 | Case 3 | Case 4 |
|---|
| 1 | 56,413 | 56,690 | 57,300 | 58,215 |
| 2 | 47,700 | 47,620 | 46,365 | 48,900 |
| 3 | 47,200 | 46,100 | 47,153 | 46,500 |
| 4 | 47,824 | 47,276 | 49,284 | 48,915 |
Table 11.
Comparison analysis with existing literature.
Table 11.
Comparison analysis with existing literature.
| Ref. [28] | Ref. [30] | Ref. [31] | Present |
| 0 | 0.46960 | 0.4696 | 0.469601 | 0.46965 |
| 0.1 | 0.65497 | 0.6550 | 0.587036 | 0.58711 |
| 0.2 | 0.80212 | 0.8021 | 0.774754 | 0.77469 |
| 0.3 | 0.92765 | 0.9277 | 0.92768 | 0.92761 |
| 1 | 1.23258 | 1.2326 | 1.232587 | 1.23250 |

 ,
, 


