Abstract
This paper presents the analysis of electromagnetic radiation of mobile base stations co-located with high-voltage transmission towers. Although the layout of power poles and towers is uniform and symmetrical, the electromagnetic field radiated to the outside world is asymmetric. Field measurements were conducted in different co-located base station scenarios, and the field strength results in both the vertical and horizontal directions were analyzed in depth. Then, the ray tracing simulation method was used to obtain the electromagnetic field distribution characteristics for the 5G base station co-located high-voltage tower. Finally, the specific absorption rate (SAR) was adopted to evaluate human exposure in co-located base station scenarios, and a physical area-based human exposure assessment method proposed. The obtained results can be useful for inspectors of mobile base stations co-located with high-voltage transmission towers to avoid or reduce the impact of electromagnetic radiation.
1. Introduction
As the demand for wide coverage of 5G Base Stations is increasing while the number of towers for base stations is limited, the idea of constructing base stations on power transmission towers has been proposed. Using existing power transmission tower resources for base station can not only save cost but also save increasingly scarce space. Tower sharing of base stations and power transmission lines has become an important construction direction for the future.
The co-located tower construction has a more complicated electromagnetic environment than the original power transmission tower due to the involvement of the high power and high-frequency radiation base station. The work of inspection on the tower will also be affected by it and face new electromagnetic radiation [1]. In order to realize the safe operation and inspection of transmission towers, it is necessary to understand the electromagnetic field distribution characteristics of base stations co-located with high-voltage power transmission towers, and to evaluate human exposure.
Some studies have been carried out on the radiation characteristics of base stations. Reference [2] extrapolates the maximum electromagnetic radiation level of an LTE base station by determining the radiation field strength of the synchronization signal of the LTE base station. Reference [3] assesses the radiation levels of base stations on agricultural land and the exposure of workers. Reference [4] conducts actual measurements on base stations and builds a model for electric field strength calculations based on the measured results. Reference [5] conducts radiation measurement in hotspot areas for new candidate frequency bands for future broadband wireless communication. Reference [6] points out that the traditional method of measuring the electromagnetic radiation level of the base station in a network is not suitable for 5G. Reference [7] proposes a statistical approach for assessing the RF exposure conditions around massive MIMO BSs based on the 3D spatial channel model developed by 3GPP [8,9]. Reference [10] suggests an alternative method of EMF exposure assessment that is based on calculations and simulations and enables an accurate estimation of the EMF distribution in the 5G environment to be obtained.
In addition, there are studies using simulation to characterize the electromagnetic environment around mobile base stations. Reference [11] uses the EMF Estimator to simulate the LTE base station scene in suburban areas. Reference [12] considers the characteristics of the geographical environment around the GSM base station when using 3D ray tracing algorithm simulation of the radiation of the base station. Reference [13] employs the method of moments to simulate the radiation of a 900 MHz GSM antenna next to a residential apartment. Reference [14] makes use of the S-UTD-CH model computation time and prediction accuracy for coverage mapping.
To evaluate the safe level of human exposure to electromagnetic radiation, the Specific Absorption Rate (SAR) is commonly considered as a reasonable factor. A new criterion of electromagnetic field exposure limit (100 kHz–300 GHz) is proposed in reference [15]. Reference [16] studies the SAR value at base station bands (900 MHz and 1800 MHz) and simulates the SAR value of the head region tissue or organ by CST. Reference [17] provides methods for the determination of radio-frequency (RF) field strength and specific absorption rate (SAR) in the vicinity of radiocommunication base stations (RBS) for the purpose of evaluating human exposure [18,19]. The radio frequency field strength and SAR near the radio communication base station were measured, and the human exposure limit was evaluated. Reference [20] simulates the SAR caused by the base station antenna. Reference [21] uses the lossy transmission line model in the ORCAD PSpice simulator for exposure simulation. Reference [22] presents sample results from a rigorous full-wave numerical analysis of the field near a typical base station and examines and compares two simple approximate computational models suitable for routine assessment of base station exposure. Reference [23] conducts a comparative analysis of the SAR measurements in a plane model with the SAR numerical calculation in an anatomically realistic human body model. References [24,25] study the effect of EM radiation emitted by base station antennas on a homogenous model of the human body located in a car and consider possible resonance fields inside the car that exist on the ground.
Although the studies on base station radiation and human exposure are plentiful, there has been no research on a high-power transmission tower co-located with base stations scenarios. This paper focuses on the co-located scenario. The radiation distributions around the tower were obtained by site measurement and ray tracing simulation. SAR was calculated based on the radiation level and used to evaluate the human exposure level for operations of inspection workers. The corresponding protective equipment level was suggested according to the SAR level. This paper also proposes a new clear method to divide the protection level. Inspectors can directly determine an appropriate level of protection based on the physical area of the work activity.
2. On-Site Measurement
This section introduces the information of four selected transmission towers, the measurement systems, and two setups of base stations on the tower.
2.1. Site Selection
In order to obtain the field distribution around the co-located base station, on-site measurement with the experimental towers was taken. To cover all scenarios (different power levels and different base station transmissions), base stations co-located with four high-voltage transmission towers (35 kV, 110 kV, 220 kV, and 500 kV) were selected. Table 1 lists the base station antenna parameters of each tower, and the actual measurement scene is shown in Figure 1.

Table 1.
The parameters of the base station antennas.
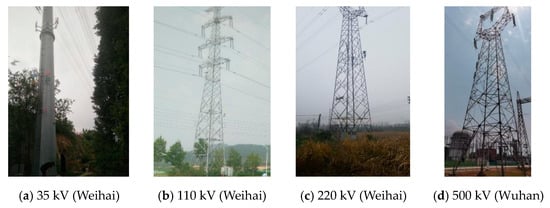
Figure 1.
The actual measurement scenes.
2.2. Measurement Setup
2.2.1. Measurement System
A feasible electromagnetic field measurement system was built. Considering the requirements and convenience of different scenarios during actual measurement, two types of receivers were used: a spectrum analyzer and a field intensity indicator. The equipment is shown in Figure 2.
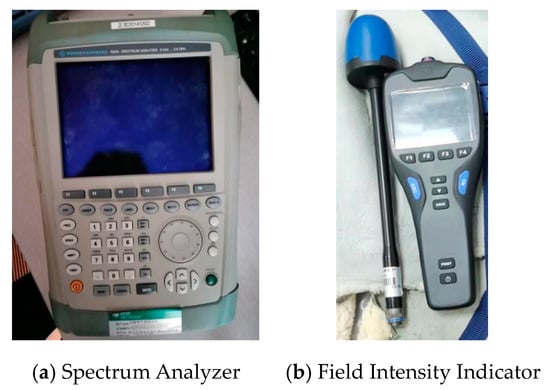
Figure 2.
Measuring system.
The measurement system is composed of the spectrum analyzer (R&S FSH4 9 kHz~3.6 GHz) and an omnidirectional antenna as the receiving end. The E-field level is obtained by converting the power with the antenna factor of the omnidirectional antenna. For areas that are not easy to access by humans, such as in the vertical direction of the tower, a hand-held field intensity indicator (ESM-600 9 kHz~3.6 GHz) with a field strength probe is used as auxiliary measurement together. The hand-held indicator with probe is put on an auto-lift to measure the field level at the positions where people cannot go.
2.2.2. Measurement Methods
Measurements were taken directly near the antenna of the base station. The setup of base stations on the co-located tower are according to the actual base station installed in the communication towers [26,27]. Generally, multiple antennas are installed at the same time and follow two rules: one is that the antennas cover multiple directions at the same height, the other is that the antennas cover the same direction at different heights.
Wuhan 500 kV tower was used as an example to explain the setup of base stations on the tower:
Three antennas were installed at the same height on three tower legs. The direct radiation directions are separated by 120 degrees to cover three sectors.
Three antennas are setup at different heights on one tower leg. The radiation directions are the same and cover the same sector.
After inaugurating the setup of the base stations on the power transmission tower, the actual measurement points need to be defined. These points were defined to cover all the possible activity range of the inspection person. After investigation, the measurement was carried out at two directions:
(1) vertical direction inside and outside the tower
(2) horizontal direction on the ground
The vertical direction measurement position schematic and photo are shown in Figure 3 and the procedure was as follows. In the top view, measure 1 m from the outside of the tower leg and 1 m from the inside of the tower leg. In the vertical direction, take points vertically upwards from the ground. As the height increases, select several measurement points at intervals of 1 m until they exceed the top of the antenna and the field strength is significantly attenuated.
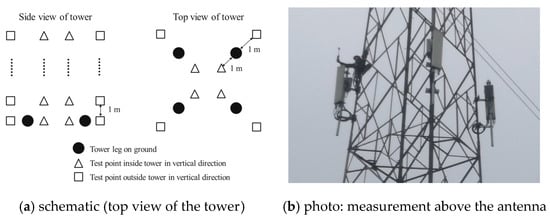
Figure 3.
Vertical direction measurement position schematic and photo.
The horizontal measurement position schematic and photo are shown in Figure 4. In the horizontal direction, the measurement is taken on the ground. Mark the base station as the origin of coordinates and the maximum antenna radiation direction (main lobe) as the X-axis. On the X-axis, measure at every 5 m. Mark the direction perpendicular to the X-axis through the base station as the Y-axis and measure at every 2 m. In order to obtain a relatively completed field distribution, the measurement point range should be as large as possible to cover the main lobe radiation area of the base station and to observe the trend of field strength attenuation.
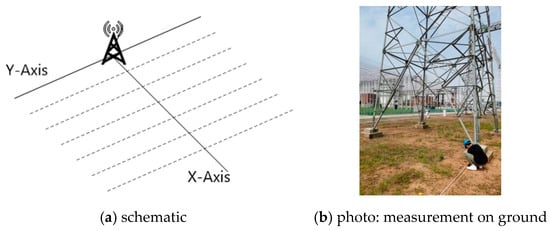
Figure 4.
Horizonal direction measurement position schematic and photo.
The measurement scopes on the four towers are shown in Table 2.
Table 2.
Measurement scope on the four towers.
3. Measurement Results and Analysis
3.1. Field Strength Results in the Vertical Direction
The vertical directions were measured at the 220 kV and 500 kV experimental co-located base station. According to the national standard GB8702-2014 “Electromagnetic Radiation Protection Regulations”, the standard limit for an electric field strength is 12 V/m.
(1) 220 kV experimental co-located tower
Base station setup 1 was used on the 220 kV tower: three antennas were added to the tower (on leg 2, 3, and 4) at the same height 19 m towards the three sectors.
(2) Inside the vertical direction of the tower
Figure 5 shows the field strength distribution in the vertical direction inside the tower measured by the field intensity indicator.
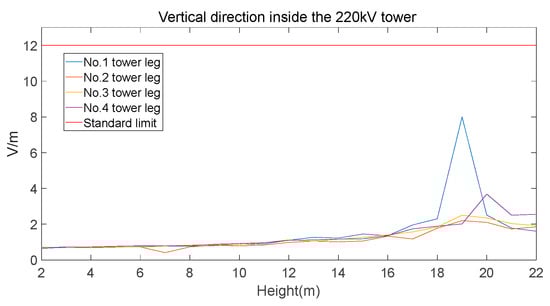
Figure 5.
Field strength distribution in the vertical direction inside the 220 kV tower.
It can be seen from the figure that the electric field intensity measured inside the tower is lower than the national standard limit. Since the inner area of the tower is in the direction of the back lobe of the antenna, there is no strong radiation. When approaching the antenna, the electric field strength increases but is still within the limit. Tower leg 1 has the highest level due to the side lobe radiation of the antennas on the other three tower legs.
(3) Outside the vertical direction of the tower
Figure 6 shows the field distribution along the height direction on the outer side of the tower.
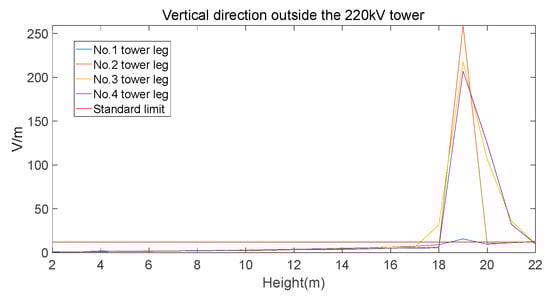
Figure 6.
Field strength distribution in the vertical direction outside the 220 kV tower.
Compared with the inside of the tower, the electric field strength at the outside is much larger, especially when facing the antenna (reaches to 250 V/m) at 18 m to 22 m. The overall electric field strength is smaller than the limit in the area below the antenna.
According to the above results in the vertical direction, the fields are concentrated near the antenna outside the tower. This means, the main power is generated by radio radiation in the front direction and the level of human exposure can be evaluated by the vertical direction outside of the tower. Therefore, in the following 500 kV tower measurement, the vertical direction outside of the tower is only measured and the spectrum analyzer is utilized to record the base station transmission frequency of 2140 MHz.
(4) The 500 kV experimental co-located tower
Two base station setups were set at the 500 kV tower respectively.
(1) Base station setup 1: three antennas were installed on the tower at the same height 15 m towards the three sectors.
Figure 7 shows the field distribution outside the vertical direction of the tower. It can be seen that the field strength is very low at 1–13 m, but when the height continues to increase when facing the antenna, that is, at 13–15 m, the field strength becomes very large.
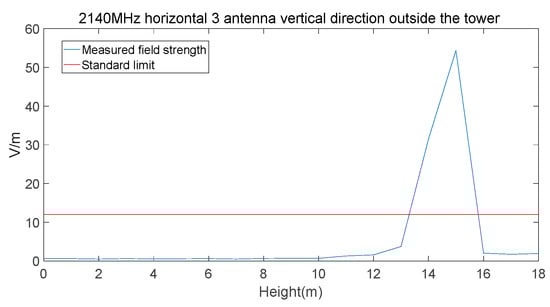
Figure 7.
Field strength distribution at 2140 MHz in vertical direction outside the 500 kV tower (base station setup 1).
(2) Base station setup 2: three antennas were installed at different heights on one tower leg, respectively 13 m, 15 m, and 17 m, covering the same sector.
Figure 8 shows the field distribution in the vertical direction outside of the tower. The field strengths at 1–11 m are very low. When the height increases to the antenna faces, the electric field strengths become very large which exceed the limit.
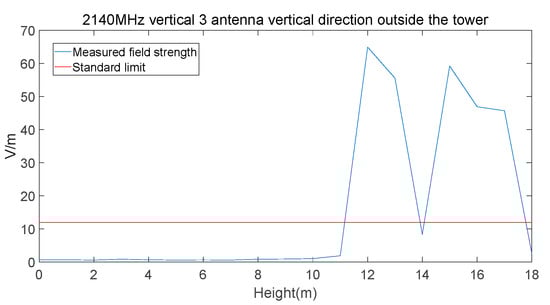
Figure 8.
Field strength distribution at 2140 MHz in vertical direction outside the 500 kV tower (base station setup 2).
Comparing Figure 7 and Figure 8, base station setup 2 has the higher maximum field level. This is due to the superposition of radiation from multiple antennas all in the main lobe in setup 2 while setup 1 is the superposition only of one main lobe and two back lobes. Therefore, setup 2 with three antennas installed in a vertical line has more radiation than setup 1 with three antennas installed at the same horizontal height.
3.2. Field Strength Results in the Horizontal Direction
Horizontal direction measurements were taken at the towers of 35 kV and 110 kV. The spectrum analyzer was utilized in these measurements.
The 35 kV tower is located at the edge of a cell. The antenna face to the cell was installed at 17 m while the antenna back to the cell at 5 m. The radiations to the inside and outside of the cell are different. Therefore, the fields in the horizontal direction were measured in the inside and outside direction respectively.
Figure 9 shows the field distribution in the horizontal direction inside the cell at the 35 kV tower. The field strength inside the cell gradually reaches the maximum value 2–3.5 V/m at 30–50 m. The field strength outside the cell reaches the maximum value 4–5.5 V/m at 9–13 m. The overall field strength outside the cell with a lower antenna is larger and the horizontal distance of the main lobe is also closer to the tower.
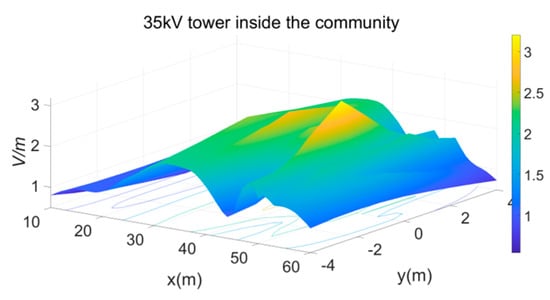
Figure 9.
Field strength distribution in the ground direction of the 35 kV tower.
The 110 kV tower has installed two base station antennas transmitting different bands: 880 MHz and 1.9 GHz in two directions. Therefore, the fields in the horizontal direction on the ground were measured in the two directions respectively.
Figure 10 shows the field distribution in the horizontal direction at the 110 kV tower. Since the electromagnetic waves reflect and form a multipath signal superposition, the field intensity gradually reaches the first peak. As the distance increases, it approaches the main lobe of the antenna, and the electric field strength increases to the highest level. The main lobe area of the 880 MHz antenna is 15 m with a 1.5 V/m level. The main lobe area of 1.9 GHz antenna is 30 m with a 0.8 V/m level. The overall electric field strength at the 880 MHz antenna is larger, the horizontal distance of the main lobe is closer to the tower, and the coverage is much larger.
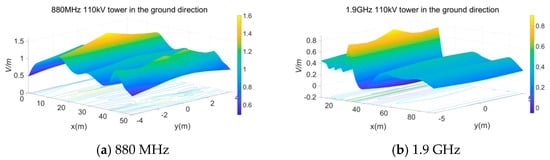
Figure 10.
Field strength distribution in the ground direction of the 110 kV tower.
4. Ray-Tracing Based Simulation Results and Analysis
Due to the large limitations of the field measurements, the data is not sufficient to evaluate the radiation level around the co-located towers. Therefore, in this paper, the actual measurement and simulation are combined. The ray tracing software Wireless Insite was used for simulation to calculate the field distribution characteristics around the co-located base station.
4.1. Three-Antenna Horizontal Scene Simulation of 5G Base Station Co-Located High-Voltage Tower
According to the actual arrangement of the 5G base station antennas, the simulation was carried out with three antennas at the same height on a 110 kV power transmission tower. The base station antenna parameters are shown in Table 3 and the antenna pattern is shown in Figure 11. The analysis was still carried out from the three aspects: the vertical direction outside the tower, the vertical direction inside the tower, and the horizontal direction on the ground.
Table 3.
Three-antenna horizontal 5G base station parameters.
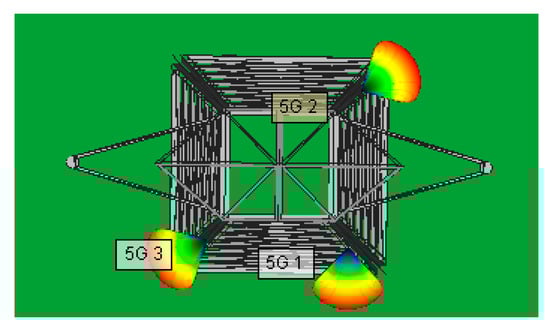
Figure 11.
Antenna pattern of co-located tower in the horizontal scene.
(1) Vertical direction inside the tower
The simulation result at the vertical direction inside the tower is shown in Figure 12. Inside the tower legs, the whole field strength is lower than 4 V/m. The field strength becomes higher when approaching the antenna height. The fluctuations are due to antenna side lobe overlap at different positions.
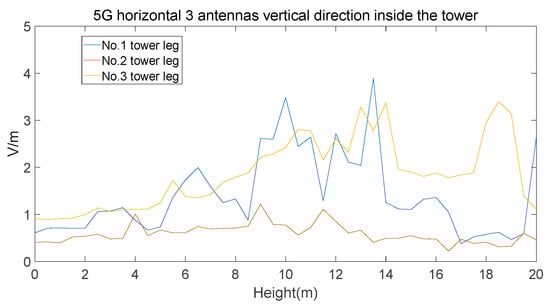
Figure 12.
Field strength in the vertical direction inside the tower by simulation.
(2) Vertical direction outside the tower
Figure 13 shows the simulation result at the vertical direction outside the tower. Outside the tower leg, the field strength is lower at a lower height and increases significantly closer to the antenna (maximum 123 V/m). Compared with the inner side, the maximum field strength is much larger in the antenna main lobe. Since the antennas are added to the three tower legs, they will be radiated from the side lobes of other antennas, so the field strength fluctuates less regularly. Due to the large power of the 5G base station antenna, the overall field strength outside the tower is large, and the height range exceeding the standard limit is wide.
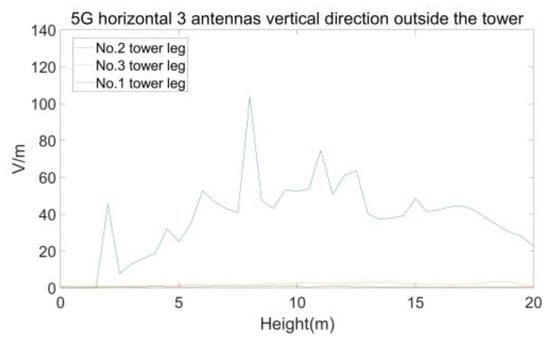
Figure 13.
Field strength in the vertical direction outside the tower by simulation.
(3) Horizontal direction
The field strength simulation in the horizontal direction on the ground is shown in Figure 14. It can be seen that in the horizontal direction from the tower leg, the maximum radiation is reached at 5 m. This is also due to multipath signal superposition. The overall field strength in the horizontal direction of the tower legs is small—all lower than 0.7 V/m.
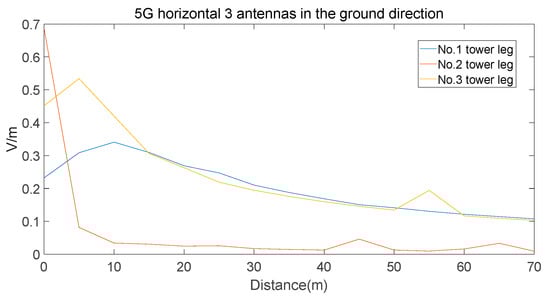
Figure 14.
Field strength in the horizontal direction on the ground by simulation.
4.2. Three-Antenna Vertical Scenario Simulation of 5G Base Station Co-Located High-Voltage Tower
In addition, the simulation was carried out with three antennas at different heights and radiating in the same direction. The shared tower was the same as above. Three base station antennas parameters are shown in Table 4 and the antenna pattern is shown in Figure 15.
Table 4.
Three-antenna vertical 5G base station parameters.
Figure 15.
Antenna pattern of co-located tower in the vertical scene.
(1) Vertical direction inside the tower
The field strength simulation in the vertical direction of the inside of the tower leg is shown in Figure 16. Inside the tower legs, the field strength value is smaller at lower heights, and increases significantly when approaching the height of the antenna. As the height continues to increase, the field strength gradually decreases. Due to the addition of antennas at different heights on the same tower leg, the field strength fluctuates less regularly.
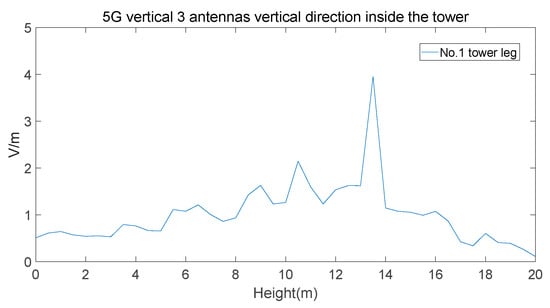
Figure 16.
Field strength in the vertical direction inside.
(2) Vertical direction outside the tower
Figure 17 shows the simulation result of the vertical direction outside the tower. Outside the tower leg, the field strength first increases significantly when approaching the antenna and then decreases with height. The peak field strength is around 124 V/m at the three antenna heights: 15 m, 17 m, and 19 m.
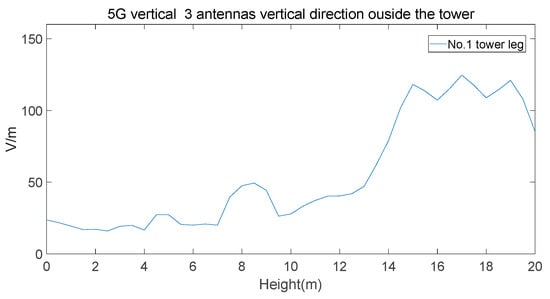
Figure 17.
Field strength in the vertical direction outside.
According to the simulation results, the field strength in the main lobe of the antennas is more serious. Moreover, compared with the horizontal three antennas, it can be found that the height range of the vertical outer side of the vertical three antennas exceeding the standard limit is wider than that of the horizontal three antennas. Therefore, inspection personnel should avoid this area and take protective measures when working.
(3) The horizontal direction on the ground
The simulation results of the field strength in the horizontal direction on the ground are shown in Figure 18. In the horizontal direction from the tower leg, the maximum radiation is reached at 10 m. This is also due to multipath signal superposition. The overall field strength in the horizontal direction of the tower legs is small, all lower than 0.7 V/m.
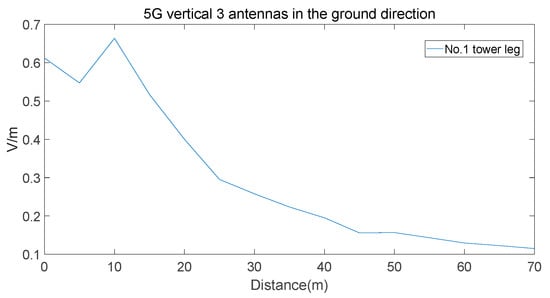
Figure 18.
Field strength in the horizontal direction on the ground.
5. Human Exposure Assessment Method
5.1. Specific Absorption Rate
According to the measurement on-site and the simulation results, the power transmission tower will have high level radiation with the base station co-located. When the human body is exposed to such a high level of radiation, the electromagnetic balance of the human body is broken resulting in huge damage.
The specific absorption rate SAR in the biological system or tissue models is a common parameter in bio-electromagnetics. The effect of radiation on the human body is generally described by the specific absorption rate. Human tissues and organs exposed to radiation will absorb part of the energy of the electromagnetic waves. SAR, as a general radiation evaluation index, can represent the energy value of the electromagnetic waves that can be absorbed by local tissues of the human body. SAR is defined as the amount of electromagnetic radiation absorbed by human tissue per unit mass, the unit is W/kg. SAR can be calculated by the following:
where represents the conductivity of human tissue (S/m), is the density of human tissue (kg/m³), E is the electric field intensity in the measurement area (V/m). Regarding the density and conductivity of human tissue, it is slightly different under different frequencies of electromagnetic waves.
According to national standards, for the occupational exposure limit, the average SAR should be less than 0.1 W/kg for any continuous 6 min during the 8-h working period per day. If the occupational exposure limit is exceeded, electromagnetic radiation will have a certain degree of impact on the human body.
5.2. Human Exposure Assessment Results
Since the actual measurement results of the above transmission tower are universal, the 220 kV co-located tower can be taken as an example for analysis.
(1) Vertical direction inside the tower
For the 220 kV tower, the SAR is first evaluated from the inside and outside of the tower in the vertical direction. Figure 19 shows the SAR distribution map of the inside of the tower in the vertical direction along the height direction.
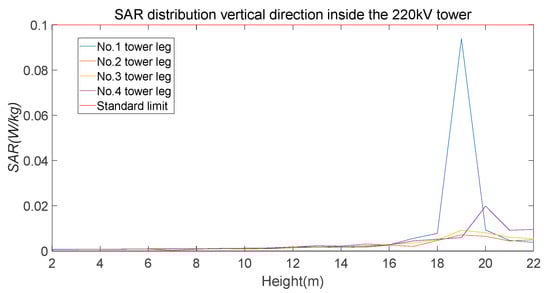
Figure 19.
SAR distribution in the inner vertical direction of 220 kV.
Inside the tower, the SAR in the area near the tower legs is generally low, roughly between 0–0.02 W/kg. This is due to the lower radiation level inside the tower leg. The overall human exposure value of the radiation inside the tower does not exceed the exposure limit but only with a small margin near antenna height (18–20 m). The corresponding protections are needed for inspection workers.
(2) Vertical direction outside the tower
The SAR in the vertical direction outside the 220 kV tower is evaluated in Figure 20. Outside the tower, the SAR of several tower legs below the antenna is relatively small. At 18–20 m, that is, in the front of the antenna main lobe, the SAR is very large which far exceeds the exposure limit. When the height continues to increase, the SAR gradually decreases and leaves the main radiation area of the antenna.
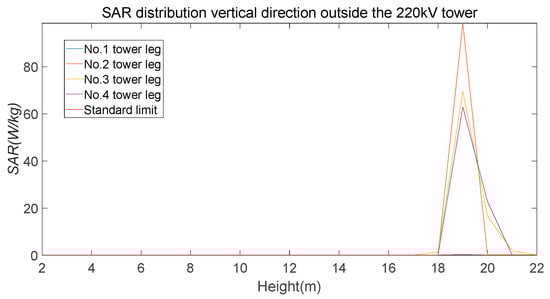
Figure 20.
SAR distribution of 220 kV outside vertical direction.
In summary, radiation in most areas inside the tower will not affect the human body, but in the area behind the antenna, especially in the area where the other antenna side lobe could radiate, the radiation level will increase. At the outside tower, the electromagnetic radiation will not impact the human body below the antennas. However, when the height increases to the antenna main lobe, the radiation has an extremely large impact on the human body. Protective measures should be taken to avoid radiation damage.
(3) Horizontal direction
Figure 21 shows the SAR distribution of the tower in the horizontal direction on the ground.
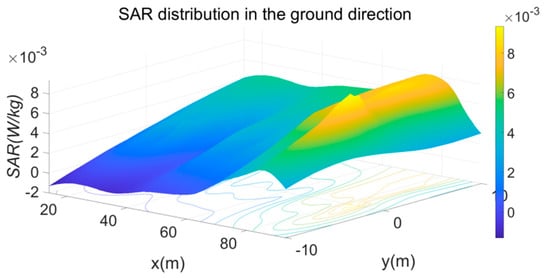
Figure 21.
SAR distribution of 220 kV horizonal direction.
It can be seen that the overall trend of SAR is first increasing and then decreasing. The SAR is mainly distributed between 0.005–0.01 W/kg. The base station antenna is far away from the ground measurement point. The radiation in the overall area is small due to long distance attenuation. The SAR in this area does not exceed the exposure limit which means radiation in this area will not affect the human body.
5.3. Physical Area Based Human Exposure Assessment Method
Due to the radiation of a co-located base station during inspection, inspection personnel must prepare protective measures in advance to avoid being affected by the electromagnetic radiation. For different radiation conditions, the level of protection needs to be split up. Inspectors can directly determine the appropriate level of the protective measures based on the physical area of the work activity.
According to the analysis of the measured results and the standard limits, a new method for classifying protective measures based on SAR is also proposed. According to the measured data, it was found that the detection area can be divided into three fields: strong, medium, and weak. The field strength range of the weak field area is 0–6 V/m, the field strength range of the middle field area is 6–12 V/m, and the field strength range of the strong field area is more than 12 V/m. A new classification standard of protection level directly related to human exposure can be obtained by calculation. Considering that the conductivity of human tissue is positively correlated with frequency in the calculation, the frequency band with the strictest limit is selected for calculation. Then a new classification standard of protection level is obtained.
In order to provide clear protection suggestions, the scope of the inspection personnel’s work is divided into seven physical areas. Each physical area has a corresponding protection level. The classifications are shown in Figure 22.
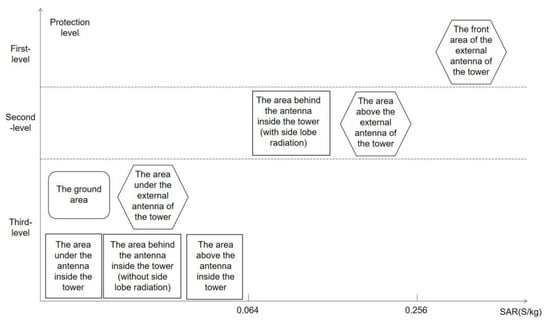
Figure 22.
SAR and Protection Classification.
First-level protection: The front area of the external antenna of the tower is the area with the strongest radiation. First-level protection should be carried out. The inspection personnel should avoid activities in this area and carry out strict protection.
Second-level protection: Although the radiation intensity of the area above the external antenna of the tower and the area behind the internal antenna of the tower (with side lobe radiation) has decreased, it is still at a relatively high level. Second-level protection should be carried out, and protective measures should be taken.
Third-level protection: The area under the antenna inside the tower, the area behind the antenna inside the tower (without side lobe radiation), the area above the antenna inside the tower, the area under the external antenna of the tower and the ground area are less affected by radiation and have a small impact on the human body. Third-level protection should be carried out, that is, no protection is required.
6. Summary
This paper studied the radiation in the scenario of co-located high-voltage transmission towers with base stations by measurement on-site and simulation.
Since the application of co-located base stations is not being promoted at present, the measurements were taken on four different experimental high-power transmission towers (35 kV, 110 kV, 220 kV, and 500 kV). The base station antennas were installed on the tower according to the installation methods of communication towers: one method is that the three antennas are at the same height but at different sectors; the other method is that the three antennas are at different heights in the same sector. Measurement and analysis were carried out inside the activity range of inspection workers: vertical direction inside and outside the tower, horizonal direction on the ground.
Simulation methods using ray tracing to simulate the radiation distribution of the co-located tower are provided in the paper. The simulation results are close to on-site measurements and can be used to predict the co-located power radiation level.
SAR is calculated by the radiation level and used to assess the human exposure level. According to the radiation distribution and level, three clear protection levels are proposed for inspection workers in seven physical areas. Inspection workers can select the appropriate protection when they take up activities in each of the physical areas.
Author Contributions
Author Contributions: Conceptualization, Z.Y.; investigation, D.D. and X.C.; data curation, J.M., X.Z. and Y.F.; writing—original draft preparation, Z.Y. and Y.P.; writing—review and editing, Z.Y.; All authors have read and agreed to the published version of the manuscript.
Funding
This research received no external funding.
Data Availability Statement
Not available.
Conflicts of Interest
The authors declare no conflict of interest.
References
- Elif, D.; Thors, B.; Törnevik, C. Assessment of Compliance with RF EMF Exposure Limits: Approximate Methods for Radio Base Station Products Utilizing Array Antennas with Beam-Forming Capabilities. IEEE Trans. Electromagn. Compat. 2016, 58, 1–8. [Google Scholar]
- Xu, B.; Colombi, D.; Törnevik, C.; Ghasemifard, F.; Chen, J. On Actual Maximum Exposure From 5G Multicolumn Radio Base Station Antennas for Electromagnetic Field Compliance Assessment. IEEE Trans. Electromagn. Compat. 2021, 63, 1680–1689. [Google Scholar] [CrossRef]
- Lunca, E.; Damian, C.; Salceanu, A. EMF exposure measurements on 4G/LTE mobile communication networks. In Proceedings of the International Conference and Exposition on Electrical and Power Engineering(EPE), Iasi, Romania, 16–18 October 2014; pp. 545–548. [Google Scholar]
- Pascuzzi, S.; Santoro, F. Exposure of farm workers to electromagnetic radiation from cellular network radio base stations situated on rural agricultural land. Int. J. Occup. Saf. Ergon. 2015, 21, 351–358. [Google Scholar] [CrossRef] [PubMed]
- Karadag, T.; Yuceer, M.; Abbasy, T. A large scale measurement, analysis and modelling of electromagnetic radiation levels in the vicinity of GSM/UMTS base stations in an urban area. Radiat. Prot. Dosim. 2016, 168, 134–147. [Google Scholar] [CrossRef] [PubMed]
- Pawlak, R.; Krawiec, P.; Żurek, J. On measuring electromagnetic fields in 5G technology. IEEE Access 2019, 7, 29826–29835. [Google Scholar] [CrossRef]
- Baracca, P.; Weber, A.; Wild, T.; Grangeat, C. A Statistical Approach for RF Exposure Compliance Boundary Assessment in Massive MIMO Systems. In Proceedings of the WSA 2018; 22nd International ITG Workshop on Smart Antennas, Bochum, Germany, 14–16 March 2018. [Google Scholar]
- Zhou, T.; Tao, C.; Salous, S.; Liu, L. Measurements and analysis of angular characteristics and spatial correlation for high-speed railway channels. IEEE Trans. Intell. Transp. Syst. 2018, 19, 357–367. [Google Scholar] [CrossRef]
- Zhou, T.; Qiao, Y.; Salous, S.; Liu, L.; Tao, C. Machine learning-based multipath components clustering and cluster characteristics analysis in high-speed railway scenarios. IEEE Trans. Antennas Propag. 2022, 70, 4027–4039. [Google Scholar] [CrossRef]
- Wang, P.; Li, Y.Z.; Chang, R.T. Radio propagation characteristics measurement and modeling in urban scenario for 4G mobile communication. Chin. J. Radio Sci. 2008, 23, 1159–1163. [Google Scholar]
- Svistunov, A. Estimation of Electromagnetic Background Created by Equipment of Cellular Radio Networks in Urban Areas with High Spatial Density of Subscribers. In Proceedings of the 2018 International Symposium on Electromagnetic Compatibility (EMC EUROPE), Amsterdam, The Netherlands, 27–30 August 2018; pp. 184–189. [Google Scholar]
- Bejenaru, O.; Lunca, E.; David, V. Simulation and Measurement of the Radiofrequency Electromagnetic Field Generated by a LTE Base Station. In Proceedings of the 2019 International Conference on Electromechanical and Energy Systems (SIELMEN), Craiova, Romania, 9–11 October 2019; pp. 1–4. [Google Scholar]
- Wei, M.; Liang, G.; Shi, D.; Gao, Y. Base station electromagnetic simulation using ray-tracing method. In Proceedings of the 2012 6th Asia-Pacific Conference on Environmental Electromagnetics (CEEM), Shanghai, China, 6–9 November 2012; pp. 360–362. [Google Scholar]
- Chio, C.-K.; Ting, S.-W.; Zhao, X.; Sarkar, T.K.; Zhang, Y.; Tam, K.-W. Prediction model for radiation from base-station antennas using electromagnetic simulation. In Proceedings of the 2012 Asia Pacific Microwave Conference Proceedings, Kaohsiung, Taiwan, 4–7 December 2012; pp. 1082–1084. [Google Scholar]
- International commission on non-ionizing radiation protection (ICNIRP). Guidelines for limiting exposure to electromagnetic fields (100 kHz to 300 GHz). Health Phys. 2020, 118, 483–524. [Google Scholar] [CrossRef] [PubMed]
- Hansen, J.E. Spherical Near-Field Antenna Measurements; Peter Peregrinus Ltd. on Behalf of the Institute of Electrical Engineers: London, UK, 1988; pp. 157–163. [Google Scholar]
- Determination of RF field strength power density and SAR in the vicinity of radiocommunication base stations for the purpose of evaluating human exposure. Int. Electrotech. Comm. 2017, 62, 736.
- Case Studies Supporting IEC 62232—Determination of RF Field Strength and SAR in the Vicinity of Radiocommunication Base Stations for the Purpose of Evaluation Human Exposure. 2019, pp. 1–124. Available online: https://webstore.iec.ch/publication/62014 (accessed on 22 April 2023).
- Iyama, T.; Onishi, T.; Sasaki, K.; Nagaoka, T.; Hamada, L.; Watanabe, S. Whole-body average SAR measurement using flat phantoms for radio base station antennas and its applicability to adult and child human models. Ann. Telecommun. 2019, 74, 93–102. [Google Scholar] [CrossRef]
- Björn, H.; Björn, T.; Christer, T. Analysis of the effect of mobile phone base station antenna loading on localized SAR and its consequences for measurements. Bioelectromagnetics 2011, 32, 664–672. [Google Scholar]
- Martínez-Búrdalo, M.; Martín, A.; Anguiano, M.; Villar, R. On the safety assessment of human exposure in the proximity of cellular communications base-station antennas at 900, 1800 and 2170 MHz. Phys. Med. Biol. 2005, 50, 4125–4137. [Google Scholar] [CrossRef] [PubMed]
- Ferikoğlu, A.; Çerezci, O.; Kahriman, M.; Yener, Ş.Ç. Electromagnetic Absorption Rate in a Multilayer Human Tissue Model Exposed to Base-Station Radiation Using Transmission Line Analysis. IEEE Antennas Wirel. Propag. Lett. 2014, 13, 903–906. [Google Scholar] [CrossRef]
- Karwowski, A. Numerical modelling calculations for evaluating exposure to radio-frequency emissions from base station antennas. In Proceedings of the 14th International Conference on Microwaves, Radar and Wireless Communications. MIKON—2002. Conference Proceedings (IEEE Cat.No.02EX562), Gdansk, Poland, 20–22 May 2002; Volume 3, pp. 809–812. [Google Scholar]
- Hamberg, L.; Lovehagen, N.; Siegbahn, M.; Tornevik, C. A method for determination of RF exposure compliance for pico cell base stations by SAR measurements in a flat phantom. In Proceedings of the IEEE Antennas and Propagation Society International Symposium. Digest. Held in conjunction with: USNC/CNC/URSI North American Radio Sci. Meeting (Cat. No. 03CH37450), Columbus, OH, USA, 22–27 June 2003; Volume 2, pp. 1009–1012. [Google Scholar]
- Nozadze, T.; Jeladze, V.; Tabatadze, V.; Petoev, I.; Prishvin, M.; Zaridze, R. Base station antenna’s EM exposure study on a homogeneous human model located inside the car. In Proceedings of the 2017 XXIInd International Seminar/Workshop on Direct and Inverse Problems of Electromagnetic and Acoustic Wave Theory (DIPED), Dnipro, Ukraine, 25–28 September 2017; pp. 209–213. [Google Scholar]
- Zhou, T.; Zhang, H.; Ai, B.; Liu, L. Weighted Score Fusion Based LSTM Model for High-Speed Railway Propagation Scenario Identification. IEEE Trans. Intell. Transp. Syst. 2022, 23, 23668–23679. [Google Scholar] [CrossRef]
- Zhou, T.; Zhang, H.; Ai, B.; Xue, C.; Liu, L. Deep-learning-based spatial-temporal channel prediction for smart high-speed railway communication networks. IEEE Trans. Wirel. Commun. 2022, 21, 5333–5345. [Google Scholar] [CrossRef]


Disclaimer/Publisher’s Note: The statements, opinions and data contained in all publications are solely those of the individual author(s) and contributor(s) and not of MDPI and/or the editor(s). MDPI and/or the editor(s) disclaim responsibility for any injury to people or property resulting from any ideas, methods, instructions or products referred to in the content. |
© 2023 by the authors. Licensee MDPI, Basel, Switzerland. This article is an open access article distributed under the terms and conditions of the Creative Commons Attribution (CC BY) license (https://creativecommons.org/licenses/by/4.0/).