Article

Synthesis, Crystal Structure, Local Structure, and Magnetic Properties of Polycrystalline and Single-Crystalline Ce2Pt6Al15

1
Graduate School of Science and Engineering, University of Toyama, Toyama 930-8555, Japan
2
Advanced Science Research Center, Japan Atomic Energy Agency, Tokai 319-1195, Japan
3
Aichi Synchrotron Radiation Center, Seto 489-0965, Japan
*
Author to whom correspondence should be addressed.
Symmetry 2023, 15(8), 1488; https://doi.org/10.3390/sym15081488
Submission received: 15 May 2023 / Revised: 5 June 2023 / Accepted: 9 June 2023 / Published: 27 July 2023
(This article belongs to the Special Issue X-ray Absorption Fine Structure and Symmetry)

Abstract

:
Asymmetry, such as non-centrosymmetry in the crystal or chiral structure and local symmetry breaking, plays an important role in the discovery of new phenomena. The honeycomb structure is an example of an asymmetric structure. Ce 2 Pt 6 Al 15 is a candidate for a frustrated system with honeycomb Ce-layers, which have been reported to show near the quantum critical point. However, the ground state of Ce 2 Pt 6 Al 15 depends on the sample, and analysis of the crystal structure is difficult due to the presence of stacking disorder. We synthesized polycrystalline Ce 2 Pt 6 Al 15 using arc melting method (AM-Ce 2 Pt 6 Al 15 ) and single-crystalline Ce 2 Pt 6 Al 15 using flux method (F-Ce 2 Pt 6 Al 15 ). The prepared samples were characterized by electron probe micro-analysis (EPMA), single and powder X-ray diffraction methods, measured magnetic properties and X-ray absorption spectroscopy (XAS). The composition ratio of AM-Ce 2 Pt 6 Al 15 was stoichiometric, although it contained a small amount (i.e., a few percent) of the impurity Ce 2 Pt 9 Al 16 . Meanwhile, the composition ratio of F-Ce 2 Pt 6 Al 15 deviated from stoichiometry. The X-ray absorption fine structure (XAFS) spectrum of AM-Ce 2 Pt 6 Al 15 at the Ce L 3 -edge was similar to that of CeF 3 , which possesses the Ce 3 + configuration, indicating that the valence of Ce in Ce 2 Pt 6 Al 15 is trivalent; this result is consistent with that for the magnetic susceptibility. To determine the precise structure, we analyzed the extended X-ray absorption fine structure (EXAFS) spectra of Ce L 3 - and Pt L 3 -edges for Ce 2 Pt 6 Al 15 , and found that the EXAFS spectra of Ce 2 Pt 6 Al 15 can be explained not as a hexagonal Sc 0.6 Fe 2 Si 4.9 -type structure but, instead, as an orthorhombic structure with honeycomb structure.

1. Introduction

Many curious physical properties have been observed in strongly correlated f electron systems, such as non-Fermi liquid (NFL), unconventional quantum critical behavior, and so on. The magnetic frustration effect is one of the most important properties for anomalous phenomena. Quantum critical behavior due to the magnetic frustration effect in YbAgGe with the distorted kagome lattice has been observed [1]. In YbRh 2 Si 2 , unconventional quantum critical behavior has been observed [2,3], and the magnetic frustration effect was considered as a candidate for the origin of the critical behavior [4]. CePdAl with the distorted kagome lattice is a partially magnetically frustrated system: 2/3 of the Ce exhibits long-range order, while 1/3 does not participate in long-range magnetic ordering [5]. These properties have been observed around the quantum critical point with frustrated systems. Therefore, searching for compounds presenting magnetic frustration may facilitate the discovery of novel quantum phenomena.
One of the origins of this frustration is the geometric arrangement (e.g., a honeycomb lattice) of the atoms of interest. In the system with non-centrosymmetric crystal structure, unconventional superconductivity has been observed [6]. Kitaev spin liquid [7] and current-induced magnetoelectric effects in a toroidal magnetic ordered state [8] have recently been observed in crystals possessing honeycomb structure.
The R 2 T 6 X 15 (R = rare earth and actinide, T = Pt, Pd, Fe, Ni, X = Al, Ga, Si) system is one of the candidates for determining frustrated systems with honeycomb structure. Several rare-earth and uranium compound series belonging to this system, such as R-Pd-X [9], R-Pt-X [10,11,12,13,14,15,16,17,18,19,20,21,22,23,24,25], R-Ni-(Ga, Ge) [26], and R-Fe-Si [27,28,29], have been reported. In the early stages of research, this crystal structure was solved as the hexagonal Sc 0.6 Fe 2 Si 4.9 -type structure (space group 194 ( P 6 3 / m m c )) [19], as shown in Figure 1a,c. This structure consists of R 2 X 3 - and T X 2 -layers. The occupancies of R and X(1) sites in the R 2 X 3 -layer are 2/3 and 1/3, respectively, indicating that these sites are only partially occupied. The nearest RR distance is about 4 Å. The distance between the R 2 X 3 -layer is about twice larger than the RR distance, indicating that the magnetic interaction is two-dimensional. In the recent reports, superstructure reflections corresponding to a larger in-plane lattice parameters have been observed, suggesting the formation of a superstructure of the original hexagonal unit cell. Moreover, the existence of streak scattering along the [001]-direction indicates stacking disorder in the superstructure. Overall observations have led to the conclusion of the formation of R 2 X 3 honeycomb layers with local orthorhombic symmetry (space group 63 ( C m c m )) [25], as shown in Figure 1b,d. Most of the research focused on this system has utilized the X-ray diffraction method; however, X-ray diffraction is not sensitive enough for analysis of the stacking disorder in the crystal structure. On the other hand, there has been only one report on the use of X-ray absorption fine structure (XAFS) for Ce 2 Pt 6 Ga 15 [19], which is much more sensitive to the local symmetry. Therefore, one of the purposes of this paper is to detail our XAFS measurements, which were made in order to clarify the local structure of Ce 2 Pt 6 Ga 15 . In X-ray diffraction, only the averaged structure is observed. As the local structure is averaged over the stacking disorder, it cannot be used to distinguish whether the R and X sites in the R 2 X 3 -layer are randomly occupied or not.
There have been contradicting reports on the physical properties of Ce 2 Pt 6 Al 15 . The polycrystalline Ce 2 Pt 6 Al 15 prepared by arc melting (AM-Ce 2 Pt 6 Al 15 ) was an antiferromagnet with T N = 2.6 K [25], while Ce 2 Pt 6 Al 15 prepared by unknown method [30] and the single-crystalline [31] Ce 2 Pt 6 Al 15 prepared using flux method (F-Ce 2 Pt 6 Al 15 ) exhibited NFL behavior. As a possible origin of the sample dependence, the difference in the local crystal structure arising from different preparation methods was inferred. As such, a further purpose of this study is to clarify the crystallographic difference between AM- and F-Ce 2 Pt 6 Al 15 samples and to discuss the existing contradicting physical data by detailing the measured magnetic properties in well-characterized Ce 2 Pt 6 Al 15 samples.

2. Experimental

AM-Ce 2 Pt 6 Al 15 was prepared by arc melting method under Ar atmosphere. The purity of elements were 3N (99.9%):Ce, 3N:Pt, and 6N:Al. F-Ce 2 Pt 6 Al 15 was prepared by the aluminum self-flux method. Ce, Pt, and Al with the starting composition 1:3:30 were loaded in an alumina crucible and then sealed in a quartz tube under high vacuum. The sealed tube was heated to 1050 °C, soaked for 6 h, then cooled to 700 °C in 268 h. The excess Al was spun off in a centrifuge. Figure 2 shows a photograph of the F-Ce 2 Pt 6 Al 15 .
Powder X-ray diffraction measurements were performed using Rint 2100 (Rigaku) using Cu K α radiation at room temperature. The powder was prepared using a mortar. Rietveld analysis was performed using the Rietan-FP program [32].
Single crystal X-ray diffraction measurements were performed with R-AXIS RAPID (Rigaku) diffractometer using Mo K α radiation at room temperature. Small pieces (~0.05 mm) for single crystal X-ray diffraction measurements were prepared by cutting the sample with a knife. The final atomic coordinates and occupancies were refined using the SHELXL97 program [33].
The compositions were determined by electron-probe micro analysis (EPMA; (JEOL JXA-8230) with CeP 5 O 14 , Pt, and Al as a reference materials at room temperature. Samples were polished using the emery papers to measure EPMA.
The magnetic properties were performed by a superconducting quantum interference device (SQUID) magnetometer (Quantum Design MPMS) from 330 to 2 K under a magnetic field up to 7 T.
XAFS measurements were performed using the BL11S2 at the Aichi Synchrotron Radiation Center in transmission geometry at the Ce L-edge (L 3 : 5723 eV) and Pt L-edge (L 3 : 11,563 eV) at room temperature. CeF 3 and CeO 2 were used as reference compounds for Ce 3 + and Ce 4 + valency, respectively. The XAFS spectra were processed and analyzed using ATHENA and ARTEMIS codes [34].
The extended X-ray absorption fine structure (EXAFS) analyses were performed using the following equation,
χ ( k ) = S 0 2 j N j F j ( k ) k R j 2 sin ( 2 k R j + δ j ( k ) ) e 2 ( σ j 2 k 2 + R j λ ( k ) )
where χ denotes the EXAFS oscillation; k is the wavenumber of the photoelectron; S 0 2 is the probability of single-electron excitation; N j , R j , F j ( k ) , σ j 2 , and δ j ( k ) are the co-ordination number, inter-atomic distance, back-scattering atomic form factor, Debye–Waller factor, and phase shift of the neighboring atom j, respectively; and λ ( k ) is the mean free path of photoelectrons.

3. Results and Discussion
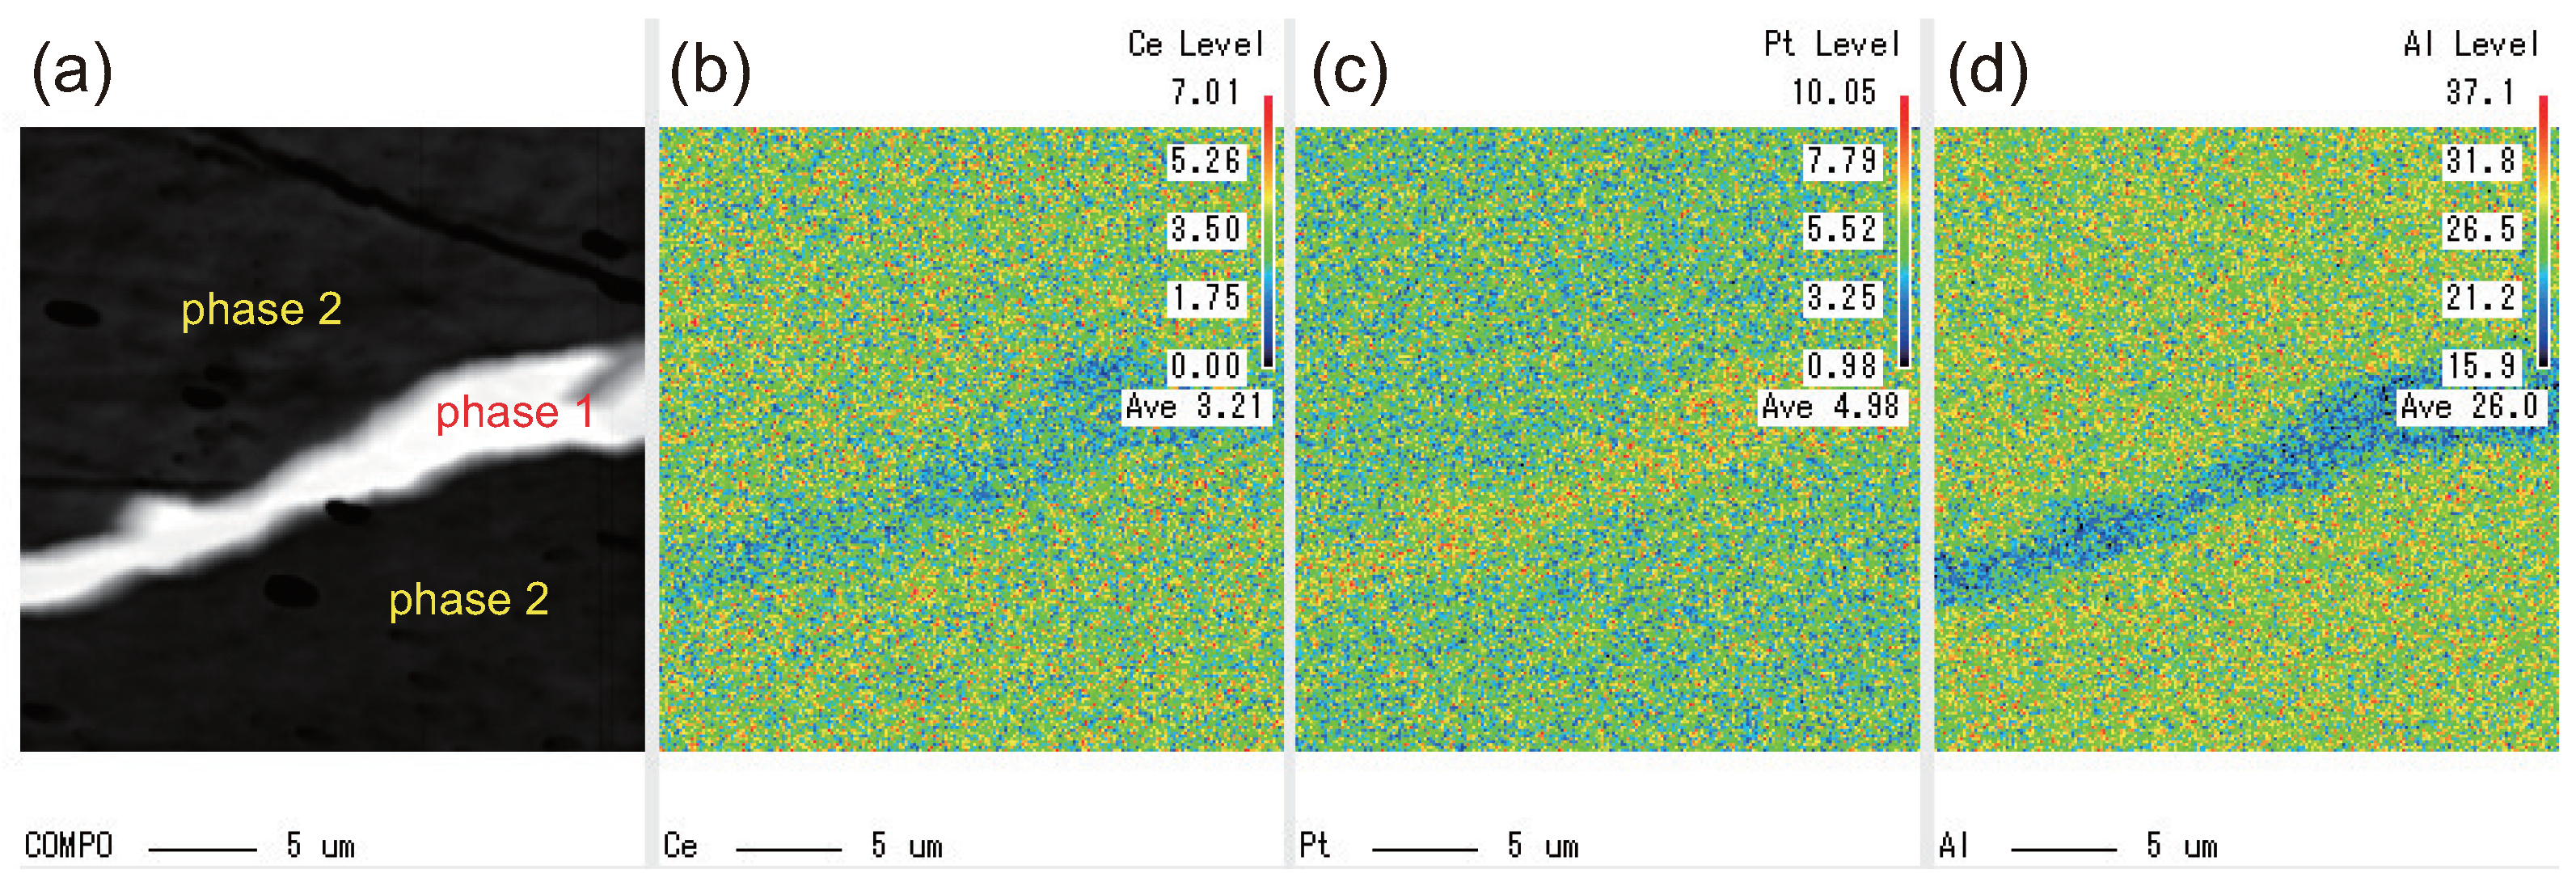
3.1. EPMA

The compositions of the AM- and F-Ce 2 Pt 6 Al 15 samples were analyzed by EPMA. Figure 3 shows the back-scattered electron (BSE) images and the counter map images of Ce, Pt, and Al in AM-Ce 2 Pt 6 Al 15 . The few black points and lines in the BSE images are scratches that occurred during polishing. A clear gradation can be observed in the BSE images, indicating that the sample possessed two phases. The compositions of Ce, Pt, and Al of the bright area (phase 1) in the BSE image differ from those in the gray area (phase 2). We identified phase 1 as the impurity Ce 2 Pt 9 Al 16 phase and phase 2 as Ce 2 Pt 6 Al 15 . The composition ratio of AM-Ce 2 Pt 6 Al 15 (phase 2) was Ce:Pt:Al = 2.11(6):6:15.5(4).
There is no impurity phase in F-Ce 2 Pt 6 Al 15 . The composition ratio of F-Ce 2 Pt 6 Al 15 was Ce:Pt:Al = 2.09(8):6:16.5(3), indicating that the ratio of Al in the F-Ce 2 Pt 6 Al 15 is rich.

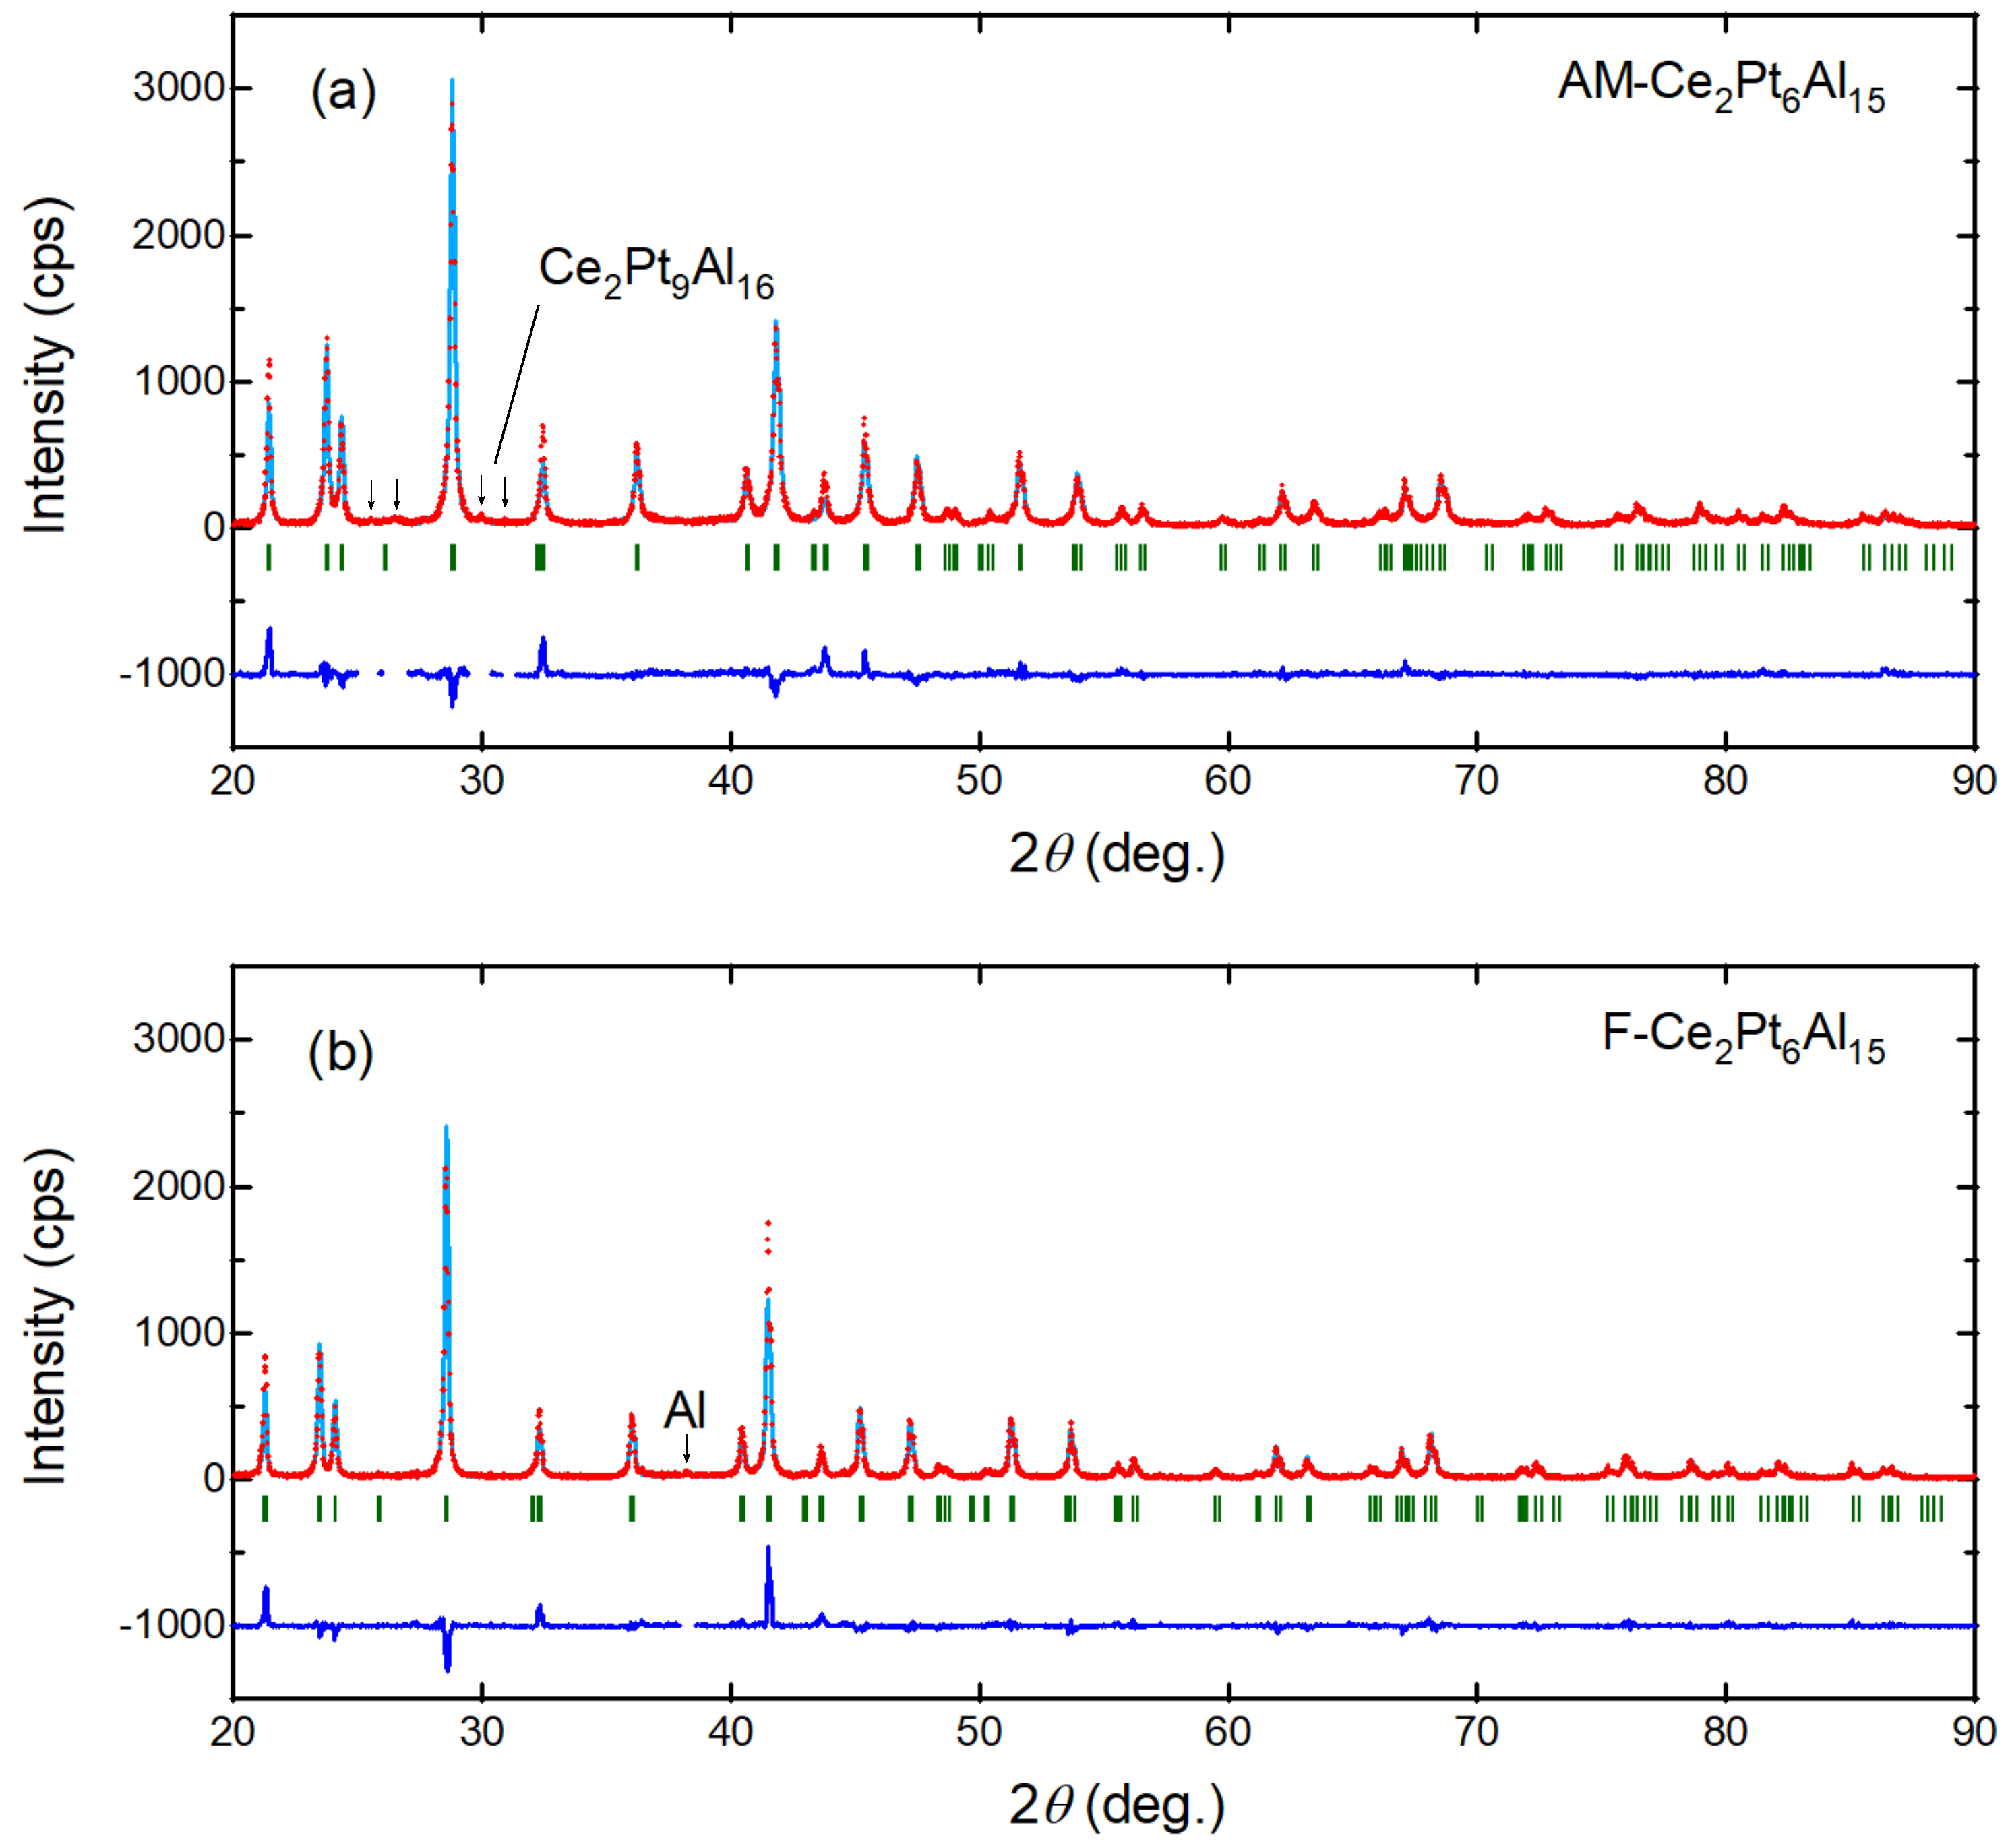
3.2. Powder X-ray Diffraction

We conducted powder X-ray diffraction on AM- and F-Ce 2 Pt 6 Al 15 samples. Figure 4a shows the Rietveld plot of AM-Ce 2 Pt 6 Al 15 . The reliability factor-weighted pattern R w p and Goodness of fit S were 16.842 and 1.4555, respectively. Most of the Bragg peaks were assigned according to the hexagonal Sc 0.6 Fe 2 Si 4.9 -type structure (space group 194 ( P 6 3 / m m c ), and we determined that the lattice constants a and c were 4.3082(3) Å and 16.5040(10) Å, respectively. The powder X-ray diffraction showed weak impurity peaks, indicating the existence of a few impurity phases in the sample. These peaks were assigned to Ce 2 Pt 9 Al 16 with orthorhombic Ce 2 Pt 9 Al 16 -type structure [35,36]. The impurity was also detected in the EPMA measurements.
Figure 4b shows the Rietveld plot of F-Ce 2 Pt 6 Al 15 . The R w p and S values were 21.742 and 1.5068, respectively. Most of diffraction patterns were indexed by the hexagonal Sc 0.6 Fe 2 Si 4.9 -type structure, and we determined that the lattice constants a and c were 4.3207(3) Å and 16.4776(8) Å, respectively. A small peak from Al was detected; this impurity is likely to be the flux that could not be removed by the centrifuge.

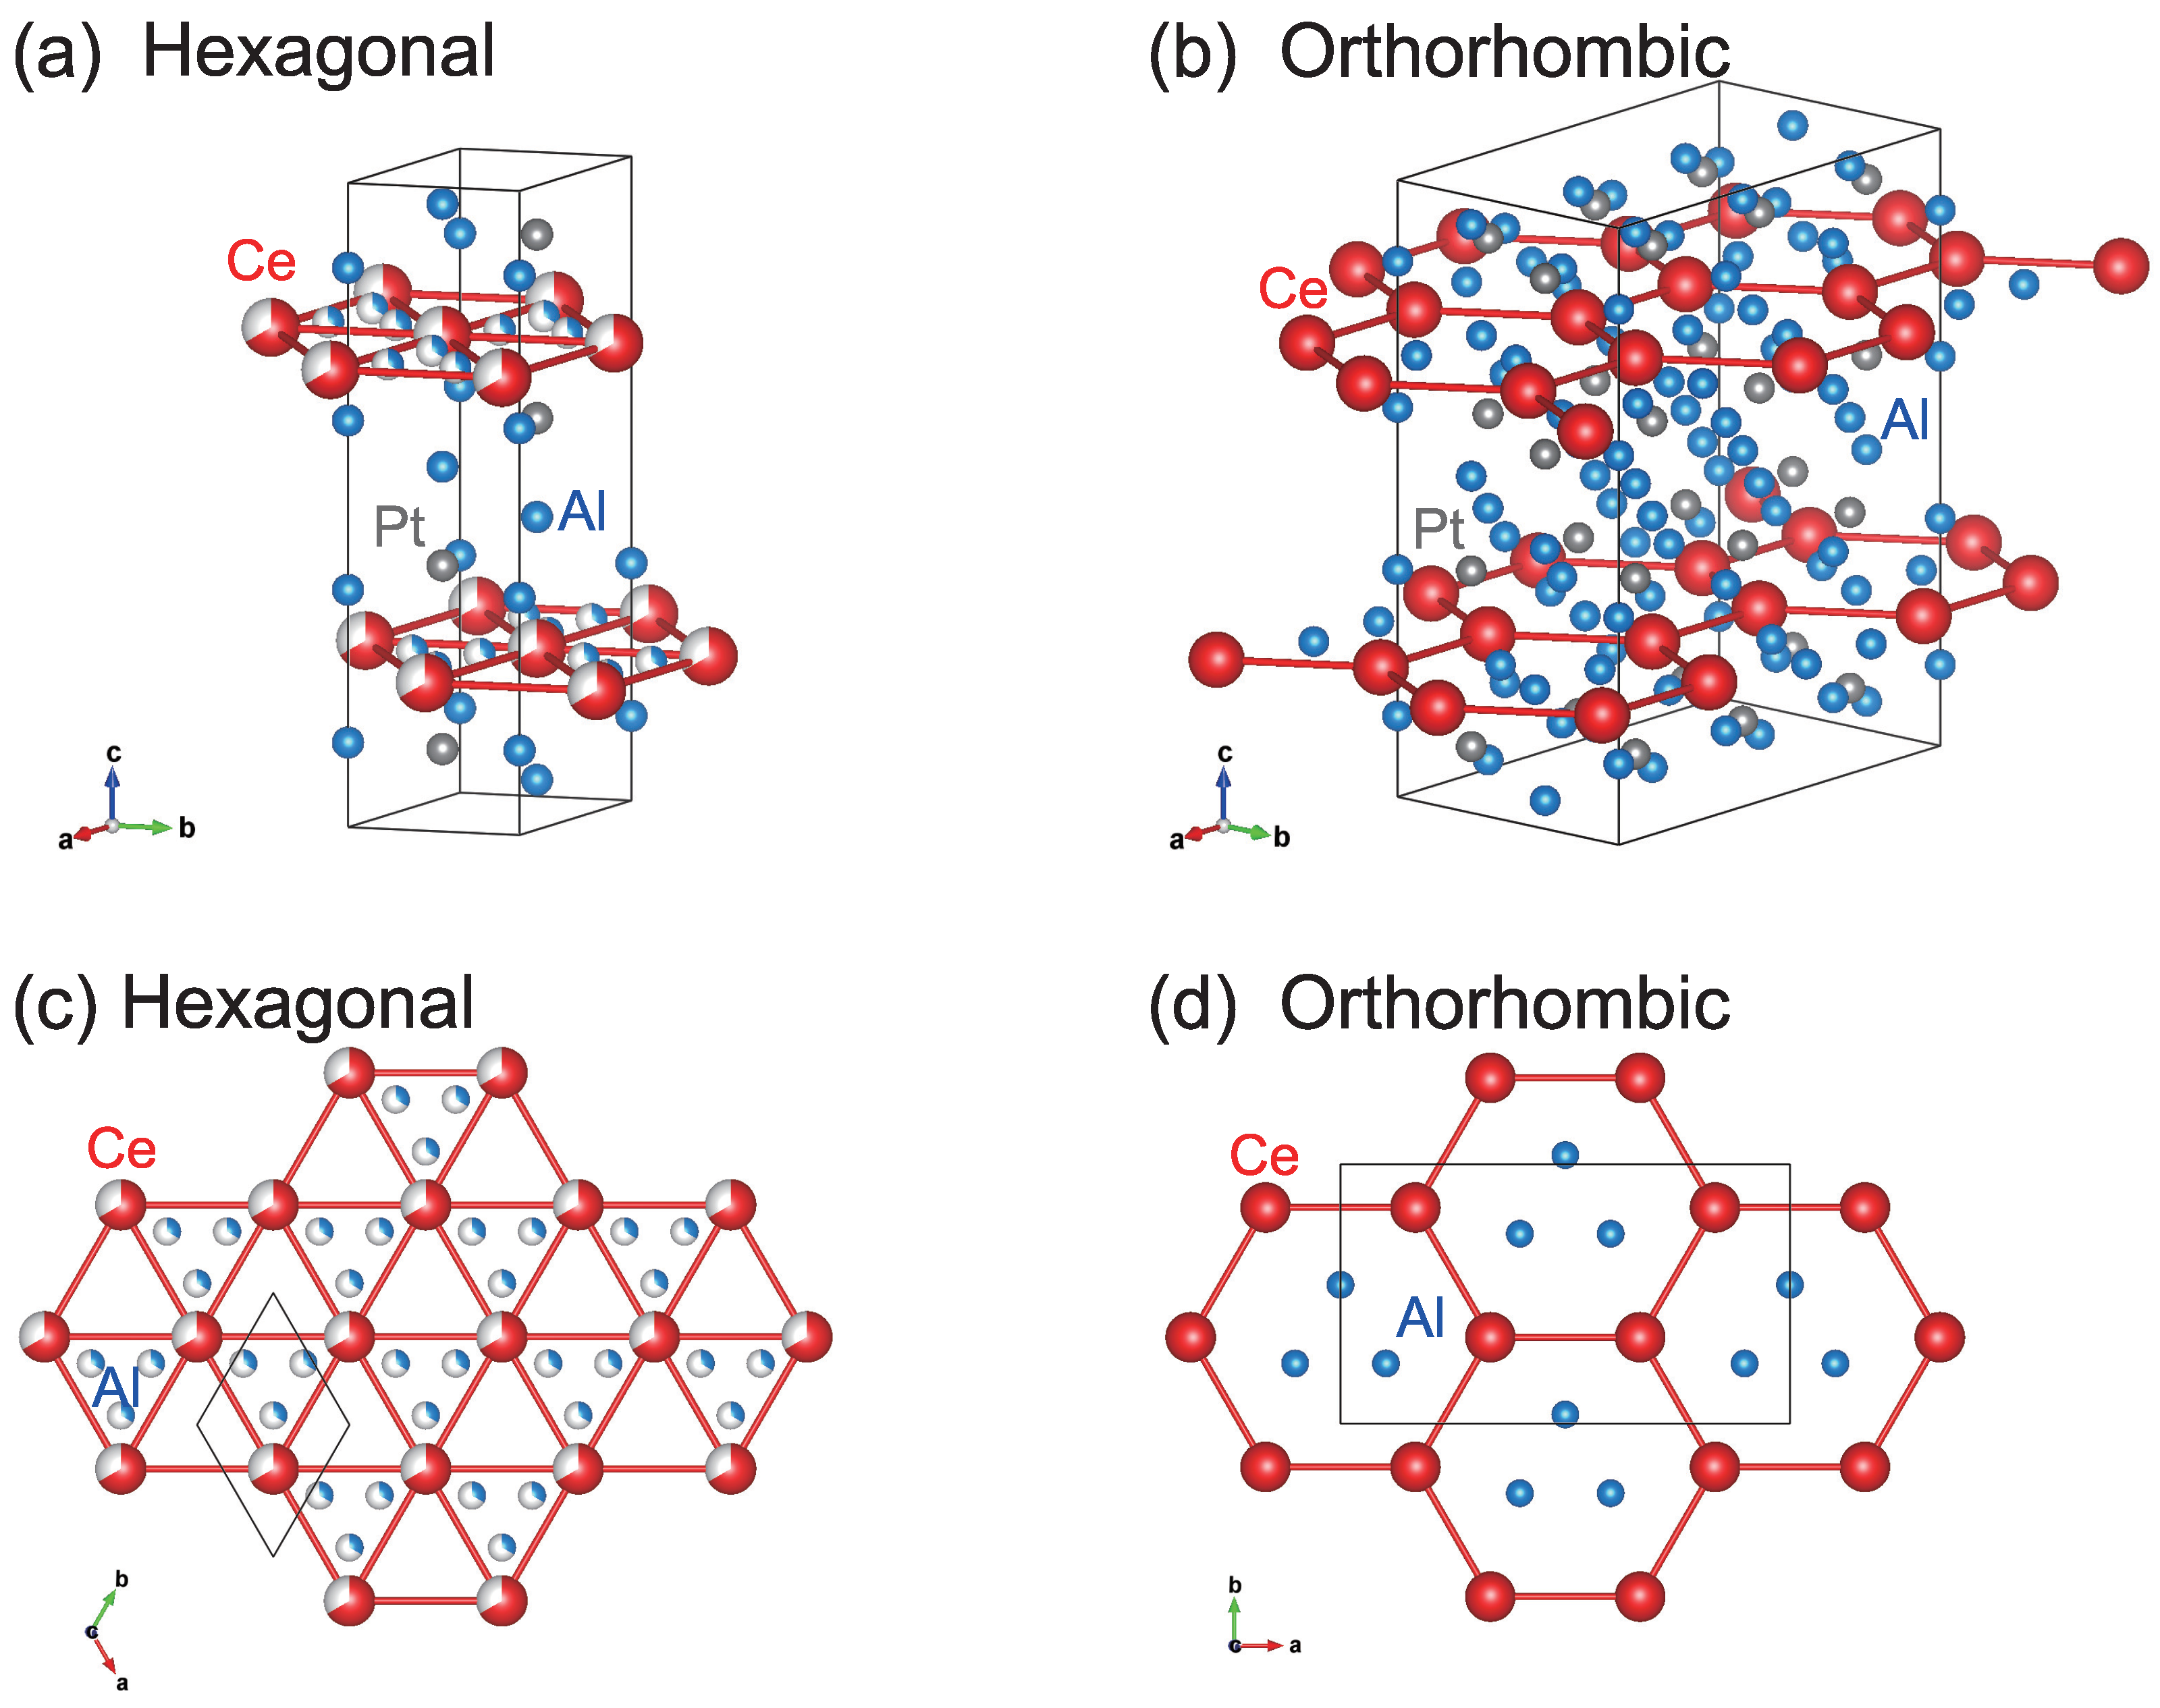
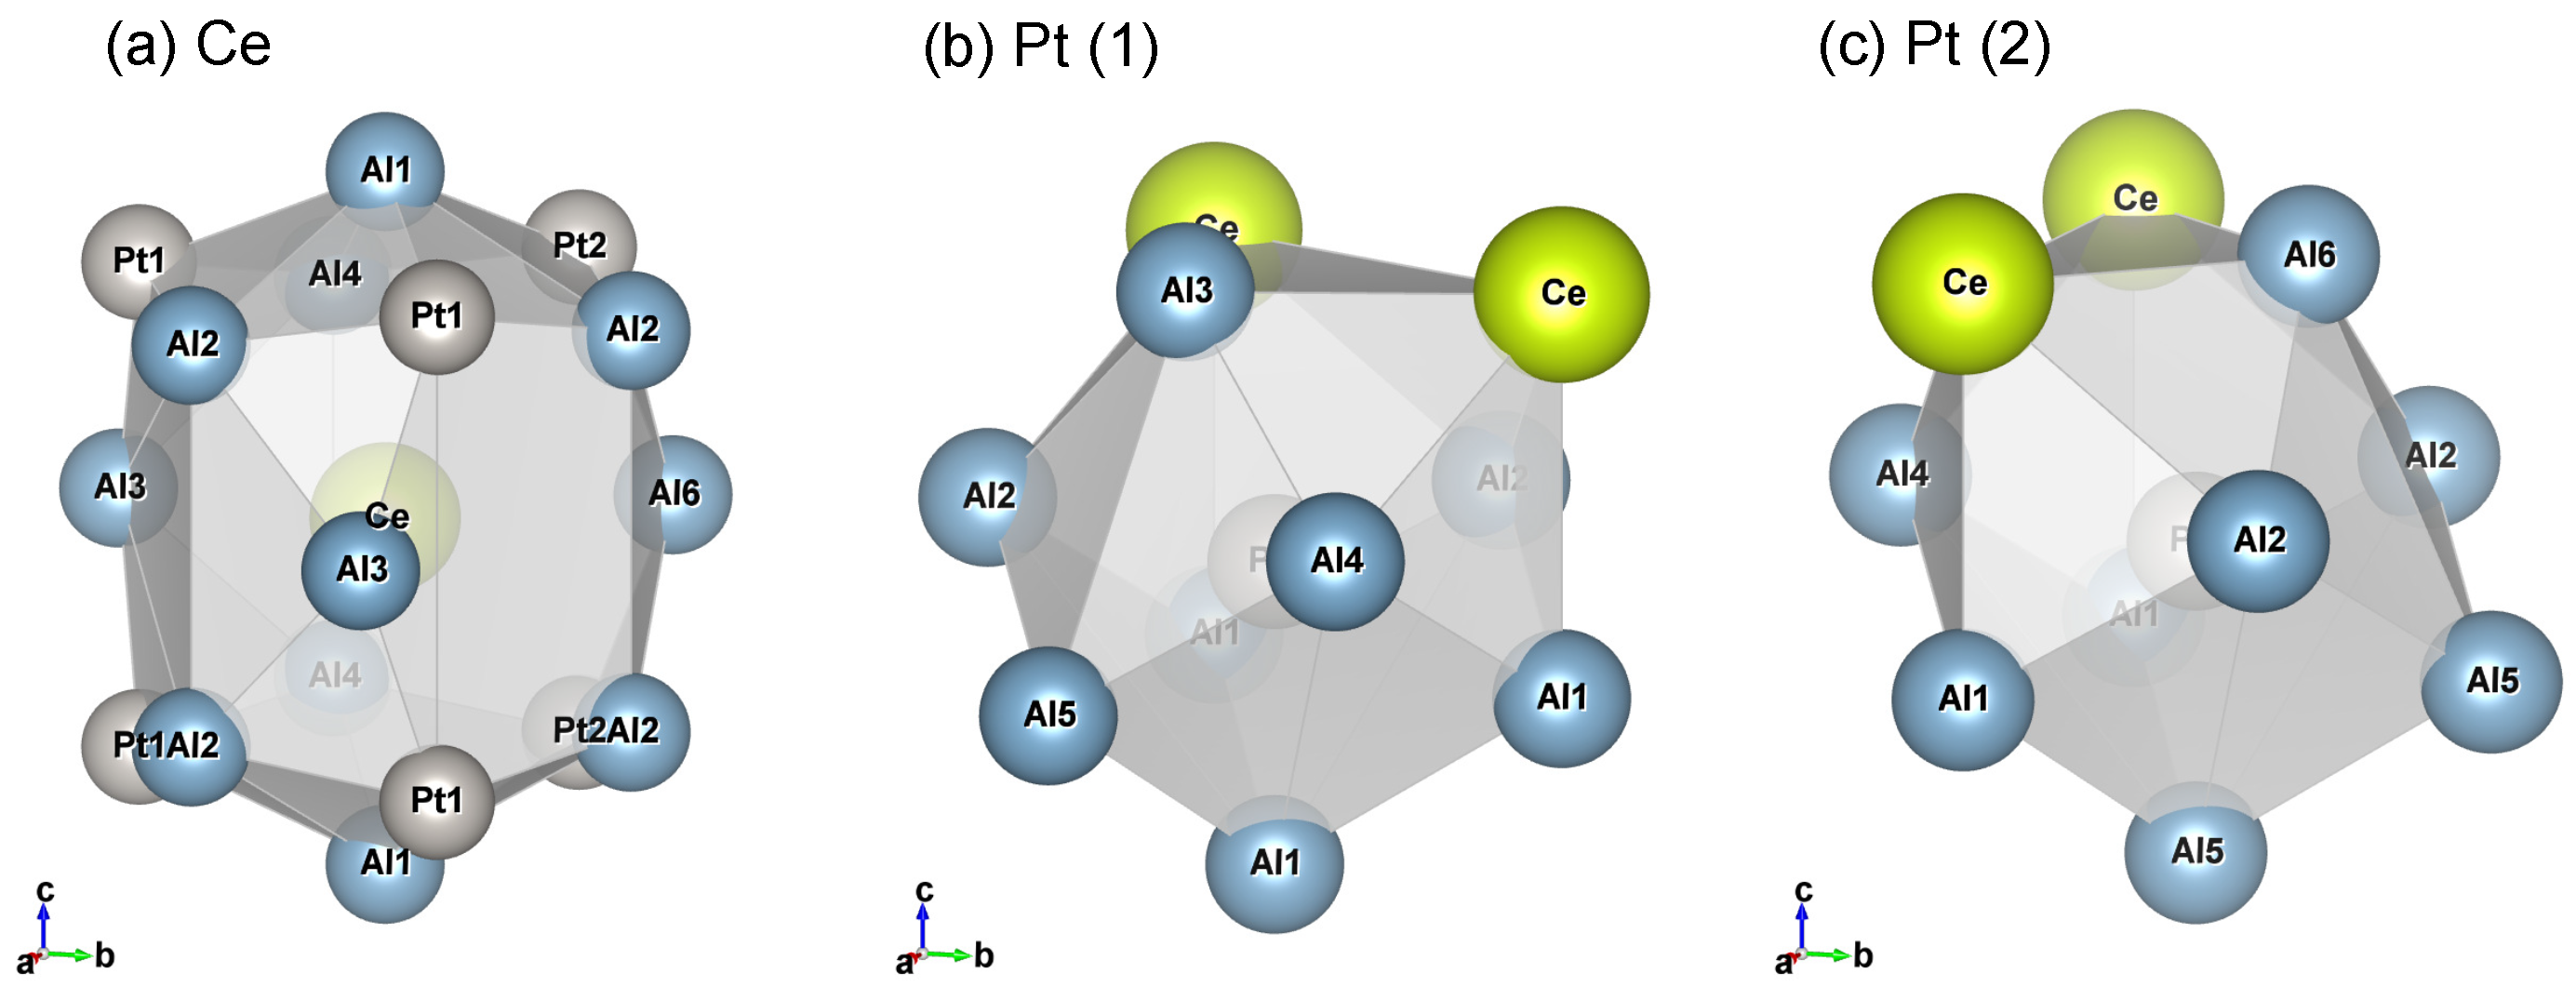
3.3. Single Crystal X-ray Diffraction

We performed single crystal X-ray diffraction measurements of AM- and F-Ce 2 Pt 6 Al 15 . For this, we analyzed the crystal structure using hexagonal Sc 0.6 Fe 2 Si 4.9 -type structure, which is the averaged structure of the orthorhombic ordered structure, as it is difficult to analyze the effect of stacking defects. Crystallographic data, structure refinements, fractional co-ordinates, occupancy, and equivalent atomic displacement parameters U eq for Ce 2 Pt 6 Al 15 are given in Table 1 and Table 2. The lattice parameters of AM-Ce 2 Pt 6 Al 15 were a = 4.3127(7) Å and c = 16.5156(13) Å, and those for F-Ce 2 Pt 6 Al 15 were a = 4.3322(4) Å and c = 16.4976(7) Å, indicating that the uniaxial chemical pressure effect between AM-Ce 2 Pt 6 Al 15 and F-Ce 2 Pt 6 Al 15 can be expected. We fitted the site occupancies assuming the occupancy of Pt as 100%. The occupancies of Ce and Al sites of AM-Ce 2 Pt 6 Al 15 were close to the stoichiometric ratios. On the other hand, the occupancies of Al sites in F-Ce 2 Pt 6 Al 15 deviated from the stoichiometric ratio; namely, the composition ratio of Al in the F-Ce 2 Pt 6 Al 15 is rich. The composition ratios estimated according to the results of the single crystal X-ray diffraction experiments were consistent with those of EPMA.
We converted the lattice parameters from the hexagonal Sc 0.6 Fe 2 Si 4.9 -type structure to an orthorhombic ordered model (space group 63 ( C m c m )) to analyze the EXAFS according to the orthorhombic model; the results are shown in Table 3. We obtained the inter-atomic distance and co-ordination number (N) of neighboring atoms around Ce, Pt(1), and Pt(2) sites, which are given in Table 4. EXAFS analysis was performed using these parameters as initial conditions. Figure 5 shows the Ce, Pt, and Al sites with their surrounding neighboring atoms.

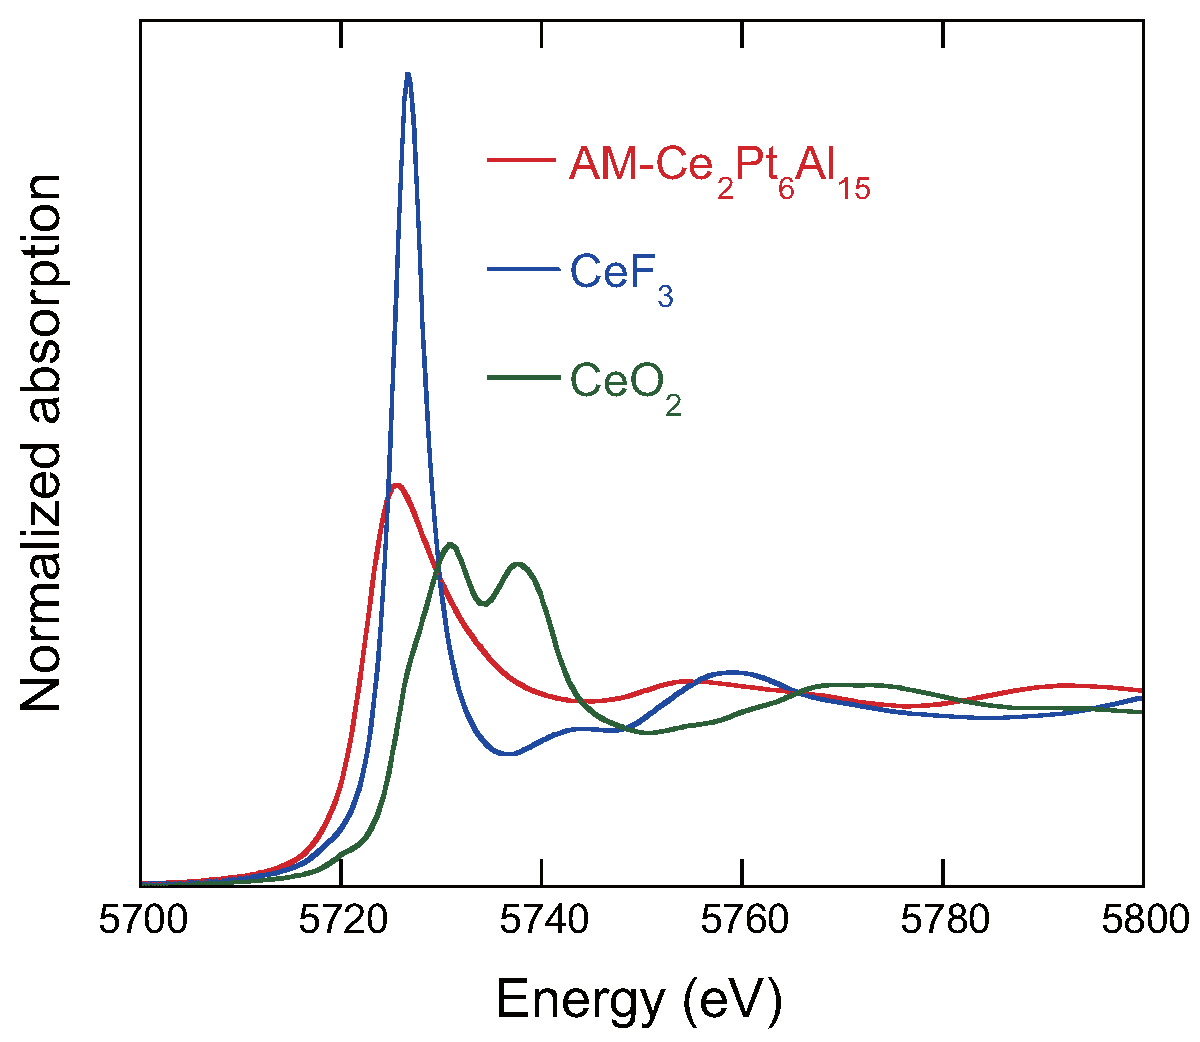
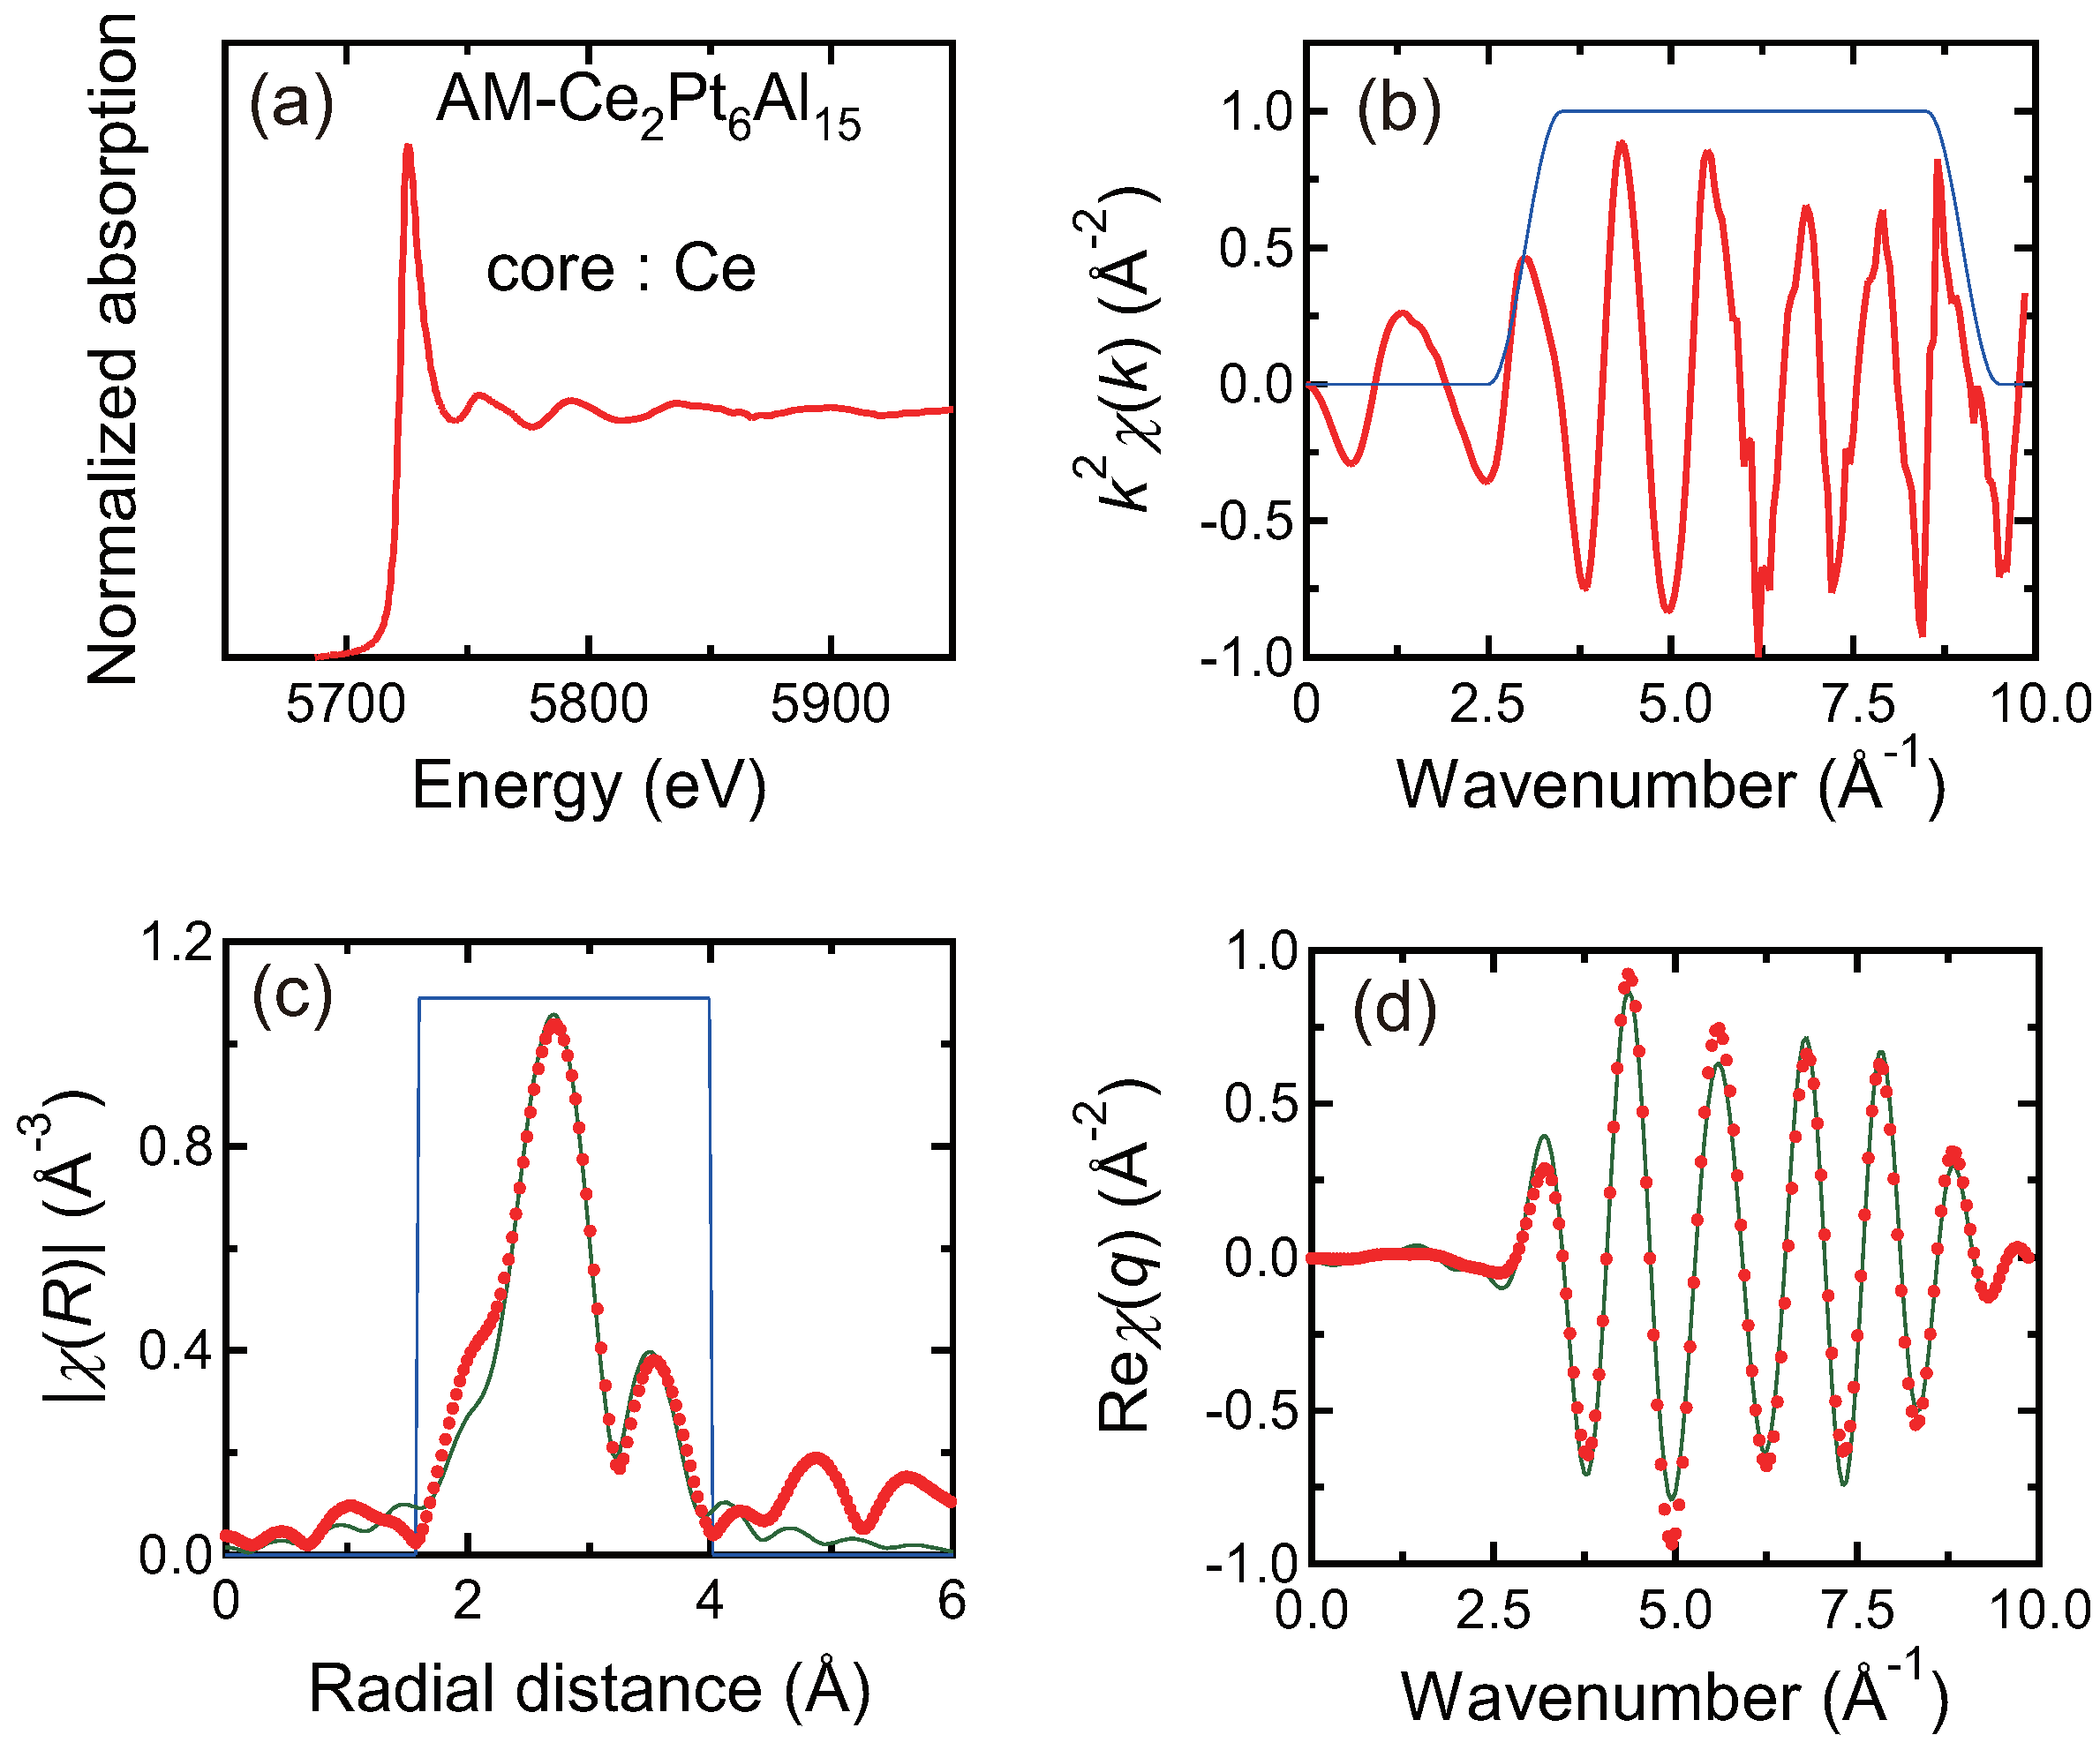
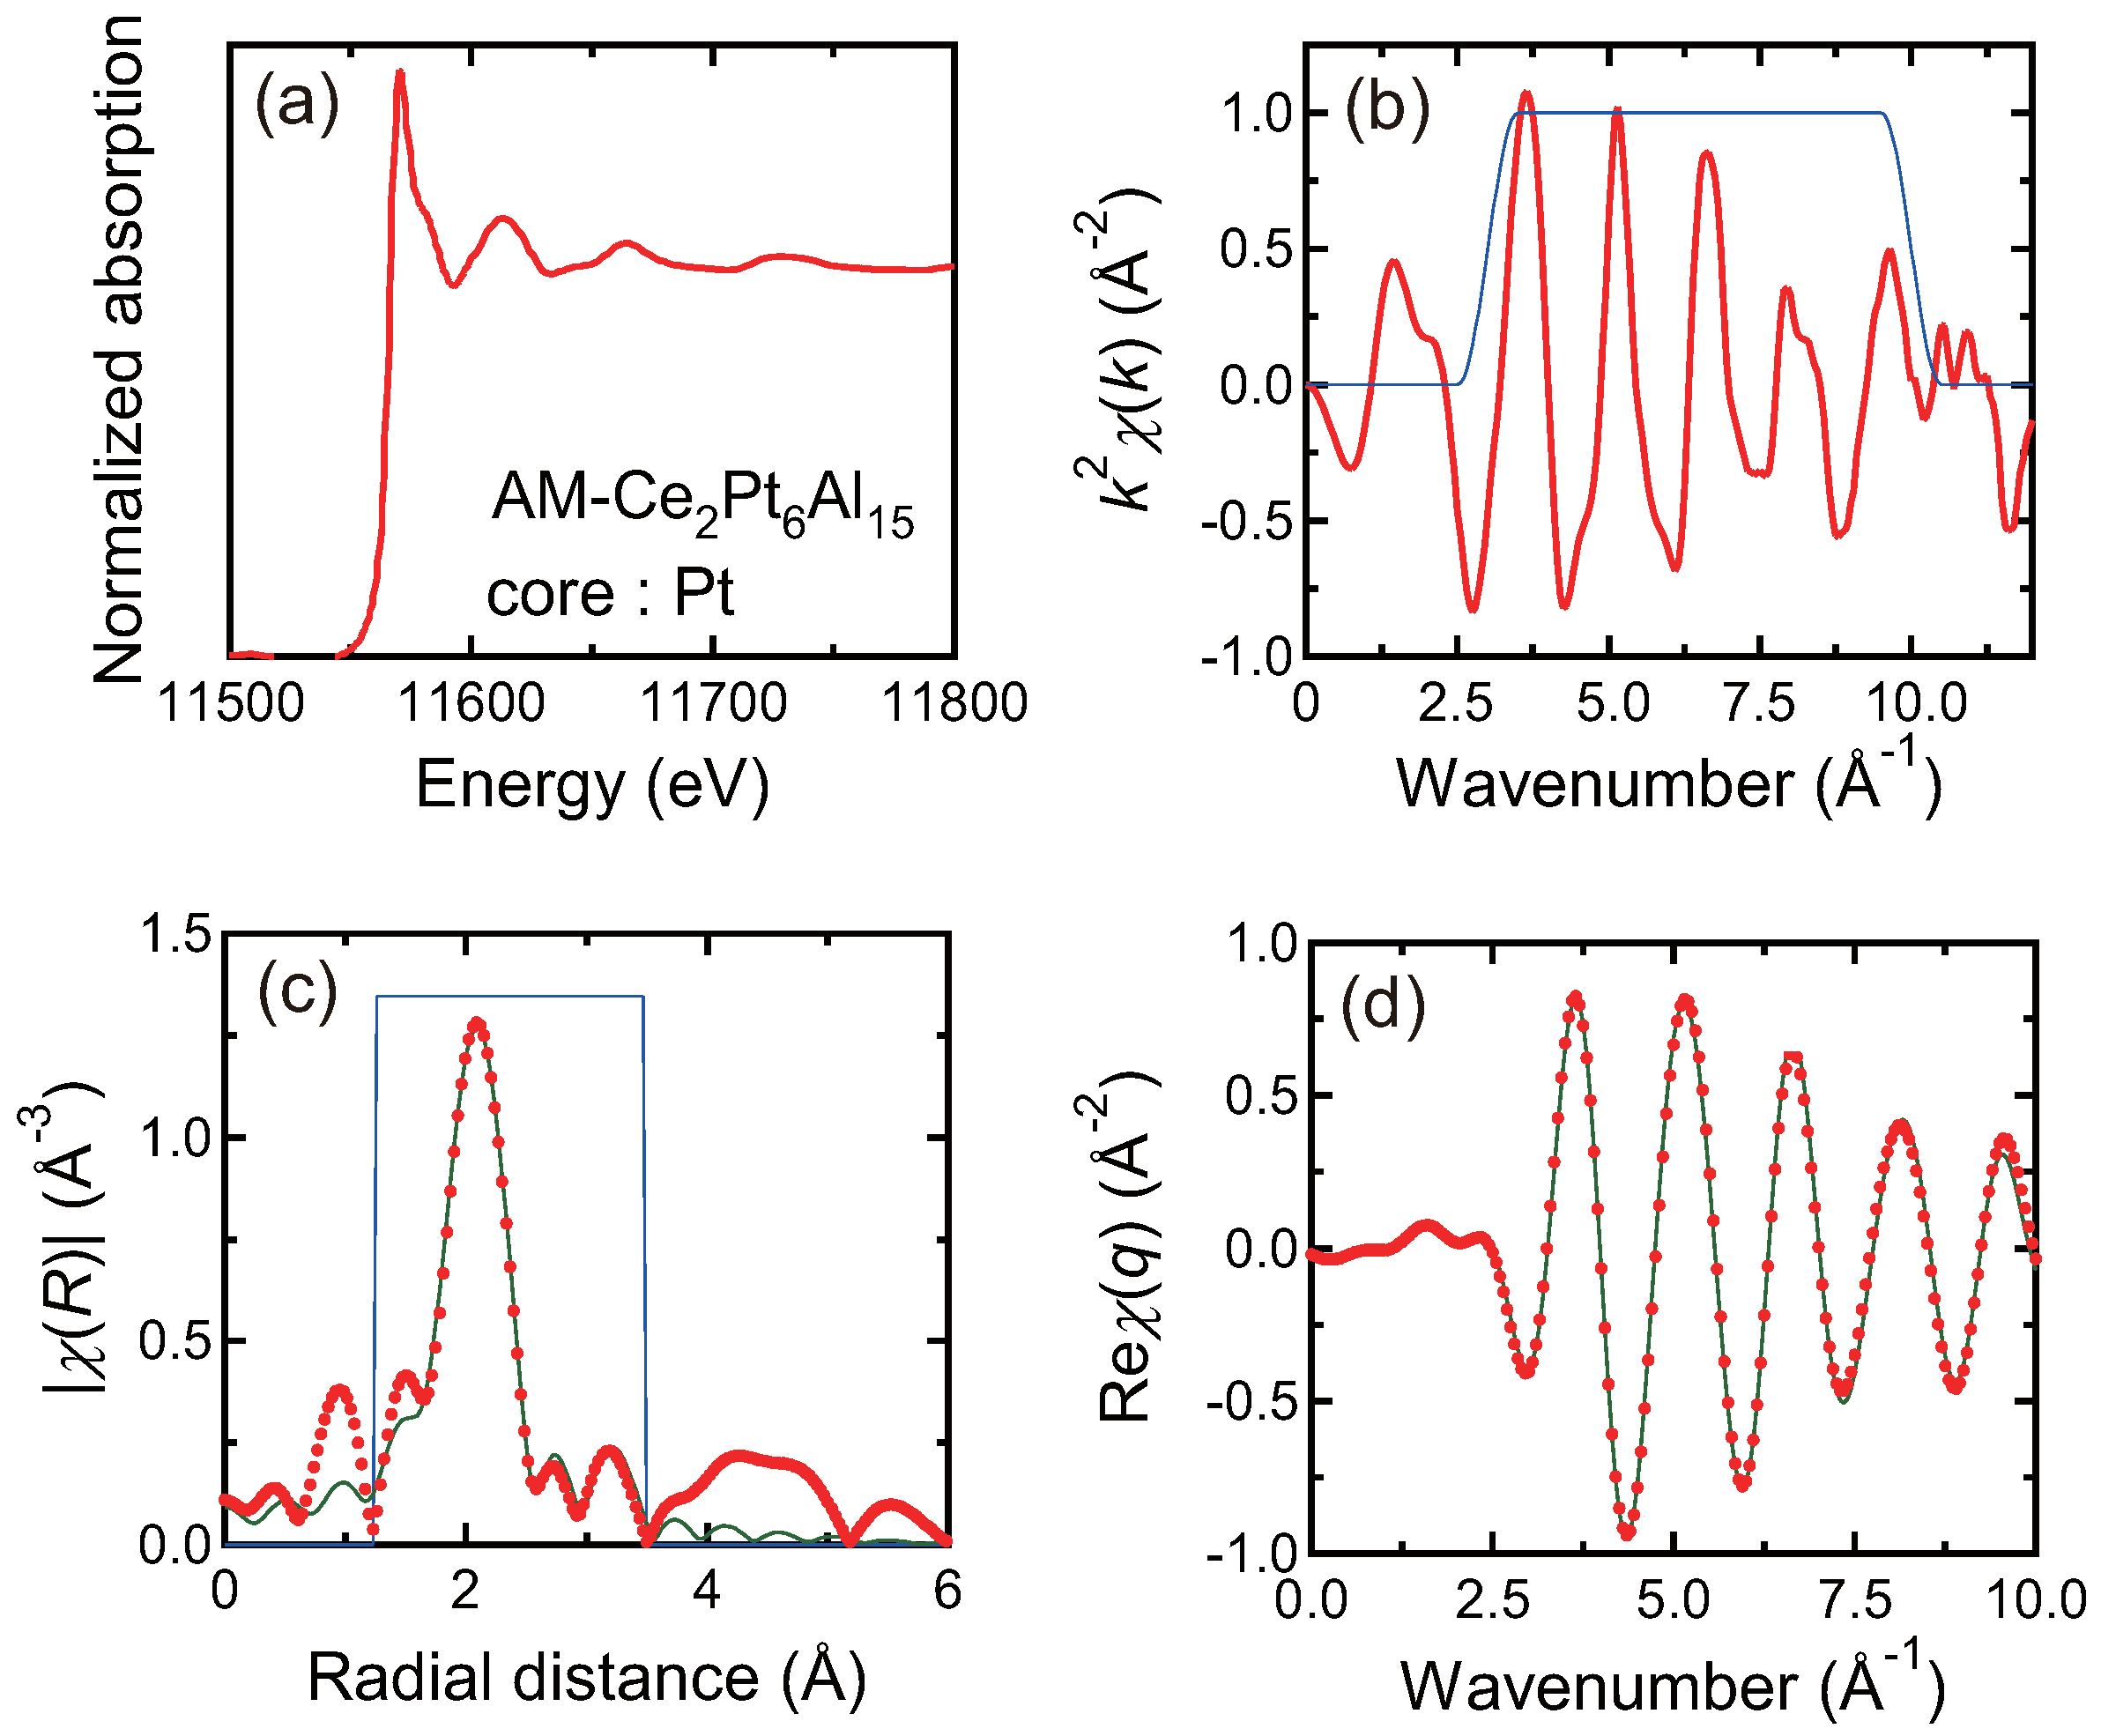
3.4. X-ray Absorption Spectroscopy

Figure 6 shows the Ce L 3 -edge XAFS spectra of AM-Ce 2 Pt 6 Al 15 , CeF 3 , and CeO 2 . CeF 3 and CeO 2 were used as reference compounds for trivalent and tetravalent Ce, respectively. A peak structure was observed around 5720 eV, which corresponds to the Ce L 3 -edge. In all the spectra, a clear oscillation structure was observed above L 3 -edge. The XAFS edge energy of Ce 2 Pt 6 Al 15 was close to that of trivalent reference CeF 3 , while the edge energy of tetravalent CeO 2 had a higher value, as expected, given that edge energy increases as the oxidation state of the absorber increases. Thus, the Ce valence in Ce 2 Pt 6 Al 15 was determined to be trivalent and Ce should possess the local magnetic moment. The peak of Ce 2 Pt 6 Al 15 was broader than that of CeF 3 , implying that this system may be in a mixed valency state.
We analyzed the EXAFS spectra for AM-Ce 2 Pt 6 Al 15 around the Ce and Pt sites considering the orthorhombic structure. Although there was a slight difference, the Pt(1) and Pt(2) sites had almost identical local structure and, therefore, we assume that their contributions to the spectra were identical. Figure 7a and Figure 8a show the XAFS spectra of Ce and Pt sites. In the process of structural refinement, the data in the range of 1.57–4.00 Å for Ce, and 1.23–3.49 Å for Pt was considered as indicated by a blue line in Figure 7c and Figure 8c. By analyzing the spectra with respect to the Ce site, 9 first neighbor atoms located around 3.1 Å (Al(2), Al(3), Al(4) and Al6)) and 6 second neighbor atoms located around 3.4 Å (Pt(1) and Pt(2)) were identified. On the other hand, the hexagonal Sc 0.6 Fe 2 Si 4.9 -type structure model predicts the existence of Al atoms around Ce within a very short distance (i.e., 1.5 A). However, the corresponding peak structure was not observed in the XAFS spectra, indicating the plausibility of the orthorhombic structure.
We did not consider the scattering term between Ce and Al(1) site in the EXAFS analysis, as the corresponding intensity was expected to be weak. The first, second, and third neighbor atoms around the Pt site were 5 atoms around 2.5 Å (Al(1), Al(2), Al(3), and Al(4)), 3 atoms around 2.7 Å (Al(1) and Al(5)), and 2 atoms around 3.4 Å (Ce), respectively. The co-ordination numbers were kept fixed. The green lines in Figure 7d and Figure 8d are the results of the structural refinement fit with the inverse Fourier transforms (FTs) of the experimental χ ( R ) spectra. The refined structural parameters are listed in Table 5, where N denotes the number of neighboring atoms, σ 2 is the Debye–Waller factor, and R is the inter-atomic distance between Ce or Pt and the neighboring scatter atoms. The experimental χ ( R ) spectra in Figure 7c and Figure 8c are well-explained by the χ ( R ) spectra for Ce and Pt sites calculated using the orthorhombic model, indicating that Ce 2 Pt 6 Al 15 has a honeycomb structure.

3.5. Magnetic Properties

Figure 9a shows the temperature dependence of the magnetic susceptibility of AM- and F-Ce 2 Pt 6 Al 15 . The susceptibility of AM-Ce 2 Pt 6 Al 15 at 0.1 T monotonously increased with decreasing temperature, corresponding to its paramagnetic behavior at high temperature, and it presented a broad maximum around 50 K. A broad maximum of susceptibility is often observed in heavy fermion systems, such as CeRu 2 Si 2 [37], Yb 2 Pt 6 Al 15 [17], YbPd 2 Si 2 [38,39], and so on. Below 20 K, the magnetic susceptibility increases with paramagnetic behavior again. It has an antiferromagnetic-like anomaly at T * = 2.6 K. These susceptibility behaviors are similar to those described by Radzieowski et al., [25]. According to the powder X-ray diffraction and EPMA measurements, this sample contained Ce 2 Pt 9 Al 16 ; notably, the T * value was in good agreement with T N = 2.6 K obtained previously for Ce 2 Pt 9 Al 16 [35,36]. The inset of Figure 9 shows the temperature dependence of the susceptibility of AM-Ce 2 Pt 6 Al 15 at low temperatures when magnetic fields are applied ( μ 0 H = 0.1, 0.5, 1, 1.2, and 1.5 T). T * shifted to lower temperatures with increasing magnetic field and disappeared above 1.5 T. The magnetic field dependence of T * showed the same behavior as that observed by Strydom for Ce 2 Pt 9 Al 16 , which vanished around μ 0 H = 1.5 T [36]. The anomaly at T * and the paramagnetic behavior below 20 K are not likely to be intrinsic properties and the ground state of AM-Ce 2 Pt 6 Al 15 is non-magnetic. We also estimated the impurity from the magnetic susceptibility. The susceptibility increased with decreasing temperature below 20 K, and we assumed that the increase in magnetic susceptibility below 20 K was due to the presence Ce 2 Pt 9 Al 16 . From this, we estimated that the impurity was 2–3% in the molar ratio.
Figure 9b indicates the inverse magnetic susceptibility of AM-Ce 2 Pt 6 Al 15 at μ 0 H = 0.1 T. At high temperature, it linearly increased with temperature, indicating that it follows the Curie–Weiss law. We fit the inverse susceptibility above 210 K using χ = C / ( T θ P ) with the effective magnetic moment μ eff and the Weiss temperature θ P of 2.67 μ B and −132 K, respectively. These values were similar to those obtained by Radzieowski et al. [25]. The observed μ eff was close to the value of the Hund’s Rule expected for Ce 3 + , 2.54 μ B , indicating that the Ce 2 Pt 6 Al 15 presents a magnetic moment derived from the 4 f electrons of Ce at high temperature.
The magnetic susceptibility of F-Ce 2 Pt 6 Al 15 at 1 T monotonously increased with decreasing temperature, down to 2 K. It is possible that the ground state is NFL or magnetic order, as described by Manni et al. [30] and Suzuki et al. [31]. We fit the inverse susceptibility of F-Ce 2 Pt 6 Al 15 above 210 K using the Curie–Weiss law and obtained μ eff and θ P values of 2.90 μ B and −17.4 K, respectively. The susceptibility behavior was quite different from that of AM-Ce 2 Pt 6 Al 15 ; this difference may have been caused by the difference in uniaxial effect and the deviation from stoichiometry between AM- and F-Ce 2 Pt 6 Al 15 .

4. Conclusions

We synthesized AM-Ce 2 Pt 6 Al 15 using arc melting method and F-Ce 2 Pt 6 Al 15 using the Al-flux method. From the powder X-ray diffraction and EPMA results, the AM-Ce 2 Pt 6 Al 15 sample contained a Ce 2 Pt 9 Al 16 impurity, while there was no impurity phase in the F-Ce 2 Pt 6 Al 15 . Crystal structure analysis through the powder and single crystal X-ray diffraction methods was performed according to the hexagonal Sc 0.6 Fe 2 Si 4.9 -type structure (space group 194 ( P 6 3 / m m c )). From the single crystal X-ray diffraction method, the lattice parameters of AM-Ce 2 Pt 6 Al 15 were a = 4.3127(7) Å and c = 16.5156(13) Å, while those of F-Ce 2 Pt 6 Al 15 were a = 4.3322(4) Å and c = 16.4976(7) Å, indicating that the uniaxial chemical pressure effect between AM-Ce 2 Pt 6 Al 15 and F-Ce 2 Pt 6 Al 15 can be expected.
We performed XAS measurements of the AM-Ce 2 Pt 6 Al 15 sample. The magnetic properties of the Ce L 3 -edge for the XAFS spectra of Ce 2 Pt 6 Al 15 were similar to those of CeF 3 which possesses Ce 3 + , indicating that the valence state in Ce 2 Pt 6 Al 15 is trivalent. We analyzed the EXAFS spectra of Ce L 3 - and Pt L 3 -edges for Ce 2 Pt 6 Al 15 , and found that the EXAFS spectra of Ce 2 Pt 6 Al 15 cannot be explained by the hexagonal Sc 0.6 Fe 2 Si 4.9 -type structure. As such, the orthorhombic structure with honeycomb structure (space group 63 ( C m c m )) is plausible.
We measured the magnetic susceptibility of the AM- and F-Ce 2 Pt 6 Al 15 samples. Paramagnetic behavior was exhibited at high temperature, while antiferromagnetic-like order was observed at T * = 2.6 K in AM-Ce 2 Pt 6 Al 15 . These susceptibility behaviors are similar to those described by Radzieowski et al. [25]. The anomaly at T * is likely to be caused by the impurity Ce 2 Pt 9 Al 16 and the non-magnetic ground state of AM-Ce 2 Pt 6 Al 15 . The susceptibility behavior of F-Ce 2 Pt 6 Al 15 was quite different from that of AM-Ce 2 Pt 6 Al 15 . This difference may be due to the difference in the uniaxial effect and the deviation from stoichiometry between AM-Ce 2 Pt 6 Al 15 and F-Ce 2 Pt 6 Al 15 .

Author Contributions

Conceptualization, K.O. and Y.M.; validation, Y.W., Y.H. and F.I.; formal analysis, K.O., Y.W., Y.H., F.I. and Y.M.; investigation, K.O., Y.H. and Y.M.; resources, Y.H., T.O. and Y.M.; data curation, K.O., Y.W., Y.H., F.I. and Y.M.; writing—original draft preparation, K.O. and Y.M.; writing—review and editing, Y.W., Y.H., F.I. and T.O.; visualization, K.O. and Y.M.; supervision, Y.M.; project administration, Y.M.; funding acquisition, T.O. and Y.M. All authors have read and agreed to the published version of the manuscript.

Funding

This work was supported by the CREST (JPMJCR1861) from the Japan Science and Technology Agency (JST) and a Grant-in-Aid for Scientific Research (C) (No. 20K03857) from the Ministry of Education, Culture, Sports, Science and Technology, Japan.

Data Availability Statement

The data presented in this study are available from the corresponding author upon reasonable request.

Acknowledgments

We thank K. Tsuge for technical and analysis support of the single crystal X-ray diffraction measurement and we thank S. Yamada for technical support of EPMA. The XAFS measurements were conducted at the BL11S2 of Aichi Synchrotron Radiation Center (Proposal No. 202105059).

Conflicts of Interest

The authors declare no conflict of interest.

Abbreviations

The following abbreviations are used in this manuscript:
EPMAelectron micro-probe analysis
XASX-ray absorption spectroscopy
XAFSX-ray absorption fine structure
EXAFSextended X-ray absorption fine structure
NFLnon Fermi liquid
BSEbackscattered electron
FTFourier transform
AM-Ce 2 Pt 6 Al 15 Ce 2 Pt 6 Al 15 prepared by arc melting method
F-Ce 2 Pt 6 Al 15 Ce 2 Pt 6 Al 15 prepared by Al-flux method

References

  1. Bud’ko, S.L.; Morosan, E.; Canfield, P.C. Magnetic field induced non-Fermi-liquid behavior in YbAgGe single crystals. Phys. Rev. B 2004, 69, 014415. [Google Scholar] [CrossRef] [Green Version]
  2. Gegenwart, P.; Custers, J.; Geibel, C.; Neumaier, K.; Tayama, T.; Tenya, K.; Trovarelli, O.; Steglich, F. Magnetic-Field Induced Quantum Critical Point in YbRh2Si2. Phys. Rev. Lett. 2002, 89, 056402. [Google Scholar] [CrossRef] [PubMed] [Green Version]
  3. Custers, J.; Gegenwart, P.; Wilhelm, H.; Neumaier, K.; Tokiwa, Y.; Trovarelli, O.; Geibel, C.; Steglich, F.; Pépin, C.; Coleman, P. The break-up of heavy electrons at a quantum critical point. Nature 2003, 424, 524–527. [Google Scholar] [CrossRef] [PubMed] [Green Version]
  4. Si, Q.; Rabello, S.; Ingersent, K.; Smith, J.L. Locally critical quantum phase transitions in strongly correlated metals. Nature 2001, 413, 804–808. [Google Scholar] [CrossRef] [PubMed] [Green Version]
  5. Dönni, A.; Ehlers, G.; Maletta, H.; Fischer, P.; Kitazawa, H.; Zolliker, M. Geometrically frustrated magnetic structures of the heavy-fermion compound CePdAl studied by powder neutron diffraction. J. Phys. Condens. Matter 1996, 8, 11213–11230. [Google Scholar] [CrossRef]
  6. Kimura, N.; Ito, K.; Saitoh, K.; Umeda, Y.; Aoki, H.; Terashima, T. Pressure-induced superconductivity in noncentrosymmetric heavy-fermion CeRhSi3. Phys. Rev. Lett. 2005, 95, 247004. [Google Scholar] [CrossRef]
  7. Kasahara, Y.; Sugii, K.; Ohnishi, T.; Shimozawa, M.; Yamashita, M.; Kurita, N.; Tanaka, H.; Nasu, J.; Motome, Y.; Shibaushi, T.; et al. Unusual thermal Hall effect in a Kitaev spin liquid candidate α-RuCl3. Phys. Rev. Lett. 2018, 120, 217205. [Google Scholar] [CrossRef] [Green Version]
  8. Saito, H.; Uenishi, K.; Miura, N.; Tabata, C.; Hidaka, H.; Yanagisawa, T.; Amitsuka, H. Evidence of a new current-induced magnetoelectric effect in a toroidal magnetic ordered state of Uni4B. J. Phys. Soc. Jpn. 2018, 87, 033702. [Google Scholar] [CrossRef]
  9. Lutsyshyn, Y.; Tokaychuk, Y.; Gladyshevskii, R. Ternary compounds with Sc0.6Fe2Si4.9-type structure in the systems Sm–{Pd, Pt}–Al. Chem. Met. Alloys 2012, 5, 98–102. [Google Scholar] [CrossRef]
  10. Lutsyshyn, Y.; Tokaychuk, Y.; Gladyshevskii, R. Crystal structure of the compound Tb0.67Pt2Al5. Chem. Met. Alloys 2009, 2, 75–82. [Google Scholar] [CrossRef]
  11. Rousuli, A.; Nakamura, S.; Sato, H.; Ueda, T.; Matsumoto, Y.; Ohara, S.; Schwier, E.F.; Nagasaki, T.; Mimura, K.; Anzai, H.; et al. Photoemission study of the electronic structure of the Kondo lattices Yb2Pt6X15 (X = Al, Ga). Phys. Rev. B 2017, 96, 045117. [Google Scholar] [CrossRef]
  12. Prots, Y.; Deppe, M.; Cardoso-Gil, R.; Cervellino, A.; Ormeci, A.; Geibel, C.; Grin, Y. Yb2Al15Pt6—The most ordered variety of the Sc1.2Fe4Si9.8 aristotype. Chem. Met. Alloys 2014, 7, 85–99. [Google Scholar] [CrossRef]
  13. Niermann, J.; Jeitschko, W. Ternary Aluminides with the Ideal Composition A2Pt6Al15(A = Y, Gd-Tm, Zr). Z. Anorg. Alleg. Chem. 2004, 630, 361–368. [Google Scholar] [CrossRef]
  14. Latturner, S.E.; Kanatzidis, M.G. Gd1.33Pt3(Al,Si)8 and Gd0.67Pt2(Al,Si)5: Two Structures Containing a Disordered Gd/Al Layer Grown in Liquid Aluminum. Inorg. Chem. 2002, 41, 5479–5486. [Google Scholar] [CrossRef]
  15. Murashova, E.V.; Tursina, A.I.; Bukhan’ko, N.G.; Gribanov, A.V.; Chernyshev, I.V.; Seropegin, Y.D. Ternary compounds Ce0.67Pt2Al5 and Ce1.33Pt3Al8. J. Alloys Compd. 2005, 398, 100–105. [Google Scholar] [CrossRef]
  16. Lacerda, A.; Canfield, P.C.; Beyermann, W.P.; Hundley, M.F.; Thompson, J.D.; Sparn, G.; Fisk, Z.; Burns, C.; Barnhart, D.; Lawson, A.C.; et al. Possible heavy-fermion behavior and field-induced transitions in new R-Pt-Ga compounds. J. Alloys Compd. 1992, 181, 191–196. [Google Scholar] [CrossRef] [Green Version]
  17. Deppe, M.; Hartmann, S.; Macovei, M.E.; Oeschler, N.; Nicklas, M.; Geibel, C. Investigation of Yb2Pt6Al15 single crystals:heavy fermion system with a large local moment degeneracy. New J. Phys. 2008, 10, 093017. [Google Scholar] [CrossRef]
  18. Matsumoto, Y.; Ueda, T.; Ohara, S. Single crystal growth and heat capacity measurements of triangular lattice R2Pt6Ga15 (R = rare earth). J. Phys. Conf. Ser. 2016, 683, 012035. [Google Scholar] [CrossRef]
  19. Kwei, G.H.; Lawson, A.C.; Larson, A.C.; Morosin, B.; Larson, E.M.; Canfield, P.C. Structure of Ce2Pt6Ga15: Interplanar Disorder from the Ce2Ga3 Layers. Acta Cryst. 1996, B52, 580–585. [Google Scholar] [CrossRef]
  20. Yamashita, T.; Ohara, S. Non-Fermi liquid behavior on heavy-fermion system Ce2Pt6Ga15. J. Phys. Conf. Ser. 2012, 400, 042074. [Google Scholar] [CrossRef] [Green Version]
  21. Radzieowski, M.; Stegemann, F.; Block, T.; Stahl, J.; Johrendt, D.; Janka, O. Abrupt Europium Valence Change in Eu2Pt6Al15 around 45 K. J. Am. Chem. Soc. 2018, 140, 8950–8957. [Google Scholar] [CrossRef]
  22. Radzieowski, M.; Stegemann, F.; Hoffmann, R.-D.; Janka, O. The monoclinic superstructure of the M2Pt6Al15 series (M = Ca, Sc, Y, La, Lu). Z. Kristallogr. 2017, 232, 2050. [Google Scholar]
  23. Macaluso, R.T.; Shatruk, M.; Chai, P.; Hong, H.; Wangeline, C.; Ryan, K.; Holton, P.; Allaz, J.; Morrison, G.; Fulfer, B.; et al. Synthesis, structure, and magnetic behavior of (LaxCe1−x)1.33Pt4Ga10 (0 ≤ x ≤ 1). J. Alloys Compd. 2014, 600, 193–198. [Google Scholar] [CrossRef]
  24. Nguyen, S.D.; Ryan, K.; Chai, P.; Shatruk, M.; Xin, Y.; Chapman, K.W.; Chupas, P.J.; Fronczek, F.R.; Macaluso, R.T. Pr1.33Pt4Ga10: Superstructure and magnetism. J. Solid State Chem. 2014, 220, 9–16. [Google Scholar] [CrossRef] [Green Version]
  25. Radzieowski, M.; Stegemann, F.; Janka, O. Magnetic Properties of the RE2Pt6X15 (RE = Y, La–Nd, Sm, Gd–Lu; X = Al, Ga) Series. Eur. J. Inorg. Chem. 2020, 2020, 1199–1210. [Google Scholar] [CrossRef]
  26. Zhuravleva, M.A.; Chen, X.Z.; Wang, X.; Schultz, A.J.; Ireland, J.; Kannewurf, C.K.; Kanatzidis, M.G. X-ray and Neutron Structure Determination and Magnetic Properties of New Quaternary Phases RE0.67Ni2Ga5+nxGex and RE0.67Ni2Ga5+nxSix (n = 0, 1; RE = Y, Sm, Gd, Tb, Dy, Ho, Er, Tm) Synthesized in Liquid Ga. Chem. Mater. 2002, 14, 3066–3081. [Google Scholar] [CrossRef]
  27. Kotur, B.Y.; Bruvo, M. Crystal structure of the silicide Sc1.2Fe4Si9.8. Sov. Phys. Crystallogr. 1991, 36, 787–789. [Google Scholar]
  28. Noguchi, S.; Okuda, K.; Adachi, T.; Yoshida, T. Synthesis and characterization of new ternary silicide Er1.2Fe4Si9.8. Physica B 1997, 237, 612–615. [Google Scholar] [CrossRef]
  29. Han, M.K.; Wu, Y.Q.; Kramer, M.; Vatoves, B.; Grandjean, F.; Long, G.J.; Miller, G.J. Superstructure in RE2−xFe4Si14−y (RE = Y, Gd-Lu) Characterized by Diffraction, Electron Microscopy, and Mo1ssbauer Spectroscopy. Inorg. Chem. 2006, 45, 10503–10519. [Google Scholar] [CrossRef] [Green Version]
  30. Manni, S.; Lin, Q.; Bud’ko, S.L.; Canfield, P.C. Systematic investigation of structural, transport, magnetic and thermodynamic properties of hexagonal R2Pt6Al15 (R = Y, La-Nd, Sm-Lu) series. In Proceedings of the MAR16 Meeting of the American Physical Society, USA, 16 March 2015. [Google Scholar]
  31. Suzuki, H.; Yamamoto, R.; Onimaru, T.; Urushihara, D.; Nakamura, S.; Ohara, S. Single crystal growth and physical properties of heavy fermion Ce2P6Al15. In Proceedings of the the Autumn Meeting of the Japan Physical Society, Tokyo, Japan, 12 September 2022. 12pW541-10. [Google Scholar]
  32. Izumi, F.; Momma, K. Three-Dimensional Visualization in Powder Diffraction. Solid State Phenom. 2007, 130, 15–20. [Google Scholar] [CrossRef]
  33. Sheldrick, G.M. A short history of SHELX. Acta Cryst. A 2008, 64, 112–122. [Google Scholar] [CrossRef] [PubMed] [Green Version]
  34. Ravel, B.; Newville, M. ATHENA, ARTEMIS, HEPHAESTUS: Data analysis for X-ray absorption spectroscopy using IFEFFIT. J. Synchrotron Radiat. 2005, 12, 537–541. [Google Scholar] [CrossRef] [PubMed] [Green Version]
  35. Tursina, A.I.; Murashova, E.V.; Noël, H.; Bukhan’ko, N.G.; Seropegin, Y.D. Crystal structure and magnetic properties of the new intermetallic Ce2Pt9Al16. Intermetallics 2009, 17, 780–783. [Google Scholar] [CrossRef]
  36. Strydom, A.M. The Cage Compound Ce2Pt9Al16: A Low-Temperature Magnetic Field Study. J. Low. Temp. Phys. 2013, 170, 334–339. [Google Scholar] [CrossRef]
  37. Haen, P.; Flouquet, J.; Lapierre, F.; Lejay, P.; Remenyi, G. Metamagnetic-Like Transition in CeRu2Si2? J. Low Temp. 1987, 67, 391–419. [Google Scholar] [CrossRef]
  38. Matsumoto, Y.; Hanya, K.; Haga, Y.; Fisk, Z.; Ohara, S. Single crystal growth and physical properties of YbPd2Si2. J. Phys. Conf. Ser. 2015, 592, 012022. [Google Scholar] [CrossRef]
  39. Bonville, P.; Hammann, J.; Hodges, J.A.; Imbert, P.; Jéhanno, G.; Besnus, M.J.; Meyer, A. Hybridisation and crystal field in YbPd2Si2. Z. Phys. B 1991, 82, 267–274. [Google Scholar] [CrossRef]
Figure 1. The crystal structure of Ce 2 Pt 6 Al 15 with (a) hexagonal structure (space group 194 ( P 6 3 / m m c )) and (b) orthorhombic structure (space group 63 ( C m c m )). The Ce 2 Al 3 -layer of (c) hexagonal structure and (d) orthorhombic structure. The black lines in (c,d) indicate the unit cell. The occupancies of Ce and Al(1) sites in Ce 2 Al 3 -layer of hexagonal structure are 2/3 and 1/3, respectively, and the Ce atoms coordinate the triangular structure. The Ce atoms with orthorhombic structure coordinate the honeycomb structure.
Symmetry 15 01488 g001
Figure 2. The photograph of F-Ce 2 Pt 6 Al 15 .
Symmetry 15 01488 g002
Figure 3. (a) The backscattered electron (BSE) images, the counter map images of (b) Ce, (c) Pt, and (d) Al of AM-Ce 2 Pt 6 Al 15 . Phase 1 is impurity Ce 2 Pt 9 Al 16 phase and phase 2 is Ce 2 Pt 6 Al 15 phase.
Symmetry 15 01488 g003
Figure 4. The Rietveld plot of (a) AM-Ce 2 Pt 6 Al 15 and (b) F-Ce 2 Pt 6 Al 15 analyzed by RIETAN-FP [32]. The red dots indicate experimental data. The solid light blue line indicates calculated diffraction patterns. The vertical bars indicate calculated peak positions for Ce 2 Pt 6 Al 15 . The blue line indicates the residual error. The arrows indicate the impurity phase of (a) Ce 2 Pt 9 Al 16 and (b) Al. 2 θ around the impurity peaks were not used for Rietveld analysis.
Symmetry 15 01488 g004
Figure 5. Near neighbor atoms in the orthorhombic structure of Ce 2 Pt 6 Al 15 : Ce (a), Pt(1) (b), and Pt(2) (c).
Symmetry 15 01488 g005
Figure 6. Normalized XAFS spectra of Ce L 3 -edge of AM-Ce 2 Pt 6 Al 15 , CeF 3 , and CeO 2 .
Symmetry 15 01488 g006
Figure 7. (a) Ce L 3 -edge XAFS spectra of AM-Ce 2 Pt 6 Al 15 , (b) k 2 -weighted Ce L 3 -edge χ ( k ) spectra of AM-Ce 2 Pt 6 Al 15 , (c) corresponding χ ( k ) spectrum of AM-Ce 2 Pt 6 Al 15 , and (d) inverse FTs of the χ ( R ) spectrum. The fits of χ ( R ) and Re( χ ( q ) ) spectra using orthorhombic model are shown by green lines in (c,d). The k range used in the FTs was 3–9 Å 1 , as indicated by a blue line in (b). The R range used in the inverse FTs was 1.57–4 Å, as indicated by a blue line in (c).
Symmetry 15 01488 g007
Figure 8. (a) Pt L 3 -edge XAFS spectra of AM-Ce 2 Pt 6 Al 15 : Pt(1), (b) k 2 -weighted Pt L 3 -edge χ ( k ) spectra of AM-Ce 2 Pt 6 Al 15 : Pt(1), (c) corresponding χ ( k ) spectrum of AM-Ce 2 Pt 6 Al 15 : Pt(1), and (d) inverse FTs of the χ ( R ) spectrum. The fits of χ ( R ) and Re( χ ( q ) ) of Ce 2 Pt 6 Al 15 : Pt(1) spectra using orthorhombic model are shown by green lines in (c,d). The k range used in the FTs was 3–10 Å 1 , as indicated by a blue line in (b). The R range used in the inverse FTs was 1.23–3.49 Å, as indicated by a blue line in (c).
Symmetry 15 01488 g008
Figure 9. (a) The temperature dependence of the magnetic susceptibility of AM- and F-Ce 2 Pt 6 Al 15 . The inset shows the temperature dependence of the susceptibility of AM-Ce 2 Pt 6 Al 15 at low temperature when magnetic fields are applied μ 0 H = 0.1, 0.5, 1, 1.2, and 1.5 T. The arrows indicate the T * . (b) The temperature dependence of the inverse magnetic susceptibility of AM- and F-Ce 2 Pt 6 Al 15 .
Symmetry 15 01488 g009
Table 1. Crystallographic data and structure refinements for AM- and F-Ce 2 Pt 6 Al 15 analyzed by hexagonal Sc 0.6 Fe 2 Si 4.9 -type structure.
AM-Ce 2 Pt 6 Al 15 F-Ce 2 Pt 6 Al 15
Space group194194
Lattice constants (Å)a = 4.3127(7)a = 4.3322(4)
c = 16.5156(13)c = 16.4976(7)
Formula units per cell, Z11
Formula mass1855.501855.50
Calculated density (g cm 3 )11.58111.490
Absorption coefficient μ (mm 1 )87.80987.114
Detector distance (mm)127.40127.40
θ range (deg.)2.46–34.882.47–34.89
Range in h k l 6 h 6 5 h 6
5 k 6 6 k 6
26 l 25 26 l 25
Total number of reflections35965905
Unique reflections266267
Reliability factor R int 0.02580.0522
Goodness-of-fit1.1771.259
Reflections with I > 2 σ ( I ) 243253
Number of variables2121
R 1 0.01090.0111
w R 2 0.01460.0208
Residual electron density ( Δ ρ max / Δ ρ min e Å 3 )0.73/−1.150.78/−0.94
Table 2. Fractional coordinates, occupancy, and equivalent atomic displacement parameters U eq of AM- and F-Ce 2 Pt 6 Al 15 analyzed by hexagonal Sc 0.6 Fe 2 Si 4.9 -type structure.
AM-Ce 2 Pt 6 Al 15
Atom x y z Occupancy U eq 2 )
Ce1/32/31/40.6715(17)0.00514(13)
Pt1/32/30.60755(2)10.00495(5)
Al(1)0.5354(4)0.0709(7)1/40.337(5)0.0064(8)
Al(2)000.13147(7)1.008(6)0.0078(4)
Al(3)1/32/30.04594(7)0.993(7)0.0061(4)
F-Ce 2 Pt 6 Al 15
Atom x y z Occupancy U eq 2 )
Ce1/32/31/40.6777(19)0.00603(14)
Pt1/32/30.60727(2)10.00598(6)
Al(1)0.5349(4)0.0699(8)1/40.343(5)0.0092(8)
Al(2)000.13227(7)1.065(6)0.0098(3)
Al(3)1/32/30.04672(7)1.074(7)0.0091(4)
Table 3. Atomic parameters of Ce 2 Pt 6 Al 15 for orthorhombic structure model. The lattice parameters are a = 12.9381 Å, b = 7.4698 Å, and c = 16.5156 Å.
Atomxyz
Ce1/61/61/4
Pt(1)1/31/30.1076
Pt(2)01/30.1076
Al(1)1/61/60.0459
Al(2)1/300.1315
Al(3)0.39900.26781/4
Al(4)000.1315
Al(5)01/30.5459
Al(6)00.46461/4
Table 4. Interatomic distance and coordination number (N) of neighboring atoms around Ce, Pt(1), and Pt(2) sites for Ce 2 Pt 6 Al 15 of orthorhombic model below 4 Å.
Ce Pt(1) Pt(2)
SiteDistance (Å)NSiteDistance (Å)NSiteDistance (Å)N
Al(3)3.0981Al(2)2.5212Al(4)2.5211
Al(6)3.0991Al(4)2.5211Al(2)2.5212
Al(3)3.0991Al(1)2.5351Al(5)2.5351
Al(2)3.1674Al(3)2.5491Al(6)2.5491
Al(4)3.1672Al(1)2.6902Al(1)2.6902
Al(1)3.3702Al(5)2.6901Al(5)2.6901
Pt(1)3.4264Ce3.4262Ce3.4262
Pt(2)3.4262
Table 5. The refined structural parameters for AM-Ce 2 Pt 6 Al 15 , where N is the number of neighboring atoms, σ 2 is the Debye-Waller factor, and R is interatomic distances between Ce or Pt sites and the neighboring scatter atoms.
NeighborN σ 2 2 )R (Å)
Ce L 3 -edge1st: Al90.0123.12
2nd: Pt60.0033.41
Pt L 3 -edge1st: Al50.0052.54
2nd: Al30.0132.71
3rd: Ce20.0113.40
Disclaimer/Publisher’s Note: The statements, opinions and data contained in all publications are solely those of the individual author(s) and contributor(s) and not of MDPI and/or the editor(s). MDPI and/or the editor(s) disclaim responsibility for any injury to people or property resulting from any ideas, methods, instructions or products referred to in the content.

