Article

Evaluation of the Reduced Protocol for the Assessment of Rate of Force Development Scaling Factor

by
Života Stefanović
1,
Filip Kukić
2,3,
Olivera M. Knežević
1,
Nejc Šarabon
4,5 and
Dragan M. Mirkov
1,*
1
Faculty of Sport and Physical Education, University of Belgrade, 11030 Belgrade, Serbia
2
Police Sports Education Center, Abu Dhabi Police, Abu Dhabi 253, United Arab Emirates
3
Faculty of Physical Education and Sport, University of Banja Luka, Banja Luka 78000, Bosnia and Herzegovina
4
Faculty of Health Sciences, University of Primorska, 6310 Izola, Slovenia
5
S2P Science to Practice, Laboratory for Motor Control and Motor Behaviour, 1000 Ljubljana, Slovenia
*
Author to whom correspondence should be addressed.
Symmetry 2023, 15(8), 1590; https://doi.org/10.3390/sym15081590
Submission received: 4 July 2023 / Revised: 6 August 2023 / Accepted: 11 August 2023 / Published: 16 August 2023

Abstract

:
The rate of force development scaling factor (RFD-SF) has been used to assess neuromuscular quickness. However, the common protocols are lengthy. This study evaluated the validity and reliability of the reduced protocol to assess the RFD-SF and its validity in detecting inter-limb asymmetries. Eighteen participants (five females and thirteen males; mean age = 20.8 ± 0.6 years) performed the common and reduced RFD-SF protocols (five isometric pulse knee extensions at 30 and 70% of maximal voluntary contraction). A repeat measure design was employed including one test session of the common protocol and two test sessions of the reduced protocol. Correlation analysis was conducted to investigate the association between the two protocols, while a paired-sample t-test and a Bland–Altman plot assessed whether the reduced protocol provided valid results. The between-day reliability was assessed using an intra-class correlation coefficient, coefficient of variation, typical error of measurement, and paired-sample t-test. The validity to detect asymmetries was checked with the paired-sample t-test. The correlation between RFD-SF obtained using two protocols was significant (p < 0.001) and very large for the dominant (r = 0.71) and non-dominant (r = 0.80) legs. No significant difference occurred between protocols in the RFD-SF for the dominant (p = 0.480, d = 0.17) and non-dominant legs (p = 0.213, d = 0.31). The reliability was acceptable for both legs, with no between-day difference for the dominant (p = 0.393) and non-dominant legs (p = 0.436). No significant difference between the two protocols (p = 0.415, d = 0.19) was found in the detection of inter-limb asymmetries. The results of this study suggest that the reduced protocol could be used as a valid and reliable alternative to the common protocol, as well as to identify interlimb asymmetries.

1. Introduction

The ability to voluntarily activate muscles and generate forces allows humans to move and execute various movement tasks of different intensities and complexities [1,2], whereby the quality of movement strongly depends on one’s neuromuscular characteristics [3]. Thus, an assessment of neuromuscular characteristics is important for a general understanding of the design and function of the muscular system and the routine testing of muscular functions [1]. Neuromuscular quickness refers to the ability of the nervous system to rapidly activate and coordinate muscle contractions in response to stimuli, while influencing factors include the speed of nerve impulses, muscle responsiveness, and strength and coordination between muscle groups [4].
Neuromuscular quickness depends on the inter- and intra-muscular motor unit firing rates across different contraction intensities [5]. Therefore, they could be an indicator of not only some neuromuscular characteristics (i.e., maximal muscle force (Fmax) and rate of force development (RFDmax)), but also of muscle functionality in numerous activities, such as sudden movement perturbations in both simple and complex motor tasks [6]. In previous literature, a strong linear relationship between the Fmax and RFDmax in rapid movement was observed [7,8,9,10,11]. A few studies confirmed that the time to peak force rise is invariant, no matter the contraction intensity [12,13]. Since neuromuscular quickness depends on neural and muscular characteristics, it provides valuable information about the human ability to perform movements. However, it has been challenging for researchers to establish valid and reliable protocols.
The neuromuscular quickness of muscle contractions has recently been investigated using the rate of force development scaling factor (RFD-SF), which quantifies the aforementioned Fmax and RFDmax relationship [9,10,14,15]. In the RFD-SF protocol, the subject’s main task is to perform contractions as fast as possible at a given level and relax as fast as possible, while being encouraged to focus only on quickness and not on accuracy [9], as focusing on both tasks can reduce the quickness of force rise [16]. The protocol was initially established, including performing 25 pulse contractions at five different intensity levels (20–100% of MVC; 125 contractions in total) [9]. This protocol was later simplified by Šarabon et al. (2020) [17], who removed the highest intensity level, thus estimating the RFD-SF using 100 contractions. However, Smajla et al. (2021) [7] recently proposed an even simpler testing protocol that consists of nine contractions at each of the four intensity levels (20–80% of MVC). Although Bellumori et al. (2011) [9] suggested that 125 contractions provide a good reliability, more recent studies showed that valid and reliable data could be obtained using as little as 36 contractions [7].
Considering different muscle groups, Djordjevic and Uygur (2018) [10] reported a good absolute (SEM = 4.9–6.5%) reliability, while Mathern et al. (2019) [11] reported an acceptable relative between-session reliability (ICC = 0.66–0.85). Even though the linearity of the Fmax and RFDmax relationship is higher when the numbers of contractions and levels increase, Šarabon et al. [17] proposed a protocol containing 90 contractions distributed across three intensity levels (20%, 40%, and 60% of MVC) to reduce the time and avoid fatigue. Their results showed that an adapted protocol with three levels is a valid tool for assessing the RFD-SF in a population with knee pain. Still, they did not investigate the between-session reliability. Therefore, reducing the protocol complexity further demands evaluating its reliability of obtaining data on one’s neuromuscular quickness.
Leg asymmetries (i.e., the between-leg difference in size, strength, and/or neuromuscular quickness) could significantly affect the outcomes of muscle capacity testing, especially in sports and rehabilitation settings [18,19], whereby a difference of 15% has been considered as an injury risk factor [20]. Studies have shown that asymmetries can increase the risk of injuries, alter movement patterns, and worsen sports performances [21,22]. Therefore, the accurate and reliable measurement of leg asymmetries is crucial in clinical and research settings. Testing methods usually include a single-leg hop test, isokinetic strength test, isometric mid-thigh pull test, and force plate analysis [23,24,25], with recent papers including the RFD-SF for assessing inter-limb asymmetries [26,27]. By addressing asymmetries in muscle capacity, individuals can improve their movement patterns, reduce the risk of injury, and improve their athletic performance [28].
Due to everything stated, the current study proposes a reduced protocol with two levels for more time-efficient testing. Therefore, the first aim of this study was to explore the validity of the reduced protocol with respect to the common RFD-SF protocol, while the second aim was to evaluate the between-day reliability of the reduced RFD-SF protocol. The third aim was to assess and compare interlimb asymmetries obtained using the two protocols. Based on the previous findings regarding the RFD-SF protocols, the first hypothesis was that the reduced protocol is more valid (i.e., provides a similar RFD-SF value) than the common protocol is. The second hypothesis was that the reduced protocol has an acceptable between-day reliability. Finally, we confirmed the validity of reduced protocol in detecting inter-limb asymmetries.

2. Materials and Methods

2.1. Experimental Approach to the Problem

This study was designed to examine the validity and between-day reliability of the reduced RFD-SF protocol for the assessment of neuromuscular quickness, as well as to estimate the sensitivity of the common and reduced protocols to identify interlimb asymmetries in the muscle function of knee extensors. The study employed a repeated measure design where the participants completed three testing sessions separated by 48 h. In each session, they first performed MVC, followed by the RFD-SF protocol, with the only difference being that in the first session, they performed the common RFD-SF protocol, while in the second and third sessions, they performed the reduced RFD-SF protocol. The dominant leg (preferred kicking leg) was always tested first.

2.2. Participants

Eighteen physically active participants 20.8 ± 0.6 years of age were studied (five females and thirteen males). Their main characteristics were: body mass = 62.0 ± 5.8 kg and body height = 173 ± 6 cm for females, and body mass = 76.6 ± 10.7 kg and height = 181 ± 6 cm for males. All participants had at least one year of lower body resistance training experience and were actively involved in resistance training (3–5 sessions per week) at the time of the testing. The inclusion criteria were as follows: no previous history of musculoskeletal injury or pain in the lower extremity at least six months prior to participation and no use of any medication that may affect neuromuscular function. The testing procedure and aims of the study were explained to the participants in detail. All participants signed the informed consent. The Institutional Review Board approved the study (02-1854/21-1). The study protocol was designed in accordance with the Declaration of Helsinki.

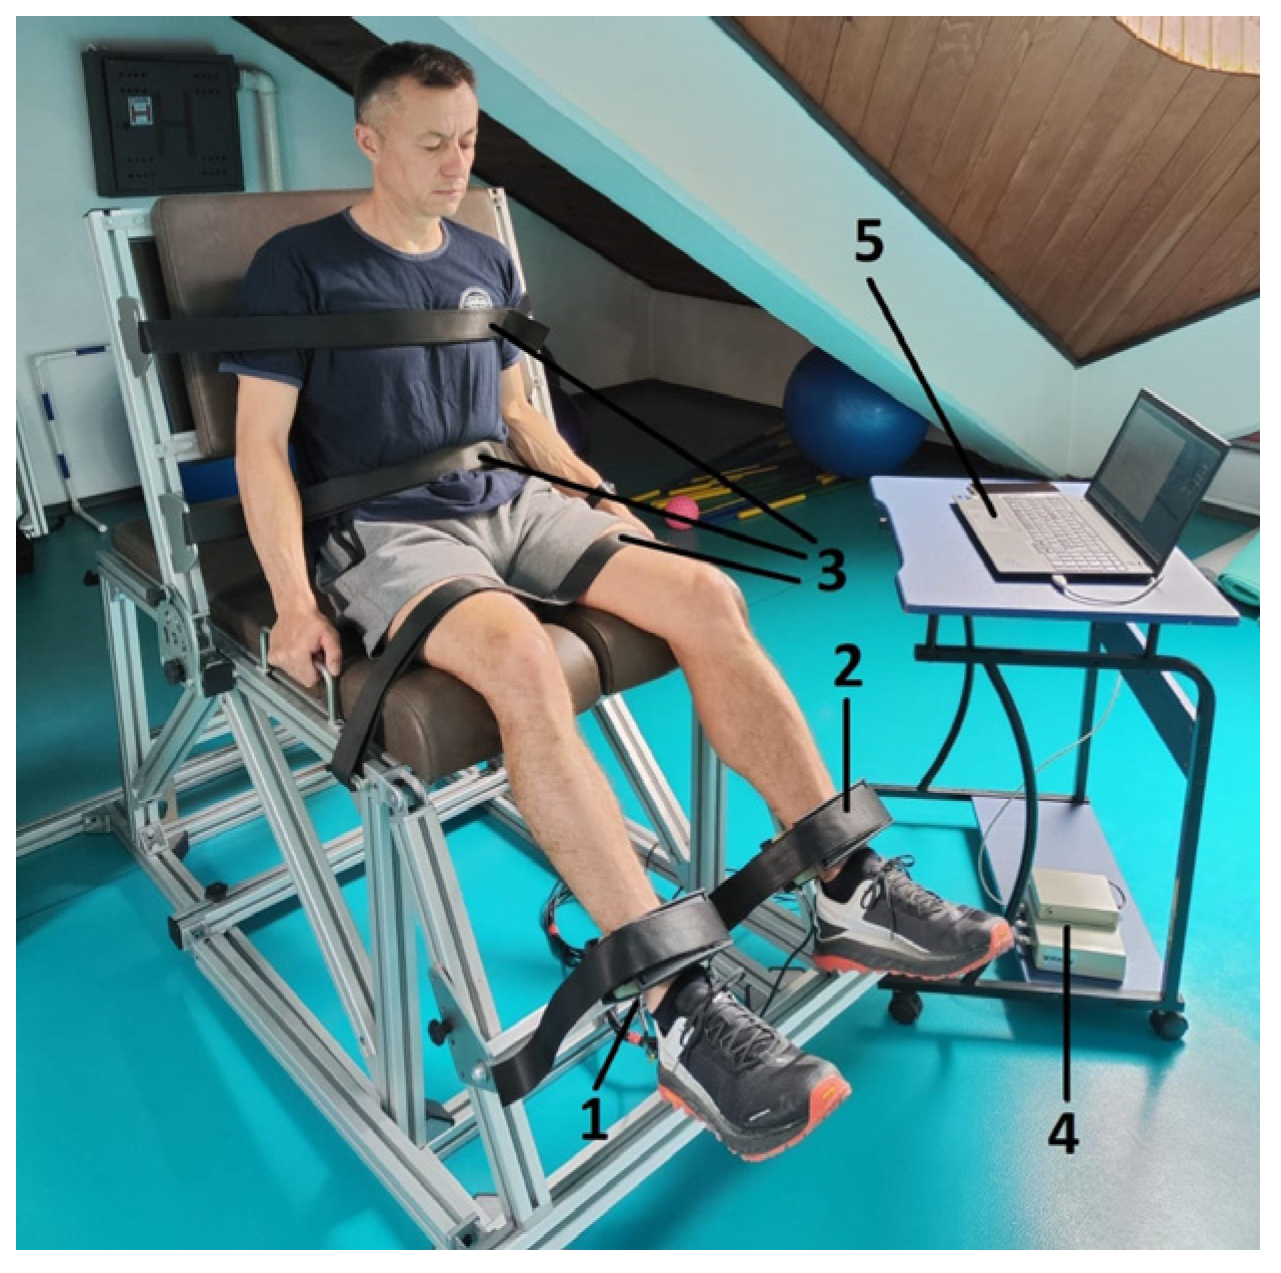
2.3. Setup and Familiarization

A custom-made chair was used to assess the Fmax and RFDmax of the quadriceps muscles. The participants were placed in a chair with their hips and knee angles set at 100° and 120°, respectively (full extension corresponding to 180°). The force transducer was connected to the lower leg via shanks that were wrapped around the leg 2 cm above the lateral malleolus. Their knees, hips, and chests were tightly fixed to the chair via rigid Velcro straps. Computer screen was placed in front of the participant to obtain visual feedback (Figure 1).
Once positioned in the chair, each participant was familiarized with the protocol by performing three contractions at four, gradually increasing, self-selected, submaximal efforts. After three minutes of rest, to assess their Fmax, the participants performed three MVCs lasting 4–5 s, with a one-minute between-trial rest interval. They were instructed to increase their force as much and as quickly as possible and maintain the maximal force for three seconds [29], from which peak force was determined. After the Fmax assessment, the participants rested for 10 min, and then they performed four bouts of five quick submaximal contractions (pulse contractions); each bout had a different intensity level. The instruction was to produce force and immediately relax as fast as possible.

2.4. The Common and Reduced RFD-SF Protocol

To assess neuromuscular quickness, the participants performed a common RFD-SF protocol in the first session with their dominant and non-dominant legs; there were four sets with each leg [9]. Each set consisted of five contraction bouts performed at four intensity levels (20%, 40%, 60%, and 80% of Fmax). The participants were instructed to focus on the explosiveness of the contraction rather than trying to match the force level [16]. The between-contraction rest duration was 3 s. The contraction frequency was controlled using a metronome so the participants could easily pace and control their contractions. The intensities were performed in a randomized order. The rest duration between sets was 60 s. The total number of contractions was ~100, and incorrectly performed contractions (e.g., slow contraction, pre-tension, and poor relaxation) were repeated. The intensity levels were calculated based on the individual Fmax of each participant.
In the second and third sessions, the participants performed a reduced “two-point” RFD-SF protocol, which included two five-contraction bouts performed at only two intensity levels, 30% and 70% of the Fmax. Therefore, the participants performed twice the lower number of contractions, including those performed incorrectly. Visual feedback for a contractions was presented on a computer screen in front of participants, with the force level presented as a horizontal line.

2.5. Data Acquisition and Analysis

Signals from a force transducer (CZL302: Dongguan City, China) were collected using the commercially available software Isometrics (“Sports Medical Solutions”, Belgrade, Serbia), with a 1000 Hz sampling rate. Signals were filtered with a low pass (5 Hz), second-order Butterworth filter. The software automatically calculated the Fmax (peak value on the force–time trace after reaching the plateau) and RFDmax (peak of first derivative of the force–time signal) [11]. The RFD-SF was computed as a slope (b) of the linear regression (Y = a + bX) of Fmax and RFDmax [9]. The coefficient of determination (R2) in the regression analysis reflects the strength of this regression (linearity of Fmax and RFDmax relationship). The RFD-SF for both the dominant and non-dominant legs as well as the dominant-to-non-dominant leg ratio (i.e., interlimb asymmetry) were used for further analysis. Interlimb asymmetry was calculated using the equation (RFD-SF of the dominant leg/RFD-SF of the non-dominant leg) − 1) × 100 [27]. An interlimb difference of >15% was used as a criterion to identify interlimb asymmetry [20].

2.6. Statistical Analysis

Statistical analysis was performed using SPSS (IBM SPSS v26.0 Chicago, IL, USA) and JASP (v0.16.13, University of Amsterdam, Amsterdam, Netherlands). Descriptive statistics of the dependent variables are presented as means, standard deviations, and standard error of the mean. The Shapiro–Wilk test tested the normality of data distribution, and all data were normally distributed. For all analyses, the statistical significance was set at p < 0.05.
Pearson’s correlation (r) was calculated to describe associations between the RFD-SF values obtained using the common and reduced protocols. The strength of correlation was defined as 0–0.19: trivial; 0.10–0.29: small; 0.30–0.49: moderate; 0.50–0.69: large; 0.70–0.89: very large; 0.90–0.99: nearly perfect; or 1: perfect [30]. A paired samples t-test was used to assess the between-protocol difference in the RFD-SF. Initially, G*Power (v3.1.9.4) was used to assess the minimum effect size required for the sample size employed in this study [31]. Accordingly, the effect size required for the difference between the two protocols to be considered as significant was set to 0.85, while the critical t was set to 2.09 for p < 0.05. Cohen’s effect size (d) was used to quantify the differences as d < 0.2 (trivial or no effect), d = 0.2–0.5 (small), d = 0.5–0.8 (moderate), d = 0.8–1.3 (large), or d > 1.3 (very large) [32]. The Bland–Altman plot was used to evaluate the agreement between the two protocols.
Intra-class correlation coefficients (ICC3,1) and the coefficient of variation (CV%) were used for the evaluation of consecutive pairwise reliability, with benchmarks for “good” reliability set at ICC > 0.75 and CV < 15% [33]. The typical error of measurement was calculated according to Hopkins [34] to explain the extent to which results of repeated measures are close to each other. The paired samples t-test was used to assess the between-day difference in the RFD-SF.
Finally, the validity of detecting the interlimb asymmetries was checked in a paired sample t-test.

3. Results

The coefficient of determination (R2) showed a nearly perfect mean association between the Fmax and RFDmax for both the dominant (R2 = 0.95 and 0.98 for common and reduced protocols, respectively) and non-dominant legs (R2 = 0.94 and 0.98, for common and reduced protocols, respectively). The minimum associations were very large in both legs (95% confidence interval range from 0.85 to 0.99). The distributions of associations are presented in Figure 2. The narrower distributions of associations were observed in the reduced protocol for both legs.

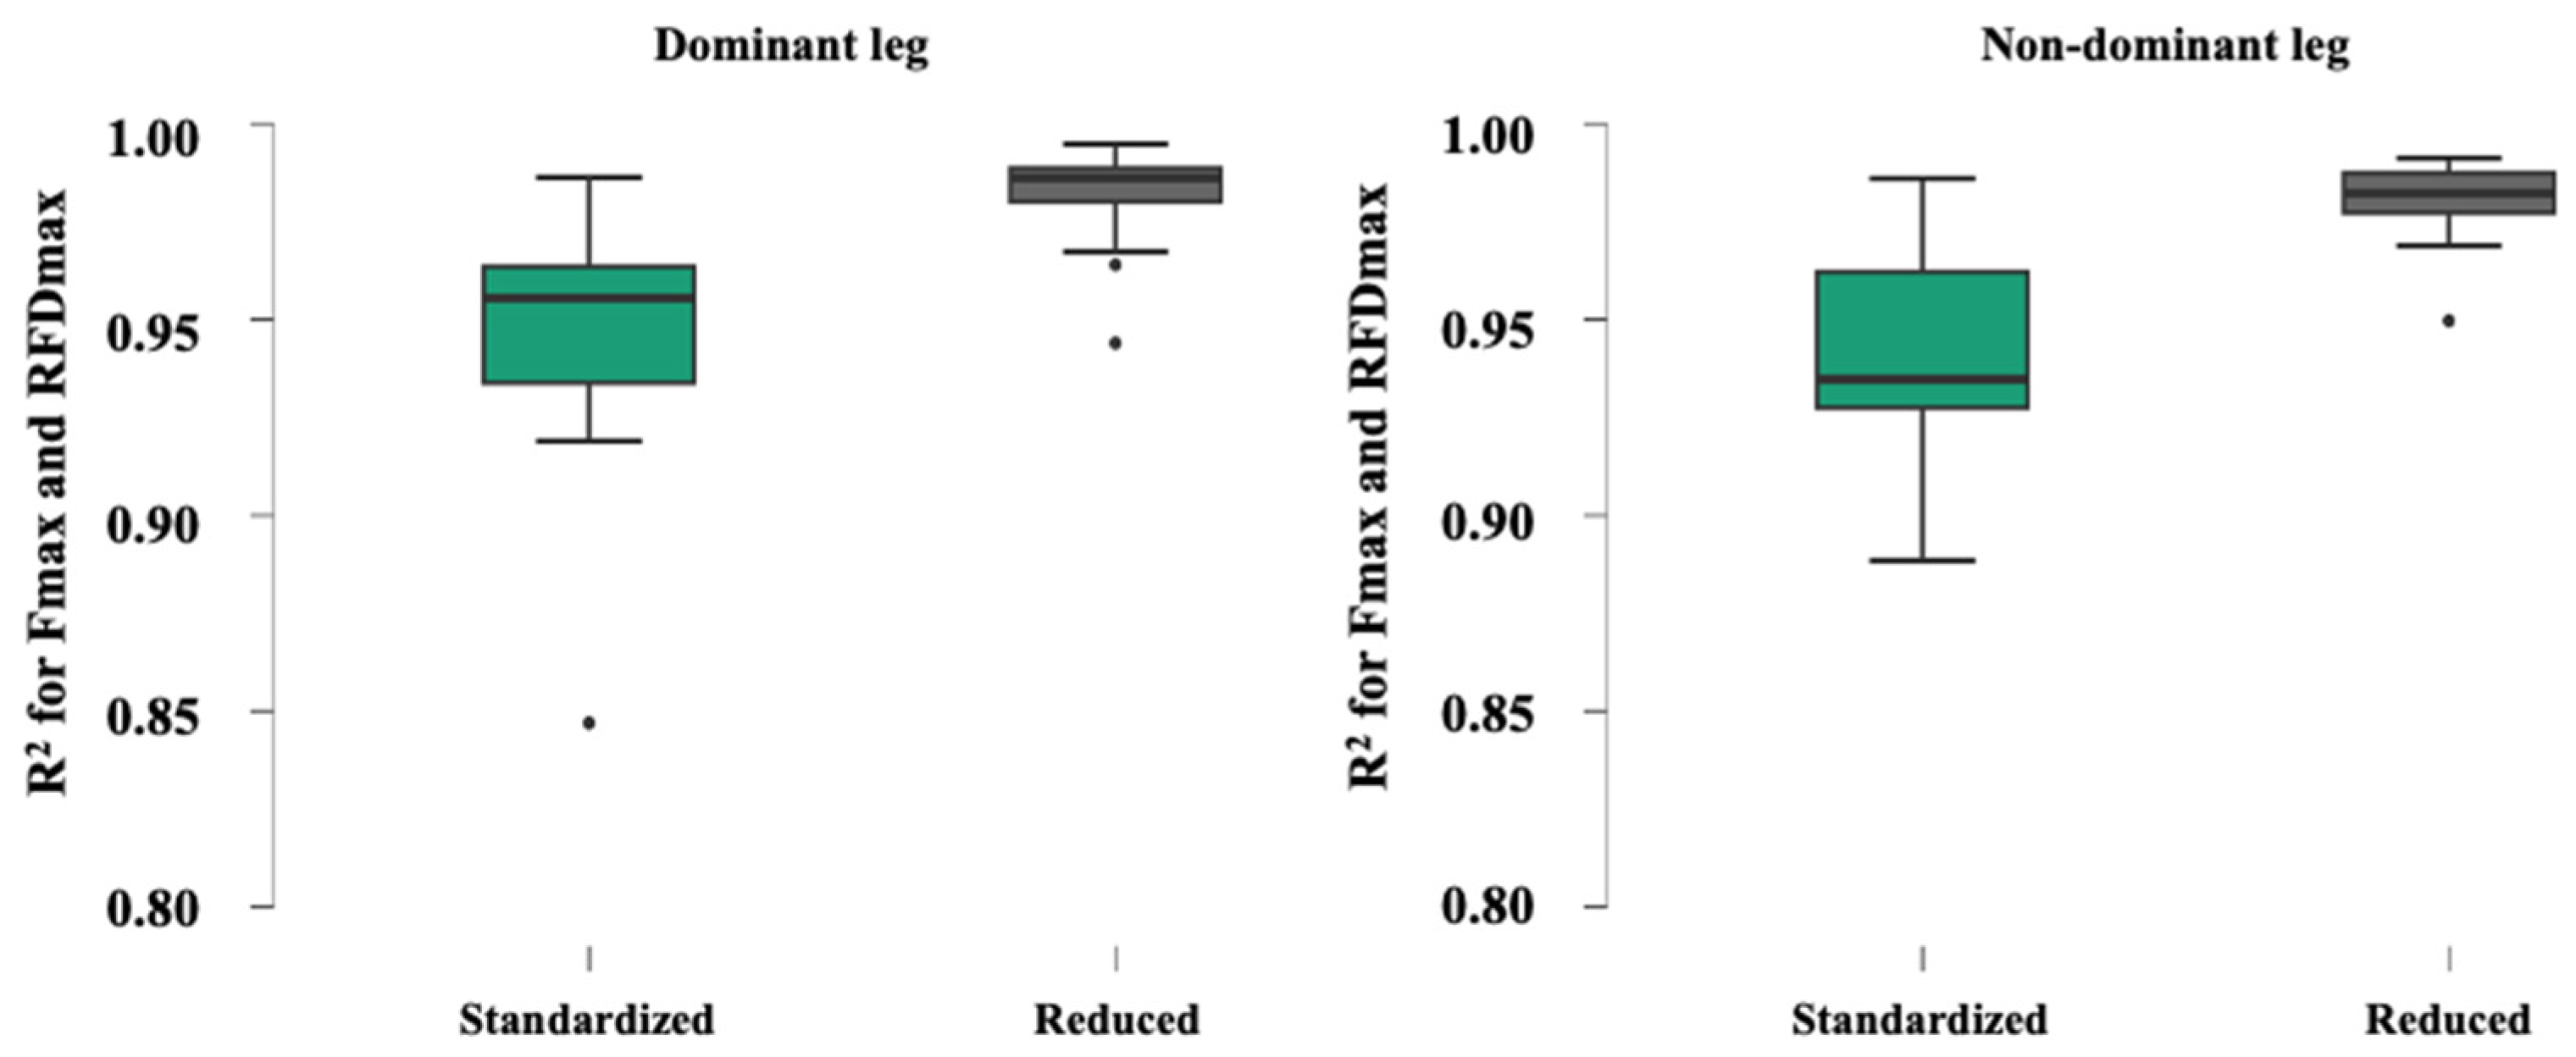
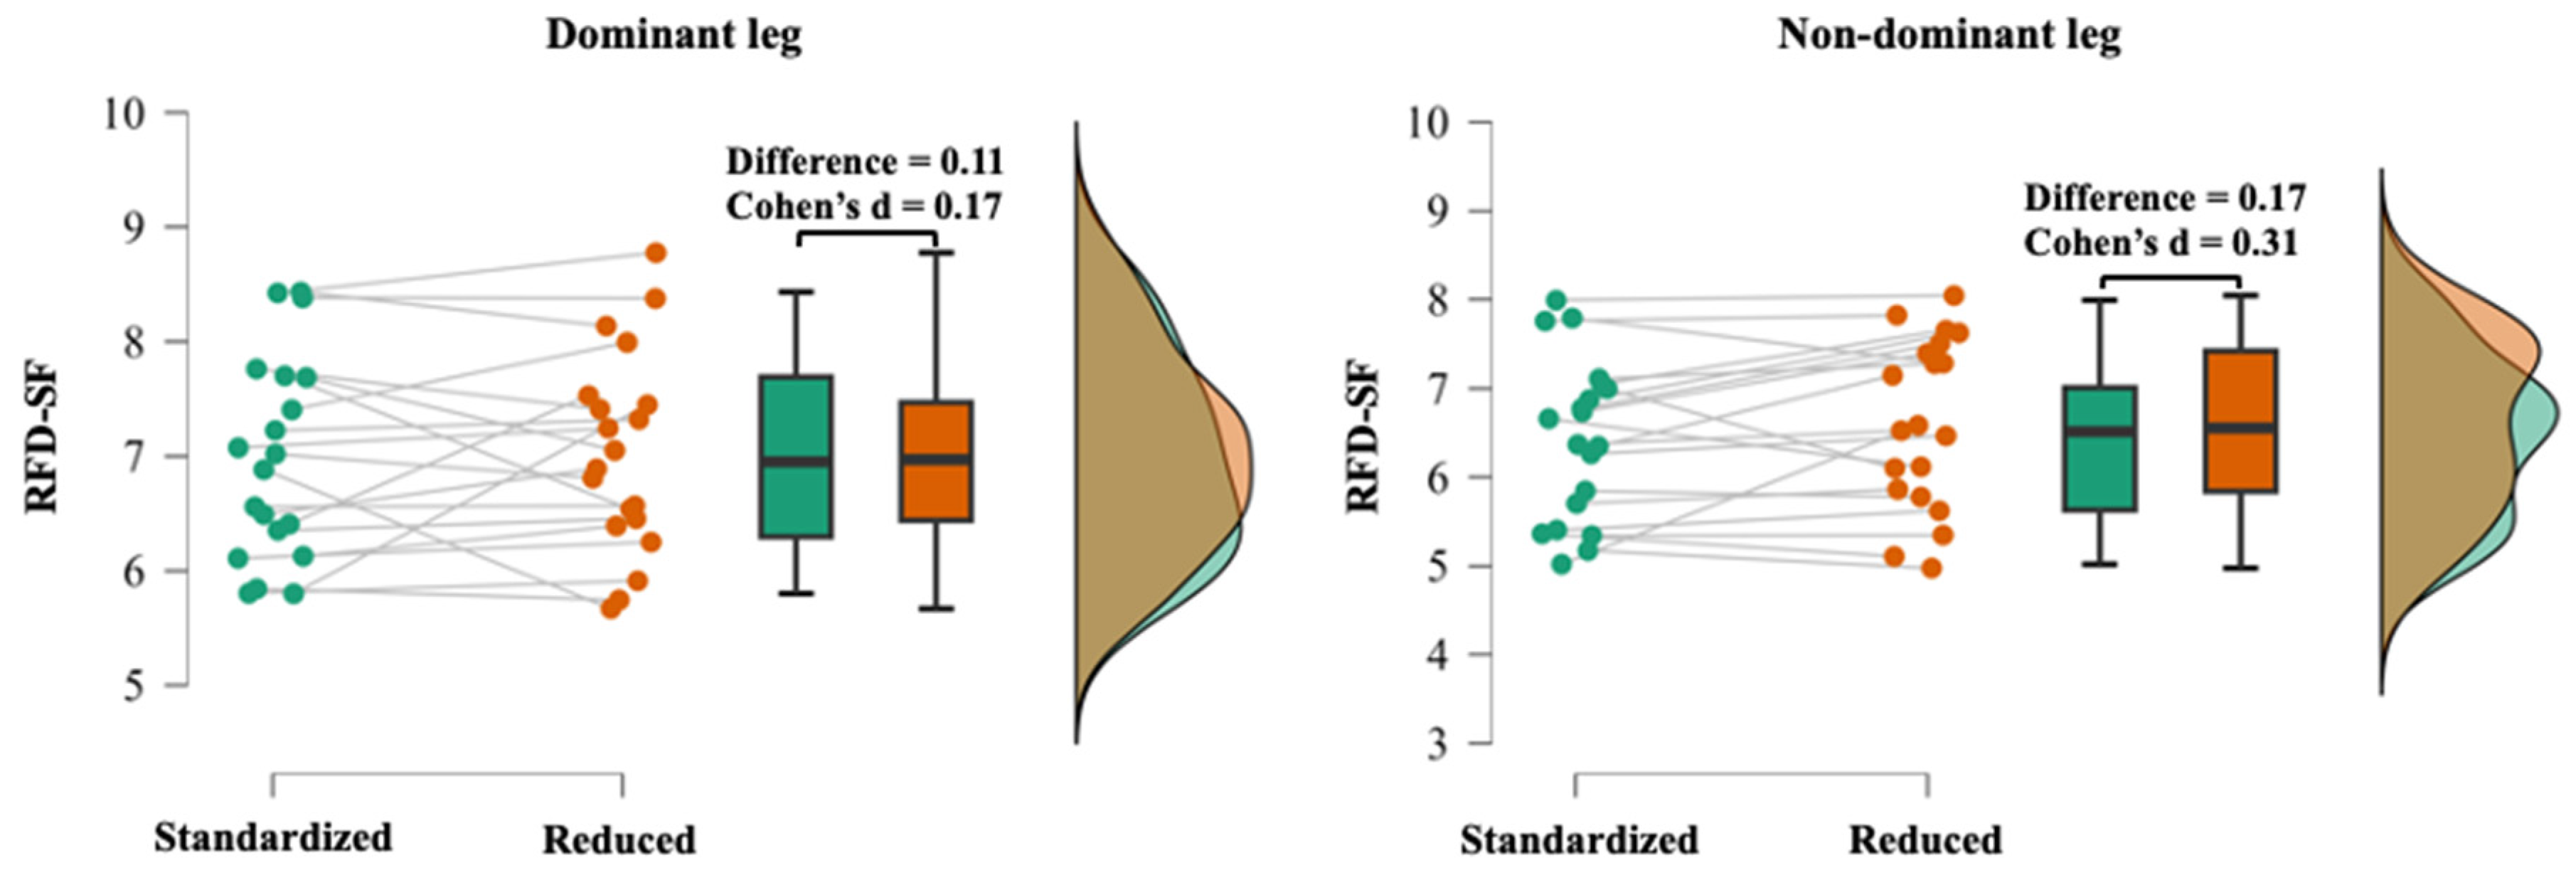
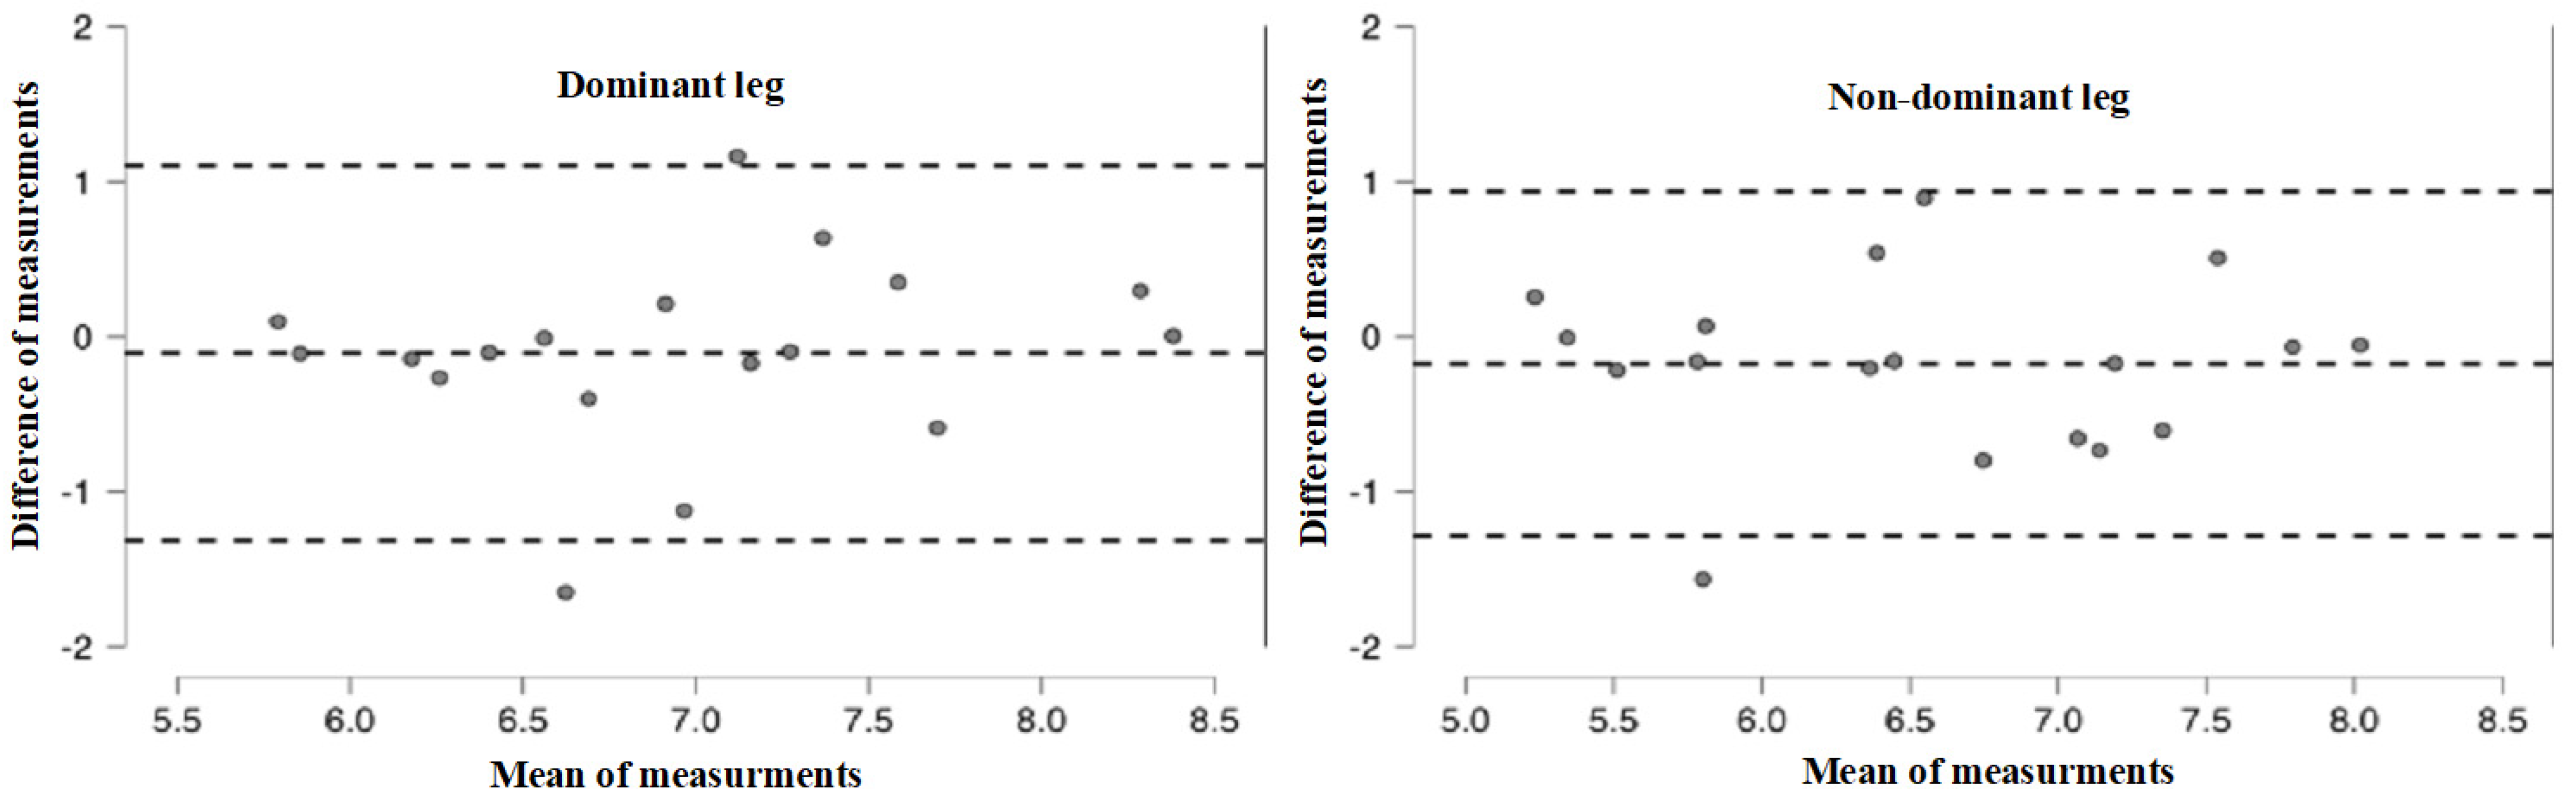
3.1. Validity Results

Descriptive statistics for the RFD-SF slope and the correlation coefficient between the two protocols are presented in Table 1. The correlation between the RFD-SF obtained in the common and reduced protocols was very large (p < 0.001) for both the dominant and non-dominant legs. The mean values obtained in the common and reduced protocols were similar (Figure 3), with no significant difference between the protocols for the dominant (t = −0.722, p = 0.480) and non-dominant legs (t = −1.295, p = 0.213).
The Bland–Altman plot (Figure 4) revealed that the most of participants provided RFD-SF values within the limits of agreement. Two participants were out of the limits of agreement with their dominant leg, and one participant was out of this range with their non-dominant leg.

3.2. Reliability Results

Measures of between-day reliability for the data obtained in the reduced protocol are presented in Table 2. The indices of absolute and relative reliability were acceptable for the dominant and non-dominant legs. The CV% was good, and the typical error of measurement was low for both legs. The paired sample t-test revealed no between-day difference for the dominant (t = −0.875, p = 0.393) and non-dominant legs (t = −0.796, p = 0.436).

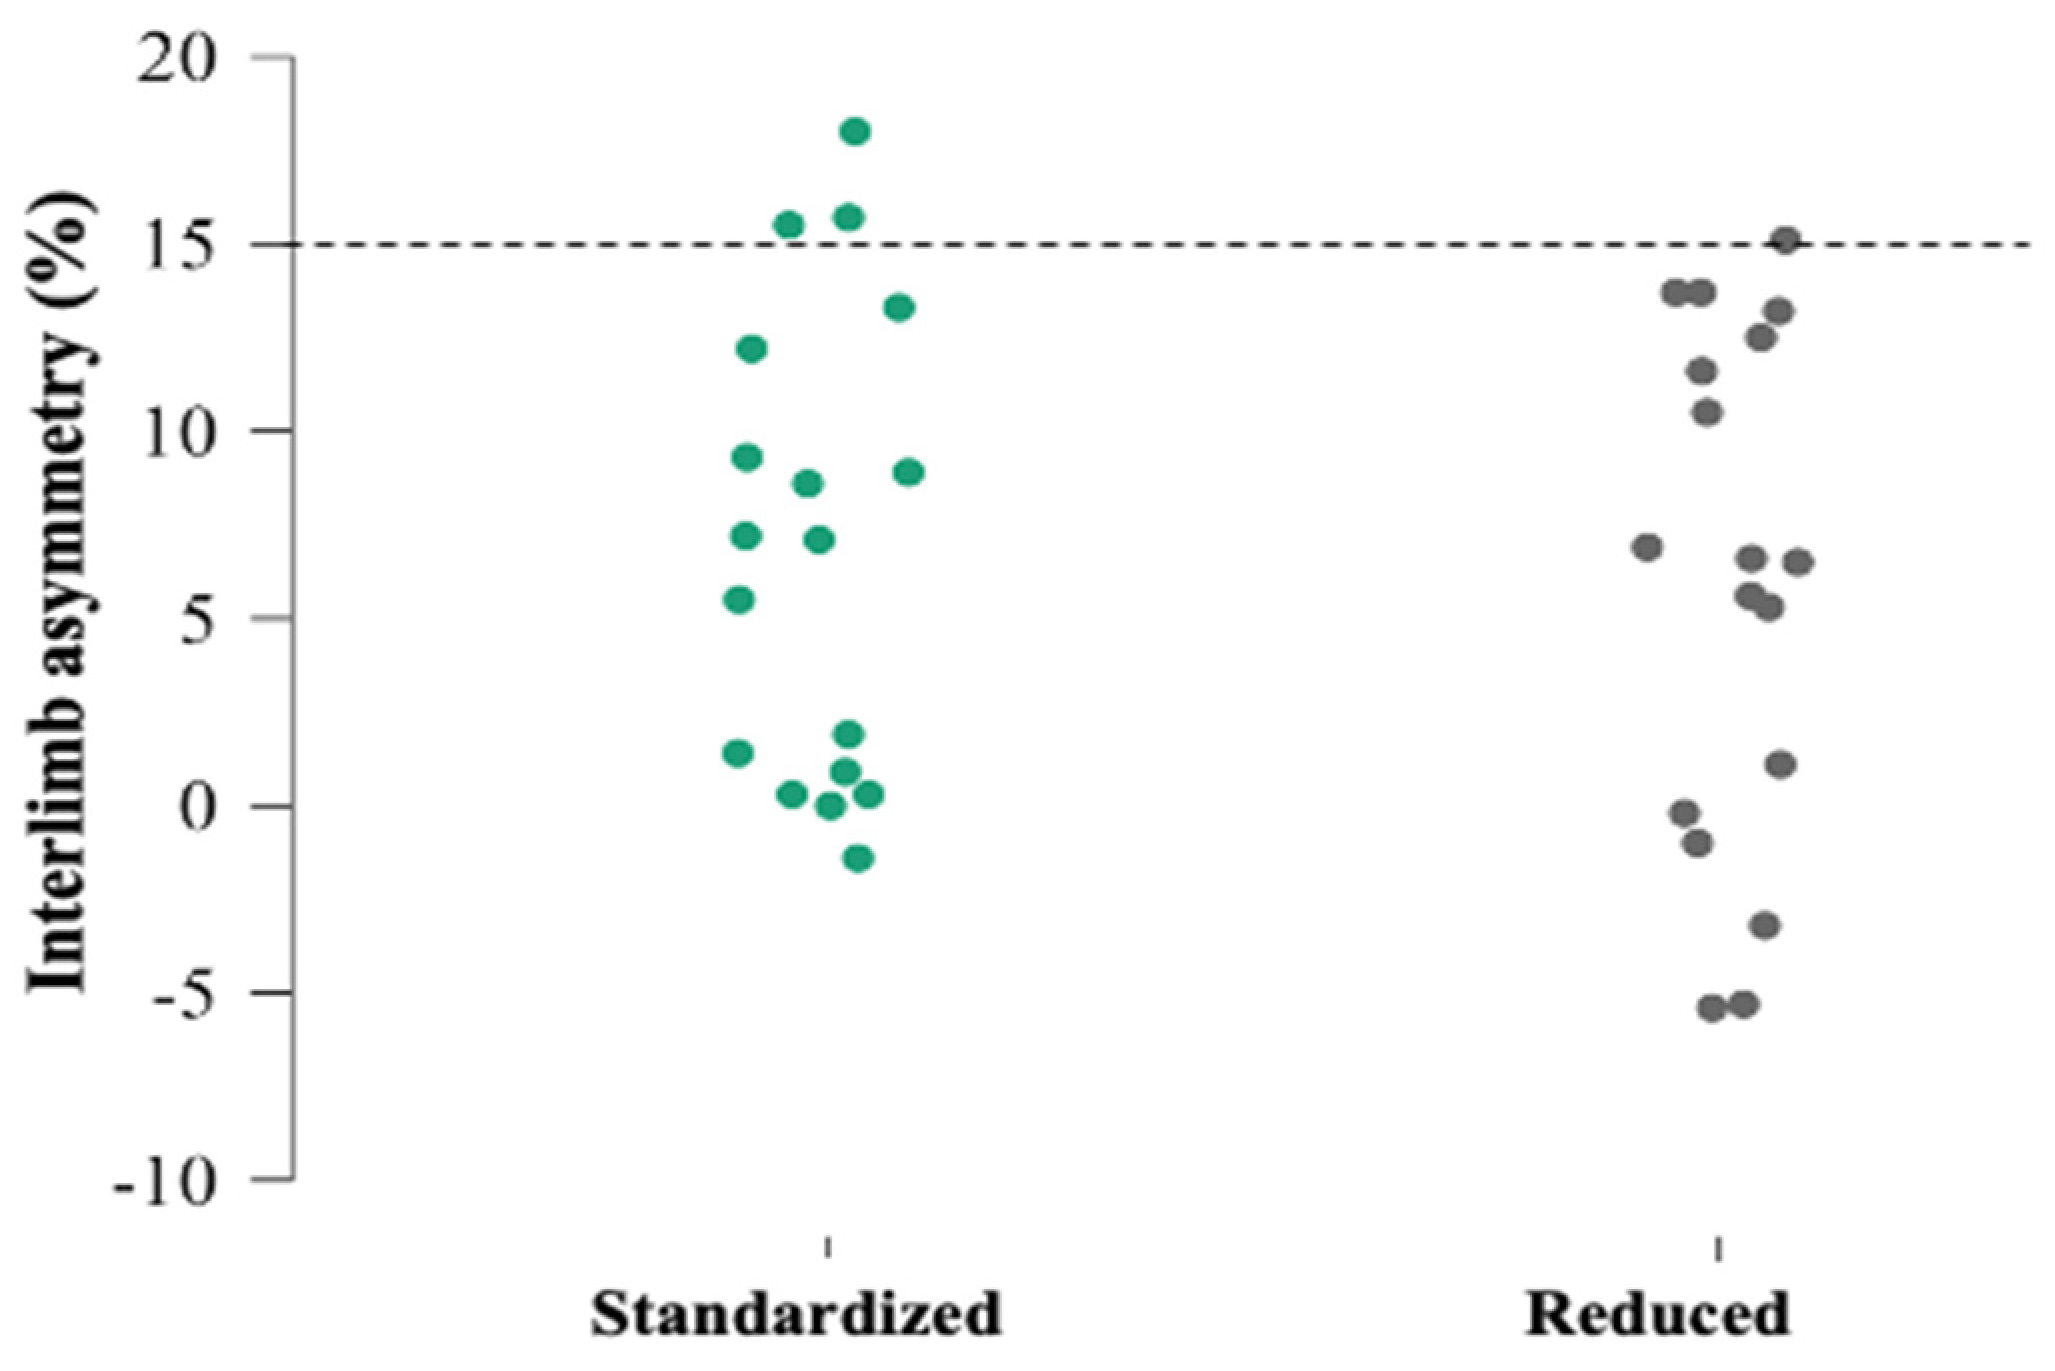
3.3. Asymmetry Results

Regarding interlimb asymmetries, there was no significant difference between the two protocols (t = 0.835; p = 0.415; d = 0.19), with a mean difference of 0.97 and a 95% confidence interval of −1.49–3.43. The asymmetries obtained in both protocols are shown in Figure 5. Three participants showed an asymmetry larger than 15% when the common protocol was used, and one showed an asymmetry of over 15% when the reduced protocol was used.

4. Discussion

This study was designed to explore the validity and between-day reliability of the reduced protocol for assessing the RFD-SF and the possibility of identifying interlimb asymmetries when compared to that of the common protocol. The main findings related to our hypotheses were as follows: (1) the association between the RFD-SF values obtained using the common and reduced protocols was very large for the dominant and non-dominant legs, and there was no difference between them (a confirmed hypothesis); (2) between-day reliability of the reduced protocol was acceptable for both legs (a confirmed hypothesis); and (3) there was no difference in the interlimb asymmetries between the two protocols.

4.1. Validity of Reduced RFD-SF Protocol

The validity of the reduced protocol with respect to the common protocol for RFD-SF assessment has been confirmed with this study. Although the first studies that investigated the RFD-SF protocol proposed using five, and then four intensity levels [9,35], the latest studies conducted by Šarabon et al. and Smajla et al. [7,17] confirmed that neuromuscular quickness could be assessed using fewer intensity levels. The findings from the current study are in line with those of Šarabon et al. [7] and Smajla et al. [7,17] who proposed protocols with three different levels (20–60% of Fmax) and fewer contractions (36 contractions), respectively. Therefore, this study suggests that the RFD-SF could be assessed in a valid manner using only two intensity levels. Reducing the protocol to only two intensities provide a positive step towards the broader and more frequent implementation of RFD-SF assessment beyond research and university settings.

4.2. Reliability of Reduced RFD-SF Protocol

Our second hypothesis was related to the evaluation of the between-day reliability of the reduced protocol. The obtained indices of absolute and relative reliability indicate the very good day-to-day reliability of the proposed protocol, suggesting its ability to be utilized in repeated measurements with the same participants. Although this study is the first to explore the reliability of the RFD-SF protocol with a reduced number of intensities, the obtained findings are at least in line, if not better, than in some of the previously published papers. Specifically, in most studies where four or five intensity levels and ~100 contractions were utilized, the reliability parameters were good to very large (ICC = 0.64–0.92), with an acceptable coefficient of variation (CV < 15%) [9,10,11,36]. In the current study, the reliability remained good for both legs despite the number of contractions and levels being reduced by half. Interestingly, our findings appear to have a better relative reliability than those of Bellumori et al. [9] who used ~50 contractions (ICC > 0.7). Moreover, our protocol showed similar reliability to that (ICC > 0.77, CV < 10%) reported by Šarabon et al. [17], who omitted the higher intensity level, and somewhat lower than the reliability (ICC ≥ 0.95, CV < 5%) reported by Smajla et al. [7], who applied nine contractions per level. Our results suggest that the RFD-SF protocol can provide reliable data even when using only two contraction intensities.

4.3. Interlimb Asymmetries

No differences were found in interlimb asymmetries when the common and reduced protocols were compared. Our findings related to asymmetry are in line with previous research by Smajla et al. [27] who reported that the RFD-SF protocol with 20–25 rapid contractions for each of the four intensity levels (20%, 40%, 60%, and 80% of previously measured maximal isometric torque) could be a valuable tool for the identification of interlimb asymmetries. Similar to the findings of Mirkov et al. [37], Smajla et al. [27] confirmed that measures other than the Fmax and RFDmax (i.e., interval RFD or RFD-SF) could be more sensitive in identifying individuals with asymmetries in capacities for rapid force rise. Considering this, our results suggest that the reduced protocol provides a valid assessment of inter-limb asymmetries. This is of great importance for clinical and sport settings, as asymmetries represent important information for practitioners in these fields, especially considering that the protocol does not require maximal effort.

4.4. Limitations

It is important to acknowledge the limitations of this study. The study sample included a narrow age span; all participants were healthy, with no injuries, and at a similar training level. However, the obtained validity, reliability, and sensitivity of this homogenous sample suggest the good representation of neuromechanical characteristics of human muscle, whereby a more diverse sample may show even better metrics of our protocol. Additionally, applied levels were set, whereas they could have been self-selected. Finally, the order of the protocols has not been randomized. Therefore, future studies should take that into account as well.

5. Conclusions

The results of this study suggest that the reduced protocol could be used as a valid and reliable alternative to the common protocol, representing a more efficient and cost-effective method to assess neuromuscular quickness. Moreover, it could be used to identify interlimb asymmetries. In practical applications, this could be beneficial in settings such as clinical fields and sports performance, where time and resources are limited, while quick and accurate measurements are necessary. The reduced protocol is relatively short, non-fatiguing, and submaximal in intensity, which makes it safe and comfortable for a wide range of subjects. Future studies should further investigate sensitivity, including other populations and cut-off values for normal, pre-clinical, and clinical cases.

Author Contributions

Conceptualization, D.M.M. and O.M.K.; methodology, D.M.M., O.M.K. and N.Š.; software, D.M.M.; validation, Ž.S. and F.K.; formal analysis, Ž.S. and F.K.; investigation, Ž.S.; resources, D.M.M., O.M.K. and Ž.S.; data curation, Ž.S.; writing—original draft preparation, Ž.S. and F.K.; writing—review and editing, D.M.M., O.M.K. and N.Š.; visualization, Ž.S. and F.K.; supervision, D.M.M. and O.M.K.; project administration, D.M.M. and O.M.K.; funding acquisition, N/A. All authors have read and agreed to the published version of the manuscript.

Funding

This research received no external funding.

Data Availability Statement

Data are available upon reasonable request from [email protected].

Acknowledgments

This study was partially supported by the grant from the Ministry of Education, Science and Technological Development of the Republic of Serbia (contract number 451-03-47/2023-01/200154).

Conflicts of Interest

The authors declare no conflict of interest.

References

  1. Jaric, S. Force-Velocity Relationship of Muscles Performing Multi-Joint Maximum Performance Tasks. Int. J. Sport. Med. 2015, 36, 699–704. [Google Scholar] [CrossRef] [PubMed]
  2. McMahon, T.A. Muscles, Reflexes, and Locomotion BT-Reflexes and Motor Control. Reflexes Mot. Control 1984, 331, 90018-1. [Google Scholar]
  3. Cormie, P.; McGuigan, M.R.; Newton, R.U. Developing Maximal Neuromuscular Power. Sport. Med. 2012, 41, 17–38. [Google Scholar] [CrossRef]
  4. Haberland, K.; Uygur, M. Simultaneous Assessment of Hand Function and Neuromuscular Quickness through a Static Object Manipulation Task in Healthy Adults. Exp. Brain Res. 2016, 235, 321–329. [Google Scholar] [CrossRef]
  5. Joachim Büdingen, H.; Freund, H.J. The Relationship between the Rate of Rise of Isometric Tension and Motor Unit Recruitment in a Human Forearm Muscle. Pflugers Arch. 1976, 362, 61–67. [Google Scholar] [CrossRef]
  6. Bellumori, M.; Jaric, S.; Knight, C.A. Age-Related Decline in the Rate of Force Development Scaling Factor. Mot. Control 2013, 17, 370–381. [Google Scholar] [CrossRef]
  7. Smajla, D.; Žitnik, J.; Šarabon, N. Advancements in the Protocol for Rate of Force Development/Relaxation Scaling Factor Evaluation. Front. Hum. Neurosci. 2021, 15, 159. [Google Scholar] [CrossRef] [PubMed]
  8. Smajla, D.; Žitnik, J.; Šarabon, N. Quantification of Inter-Limb Symmetries with Rate of Force Development and Relaxation Scaling Factor. Front. Physiol. 2021, 12, 871. [Google Scholar] [CrossRef]
  9. Bellumori, M.; Jaric, S.; Knight, C.A. The Rate of Force Development Scaling Factor (RFD-SF): Protocol, Reliability, and Muscle Comparisons. Exp. Brain Res. 2011, 212, 359–369. [Google Scholar] [CrossRef]
  10. Djordjevic, D.; Uygur, M. Methodological Considerations in the Calculation of the Rate of Force Development Scaling Factor. Physiol. Meas. 2018, 39, 015001. [Google Scholar] [CrossRef]
  11. Mathern, R.M.; Anhorn, M.; Uygur, M. A Novel Method to Assess Rate of Force Relaxation: Reliability and Comparisons with Rate of Force Development across Various Muscles. Eur. J. Appl. Physiol. 2019, 119, 291–300. [Google Scholar] [CrossRef] [PubMed]
  12. Wierzbicka, M.M.; Wiegner, A.W.; Logigian, E.L.; Young, R.R. Abnormal Most-Rapid Isometric Contractions in Patients with Parkinson’s Disease. J. Neurol. Neurosurg. Psychiatry 1991, 54, 210–216. [Google Scholar] [CrossRef]
  13. Freund, H.J.; Büdingen, H.J. The Relationship between Speed and Amplitude of the Fastest Voluntary Contractions of Human Arm Muscles. Exp. Brain Res. 1978, 31, 1–12. [Google Scholar] [CrossRef] [PubMed]
  14. Brustio, P.R.; Casale, R.; Buttacchio, G.; Calabrese, M.; Bruzzone, M.; Rainoldi, A.; Boccia, G. Relevance of Evaluating the Rate of Torque Development in Ballistic Contractions of Submaximal Amplitude. Physiol. Meas. 2019, 40, 025002. [Google Scholar] [CrossRef]
  15. Uygur, M.; de Freitas, P.B.; Barone, D.A. Rate of Force Development and Relaxation Scaling Factors Are Highly Sensitive to Detect Upper Extremity Motor Impairments in Multiple Sclerosis. J. Neurol. Sci. 2020, 408, 116500. [Google Scholar] [CrossRef] [PubMed]
  16. Gordon, J.; Ghez, C. Trajectory Control in Targeted Force Impulses II. Pulse Height Control. Exp. Brain Res. 1987, 67, 241–252. [Google Scholar] [CrossRef]
  17. Šarabon, N.; Čeh, T.; Kozinc, Ž.; Smajla, D. Adapted Protocol of Rate of Force Development and Relaxation Scaling Factor for Neuromuscular Assessment in Patients with Knee Osteoarthritis. Knee 2020, 27, 1697–1707. [Google Scholar] [CrossRef]
  18. Sharifmoradi, K.; Karimi, M.T.; Hoseini, Y. Evaluation of the Asymmetry of Leg Muscles Forces in the Subjects with Anterior Cruciate Ligament Reconstruction. J. Knee Surg. 2021, 34, 357–362. [Google Scholar] [CrossRef]
  19. Benjaminse, A.; Holden, S.; Myer, G.D. ACL Rupture Is a Single Leg Injury but a Double Leg Problem: Too Much Focus on ‘Symmetry’ Alone and That’s Not Enough! Br. J. Sport. Med. 2018, 52, 1029–1030. [Google Scholar] [CrossRef]
  20. Green, B.; Bourne, M.N.; Pizzari, T. Isokinetic Strength Assessment Offers Limited Predictive Validity for Detecting Risk of Future Hamstring Strain in Sport: A Systematic Review and Meta-Analysis. Br. J. Sport. Med. 2018, 52, 329–336. [Google Scholar] [CrossRef]
  21. Hrysomallis, C. Balance Ability and Athletic Performance. Sport. Med. 2011, 41, 221–232. [Google Scholar] [CrossRef]
  22. Palmieri-Smith, R.M.; Lepley, L.K. Quadriceps Strength Asymmetry after Anterior Cruciate Ligament Reconstruction Alters Knee Joint Biomechanics and Functional Performance at Time of Return to Activity. Am. J. Sport. Med. 2015, 43, 1662–1669. [Google Scholar] [CrossRef] [PubMed]
  23. Myer, G.D.; Ford, K.R.; Barber Foss, K.D.; Liu, C.; Nick, T.G.; Hewett, T.E. The Relationship of Hamstrings and Quadriceps Strength to Anterior Cruciate Ligament Injury in Female Athletes. Clin. J. Sport Med. 2009, 19, 3–8. [Google Scholar] [CrossRef]
  24. Dos’Santos, T.; Thomas, C.; Jones, P.A.; Comfort, P. Asymmetries in Isometric Force-Time Characteristics Are Not Detrimental to Change of Direction Speed. J. Strength Cond. Res. 2018, 32, 520–527. [Google Scholar] [CrossRef]
  25. Teixeira, L.A.; Lustosa De Oliveira, D.; Guimarães, R.; Sônia, R.; Correa, C. Leg Preference and Interlateral Asymmetry of Balance Stability in Soccer Players. Res. Q. Exerc. Sport 2011, 82, 21–27. [Google Scholar] [CrossRef] [PubMed]
  26. Boccia, G.; Brustio, P.R.; Buttacchio, G.; Calabrese, M.; Bruzzone, M.; Casale, R.; Rainoldi, A. Interlimb Asymmetries Identified Using the Rate of Torque Development in Ballistic Contraction Targeting Submaximal Torques. Front. Physiol. 2018, 9, 1701. [Google Scholar] [CrossRef] [PubMed]
  27. Smajla, D.; Knezevic, O.M.; Mirkov, D.M.; Šarabon, N. Interlimb Asymmetries and Ipsilateral Associations of Plantar Flexors and Knee Extensors Rate-of-Force Development Scaling Factor. Symmetry 2020, 12, 1522. [Google Scholar] [CrossRef]
  28. Bishop, C.; Turner, A.; Read, P. Effects of Inter-Limb Asymmetries on Physical and Sports Performance: A Systematic Review. J. Sport. Sci. 2018, 36, 1135–1144. [Google Scholar] [CrossRef]
  29. Murphy, A.J.; Wilson, G.J.; Pryor, J.F.; Newton, R.U. Isometric Assessment of Muscular Function: The Effect of Joint Angle. J. Appl. Biomech. 1995, 11, 205–215. [Google Scholar] [CrossRef]
  30. Hopkins, W.G.; Marshall, S.W.; Batterham, A.M.; Hanin, J. Progressive Statistics for Studies in Sports Medicine and Exercise Science. Med. Sci. Sport. Exerc. 2009, 41, 3–12. [Google Scholar] [CrossRef]
  31. Erdfelder, E.; FAul, F.; Buchner, A.; Lang, A.G. Statistical Power Analyses Using G*Power 3.1: Tests for Correlation and Regression Analyses. Behav. Res. Methods 2009, 41, 1149–1160. [Google Scholar] [CrossRef]
  32. Sullivan, G.M.; Feinn, R. Using Effect Size—Or Why the P Value Is Not Enough. J. Grad. Med. Educ. 2012, 4, 279. [Google Scholar] [CrossRef] [PubMed]
  33. Staehli, S.; Glatthorn, J.F.; Casartelli, N.; Maffiuletti, N.A. Test–Retest Reliability of Quadriceps Muscle Function Outcomes in Patients with Knee Osteoarthritis. J. Electromyogr. Kinesiol. 2010, 20, 1058–1065. [Google Scholar] [CrossRef] [PubMed]
  34. Hopkins, W.G. Measures of Reliability in Sports Medicine and Science. Sport. Med. 2012, 30, 1–15. [Google Scholar] [CrossRef] [PubMed]
  35. Kozinc, Ž.; Smajla, D.; Šarabon, N. Relationship between Hip Abductor Strength, Rate of Torque Development Scaling Factor and Medio-Lateral Stability in Older Adults. Gait Posture 2020, 95, 264–269. [Google Scholar] [CrossRef]
  36. Casartelli, N.C.; Lepers, R.; Maffiuletti, N.A. Assessment of the Rate of Force Development Scaling Factor for the Hip Muscles. Muscle Nerve 2014, 50, 932–938. [Google Scholar] [CrossRef]
  37. Mirkov, D.M.; Knezevic, O.M.; Maffiuletti, N.A.; Kadija, M.; Nedeljkovic, A.; Jaric, S. Contralateral Limb Deficit after ACL-Reconstruction: An Analysis of Early and Late Phase of Rate of Force Development. J. Sport. Sci. 2016, 35, 435–440. [Google Scholar] [CrossRef]
Figure 1. Testing setup. Participant in a custom-made chair (1: force transducer; 2: shanks; 3: rigid straps; 4: acquisition and analog-to-digital conversion unit; 5: monitor with visual feedback).
Symmetry 15 01590 g001
Figure 2. Distribution of R2 for Fmax–RFDmax associations obtained in two protocols.
Symmetry 15 01590 g002
Figure 3. The distribution of participants and the sample means for the common and reduced RFD-SF protocols. Note: Difference = difference in RFD-SF obtained in common and reduced protocols, as obtained with paired samples t-test.
Symmetry 15 01590 g003
Figure 4. The Bland–Altman plot for the agreement between the two protocols.
Symmetry 15 01590 g004
Figure 5. The asymmetries obtained using the common and reduced protocol.
Symmetry 15 01590 g005
Table 1. Descriptive statistics for RFD-SF obtained from common and reduced protocol and the association between them.
LegMean ± SDr
CommonReduced(95% CI)
Dominant6.9 ± 0.97.0 ± 0.70.71 (0.37–0.89)
Non-dominant6.5 ± 0.96.6 ± 0.90.80 (0.54–0.92)
Note: SD—standard deviation; r—Pearson correlation coefficient; CI—confidence interval.
Table 2. Between-day reliability of the reduced RFD-SF protocol.
LegTrial 1Trial 2MDTEMCV%ICC
(95% CI)
d
Mean ± SD
Dominant6.8 ± 0.76.9 ± 0.80.140.355.3%0.80 (0.54–0.92)0.13
Non-dominant6.4 ± 0.86.5 ± 1.00.100.284.4%0.92 (0.79–0.97)0.11
Note: SD—standard deviation; MD—mean difference; TEM—typical error of measurement; CV%—coefficient of variation; ICC—intraclass correlation coefficient; CI—confidence interval; d = Cohen’s effect size.
Disclaimer/Publisher’s Note: The statements, opinions and data contained in all publications are solely those of the individual author(s) and contributor(s) and not of MDPI and/or the editor(s). MDPI and/or the editor(s) disclaim responsibility for any injury to people or property resulting from any ideas, methods, instructions or products referred to in the content.

