Article

Symmetry Function in Trans-Tibial Amputees Gait Supplied with the New Concept of Affordable Dynamic Foot Prosthesis—Case Study

1
Department of Biomechanics, Poznan University of Physical Education, Królowej Jadwigi 27/39, 61-871 Poznań, Poland
2
Institute of Applied Mechanics, Poznan University of Technology, Piotrowo 3, 60-965 Poznań, Poland
3
Adult Spine Orthopaedics Department, Poznan University of Medical Sciences, 28 Czerwca 1956r. 135/147, 61-545 Poznań, Poland
4
Institute of Robotics and Machine Intelligence, Poznan University of Technology, Piotrowo 3, 60-965 Poznań, Poland
*
Author to whom correspondence should be addressed.
Symmetry 2023, 15(8), 1595; https://doi.org/10.3390/sym15081595
Submission received: 21 July 2023 / Revised: 8 August 2023 / Accepted: 15 August 2023 / Published: 17 August 2023

Abstract

:
The development of modern technologies has made it much easier to regain the ability to walk after losing a lower limb. The variety of prosthetic feet available on the market allows for optimal choice and appropriate adjustment of the foot prosthesis to the trans-tibial amputee patient’s needs. Unfortunately, the best solutions are often not available to everyone due to their high prices. This study compares the gait patterns of patients using the new concept of an affordable dynamic foot with those of other commonly available but much more expensive foot prostheses. The kinematic and spatio-temporal parameters of gait obtained using the motion capture system were analyzed. For a clear picture of changes in bilateral deficits during gait for the pelvis, hip, knee, and ankle joints, the symmetry function was used. The results indicate that the new and cheaper concept of foot prostheses offers a very similar level of gait quality to that provided by more expensive and popular solutions. The authors suggest that the use of symmetry function thresholds of 10% does not work for amputees.

1. Introduction

Trans-tibial amputation, a type of lower-limb amputation, is a common consequence of trauma, disease, or congenital abnormalities [1,2,3]. The number of hospitalizations with reported lower limb amputations in Poland in 2018 was close to 11 thousand [4]. It is a global problem, and according to some studies, the projected number of people living with the loss of limbs will more than double by the year 2050 [5]. Amputees face difficulties with walking as they require an aid to replace the lost limb. Foot prostheses are commonly used to restore gait function and improve mobility in trans-tibial amputees. It depends on the individual patient’s condition as to which type of foot prosthesis can be used [6]. Articulated feet have a movable joint that connects the foot and lower leg. The passive foot has a compact foot and ankle structure. Passive prosthetic feet use a material with minimal energy storage and recovery during the stance phase due to their high stiffness and limited deflection. As such, they provide few biomechanical benefits [7,8]. Additionally, traditional foot prostheses do not always provide the necessary dynamic response, leading to discomfort and reduced mobility [9]. Unfortunately, the current standard of care for prostheses still results in significant asymmetry for crucial gait parameters [10,11,12]. The newer generations of foot prostheses improve the quality of gait [13], but the majority of commercially available modern prostheses are expensive, creating a challenge for low-income individuals to access them [14]. In addition, prior research predominantly used costly, commercially available dynamic prostheses, reducing their availability to low-income populations [7]. In the past, prostheses with innovative solutions and complex designs were only available to wealthy individuals, while those from lower social classes received more primitive prostheses that used cheaper materials and less modern technological solutions. Nowadays, the costs of modern prostheses remain very high, and without external support or charitable funds, patients would not be able to provide themselves with the appropriate prosthetic equipment that would enable them to return to full functional capacity [15]. Although healthcare systems and social funds offer some forms of funding for prosthetic equipment, each case is individual and requires separate consideration in terms of costs and technical possibilities. Depending on the country and available resources, the level of financing and support for amputees can vary significantly.
In this study, a new concept of composite dynamic foot prosthesis (DFP) was compared to popular but expensive foot prostheses (FP) (Table 1). The investigated DFP allows storage of energy generated during heel strike and release of that energy to enhance toe push-off. For that reason, it can be classified as Energy-Storing-and-Release Foot, also known as a dynamic foot or dynamic elastic response foot [9]. From the description of US patent US5181933A, a prosthetic foot is known, which comprises multiple interrelated curved parts (springs) that achieve the ESR effect. In this prior art, the points of support are formed by two springs (midfoot and heel). Similar constructions are also presented in US patents US4822363, US20130144403, and US5258039. In contrast, the investigated DFP includes an additional plantarflexion spring (base spring), and its special design contributes to an increased propulsion force from the prosthesis. DFP consists of a profiled base spring connected to a midfoot spring, which, in the rear part, is connected to a heel spring. However, the distinctive feature of DFP lies in its base spring, which is composed of interconnected layers of carbon fiber with a hybrid fiber (carbon-aramid) located between the upper and lower layers. Additionally, the profiled midfoot spring is entirely made of carbon fiber, including unidirectional carbon fiber between individual layers. The heel spring, on the other hand, is formed by applying a chemically bonded flexible adhesive to the lower part of the midfoot spring, with its lower surface remaining unattached. The DFP foot has been designed to allow significant deflections in the forefoot. The DFP forefoot deflection effect increases the force of the prosthetic takeoff. This concept is realized by the local use of materials with greater flexibility. Based on the properties of the composite used, the deflection point was made of a fiber with a different angular orientation as a core that increases flexibility, which in turn ensures greater safety of use. The technical details of the DFP are described in the patent application filed under no. P440862 (WIPO ST 10/C PL440862, The Patent Office of the Republic of Poland).
The price of prosthetic feet varies by region, place of purchase, and manufacturer. Compared to the prosthetic feet examined in this article (Table 1), the DFP concept is much more financially accessible to low-income patients. In fact, this new concept of prosthetic foot can be even 5 to 10 times cheaper than traditional prosthetic feet on the market, which can significantly increase accessibility and improve quality of life for people with lower limb amputations.
The aim of the study was to compare the symmetry function for kinematic parameters of gait using modern foot prostheses and the new concept of dynamic foot prostheses. The authors decided to choose the symmetry function because this method has been previously verified and serves as an excellent tool for presenting where the greatest bilateral deficits appear in the range of motion of selected joints [16,17,18].
This study’s importance lies in its potential to offer a less expensive and more dynamic alternative to conventional prostheses, improving the quality of life and mobility of trans-tibial amputees. The principal conclusions of this study will provide valuable insight into the benefits of dynamic foot prostheses for low-income populations and contribute to the development of more accessible and effective assistive devices for trans-tibial amputees.

2. Materials and Methods

2.1. Participants

The study involved four independent cases (2 females, F1 and F2, and 2 males: M1 and M2) of transtibial amputation. The prostheses used by patients have slightly different features. Ottobock’s 1C64 Triton is made of carbon fiber and a high-performance polymer spring with a titanium adapter. The design of the spring allows for: dynamic transition from the stance to swing phase; heel strike with noticeable plantar flexion; smooth movement of the ankle during mid-stance phase for the natural rollover of the foot; compensation for uneven terrain; controlled forefoot response; and energy return. In comparison, the Ottobock 1C60 Triton is lighter than the Ottobock 1C64 Triton. Other than that, it has similar features and is also made of carbon fiber composite and connected by a base spring made of high-performance polymer. The Pacifica LP FS4 is Energy-Storing-and-Returning Foot that has a low profile design ideal for users with long residual limbs and provides room for additional components, such as a rotator or shock absorber, which can provide added comfort. The SACH prosthesis is a lightweight prosthesis that provides shock absorption, easy roll-over, and ankle action characteristics equivalent to the normal ankle. The characteristics of the subjects, including their orthopedic supplies, are shown in Table 1. All patients had been using their prostheses for at least six months and did not use any other walking support devices. The exclusion criteria were: inability to prosthetize the patient; inability to use the prosthesis, lack of coordination of movement; decreased range of motion; emerging pain in the stump area; dysfunction of the neuromuscular, cardiovascular, or respiratory systems. All patients gave their informed consent for inclusion before they participated in the study. The study was conducted in accordance with the Declaration of Helsinki, and the protocol was approved by the Bioethical Committee at the Poznan University of Medical Sciences (number 943/21).

2.2. Experimental Procedures

The experimental procedure was designed for two sessions. The first one was planned to collect the gait parameters of the amputee patients supplied with FP, which they used for at least 6 months (Table 1). The second one took place at least 3 months after the adaptation process, after fitting with a new DFP. To collect the gait data, an optoelectronic motion capture system was used (Optitrack, NaturalPoint Inc., Corvallis, OR, USA). The system consisted of six infrared digital cameras (PrimeX 13, 850 nm infrared light, up to 240 hz in 1280 × 1024 px resolution) and a synchronized accessory Prime Color camera (Optitrack, NaturalPoint Inc., Corvallis, OR, USA) for additional verification of patient gait during recording sessions. A set of 15 reflective markers (diameter: 14 mm) were fixed with double-sided adhesive tape on anatomical landmarks according to Helen Hayes lower body biomechanical model [19,20]: left and right anterior superior iliac spines (ASIS), between left and right posterior superior iliac spines on the sacrum, lateral side of the thigh, lateral epicondyle of the femur, lateral side of the calf, lateral malleolus, calcaneus, and between 2nd and 3rd metatarsal. All markers were fixed by the same experienced investigator.
In order to familiarize patients with the laboratory conditions, they were instructed to walk at a self-selected speed through a 6.5 m long (1.5 m wide) path for as many times as they needed to reach a comfortable pace and feel confident with their gait pattern. After the familiarization period, 18 successful trials of gait were measured for each patient. The exact same procedure was performed during the second session with the DFP. During both measuring sessions, all patients used the same sports shoes.

2.3. Data Analyses

Motive 2.3 software (Optitrack, NaturalPoint Inc., Corvallis, OR, USA) was used for marker tracking and data analysis. Data were acquired using an optical motion capture system (Optitrack, NaturalPoint Inc., Corvallis, OR, USA) with a sample rate of 240 Hz and then filtered with a 6 Hz low-pass cutoff frequency filter.
The gait cycle was based on ground step detection, and initial contacts and toe offs were detected by identifying the points in contact with the ground plane and then using the Viterbi algorithm to determine the gait sequence in the capture.
For the advanced analysis, the standard set of biomechanical gait parameters was selected from both measuring sessions for later comparisons [21,22].
The spatiotemporal parameters of interest included gait speed, cadence, step length for involved lower extremities (ILE) and uninvolved lower extremities (ULE), stance, and swing phase for ILE and ULE. The analyzed kinematic parameters included the angle-time characteristics for the pelvis, hip, knee, and ankle joints in the sagittal plane and for the pelvis and hip in the frontal and horizontal planes. All kinematic parameters were normalized to the gait cycle [GC]. The results of these variables obtained from the 18 gait trials for each patient separately were taken for further analysis.
The symmetry function (SF) was used to present the level of asymmetry throughout the whole gait cycle between the ILE and ULE sides for all selected kinematic parameters [18,23]. Data sets were averaged for each participant on each side and for both sessions. After that, to calculate the symmetry between the ILE and ULE sides, SF was used. SF can be interpreted as a percentage difference between the involved and uninvolved sides relative to the range of these values as a function of time [18].
SF ( t ) = 2 · X in ( t ) X un ( t ) Range in + Range un
For both sessions of each participant and each gait cycle, the maximum and minimum angle-time characteristics of each kinematic parameter were found. Both peaks (Peakmin, Peakmax [deg]), time of their occurrence (tmin, tmax [%]), and Range of each parameter [deg] were determined.
For an even better presentation of differences in SF between both measuring sessions, the percentage distribution for crucial thresholds (5%, 10%, and 15%) was calculated (Table 2) [18,24]. For effortless analysis, threshold zones were also marked on the SF graphs with three increasing shades of red (Figure 1 and Figure 2).

2.4. Statistical Analyses
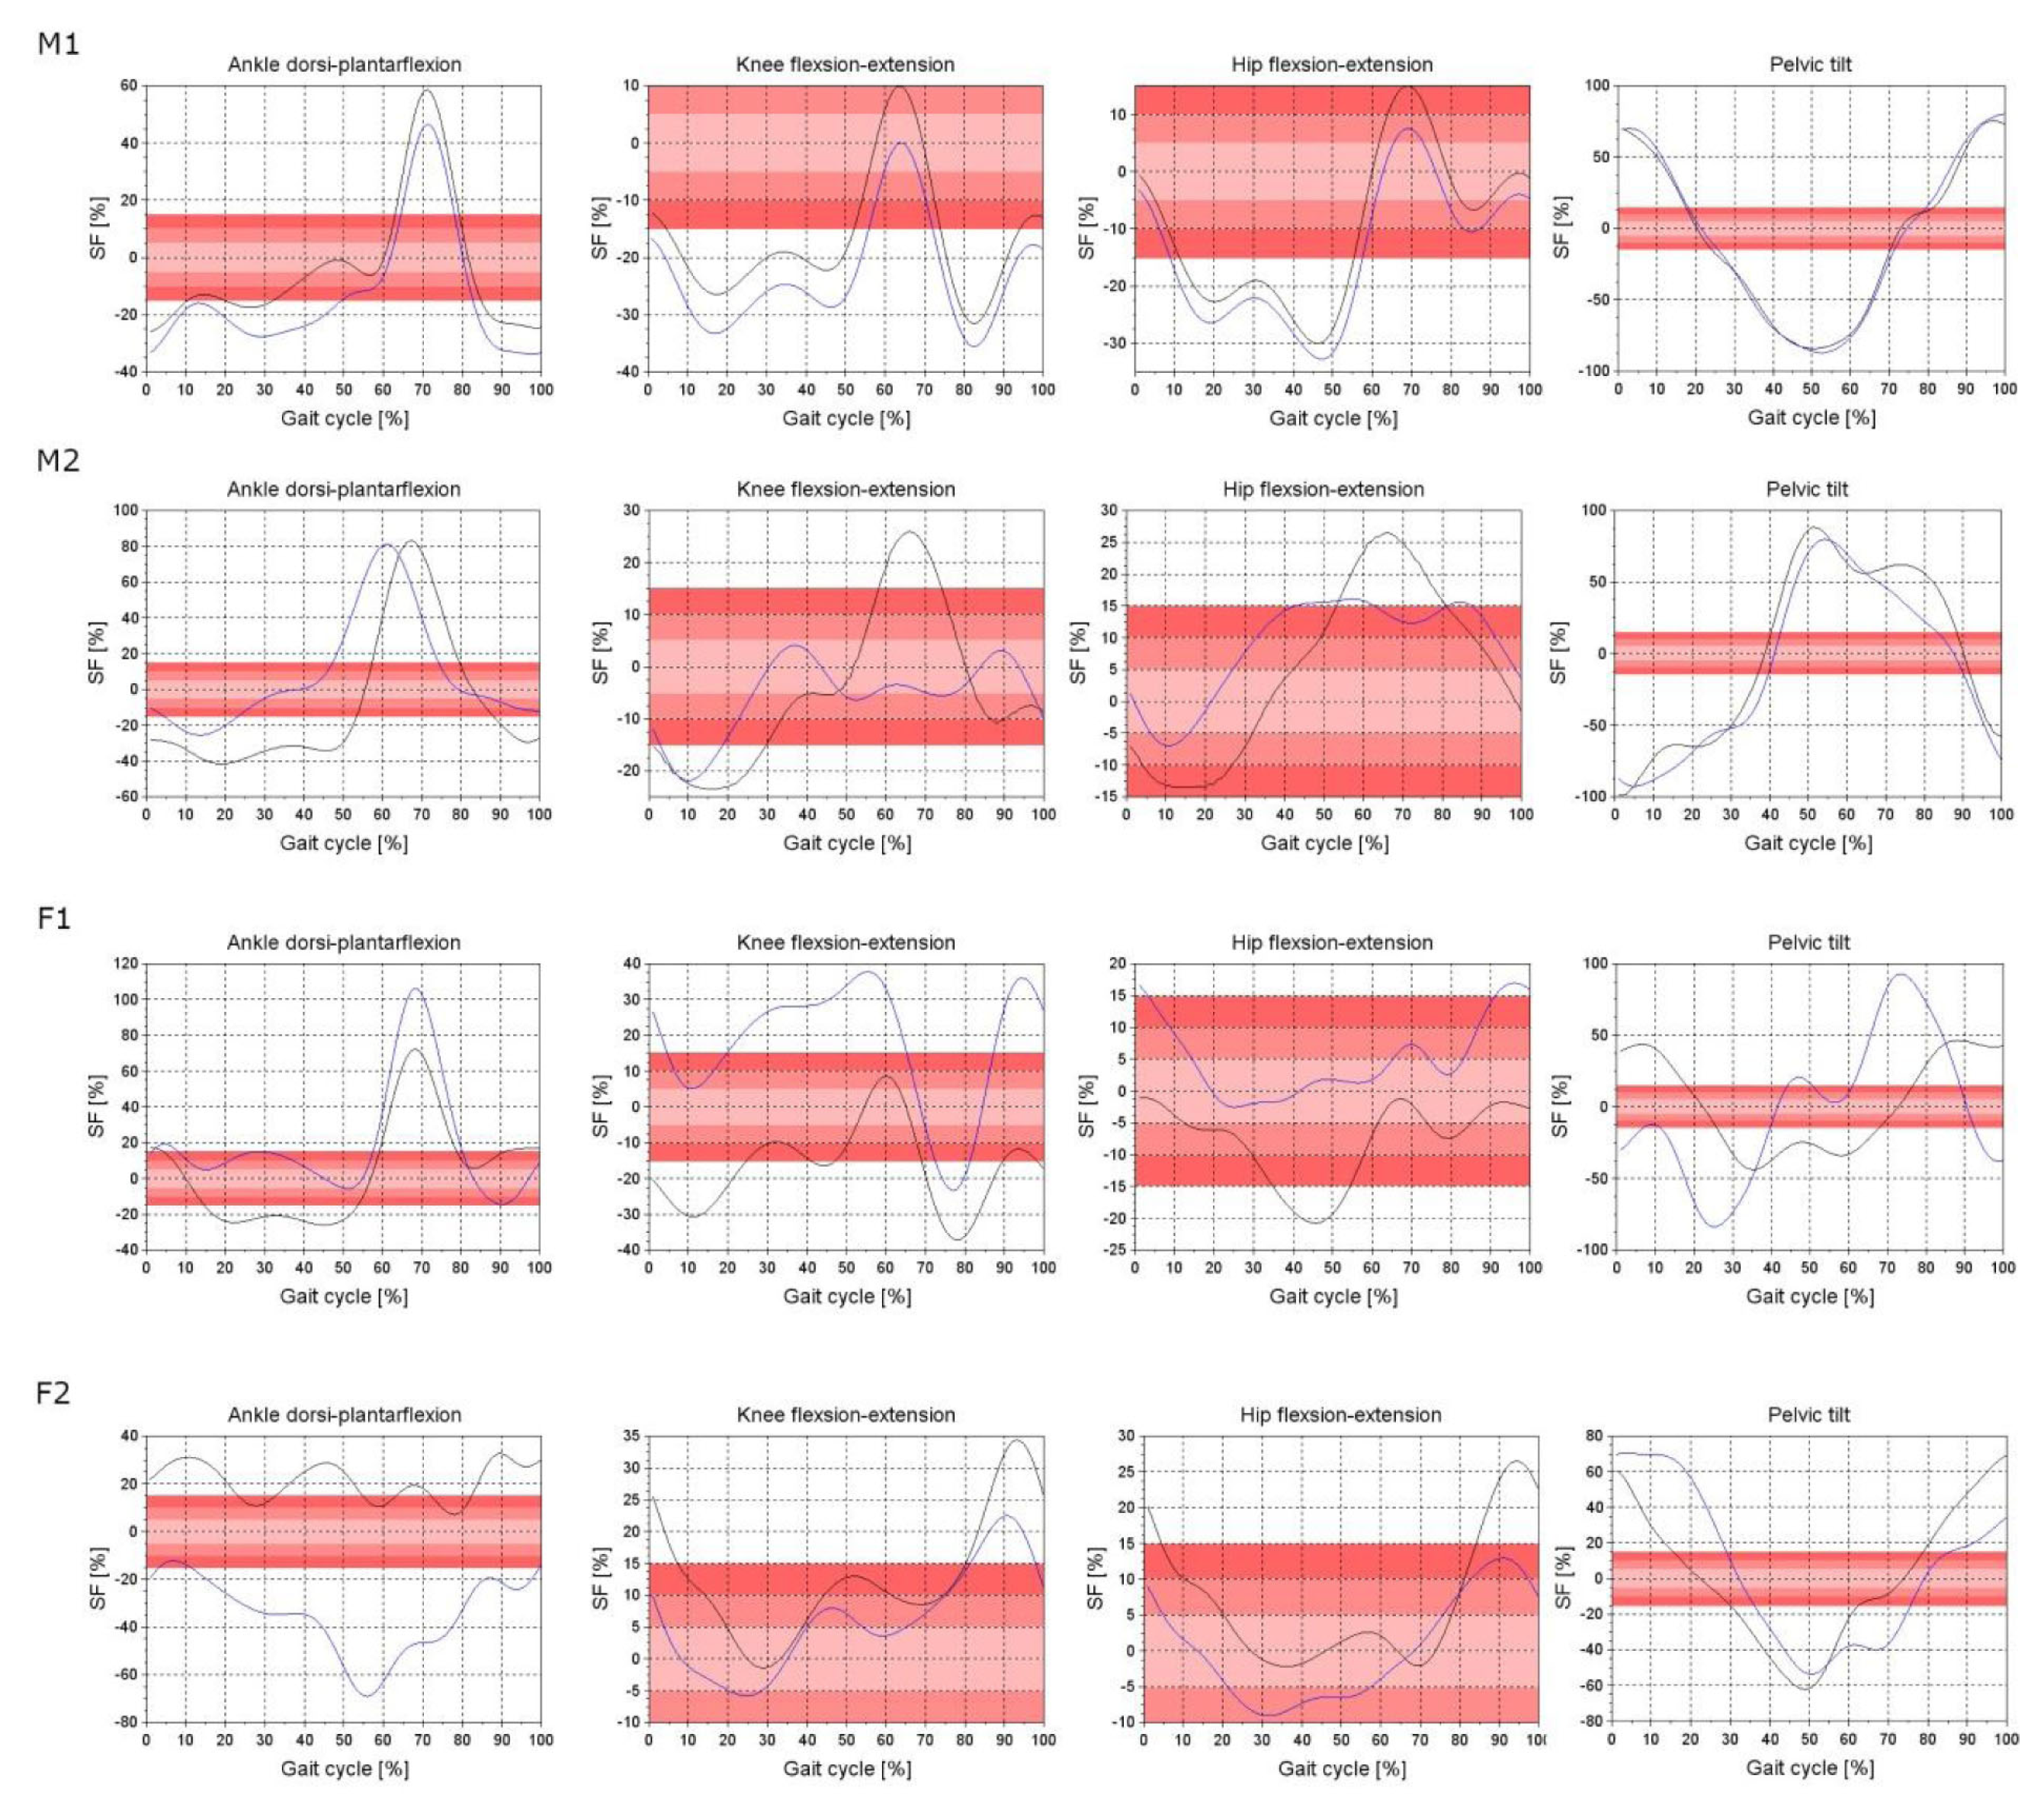
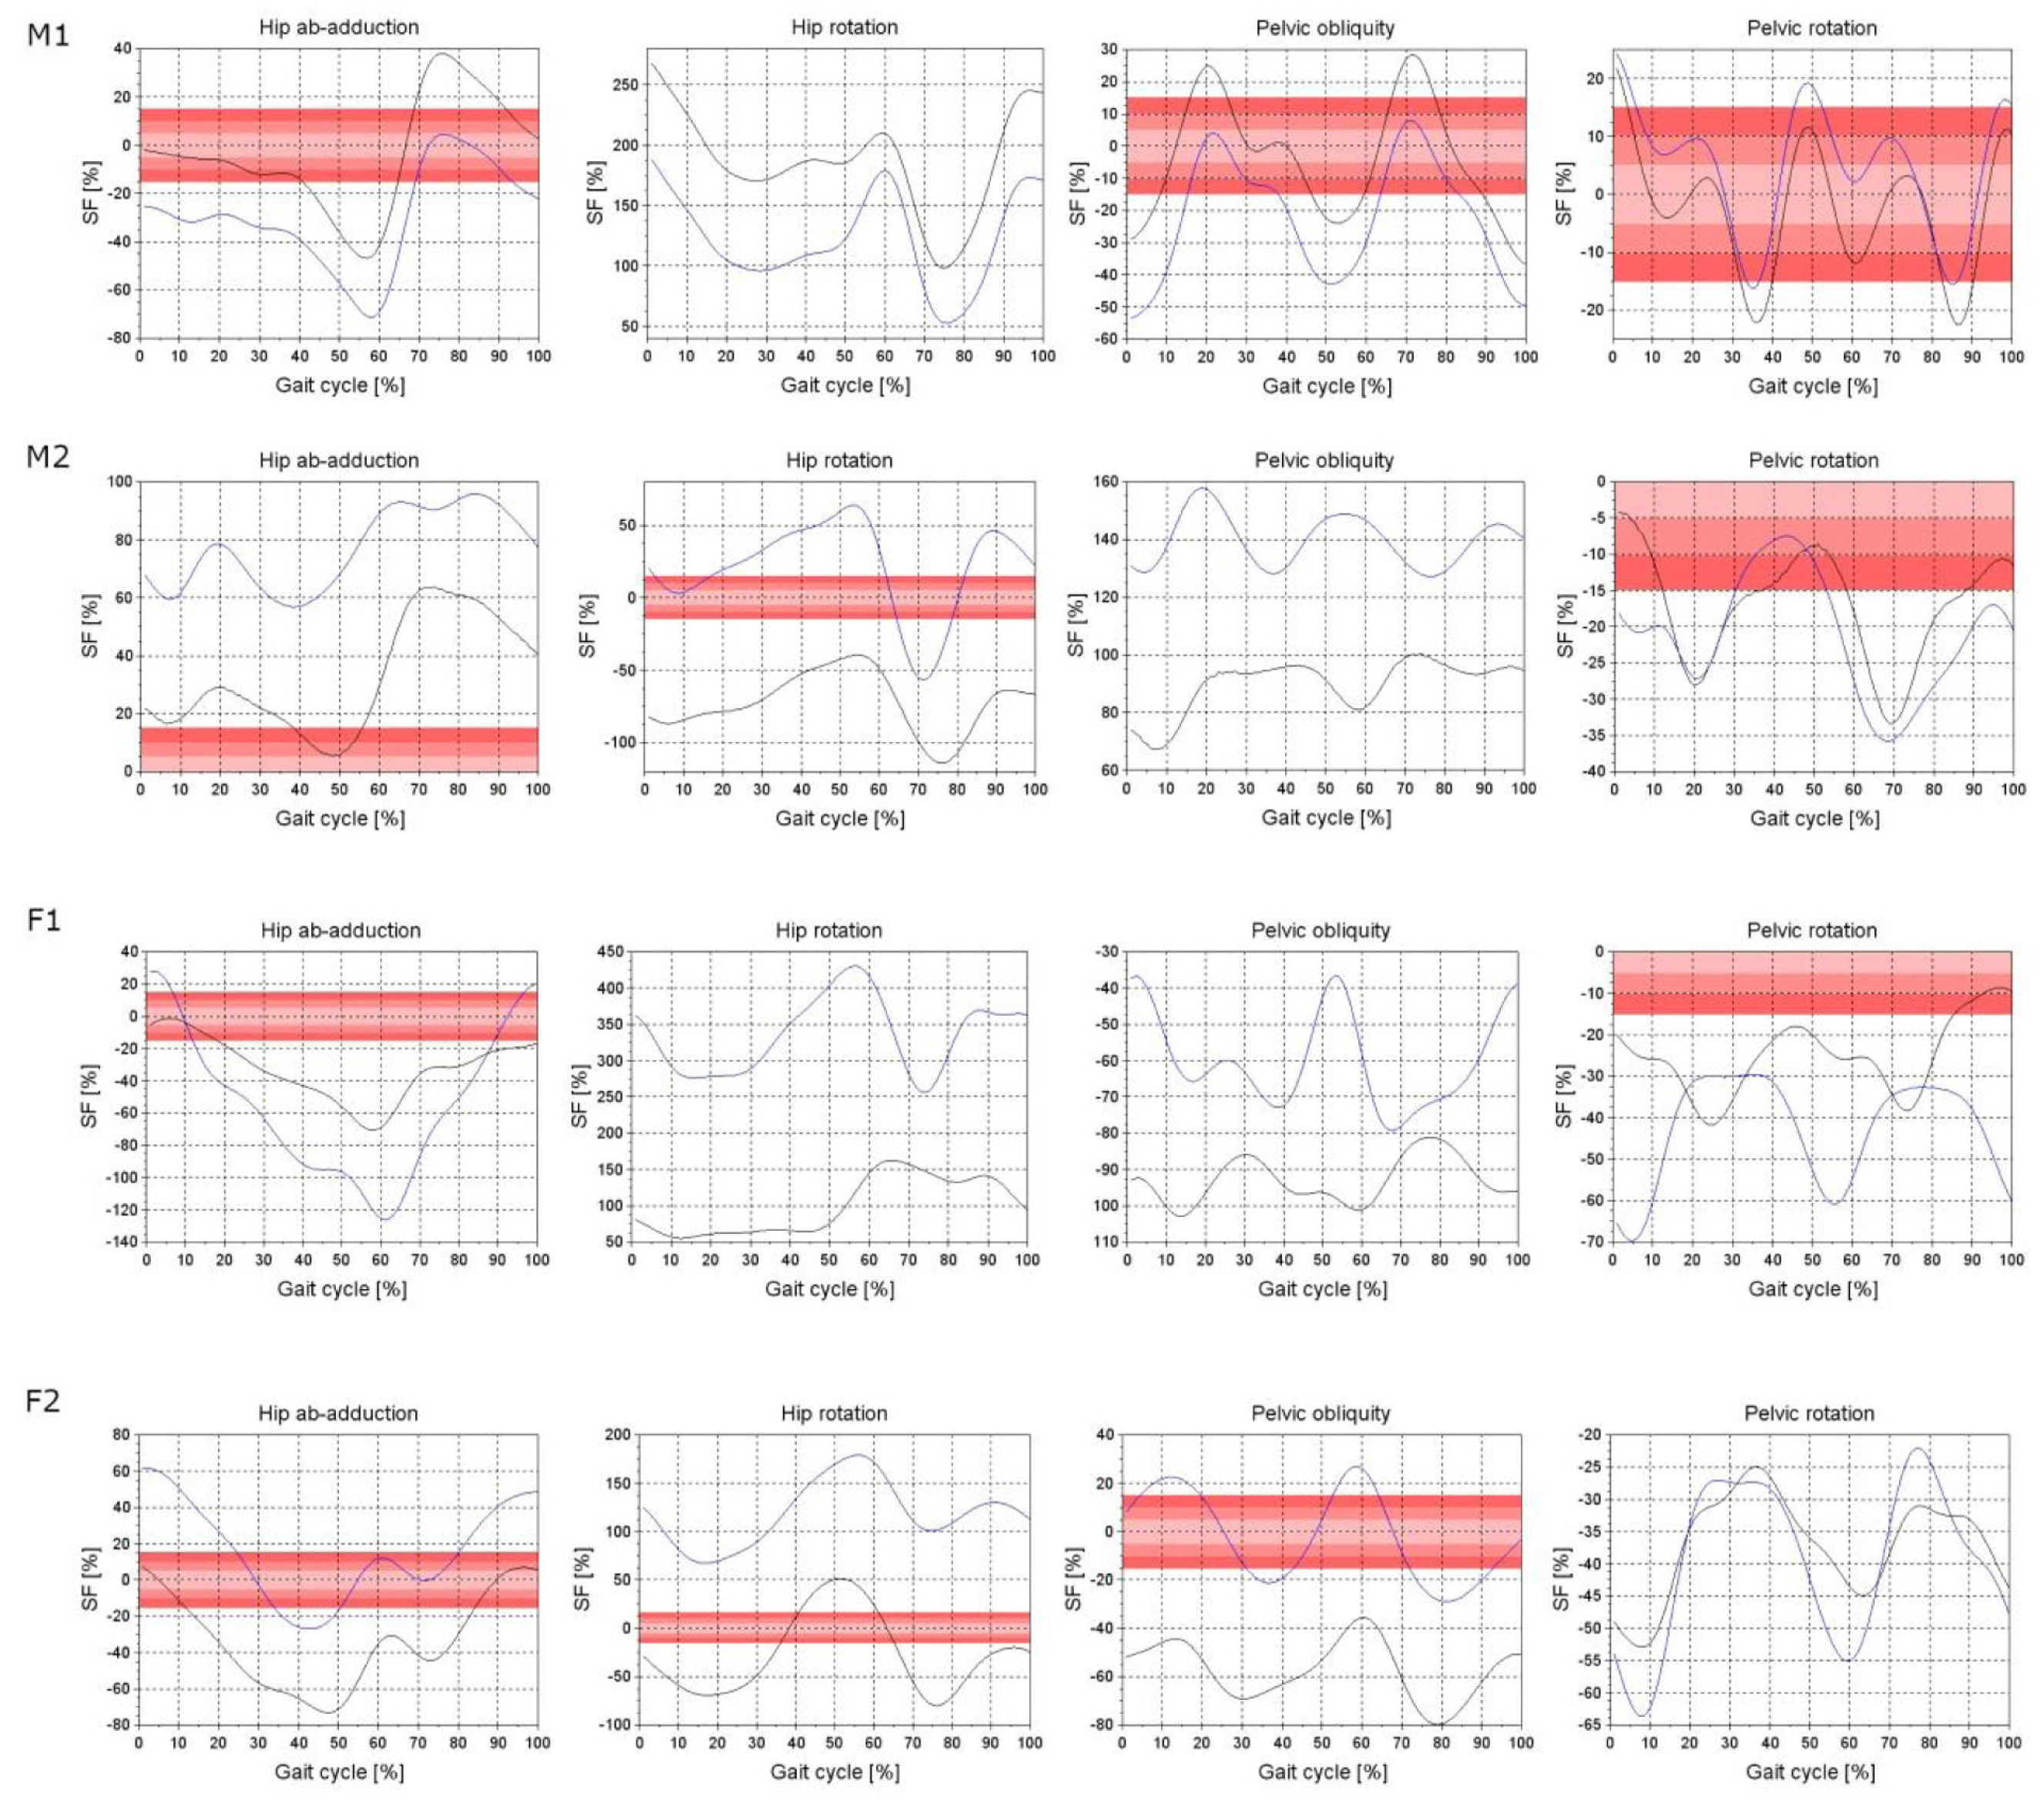
Statistical analysis was performed in SPSS Statistics software for Windows, version 28.0 (Armonk, NY, USA: IBM Corp.). The Shapiro–Wilk test was used to verify the distribution of variables. A mixed-factorial ANOVA with two factors (side [ILE or ULE] × prosthesis [DFP or FP]) was performed. Sphericity was examined using the Mauchly test. A Bonferroni correction for multiple pairwise comparisons was used. The effect size for the ANOVA test was determined using the partial eta-squared (η2). According to the Cohen guidelines, values of η2 were small for 0.01, medium for 0.06, and large for 0.14. Significance level alpha was set at p < 0.5.

3. Results

Figure 1 and Figure 2 present SF between the ILE side and the ULE side for ankle, knee, hip, and pelvic motion in sagittal plane (Figure 1), and for hip and pelvic motion in frontal and transverse planes (Figure 2) in gait cycle.
The SF percentage distribution below the 5%, 10%, and 15% thresholds normalized to GC in all patients shows Table 2.
The means and standard deviations (SDs) of the spatio-temporal parameters in four subjects are presented in Table 3.
The results of the Mauchly test showed that the sphericity for step length, stance phase, and swing phase was fulfilled (p > 0.05). Results of the η2 ranged from 0.14 to 0.97 and indicated a large effect size for all factors.
Side factor. Analysis revealed a significant main within-subject effect for step length in all subjects (p < 0.001), stance phase in subjects F1, M1, and M2 (p < 0.001), as well as swing phase in subjects F1, M1, and M2 (p < 0.001).
Prosthesis factor. A significant between-subject main effect for step length in all subjects (p < 0.05), stance phase and swing phase in subjects F1 and M1 (p < 0.05) was demonstrated.
Interaction. A significant interaction effect between the side factor and prosthesis factor for step length (p < 0.05), stance phase (p < 0.05), and swing phase (p < 0.05) in subjects F1, F2, and M2 was found.
Pairwise comparisons between sides showed significantly greater values of: (1) step length for ILE than ULE in subjects F2 and M2 (p < 0.001) as well as for ULE than ILE in subjects F1 and M1 (p < 0.001), (2) stance phase for ULE than ILE and swing phase for ILE than ULE in subjects F1 and M1 (p < 0.001). In turn, comparisons between prosthesis revealed significantly greater values of: (1) step length for DFP than FP in subject M1 (p < 0.001) as well as for FP than DFP in subjects F1 (p < 0.05) and F2 (p < 0.001); (2) stance phase for DFP than FP and swing phase for FP than DFP in subject M2 (p < 0.05); (3) stance phase for FP than DFP and swing phase for DFP than FP in subject F1 (p < 0.01).
In addition, subjects walked with an average velocity in the range of 0.80 ± 0.05 m/s ÷ 1.29 ± 0.04 m/s (DFP) and 1.01 ± 0.05 m/s ÷ 1.32 ± 0.03 m/s (FP), as well as a cadence in the range of 93.6 ± 3.8 ÷ 111.7 ± 1.5 (DFP) and 93.9 ± 2.3 ÷ 107.4 ± 2.0 (FP).
The means and standard deviations (SDs) of the minimum values of AF, KF, HF, HA, HR, PO, PT, and PR in four subjects are presented in Table 4.
The means and standard deviations (SDs) of the maximum values of AF, KF, HF, HA, HR, PO, PT, and PR in four subjects are presented in Table 5.
Means and standard deviations (SDs) of the RoM values of AF, KF, HF, HA, HR, PO, PT, and PR in four subjects presents Table 6.
Results of the Mauchly test showed that the sphericity for angles was fulfilled (p > 0.05). Results of the η2 ranged from 0.12 to 0.98 and indicated medium and large effect sizes for all factors.
Side factor. Analysis revealed the significant main within-subject effect for: AF (MIN, MAX, RoM), KF (MIN, MAX), HF (MIN, MAX, RoM), and HR (MIN, MAX) in all subjects (p < 0.001), HA (MAX, RoM) in all subjects (p < 0.05), PO (MIN, MAX) in all subjects (p < 0.01), KF (RoM) in subjects F1, M1 and M2 (p < 0.001), HA (MIN) and PR (MIN, MAX) in subjects F1, F2 and M2 (p < 0.001), HR (RoM) in subject F1 (p < 0.001), PO (RoM) in subjects F2 and M1 (p < 0.01), and PT (MAX, RoM) in subjects F2, M1 and M2 (p < 0.01).
Prosthesis factor. Significant between-subject main effect for: AF (MAX) in all subjects (p < 0.001), AF (MIN) in subjects F1, F2 and M2 (p < 0.001), KF (MIN, MAX) in subjects F1, F2 and M2 (p < 0.01), HF (MIN, MAX, RoM) and HA (MIN, MAX) in subjects F1, F2 and M2 (p < 0.05), HA (RoM) and HR (MIN) in subjects F1, F2 and M2 (p < 0.001), PO (MAX, RoM) in subjects F1, F2 and M2 (p < 0.01), PT (MIN, MAX) in subjects F1, F2 and M2 (p < 0.001), AF (RoM) and PO (MIN) in subjects F1 and F2 (p < 0.01), PR (MIN, RoM) in subjects F1 and F2 (p < 0.05), KF (RoM) in subjects F1, M1 and M2 (p < 0.01), PT (RoM) in subjects F1, M1 and M2 (p < 0.05), HR (MAX) in subjects F2 and M2 (p < 0.01), HR (RoM) in subjects F1, F2 and M1 (p < 0.001), and PR (MAX) in subjects F1 and M1 (p < 0.01).
Interaction. Significant interaction effect was observed between the side factor and prosthesis factor for: AF (MIN, RoM), HA (MIN), HR (MIN, RoM), and PO (MIN) in all subjects (p < 0.05), AF (MAX), HA (MAX), and HR (MAX) in subjects F1, F2, and M2 (p < 0.001), HF (MIN, MAX) in subjects F1, F2, and M2 (p < 0.05), KF (MIN, MAX) in subjects F1 and M2 (p < 0.05), KF (RoM) in subjects F1, M1, and M2 (p < 0.001), PO (MAX) in subjects F1, M1, and M2 (p < 0.05), PR (MAX) in subjects F1, M1, and M2 (p < 0.01), HF (RoM) in subjects F2 and M2 (p < 0.01), HA (RoM) in subjects F1, F2, and M1 (p < 0.05), PO (RoM) in subject F2 (p < 0.01), PT (MIN, RoM) in subject F2 (p < 0.05), and PR (MIN) in subjects F1 and M1 (p < 0.01).
Pairwise comparisons showed significantly greater angle MIN values for: (1) ILE than ULE (18/64 cases; symbol “a” in Table 4) (p < 0.05), and ULE than ILE (20/64 cases; symbol “b” in Table 4) (p < 0.05), (2) DFP than FP (19/64 cases; symbol “c” in Table 4) (p < 0.05), and FP than DFP (17/64 cases; symbol “d” in Table 4) (p < 0.05).
Moreover, we found significantly greater angle MAX values for: (1) ILE than ULE (15/64 cases; symbol “a” in Table 5) (p < 0.05), and ULE than ILE (21/64 cases; symbol “b” in Table 5) (p < 0.05), (2) DFP than FP (17/64 cases; symbol “c” in Table 5) (p < 0.05), and FP than DFP (16/64 cases; symbol “d” in Table 5) (p < 0.05).
Pairwise comparisons revealed also significantly greater angle RoM values for: (1) ILE than ULE (11/64 cases; symbol “a” in Table 6) (p < 0.05), and ULE than ILE (13/64 cases; symbol “b” in Table 6) (p < 0.05), (2) DFP than FP (12/64 cases; symbol “c” in Table 6) (p < 0.05), and FP than DFP (19/64 cases; symbol “d” in Table 6) (p < 0.05).

4. Discussion

The aim of this study was an objective comparative assessment of the quality of gait of patients walking with the use of DFP and with the use of commonly used but more expensive FP solutions based on the quantitative analysis of kinematic parameters. As the main assessment criterion, the values of asymmetry between the movements of the ULE and ILE were adopted [25,26,27,28,29,30].
Results of the main effects showed that the side factor significantly influenced the mean values of the step length, stance phase, swing phase, and ankle, knee, hip, and pelvis angles.
Analysis also revealed a significant between-subject main effect for the prosthesis factor, which means that regardless of the side (ILE or ULE), the type of prosthesis (DFP or FP) significantly influenced the values of gait variables in four subjects.
Furthermore, a significant interaction effect between the side and prosthesis was found. Thus, the influence of the side factor on the values of gait variables depends on the prosthesis. In many cases, the comparisons showed significantly higher or lower values of spatio-temporal parameters and angles for ILE or ULE as well as for DFP or FP. For the gait of the subjects, the occurrence of low, insignificant differences in the values of gait variables between ILE and ULE (insignificant asymmetry) is beneficial.
In order to obtain a clear, easier-to-understand, and more complete picture of changes in bilateral deficits, it was decided to use the symmetry function [18].The paper presents the waveforms of the symmetry function normalized to the gait cycle for the movements of the pelvis, hip, knee, and ankle joints.
The main conclusion of this work is that the symmetry function waveforms indicate very comparable characteristics of the gait patterns of patients with DFP and FP. For two patients (M2 and F2), the situation was even more favorable; significantly lower values of the symmetry function were observed. For most of the gait cycle, they are in the range of established thresholds of the symmetry function, i.e., between 5% and 15%.
Another observation of the authors is the fact that the commonly used asymmetry ranges between the involved and uninvolved sides during gait in patients with foot prostheses work only for selected joints and planes of motion. For the movements of internal/external rotation and abduction/adduction of the hip, as well as pelvic rotation and pelvic obliquity in the transverse and frontal planes, respectively, the commonly assumed 10 to 15% threshold is definitely too small. One of the reasons for this may be the fact that in the above-mentioned movements, the range of motion is small; hence, even relatively small deviations from the norm translate into large values of the symmetry function.
The study also carried out a comparative analysis between the gait with DFP and FP for minimum and maximum values and ranges of motion for the pelvis, hip, knee, and ankle joints. For the minimum values, very comparable amounts of statistically significant differences were observed between the healthy lower limb and the limb with a prosthesis for both DFP and FP. There were 13 significant differences in favor of ILE for DFP and 12 for FP. In favor of the ULE side, there were equally 14 statistically significant differences for both DFP and FP. Very similar observations were made for the maximum values. There were nine significant differences in favor of ILE for DFP and 10 for FP. In favor of ULE, it was 17 and 15, respectively. The picture is no different for ranges of motion-significant differences in favor of ILE for DFP were 7 and for FP 8. In favor of the ULE side, it was 12 and 11, respectively. Although the observed statistically significant differences did not always appear in the same places for DFP and FP, due to the complexity of the gait pattern, it is difficult to state unequivocally whether the differences occurring for the example of selected minimum values appearing in the hip rotation movement are more important than the differences appearing in the same joint for abduction/adduction.
As for the spatio-temporal parameters, in the case of step length, statistically significant differences are observed between ILE and ULE for the same patients both when walking with FP and DFP. Interestingly, for the stance phase and swing phase durations, statistically significant differences between ILE and ULE were observed only for one patient with DFP (subject 3) and for two patients with FP (subjects 1 and 2).
Therefore, the above observations indicate that the gait pattern of patients using DFP is very comparable to the gait pattern of patients using popular FPs. This information is crucial and confirms the authors’ assumptions that DFP, which is several times cheaper, can be an effective replacement for FP.
This study has some limitations. First of all, it is necessary to conduct further research in order to examine more patients and be able to confirm the authors conclusions in a larger population. This research was focused on the kinematic parameters; hence, in subsequent studies, it seems necessary to extend the scope of research by testing ground reaction forces in order to obtain also kinetic parameters and their symmetry functions.

5. Conclusions

The new concept of the DFP prosthesis works as a much cheaper replacement for patients after a lower leg amputation. There is a noticeable improvement in spatio-temporal parameters in favor of the DFP prosthesis. The number of significant differences for selected gait parameters between the healthy limb and the limb with the prosthesis is comparable for the FP and DFP prostheses. The use of the symmetry function makes it possible to trace the differences between the healthy and the amputated sides throughout the entire gait cycle. The use of SF thresholds of 10% does not work for amputees. In terms of biomechanical parameters, the DFP prosthesis does not differ from competitive prostheses, which are several times more expensive.

Author Contributions

Conceptualization, M.M., J.O., S.B., L.K. and A.G.; methodology, M.M., J.O., S.B. and J.K.; software, J.O. and S.B.; formal analysis, J.O., S.B. and J.K.; investigation, M.M. and S.B.; data curation, S.B.; writing—original draft preparation, M.M., J.O., S.B. and J.K.; writing—review and editing, M.M., J.O., S.B. and J.K.; visualization, M.M. and J.K.; supervision, M.M., L.K. and A.G.; project administration, A.G.; funding acquisition, A.G. All authors have read and agreed to the published version of the manuscript.

Funding

This research was funded by the National Centre for Research and Development in Poland and supported within the project no. POIR.01.01.01-00-0839/20.

Data Availability Statement

Not applicable.

Acknowledgments

The authors would like to thank all participating patients.

Conflicts of Interest

The authors declare no conflict of interest.

References

  1. Pran, L.; Harnanan, D.; Baijoo, S.; Short, A.; Cave, C.; Maharaj, R.; Cawich, S.O.; Naraynsingh, V. Major lower limb amputations: Recognizing pitfalls. Cureus 2021, 13, e16972. [Google Scholar] [CrossRef]
  2. Spoden, M.; Nimptsch, U.; Mansky, T. Amputation rates of the lower limb by amputation level—Observational study using German national hospital discharge data from 2005 to 2015. BMC Health Serv. Res. 2019, 19, 8. [Google Scholar] [CrossRef]
  3. Eidmann, A.; Kamawal, Y.; Luedemann, M.; Raab, P.; Rudert, M.; Stratos, I. Demographics and etiology for lower extremity amputations—Experiences of an University Orthopaedic Center in Germany. Medicina 2023, 59, 200. [Google Scholar] [CrossRef]
  4. Available online: https://ezdrowie.gov.pl/portal/home/badania-i-dane/zdrowe-dane/zestawienia/informacje-o-liczbie-amputacji-konczyn (accessed on 11 March 2019).
  5. Ziegler-Graham, K.; MacKenzie, E.J.; Ephraim, P.L.; Travison, T.G.; Brookmeyer, R. Estimating the Prevalence of Limb Loss in the United States: 2005 to 2050. Arch. Phys. Med. Rehabil. 2008, 89, 422–429. [Google Scholar] [CrossRef] [PubMed]
  6. Paradisi, F.; Delussu, A.S.; Brunelli, S.; Iosa, M.; Pellegrini, R.; Zenardi, D.; Traballesi, M. The conventional non-articulated SACH or a multiaxial prosthetic foot for hypomobile transtibial amputees? A clinical comparison on mobility, balance, and quality of life. Sci. World J. 2015, 2015, 261801. [Google Scholar] [CrossRef]
  7. Yang, J.R.; Yang, H.S.; Ahn, D.H.; Ahn, D.Y.; Sim, W.S.; Yang, H.E. Differences in gait patterns of unilateral transtibial amputees with two types of energy storing prosthetic feet. Ann. Rehabil. Med. 2018, 42, 609–616. [Google Scholar] [CrossRef]
  8. Hafner, B.J.; Sanders, J.E.; Czerniecki, J.; Fergason, J. Energy storage and return prostheses: Does patient perception correlate with biomechanical analysis? Clin. Biomech. 2002, 17, 325–344. [Google Scholar] [CrossRef]
  9. Chiriac, O.A.; Bucur, D. From conventional prosthetic feet to bionic feet. A review. In Proceedings of the International Conference of Mechatronics and Cyber-MixMechatronics—2020; Gheorghe, G.I., Ed.; Springer: Cham, Switzerland, 2020; pp. 130–138. [Google Scholar] [CrossRef]
  10. Jaegers, S.M.; Arendzen, J.H.; de Jongh, H.J. Prosthetic gait of unilateral transfemoral amputees: A kinematic study. Arch. Phys. Med. Rehabil. 1995, 76, 736–743. [Google Scholar] [CrossRef]
  11. Waters, R.L.; Mulroy, S. The energy expenditure of normal and pathologic gait. Gait Posture 1999, 9, 207–231. [Google Scholar] [CrossRef]
  12. Goujon-Pillet, H.; Sapin, E.; Fodé, P.; Lavaste, F. Three-dimensional motions of trunk and pelvis during transfemoral amputee gait. Arch. Phys. Med. Rehabil. 2008, 89, 87–94. [Google Scholar] [CrossRef] [PubMed]
  13. Segal, A.D.; Orendurff, M.S.; Klute, G.K.; McDowell, M.L.; Pecoraro, J.A.; Shofer, J.; Czerniecki, J.M. Kinematic and kinetic comparisons of transfemoral amputee gait using C-Leg and Mauch SNS prosthetic knees. J. Rehabil. Res. Dev. 2006, 43, 857–870. [Google Scholar] [CrossRef]
  14. Donnelley, C.A.; von Kaeppler, E.P.; Hetherington, A.; Shirley, C.; Haonga, B.T.; Challa, S.T.; Andrysek, J.; Lutyens, E.M.; Mamseri, L.; Mwakasungula, G.; et al. Cost-effectiveness analysis of prosthesis provision for patients with transfemoral amputation in Tanzania. Prosthet. Orthot. Int. 2022, 46, 523–531. [Google Scholar] [CrossRef]
  15. McGimpsey, G.; Bradford, T.C. Limb Prosthetics Services and Devices. Critical Unmet Need: Market Analysis; Bioengineering Institute Center for Neuroprosthetics Worcester Polytechnic Institution: Worcester, MA, USA, 2008; pp. 1–35. [Google Scholar]
  16. Winiarski, S.; Rutkowska-Kucharska, A.; Pozowski, A.; Aleksandrowicz, K. A new method of evaluating the symmetry of movement used to assess the gait of patients after unilateral total hip replacement. Appl. Bionics Biomech. 2019, 2019, 7863674. [Google Scholar] [CrossRef] [PubMed]
  17. Kowal, M.; Winiarski, S.; Gieysztor, E.; Kołcz, A.; Walewicz, K.; Borowicz, W.; Rutkowska-Kucharska, A.; Paprocka-Borowicz, M. Symmetry function in gait pattern analysis in patients after unilateral transfemoral amputation using a mechanical or microprocessor prosthetic knee. J. NeuroEng. Rehabil. 2021, 18, 9. [Google Scholar] [CrossRef]
  18. Winiarski, S.; Rutkowska-Kucharska, A.; Kowal, M. Symmetry function—An effective tool for evaluating the gait symmetry of trans-femoral amputees. Gait Posture 2021, 90, 9–15. [Google Scholar] [CrossRef]
  19. Kadaba, M.P.; Ramakrishnan, H.K.; Wootten, M.E. Measurement of lower extremity kinematics during level walking. J. Orthop. Res. 1990, 8, 383–392. [Google Scholar] [CrossRef]
  20. Davis, R.B.; Õunpuu, S.; Tyburski, D.; Gage James, R. A gait analysis data collection and reduction technique. Hum. Mov. Sci. 1991, 10, 575–587. [Google Scholar] [CrossRef]
  21. Fryzowicz, A.; Murawa, M.; Kabacinski, J.; Rzepnicka, A.; Dworak, L.B. Reference values of spatiotemporal parameters, joint angles, ground reaction forces, and plantar pressure distribution during normal gait in young women. Acta Bioeng. Biomech. 2018, 20, 9–57. [Google Scholar] [CrossRef]
  22. Pietraszewski, B.; Winiarski, S.; Jaroszczuk, S. Three-dimensional human gait pattern—Reference data for normal men. Acta Bioeng. Biomech. 2012, 4, 9–16. [Google Scholar]
  23. Rutkowska-Kucharska, A.; Kowal, M.; Winiarski, S. Relationship between asymmetry of gait and muscle torque in patients after unilateral transfemoral amputation. Appl. Bionics Biomech. 2018, 2018, 5190816. [Google Scholar] [CrossRef]
  24. Forczek, W.; Staszkiewicz, R. An evaluation of symmetry in the lower limb joints during the able-bodied gait of women and men. J. Hum. Kinet. 2012, 35, 47–57. [Google Scholar] [CrossRef]
  25. Loiret, I.; Villa, C.; Dauriac, B.; Bonnet, X.; Martinet, N.; Paysant, J.; Pillet, H. Are wearable insoles a validated tool for quantifying transfemoral amputee gait asymmetry? Prosthet. Orthot. Int. 2019, 43, 492–499. [Google Scholar] [CrossRef] [PubMed]
  26. Adamczyk, P.G.; Kuo, A.D. Mechanisms of gait asymmetry due to push-off deficiency in unilateral amputees. IEEE Trans. Neural. Syst. Rehabil. Eng. 2015, 23, 776–785. [Google Scholar] [CrossRef]
  27. Schaarschmidt, M.; Lipfert, S.W.; Meier-Gratz, C.; Scholle, H.C.; Seyfarth, A. Functional gait asymmetry of unilateral transfemoral amputees. Hum. Mov. Sci. 2012, 31, 907–917. [Google Scholar] [CrossRef]
  28. Yang, L.; Dyer, P.S.; Carson, R.J.; Webster, J.B.; Foreman, K.B.; Bamberg, S.J.M. Utilization of a lower extremity ambulatory feedback system to reduce gait asymmetry in transtibial amputation gait. Gait Posture 2012, 36, 631–634. [Google Scholar] [CrossRef] [PubMed]
  29. Seth, M.; Coyle, P.C.; Pohlig, R.T.; Beisheim, E.H.; Horne, J.R.; Hicks, G.E.; Sions, J.M. Gait asymmetry is associated with performance-based physical function among adults with lower-limb amputation. Physiother. Theory Pract. 2022, 38, 3108–3118. [Google Scholar] [CrossRef]
  30. Gorwa, J.; Kabaciński, J.; Murawa, M.; Śpikowska-Pawelec, W.; Fryzowicz, A. Is the symmetry of classical ballet positions perfect. Med. Probl. Perform. Art. 2023; accepted. [Google Scholar]
Figure 1. SF between the ILE side and the ULE side for ankle, knee, hip, and pelvic motion in sagittal plane in the gait cycle. The black and blue lines represent FP and DFP, respectively. Areas of +/−0% to 5%, +/−5% to 10%, and +/−10 to 15% SF are marked in grading shades of red (from the lightest to the darkest).
Symmetry 15 01595 g001
Figure 2. SF between the ILE side and the ULE side for hip and pelvic motion in the frontal and transverse plane in the gait cycle. The black and blue lines represent FP and DFP, respectively. Areas of +/−0% to 5%, +/−5% to 10%, and +/−10 to 15% SF are marked in grading shades of red (from the lightest to the darkest).
Symmetry 15 01595 g002
Table 1. The characteristics of the pseudonymized subjects, taking into account height, weight, age, cause and side of amputation, and the characteristics of orthopedic supplies.
SubjectsBody Height [m]Body Mass [kg]Age [Years]CauseTime Since Amputation [Years]Amputated SideSocket TypeProsthetic Foot
F11.7092.020Congenital Malformationbirth defectRightContact Shuttle LockSACH
F21.6089.061Trauma57LeftFull contactPacifica LP 23 FS4-00-03
M11.78100.249Trauma4LeftHarmony E2Ottobock 1C64 Triton HD
M21.8187.244Congenital Malformationbirth defectRightFull contact BOA systemOttobock 1C60 Triton
F—female; M—male.
Table 2. SF percentage distribution below the analyzed threshold (5%, 10%, and 15%) normalized to GC.
JointProsthesisF1F2M1M2
5%10%15%5%10%15%5%10%15%5%10%15%
Ankle
flexion extension
FP4162906281819445813
DFP1742690093820253754
Knee
flexion-extension
FP7204619437381831124355
DFP4192840758491317547784
Hip
flexion extension
FP397280577180254156173873
DFP6078883585100204351193974
Hip
ab-adduction
FP9141710242716345301117
DFP4812161739172124000
Hip
rotation
FP000258000000
DFP00000000071420
Pelvic
tilt
FP611179193051018257
DFP8122551016511163610
Pelvic
obliquity
FP000000223547000
DFP000122440162842000
Pelvic
rotation
FP081500043628131647
DFP00000020617801323
F—female; M—male; FP—foot prosthesis; DFP—dynamic foot prosthesis.
Table 3. Means and SDs (standard deviations) of SL, StP, and SwP of ILE and ULE for DFP and FP in four subjects.
ProsthesisF1F2M1M2
ILEULEILEULEILEULEILEULE
DFP
SL [m]0.60 ± 0.020.65 b ± 0.020.56 a ± 0.030.46 ± 0.020.60 c ± 0.020.67 b,c ± 0.020.78 a ± 0.020.73 ± 0.02
StP [%GC]58.8 ± 2.360.8 ± 4.360.1 ± 2.961.9 ± 1.662.3 ± 0.667.5 b ± 0.557.6 ± 1.960.6 c ± 2.3
SwP [%GC]41.2 ± 2.339.2 c ± 4.339.9 ± 2.938.1 ± 1.637.7 a ± 0.632.5 ± 0.542.4 ± 1.939.4 ± 2.3
FP
SL [m]0.58 ± 0.030.72 b,d ± 0.020.62 a,d ± 0.020.49 d ± 0.020.55 ± 0.020.63 b ± 0.030.81 a ± 0.030.74 ± 0.02
StP [%GC]59.4 ± 1.164.1 b,d ± 1.361.5 ± 1.261.1 ± 0.863.1 ± 0.968.0 b ± 1.058.6 ± 0.858.1 ± 1.0
SwP [%GC]40.6 a ± 1.135.9 ± 1.338.5 ± 1.238.9 ± 0.836.9 a ± 0.932.0 ± 1.041.4 ± 0.841.9 d± 1.0
F—female; M—male; ILE—involved lower extremity; ULE—uninvolved lower extremity; DFP—dynamic foot prosthesis; FP—foot prosthesis; SL—step length; StP—stance phase; SwP—swing phase; a—significantly greater values for ILE than ULE; b—significantly greater values for ULE than ILE; c—significantly greater values for DFP than FP; d—significantly greater values for FP than DFP.
Table 4. Means and SDs (standard deviations) of the minimum values of ankle, knee, hip, and pelvis angles in four subjects.
ProsthesisF1F2M1M2
ILEULEILEULEILEULEILEULE
DFP
AF [°]4.2 a ± 1.0−16.2 ± 1.8−3.7 ± 0.6−1.6 b ± 0.90.1 a ± 0.9−6.0 ± 1.5−4.5 a ± 0.4−19.1 ± 1.7
KF [°]23.4 a,c ± 1.76.5 ± 1.7−1.3 a ± 1.1−5.7 ± 1.4−5.0 ± 0.96.8 b,c ± 1.17.2 a,c ± 0.75.8 c ± 1.2
HF [°]14.1 c ± 2.113.9 c ± 1.5−8.5 ± 0.9−5.7 b c ± 0.7−4.1 ± 1.05.9 b,c ± 1.20.8 a,c ± 0.8−6.5 c ± 1.0
HA [°]−3.3 c ± 0.98.4 b,c ± 1.42.7 a,c ± 1.11.6 ± 0.7−0.5 ± 0.91.4 b ± 0.8−2.7 a,c ± 0.7−10.8 ± 0.7
HR [°]17.3 a ± 2.03.7 ± 0.9−6.8 ± 1.1−4.1 c ± 1.4−14.3 c ± 0.8−9.5 b ± 1.4−11.9 ± 1.26.3 b ± 1.6
PO [°]−7.4 ± 0.6−1.6 b ± 0.4−3.3 a,c ± 0.6−4.4 ± 0.5−2.8 ± 0.5−2.2 b ± 0.51.1 a,c ± 0.4−7.2 ± 0.6
PT [°]16.2 c ± 1.116.4 c ± 1.19.1 c ± 0.89.6 b, c ± 1.010.8 ± 0.710.8 ± 0.711.2 c ± 0.511.3 c ± 0.6
PR [°]−19.7 ± 2.2−6.2 b,c ± 1.6−17.5 ± 1.4−5.6 b ± 2.0−9.7 a,c ± 2.1−10.9 ± 1.4−12.7 ± 1.1−8.3 b ± 1.4
FP
AF [°]5.1 a,d ± 1.0−4.3 d ± 3.67.8 a,d ± 0.92.0 d ± 1.91.2 a,d ± 1.0−8.0 ± 5.9−0.5 a,d ± 0.7−13.3 d ± 2.8
KF [°]4.8 ± 3.512.3 b,d ± 1.77.2 a,d ± 2.11.7 d ± 1.8−3.0 d ± 2.12.9 b ± 15.2−4.8 ± 1.1−1.6 b ± 1.2
HF [°]−8.3 ± 2.6−2.6 b ± 0.8−7.8 a,d ± 1.4−8.3 ± 0.9−3.9 ± 0.83.4 b ± 8.2−8.8 a ± 1.4−14.0 ± 1.2
HA [°]−9.0 ± 1.0−1.5 b ± 0.90.9 ± 1.74.2 b,d ± 1.20.1 a,d ± 0.9−1.3 ± 7.3−6.6 a ± 0.9−10.8 ± 0.8
HR [°]24.7 a,d ± 6.83.4 ± 1.20.9 a,d ± 1.7−22.1 ± 8.3−17.4 ± 2.8−6.5 b,d ± 12.018.7 d ± 1.318.7 d ± 2.7
PO [°]−7.4 ± 0.70.3 b,d ± 0.4−4.3 ± 0.5−1.7 b,d ± 0.3−2.4 ± 0.5−2.4 ± 0.3−0.3 a ± 0.6−6.2 d ± 0.6
PT [°]4.2 ± 1.23.9 ± 0.96.2 ± 0.86.0 ± 0.610.8 ± 0.710.8 ± 0.68.8 ± 0.88.8 ± 0.7
PR [°]−19.6 ± 1.4−11.5 b ± 2.8−18.5 ± 3.4−6.6 b ± 2.4−11.3 ± 1.8−9.9 b ± 1.4−12.4 ± 0.8−8.9 b ± 1.1
F—female; M—male; ILE—involved lower extremity; ULE—uninvolved lower extremity; DFP—dynamic foot prosthesis; FP—foot prosthesis; AF—ankle flexion angle; KF—knee flexion angle; HF—hip flexion angle; HA—hip abduction angle; HR—hip rotation angle; PO—pelvis oblique angle; PT—pelvis tilt angle; PR—pelvis rotation; a—significantly greater values for ILE than ULE; b—significantly greater values for ULE than ILE; c—significantly greater values for DFP than FP; d—significantly greater values for FP than DFP.
Table 5. Means and SDs (standard deviations) of the maximum values of ankle, knee, hip, and pelvis angles in four subjects.
ProsthesisF1F2M1M2
ILEULEILEULEILEULEILEULE
DFP
AF [°]18.2 ± 0.818.8 ± 0.89.4 ± 0.320.0 b ± 0.917.2 c ± 0.519.8 b,c ± 0.613.5 a ± 0.311.4 ± 1.2
KF [°]57.7 c ± 2.766.2 b ± 1.660.2 a ± 1.255.1 ± 1.656.4 ± 2.370.5 b ± 1.164.4 ± 0.967.6 b,c ± 1.1
HF [°]58.2 a,c ± 1.252.5 ± 1.341.4 a ± 1.336.0 c ± 1.137.2 ± 0.840.9 b ± 1.346.3 a,c ± 0.842.6 c ± 1.0
HA [°]12.5 c ± 0.917.1 b,c ± 0.914.9 a,c ± 1.011.2 ± 1.08.5 ± 0.711.0 b ± 0.65.5 a,c ± 0.6−0.7 ± 1.1
HR [°]29.5 a ± 2.726.2 c ± 1.81.8 ± 0.75.7 b,c ± 0.92.4 ± 1.09.3 b ± 2.2−2.2 ± 0.821.7 b ± 1.2
PO [°]1.4 c ± 0.57.2 b ± 0.54.9 a,c ± 0.93.2 ± 0.51.9 ± 0.33.0 b,c ± 0.47.3 b,c ± 0.6−1.0 ± 0.6
PT [°]20.9 c ± 0.821.2 c ± 0.812.8 c ± 0.712.2 c ± 0.714.7 ± 0.514.6 ± 0.613.8 c ± 0.814.7 b,c ± 0.5
PR [°]6.7 ± 1.420.7 b ± 2.84.5 ± 1.717.6 b ± 1.311.0 a ± 1.49.5 ± 1.88.0 ± 1.412.2 b,c ± 1.2
FP
AF [°]20.8 d ± 1.025.5 b,d ± 1.127.3 a,d ± 1.223.7 d ± 1.816.2 ± 0.918.9 b ± 1.113.2 ± 0.521.2 b,d ± 1.1
KF [°]51.6 ± 2.663.6 b ± 2.561.3 a ± 0.955.8 ± 1.755.3 ± 1.866.8 b ± 17.164.7 a ± 2.152.2 ± 1.4
HF [°]34.8 ± 1.434.7 d ± 1.139.6 a ± 0.829.7 ± 1.337.3 ± 0.640.4 b ± 3.841.3 a ± 1.238.4 ± 0.5
HA [°]9.5 ± 0.911.5 b ± 0.310.8 ± 1.013.2 b,d ± 1.49.0 ± 0.910.1 b ± 2.93.3 a ± 0.60.4 d ± 1.0
HR [°]35.1 a,d ± 10.216.8 ± 0.817.5 a,d ± 1.5−7.9 ± 3.04.4 d ± 2.312.2 b,d ± 14.034.2 a,d ± 1.829.4 d ± 1.5
PO [°]0.0 ± 0.87.6 b ± 0.61.7 ± 0.64.2 b,d ± 0.52.2 d ± 0.32.6 b ± 0.56.4 a ± 0.51.0 d ± 0.9
PT [°]9.9 ± 1.09.4 ± 1.29.5 ± 0.69.1 ± 0.615.1 ± 0.714.9 ± 0.612.1 ± 0.912.7 ± 0.5
PR [°]11.6 d ± 1.620.0 b ± 2.97.4 d ± 2.720.2 b,d ± 3.210.6 ± 1.511.3 d ± 1.68.7 ± 1.311.5 b ± 0.7
F—female; M—male; ILE—involved lower extremity; ULE—uninvolved lower extremity; DFP—dynamic foot prosthesis; FP—foot prosthesis; AF—ankle flexion angle; KF—knee flexion angle; HF—hip flexion angle; HA—hip abduction angle; HR—hip rotation angle; PO—pelvis oblique angle; PT—pelvis tilt angle; PR—pelvis rotation; a—significantly greater values for ILE than ULE; b—significantly greater values for ULE than ILE; c—significantly greater values for DFP than FP; d—significantly greater values for FP than DFP.
Table 6. Means and SDs (standard deviations) of the range of motion for ankle, knee, hip, and pelvis angles in four subjects.
ProsthesisF1F2M1M2
ILEULEILEULEILEULEILEULE
DFP
AF [°]14.0 ± 0.534.9 b,c ± 1.413.1 ± 0.721.7 b ± 1.417.0 c ± 0.625.9 b ± 1.317.9 c ± 0.430.6 b ± 2.1
KF [°]34.3 ± 2.859.6 b,c ± 2.461.5 c ± 1.760.8 c ± 2.461.3 ± 2.363.7 ± 1.057.3 ± 1.461.8 b,c ± 1.6
HF [°]44.1 a ± 2.138.6 ± 2.149.9 a,c ± 1.741.7 c ± 0.941.4 a ± 1.035.0 ± 1.945.5 ± 1.149.0 ± 1.2
HA [°]15.8 a ± 1.28.7 ± 1.812.2 a,c ± 1.29.6 ± 0.69.0 ± 1.39.6 ± 0.78.2 ± 0.910.1 b ± 1.1
HR [°]12.2 ± 2.522.5 b,c ± 2.08.6 ± 1.39.8 ± 1.016.7 ± 1.318.8 b ± 2.49.7 ± 1.215.4 b,c ± 1.7
PO [°]8.8 c ± 0.78.8 c ± 0.58.3 a,c ± 1.07.6 c ± 0.64.8 ± 0.65.2 b ± 0.66.2 ± 0.56.3 ± 0.9
PT [°]4.6 ± 1.04.8 ± 1.23.7 a ± 0.92.7 ± 0.63.9 ± 0.63.7 ± 0.62.6 ± 0.73.4 b ± 0.5
PR [°]26.4 ± 2.526.9 ± 2.822.0 ± 2.023.2 ± 2.220.7 ± 2.720.4 ± 2.320.7 ± 1.820.5 ± 2.3
FP
AF [°]15.6 d ± 0.529.7 b ± 3.719.6 d ± 1.521.6 b ± 2.115.0 ± 1.826.9 b ± 5.113.6 ± 0.934.5 b,d ± 2.9
KF [°]46.8 d ± 1.551.3 b ± 4.154.1 ± 2.254.2 ± 3.258.3 ± 2.864.0 b ± 2.269.6 a,d ± 2.553.8 ± 2.2
HF [°]43.1 a ± 2.037.3 ± 1.747.4 a ± 1.938.0 ± 1.741.2 a ± 0.737.0 ± 4.850.1 d ± 2.252.4 d ± 1.4
HA [°]18.5 a,d ± 1.613.0 d ± 0.99.9 ± 1.19.0 ± 1.08.9 ± 0.911.5 b,d ± 4.59.9 d ± 1.111.2 b,d ± 1.6
HR [°]10.4 d ± 3.813.4 b ± 1.416.6 a,d ± 1.114.2 d ± 6.221.8 a,d ± 5.018.7 ± 3.015.6 a,d ± 2.310.7 ± 2.2
PO [°]7.4 ± 1.07.3 ± 0.76.0 ± 0.95.9 ± 0.74.6 ± 0.55.0 b ± 0.56.8 d ± 0.97.2 d ± 1.2
PT [°]5.8 d ± 0.95.5 d ± 0.73.4 ± 0.53.1 d ± 0.64.3 ± 0.74.1 ± 0.63.4 d ± 0.63.8 b,d ± 0.5
PR [°]31.2 d ± 1.831.5 d ± 3.525.9 d ± 2.926.9 d ± 5.021.9 ± 1.921.2 ± 2.521.1 ± 1.620.4 ± 1.2
F—female; M—male; ILE—involved lower extremity; ULE—uninvolved lower extremity; DFP—dynamic foot prosthesis; FP—foot prosthesis; AF—ankle flexion angle; KF—knee flexion angle; HF—hip flexion angle; HA—hip abduction angle; HR—hip rotation angle; PO—pelvis oblique angle; PT—pelvis tilt angle; PR—pelvis rotation; a—significantly greater values for ILE than ULE; b—significantly greater values for ULE than ILE; c—significantly greater values for DFP than FP; d—significantly greater values for FP than DFP.
Disclaimer/Publisher’s Note: The statements, opinions and data contained in all publications are solely those of the individual author(s) and contributor(s) and not of MDPI and/or the editor(s). MDPI and/or the editor(s) disclaim responsibility for any injury to people or property resulting from any ideas, methods, instructions or products referred to in the content.

