Abstract
The article describes the basic parts and the overall design of the laboratory machine, which can be used to measure vibrations generated by a rotating conveyor roller attached to the flattened parts of its axis in the cut-outs of the conveyor idler support. On the structurally modified support of the conveyor idler consisting of the insertion of a plastic element placed between the roller axis and the support cut-out, the vibration acceleration values of the rotating roller from symmetric analysis were measured and compared with the values from asymmetric analysis of the traditional roller axis placement in the steel support. The size of the peripheral speed of the roller was determined, during the experimental measurements, by controlling the speed of the electric motor using a frequency converter. The obtained results of the measured values of vibration velocities in three mutually perpendicular planes showed a reduction in vibration values of about 15% when using plastic holders. The paper aims to present one of the possible technical solutions that can limit the vibration values transmitted to the supporting structure of the conveyor belt, generated by the rotating casing of the conveyor roller.
Keywords:
laboratory machine; vibration; plastic holder; conveyor roller; support; cross bar; conveyor idler 1. Introduction
Vibrations [1,2,3,4] occur as a result of the dynamic forces excitation during the operation of any stationary [5] or mobile [6] machinery used in a number of industrial fields. Vibration is a mechanical phenomenon when oscillations (repeated movements) of the body occur acting around the equilibrium point (position), i.e., oscillation of rigid bodies or mass points.
When transporting bulk loose materials by belt conveyors [7,8,9] or piece materials using roller conveyors [10,11] in the course of work for these types of continuously working conveying equipment, there is a large number of rotating parts, which are the conveyor rollers [12]. During the operation of the belt conveyor, the conveyor roller is rotated by a force acting on the circumference of its casing from the moving conveyor belt. The circumferential speed of the roller vr [m·s−1] is identical to the speed of the conveyor belt movement v [m·s−1].
The conveyor belt is supported by conveyor rollers, which are placed in supports welded to the cross bars of the firm roller support [13]. It is known from practice that conveyor rollers (used to support the transmission element, which is the belt) of the conveyor belt vibrate [14,15]. The conveyor rollers’ vibrations grow with the increasing rotation speed of the rollers. At present, the axles of the conveyor rollers are placed in cut-outs made in steel supports of fixed roller supports. Connection with one degree of freedom between the roller axle and conveyor idler supports allows the roller to move in a vertical plane. The conveyor roller is allowed to move vertically at the moment when the dynamic force (generated by the centrifugal force of the rotating roller) is greater than the inherent weight of the conveyor roller and loads acting on the roller casing (proportional part of the weight of the conveyor belt and the weight of the transported material). The rotating casings of the conveyor rollers are therefore in tangent contact (if we neglect the pressing of the conveyor belt covering rubber into the conveyor roller casing) with a cover layer of the non-working side of the moving conveyor belt. Particles of transported material that have not been sufficiently removed by the wipers are glued to the casings of the conveyor rollers [16] from the working side of the conveyor belt driven by single or multi-drum driving stations. Uneven layers of dirt stuck to the casings of the conveyor rollers cause their vibration during the conveyor belt operation [17,18,19], resulting in noise generation [20,21] which has a subjectively unpleasant character. The noise of conveyor rollers caused by vibrations is manifested in belt conveyors both when the conveyor belt is loaded and unloaded by the material being transported.
An increase in transport performance [22,23] of continuously operating transport devices [24,25] can be ensured by increasing the circumferential speed of the drive drum (for a belt conveyor) or the drive rollers (for a roller conveyor). As a rule, an increase in the speed of rotation of conveyor rollers is accompanied by increased noise and vibration.
An obligation of manufacturers or distributors of machinery, which includes belt or roller conveyors, is to introduce safe products for the market in the European Union (Czech Republic). According to Directive 2006/42/EC (Government Regulation No. 176/2008 Coll.), the manufacturer or distributor must, among other things, inform the user in the instruction manual about the noise and vibration levels caused by the machinery.
Vibration and noise [26] arising during the transport of material are the result of several factors:
- (a)
- connection between roller and structure-the stable connection between roller and structure reduces the possibility of vibration,
- (b)
- material used-steel rollers produce stronger vibrations than rubber rollers, which dampen vibrations,
- (c)
- design error-incorrect calibration of the roller rotation can cause strong vibrations, which can lead to the destruction of the roller,
- (d)
- working environment-dusty or very humid areas can be the reason for rapid damage of bearings [27] or roller casing.
Yang et al. deal with diagnosis systems based on audio studied in the paper [28]. Audio data is collected from the belt conveyor by sensors, which is analysed using the stacked sparse encoders and convolutional neural network.
Skoczylas, A. et al. in the article [29] describe a method for detecting conveyor rollers failure based on an acoustic signal is described.
Fiset and Dussault describe in [30] that the rollers used to support belt conveyors deteriorate as a result of a three-body wear process in which ore particles become trapped between the belt and roller to create abrasive wear under slight stress. Therefore, when a roller blocks as the result of a change in a rolling motion, the combined action of the belt and abrasive particles transforms the steel roller into a sharp instrument that can cut the belt.
In the article [31] Zhao analyses two typical faults of the conveying roller on the belt conveyor (manufacturing quality of roller and sealed lubrication, and the use of maintenance) and describes the suitable maintenance methods for the prevention and elimination of failures to ensure the proper operation of belt conveyor.
In [32] Peng et al. a new intelligent fault diagnosis method for rollers is proposed, using audio wavelet packet decomposition and Convolutional Neural Networks (CNN). The wavelet packet decomposition algorithm is used to decompose the audio data of the rollers into several frequency bands. The lowest-frequency data are adjusted under consideration of the excessive energy proportion with the low-frequency data. Then, CNN is used to classify the features of each frequency band to diagnose rollers’ faults.
The authors Peruń and Opasiak present in the article [33] the results of preliminary studies, which aim at non-invasive qualification of technical state for belt conveyor rollers after a specified time of their exploitation. They carried out measurements of casing vibrations provided for a roller installed on a laboratory stand. The recorded vibration signals were then processed. Authors assume that the comparison of analysed results for new and worn rollers in the next stages will allow for determining the limit levels of vibroacoustics phenomena, exceeding which will qualify the roller for its replacement.
Tohov et al. in [34] monitored the service life of the conveyor rollers by studying the static and dynamic loads of individual pieces in the overburden of the cut in the Angren open pit. As a result of the research, a graph for the conveyor rollers’ service life dependence on the belt speed was obtained.
Jiang and Cao explore a new kind of automatic fault detection and identification method based on wavelet transform and BP neural network technology, through a de-noising method to extract fault feature sound improving system recognition accuracy in the paper [35].
Klimenda et al. in the article [36] deal with the noise and vibration measurement of rollers for belt conveyors. The article describes the measuring stand, the individual roller types which were measured, and the procedure for measuring the noise and vibrations of individual types of rollers.
Bombasaro and Oddera [37] carried out measurements to assess the force acting on the rollers for a large-diameter pipe conveyor. A special idler enclosing two dynamometers was designed and installed in the various roller positions. The forces on the rollers were metered while the conveyor was running with and without conveying material. The position of the two dynamometers was such allowing us to derive the theoretical contact point of the belt onto the roller. The measurements were carried out in a straight section of the pipe conveyor and the centre part of a horizontal curve.
An article [38] by Bortnowski et al. presents the detection of damage to rollers based on the transverse vibration signal measured on the conveyor belt. A solution was proposed for a wireless measuring device that moves with the conveyor belt along the route, which records the signal of transverse vibrations of the belt.
Vibration can be considered as a uniform oscillation and can be defined graphically by a plane curve sinusoid (or sine wave) Figure 1a. General sinusoid y(t) [m] (instantaneous value of deflection) as a function of time t [s] is described by the Equation (1).
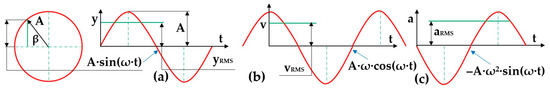
Figure 1.
Uniform oscillation, instantaneous and effective value of (a) deflection, (b) velocity, (c) acceleration over time t [s].
The effective value of deflection yRMS [m] [39] is the mean square value of the deflection A [m] per period, for the sine wave see (2), see Figure 1a. T [s] is a period that indicates the time t [s] of the duration for one repetition of this periodic process.
The effective value of deflection yRMS [m] (Figure 1a) for the periodic course of a sinusoidal wave, i.e., a plane curve describing uniform oscillation, gives the relation (3).
The instantaneous speed value v(t) [m·s−1], see Figure 1b as a function of time t [s] is described by the Equation (4). The effective value of vibration velocity vRMS [m·s−1] can be expressed according to the relationship (3), substituting for the symbol A the maximum speed value vmax [m·s−1].
2. Materials and Methods
Figure 2a presents the 3D design of the laboratory machine, which was developed using SolidWorks®Premium 2012 SP5.0 software at the Department of Machine and Industrial Design, Faculty of Mechanical Engineering, VSB-Technical University of Ostrava.
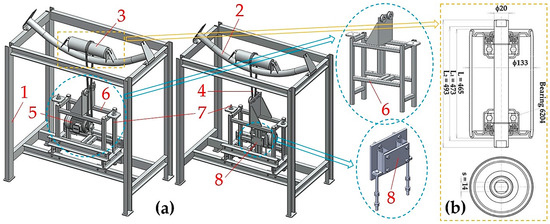
Figure 2.
(a) Laboratory machine design, (b) conveyor roller. 1—steel frame, 2—firm conveyor idler, 3—conveyor roller, 4—V-belt, 5—drive electric motor, 6—drive support frame, 7—threaded guide rods, 8—supporting device of the electric motor.
Laboratory machine (see Figure 3), manufactured by DvB-AF s.r.o. for noise measurement purposes [40,41], which emits a rotating conveyor roller into the surroundings) uses for spinning the conveyor rollers 3 electric motor 5 (type 1AL90L-4 [42], power Pe = 1.5 kW, revolutions ne = 1445 min−1). On the ϕ 24 mm shaft of the electric motor (with a tight spline 8 × 7 × 40 mm) a V-pulley with a calculated diameter dw = 90 mm is inserted, which transmits the tractive force of the drive by friction to two V-belts 4 (type SPZ 2500 Lw 9.7 × 2513 La L = L). The revolutions ne [min−1] of the electric motor 5 are controlled by a frequency converter (type YASKAWA VS-606 V7) [43].
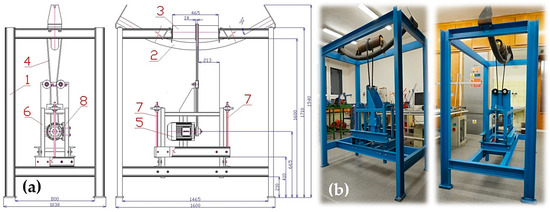
Figure 3.
Laboratory machine (a) 2D structural design, (b) implemented solution. 1—steel frame, 2—firm conveyor idler, 3—conveyor roller, 4—V-belt, 5—drive electric motor, 6—drive support frame, 7—threaded guide rods, 8—supporting device of the electric motor.
The conveyor roller 3 (see Figure 2b) with a steel coating (diameter Dr = 133 mm, length L = 465 mm) with the flattened parts at both ends of its axle (ϕ 20 mm) inserted into the cut-outs (width s = 14 mm) in supports (welded to the cross bars of circular cross-section) of the firm conveyor idler 2. On the conveyor roller casing 3 a steel wedge pulley with two V-grooves is placed (calculated diameter Dw = 163 mm), which is secured against sliding along the roller casing by weld.
The circumferential velocity vr [m·s—1] of the conveyor roller can be calculated according to relation (5), assuming that Dw [m] is the pitch diameter of the groove of the wedge pulley, which is mounted on the casing of the conveyor roller with diameter Dr [m].
Belt conveyors used for the transport of bulk materials use firm conveyor idlers in which the conveyor rollers are placed, with axles firmly seated in the cut-outs of the supports fixed on cross bars made of tubes or rolled sections, see Figure 4b. To reduce the structure height of the central parts and the roll moment of conveyor idlers, the cross bars are curved, and they are usually screwed to the central parts. Firm conveyor idlers in the upper (working) run of the belt conveyor are most often made as a three-roller with the same length of rollers.
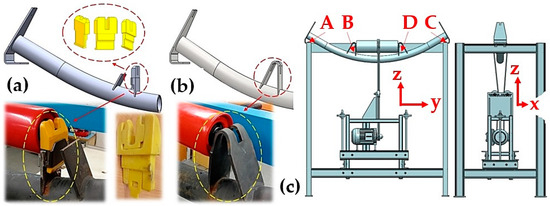
Figure 4.
Placement of the conveyor roller axle in the support cut-out welded to the cross bar of the firm conveyor idler, (a) plastic roller holder, (b) plastic roller holder, (c) coordinate system and measuring points A–D. Sensor position A—left side, B—left middle side, C—right side, D—right middle side.
The laboratory device, see Figure 3b, is used to compare the effective speed values for vibration during rotating at different circumferential speeds vr [m·s−1] (5) on the conveyor roller (design see in Figure 2b), which is placed in the support of a firm conveyor idler (Figure 4). As already mentioned, at present, the end parts of the axles for each conveyor roller placed in common belt conveyors are firmly seated in the support cut-outs, and these supports are welded on the cross bar of the firm conveyor idler, see Figure 4b.
The new solution for this conveyor idler described in this article is a new design, which introduces a plastic member between the roller axle and the support, see Figure 4a.
Experimental measurements carried out in the Laboratory of Research and Testing, at the Department of Machine and Industrial Design, Faculty of Mechanical Engineering, VSB-Technical University of Ostrava, provided on the above-mentioned laboratory device, aimed to confirm or disprove the assumption that the vibrations transmitted from the rotating conveyor roller through the traditional steel support (Figure 4b), or the support with a plastic holder (Figure 4a) into the cross bar of the firm conveyor idler and also into the steel frame of the laboratory machine can be reduced. They simulate the conveyor run of a real belt conveyor.
Vibration generated by rotating conveyor roller 3, transmitted to the cross bar of the firm roller support 2 and the steel frame 1, were detected by two acceleration sensors PCE KS903.10 [44], see Figure 5. During measurements, signals from these acceleration sensors were recorded by a measuring apparatus Dewesoft SIRIUSi-HS 6xACC, 2xACC+ [45]. The time records of the measured values were transformed by the measuring apparatus into the effective values of the broadband speed [mm·s−1] in the range of 10–1·104 Hz (this frequency range is applied to the ISO standard 10816-3 [46]). Effective speed values *RMS [mm·s−1] for the periodic courses were displayed on the PS monitor using the Dewesoft X (the version No. 10) measuring software.
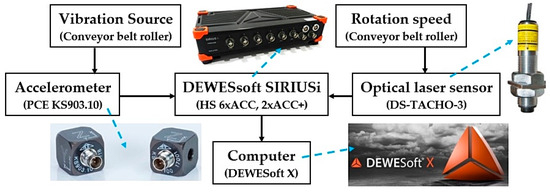
Figure 5.
Components used to detect, and record measured vibration values of a rotating roller on a laboratory machine.
3. Results
To dampen vibrations produced during experimental tests, the laboratory machine support bars (see Figure 3b) are equipped with elastic pads (material used ELASTON-ELTEC FS 700, 8 mm thickness) and they are anchored with bolts to the lab floor, located on the ground floor of the building.
The tested conveyor roller (casing diameter 133 mm, casing length 465 mm), with a V-pulley fitted on its casing, was placed behind its axle into the support cut-outs on the cross bar of one of the two firm conveyor idlers.
One conveyor idler used in experimental testing was of the standard design and the other one was of an atypical design. The atypical design consists of the modification of supports fitted with plastic holders, into whose cut-outs those flattened parts are inserted (with width s = 14 mm, length (L2 − L1)/2 = 10 mm, see Figure 2b) for both ends of the axle (the total length of L2 = 493 mm) of the conveyor roller.
The conveyor roller 3 (see Figure 3a) is rotated using two V-belts 4, the speed of which is derived from the speed of the driving electric motor 6, which is set to the required value by a frequency converter [43].
Table 1 shows the effective vibration values *RMS(k) [mm·s–1] that have been detected by a vibration sensor fixed in place j = A (see Figure 4c), by measuring apparatus SIRIUSi-HS in individual coordinate axes (* = x, or y, or z), see Figure 4c, on the cross bar of the firm conveyor idler, for variant—steel support, when controlling the speed of the electric motor by a frequency converter in the range of k = 10–50 Hz.

Table 1.
Placement of the roller axles into the steel support, measuring point A, the speed of the electric motor controlled by a frequency converter in the range of 10–50 Hz.
In Figure 6 at the top left, a time record of the measured effective values of the vibration rate *RMS(k) [mm·s−1] is given (see Table 1) for conveyor roller speed nr [min−1], which were set by controlling the drive electric motor using a frequency converter. Effective speed values for vibrations given in Figure 6 are values measured using a vibration sensor mounted in place A (see Figure 4c).
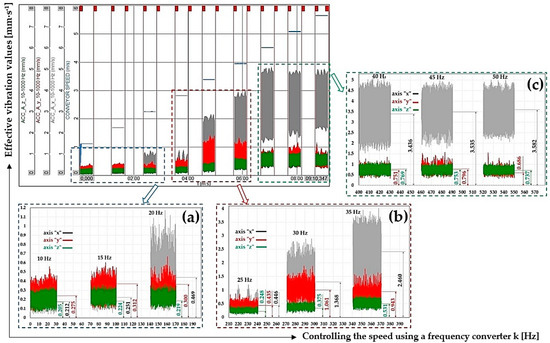
Figure 6.
Steel support, measuring point A, values of the difference in effective vibration values at (a) 10–20 Hz, (b) 25–35 Hz, (c) 40–50 Hz.
Figure 6a displays effective values of vibration speeds *RMS(k) [mm·s−1] (see Table 1) when controlling the speed of the electric motor by a frequency converter in the range of k = 10–20 Hz.
Figure 6b presents effective values of vibration speed *RMS(k) [mm·s−1] (see Table 1) when controlling the speed of the electric motor by a frequency converter in the range of k = 25–35 Hz.
Effective values of vibration speed *RMS(k) [mm·s−1] (see Table 1) when controlling the speed of the electric motor using a frequency converter in the range of k = 25–35 Hz are listed in Figure 6c.
Table 2 shows the effective vibration values *RMS(k) [mm·s−1] that have been detected by a vibration sensor fixed in place j = B (see Figure 4c), by measuring apparatus SIRIUSi-HS in individual coordinate axes (* = x, or y, or z), see Figure 4b, on the cross bar of the firm conveyor idler, for variant—steel support, when controlling the speed of the electric motor by a frequency converter in the range of k = 10–50 Hz.
Table 2.
Placement of the roller axles into the steel support, measuring point B, the speed of the electric motor controlled by a frequency converter in the range of 10–50 Hz.
In Figure 7 at the top left, a time record of the measured effective values of the vibration rate *RMS(k) [mm·s−1] is given (see Table 2) for conveyor roller speed nr [min−1], which were set by controlling the drive electric motor using a frequency converter. Effective speed values for vibrations given in Figure 7 are values measured using a vibration sensor mounted in place A (see Figure 4b).
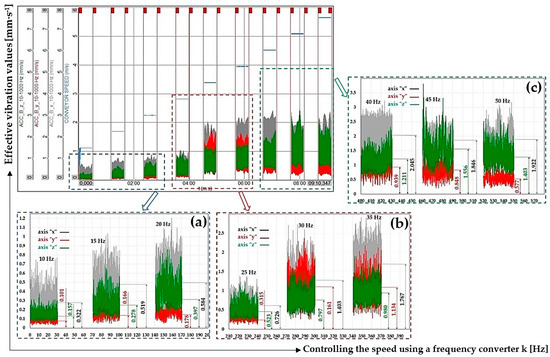
Figure 7.
Steel support, measuring point B, values of the difference in effective vibration values at (a) 10–20 Hz, (b) 25–35 Hz, (c) 40–50 Hz.
Figure 7a displays effective values of vibration speeds *RMS(k) [mm·s−1] (see Table 2) when controlling the speed of the electric motor by a frequency converter in the range of k = 10–20 Hz.
Figure 7b presents effective values of vibration speed *RMS(k) [mm·s−1] (see Table 1) when controlling the speed of the electric motor by a frequency converter in the range of k = 25–35 Hz.
Effective values of vibration speed *RMS(k) [mm·s−1] (see Table 2) when controlling the speed of the electric motor using a frequency converter in the range of k = 25–35 Hz are listed in Figure 7c.
Table 3 shows the effective vibration values *RMS(k) [mm·s−1] that have been detected by a vibration sensor fixed in place j = C (see Figure 4c), by measuring apparatus SIRIUSi-HS in individual coordinate axes (* = x, or y, or z), see Figure 4b, on the cross bar of the firm conveyor idler, for variant—steel support, when controlling the speed of the electric motor by a frequency converter in the range of k = 10–50 Hz.
Table 3.
Placement of the roller axles into the steel support, measuring point C, the speed of the electric motor controlled by a frequency converter in the range of 10–50 Hz.
Figure 8 presents a time record of the measured effective values of the vibration speed *RMS(k) [mm·s−1] (see Table 3) for the revolutions of the transport roller nr [min−1], which were set by controlling the driving electric motor with a frequency converter. The effective values of the vibration speed shown in Figure 8 are the values that were measured by the vibration sensor fixed at C (the upper side profile of the steel structure of the laboratory machine, see Figure 4b).
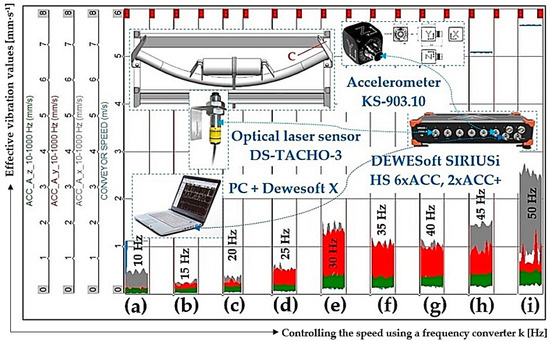
Figure 8.
Steel support, measuring point C, (a) 10 Hz, (b) 15 Hz, (c) 20 Hz, (d) 25 Hz, (e) 30 Hz, (f) 35 Hz, (g) 40 Hz, (h) 45 Hz, (i) 50 Hz.
Table 4 shows the effective vibration values *RMS(k) [mm·s−1] that have been detected by a vibration sensor fixed in place j = D (see Figure 4c), by measuring apparatus SIRIUSi-HS in individual coordinate axes (* = x, or y, or z), see Figure 4b, on the cross bar of the firm conveyor idler, for variant—steel support, when controlling the speed of the electric motor by a frequency converter in the range of k = 10–50 Hz.
Table 4.
Placement of the roller axles into the steel support, measuring point D, the speed of the electric motor controlled by a frequency converter in the range of 10–50 Hz.
Figure 9 presents a time record of the measured effective values of the vibration speed *RMS(k) [mm·s−1] (see Table 4) for the revolutions of the transport roller nr [min−1], which were set by controlling the driving electric motor with a frequency converter. The effective values of the vibration speed shown in Figure 9 are the values that were measured by the vibration sensor fixed at C (the upper side profile of the steel structure of the laboratory machine, see Figure 4b).
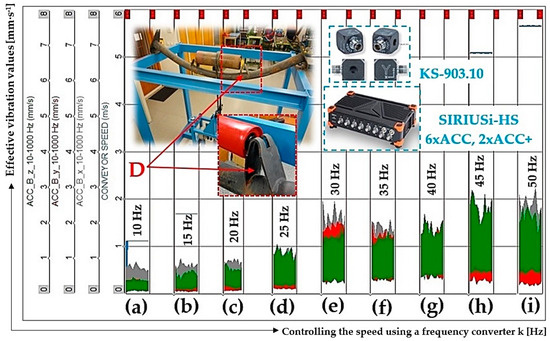
Figure 9.
Steel support, measuring point D, (a) 10 Hz, (b) 15 Hz, (c) 20 Hz, (d) 25 Hz, (e) 30 Hz, (f) 35 Hz, (g) 40 Hz, (h) 45 Hz, (i) 50 Hz.
Table 5 shows the effective vibration values *RMS(k) [mm·s−1] that have been detected by a vibration sensor fixed in place j = A (see Figure 4c), by measuring apparatus SIRIUSi-HS in individual coordinate axes (* = x, or y, or z), see Figure 4a, on the cross bar of the firm conveyor idler, for variant—plastic support, when controlling the speed of the electric motor by a frequency converter in the range of k = 10–50 Hz.
Table 5.
Placement of roller axle in plastic support, measuring point A, the speed of the electric motor controlled by a frequency converter in the range of 10–50 Hz.
In Figure 10 at the top left, a time record of the measured effective values of the vibration rate *RMS(k) [mm·s−1] is given (see Table 5) for conveyor roller speed nr [min−1], which were set by controlling the drive electric motor using a frequency converter. Effective speed values for vibrations given in Figure 10 are values measured using a vibration sensor mounted in place A (see Figure 4b).
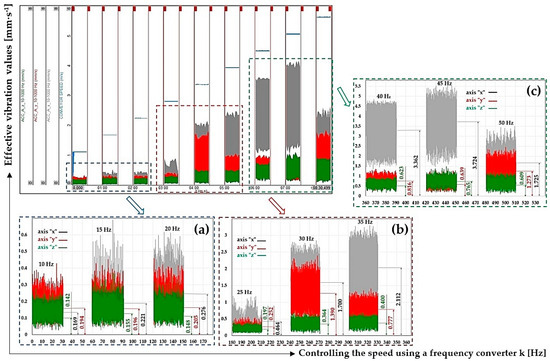
Figure 10.
Plastic support, measuring point A, values of the difference in effective vibration values at (a) 10–20 Hz, (b) 2 5–35 Hz, (c) 40–50 Hz.
Figure 10a displays effective values of vibration speeds *RMS(k) [mm·s−1] (see Table 5) when controlling the speed of the electric motor by a frequency converter in the range of k = 10–20 Hz.
Figure 10b presents effective values of vibration speed *RMS(k) [mm·s−1] (see Table 5) when controlling the speed of the electric motor by a frequency converter in the range of k = 25–35 Hz.
Effective values of vibration speed *RMS(k) [mm·s−1] (see Table 5) when controlling the speed of the electric motor using a frequency converter in the range of k = 25–35 Hz are listed in Figure 10c.
Table 6 shows the effective vibration values *RMS(k) [mm·s−1] that have been detected by a vibration sensor fixed in place j = B (see Figure 4c), by measuring apparatus SIRIUSi-HS in individual coordinate axes (* = x, or y, or z), see Figure 4a, on the cross bar of the firm conveyor idler, for variant—plastic support, when controlling the speed of the electric motor by a frequency converter in the range of k = 10–50 Hz.
Table 6.
Placement of roller axle in plastic support, measuring point B, the speed of the electric motor controlled by a frequency converter in the range of 10–50 Hz.
In Figure 11 at the top left, a time record of the measured effective values of the vibration rate *RMS(k) [mm·s−1] is given (see Table 6) for conveyor roller speed nr [min−1], which were set by controlling the drive electric motor using a frequency converter. Effective speed values for vibrations given in Figure 11 are values measured using a vibration sensor mounted in place B (see Figure 4c).
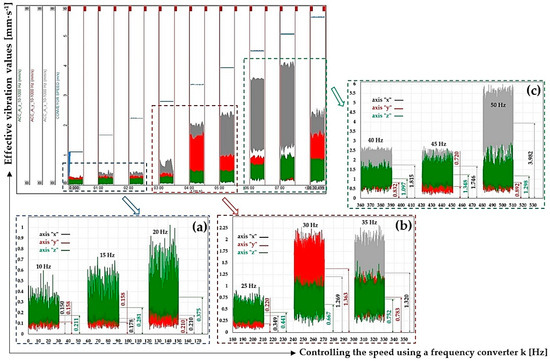
Figure 11.
Plastic support, measuring point B, values of the difference in effective vibration values at (a) 10–20 Hz, (b) 2 5–35 Hz, (c) 40–50 Hz.
Figure 11a displays effective values of vibration speeds *RMS(k) [mm·s−1] (see Table 6) when controlling the speed of the electric motor by a frequency converter in the range of k = 10–20 Hz.
Figure 11b presents effective values of vibration speed *RMS(k) [mm·s−1] (see Table 6) when controlling the speed of the electric motor by a frequency converter in the range of k = 25–35 Hz.
Effective values of vibration speed *RMS(k) [mm·s−1] (see Table 6) when controlling the speed of the electric motor using a frequency converter in the range of k = 25–35 Hz are listed in Figure 11c.
Table 7 shows the effective vibration values *RMS(k) [mm·s−1] that have been detected by a vibration sensor fixed in place j = C (see Figure 4c), by measuring apparatus SIRIUSi-HS in individual coordinate axes (* = x, or y, or z), see Figure 4b, on the cross bar of the firm conveyor idler, for variant—plastic support, when controlling the speed of the electric motor by a frequency converter in the range of k = 10–50 Hz.
Table 7.
Placement of roller axle in plastic support, measuring point C, the speed of the electric motor controlled by a frequency converter in the range of 10–50 Hz.
Figure 12 presents a time record of the measured effective values of the vibration speed *RMS(k) [mm·s−1] (see Table 7) for the revolutions of the transport roller nr [min−1], which were set by controlling the driving electric motor with a frequency converter. The effective values of the vibration speed shown in Figure 12 are the values that were measured by the vibration sensor fixed at C (the upper side profile of the steel structure of the laboratory machine, see Figure 4c).
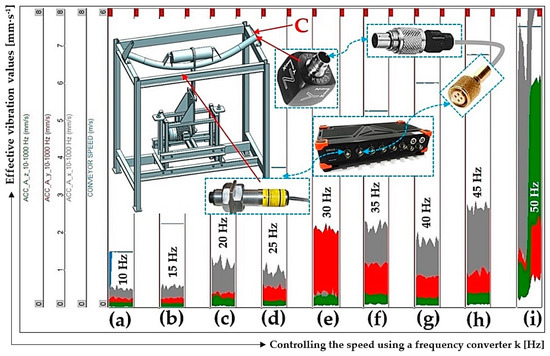
Figure 12.
Plastic support, measuring point C, (a) 10 Hz, (b) 15 Hz, (c) 20 Hz, (d) 25 Hz, (e) 30 Hz, (f) 35 Hz, (g) 40 Hz, (h) 45 Hz, (i) 50 Hz.
Table 8 shows the effective vibration values *RMS(k) [mm·s−1] that have been detected by a vibration sensor fixed in place j = D (see Figure 4c), by measuring apparatus SIRIUSi-HS in individual coordinate axes (* = x, or y, or z), see Figure 4a, on the cross bar of the firm conveyor idler, for variant—plastic support, when controlling the speed of the electric motor by a frequency converter in the range of k = 10–50 Hz.
Table 8.
Placement of roller axle in plastic support, measuring point D, the speed of the electric motor controlled by a frequency converter in the range of 10–50 Hz.
Figure 13 presents a time record of the measured effective values of the vibration speed *RMS(k) [mm·s−1] (see Table 8) for the revolutions of the transport roller nr [min−1], which were set by controlling the driving electric motor with a frequency converter. The effective values of the vibration speed shown in Figure 13 are the values that were measured by the vibration sensor fixed at C (the upper side profile of the steel structure of the laboratory machine, see Figure 4c).
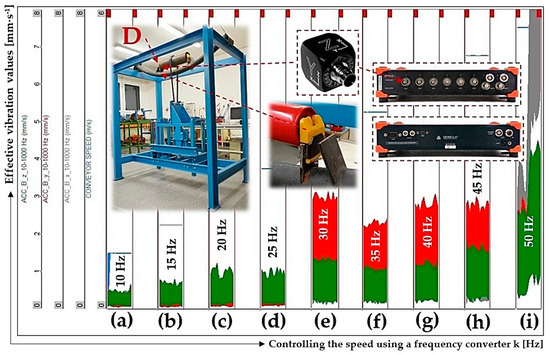
Figure 13.
Plastic support, measuring point D, (a) 10 Hz, (b) 15 Hz, (c) 20 Hz, (d) 25 Hz, (e) 30 Hz, (f) 35 Hz, (g) 40 Hz, (h) 45 Hz, (i) 50 Hz.
4. Discussion
Experimental measurements provided using measuring apparatus (see Figure 5) on a laboratory machine (see Figure 3b) aimed to verify if vibrations (caused by rotating roller and transmitted to the cross bar of the conveyor idler, see Figure 2a), will reach lower values when a plastic holder is inserted into the contact surface between the roller axle and the cut-out of the support.
From Figure 14, it is clear that effective vibration values in individual coordinate axes, i.e., *RMS [mm·s−1], measured at point A, see Figure 4c, grow with increasing speed vr [m·s−1] of the conveyor roller rotation, the axle of which is mounted in a steel or plastic support.
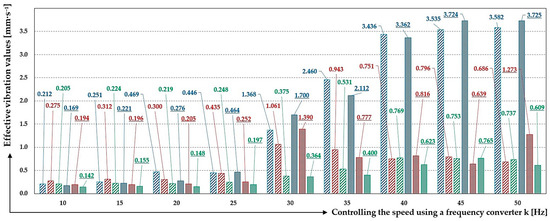
Figure 14.
Effective vibration values *RMS [mm·s−1] measured at point A when the roller axle is placed in a steel and plastic support. Steel support:  xRMS,
xRMS,  yRMS,
yRMS,  zRMS, plastic support:
  xRMS,
xRMS,  yRMS,
yRMS,  zRMS.
zRMS.
xRMS, yRMS, zRMS, plastic support: xRMS, yRMS, zRMS.
The highest absolute values of the difference in effective vibrations values for the x-axis in point A were reached at the set frequency of k = 35 Hz (using a frequency converter controlling the speed of the electric motor) ΔxRMS = 0.348 mm·s−1. The lowest absolute values of the difference in effective vibrations values for the x-axis in point A were reached at the set frequency of k = 25 Hz ΔxRMS = 0.018 mm·s−1.
The maximum absolute values of the difference in effective vibrations values for the y-axis in point A (were achieved at the set frequency k = 50 Hz (on a frequency converter controlling the speed of the electric motor) ΔxRMS = 0.587 mm·s−1. The lowest absolute values of the difference in effective vibrations values for the y-axis in point A ΔxRMS = 0.065 mm·s−1 were achieved at the set frequency of k = 40 Hz.
The highest absolute values of the difference in effective vibrations values for the z-axis in point A were achieved at the set frequency of k = 40 Hz (on a frequency converter controlling the speed of the electric motor) ΔxRMS = 0.146 mm·s−1. The lowest absolute values of the difference in effective vibrations values for the z-axis in point A were achieved at the set frequency of k = 30 Hz ΔxRMS = 0.011 mm·s−1.
If we compare the measured effective values of vibration rates in individual coordinate axes *RMS(k) [mm·s−1] (Figure 14), recorded in point A (Figure 4c), i.e., in the upper surface of the steel structure profile, listed in Table 1 for steel support (Figure 4b) and Table 5 for plastic support (Figure 4a), it can be stated that the vibration speed values measured for the plastic support were lower than the vibration speed values measured on the steel support.
Similarly, lower values of vibration speeds showed measurements of results listing effective vibration speed values *RMS(k) [mm·s−1] for plastic support, if the vibration sensor was placed in point C (Figure 4c), i.e., in the upper surface of the steel structure profile, listed in Table 3 for steel support and Table 7 for plastic support.
From Figure 15, it is clear that effective vibration values in individual coordinate axes, i.e., *RMS [mm·s−1], measured at point B, see Figure 4c, grow with increasing speed vr [m·s−1] of the conveyor roller rotation, the axle of which is mounted in a steel or plastic support.
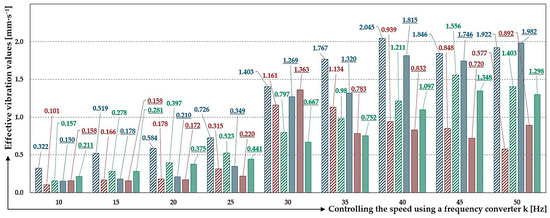
Figure 15.
Effective vibration values *RMS [mm·s−1] measured at point C when placing the roller axle in a steel and plastic support. Steel support: xRMS, yRMS, zRMS, plastic support: xRMS, yRMS, zRMS.
xRMS, yRMS, zRMS, plastic support: xRMS, yRMS, zRMS.
A more drastic drop (related to point A, i.e., to the place of the support attachment to the cross bar of the firm conveyor idler, see the values listed in Figure 14) of effective values for vibration speed in individual coordinate axes *RMS(k) [mm·s−1], were recorded for vibrations with plastic support (see Table 2 for steel support and Table 6 for plastic support), when the acceleration sensor was placed in point B (Figure 4c).
The highest absolute values of the difference in effective vibrations values for the x-axis in point B were reached at the set frequency of k = 35 Hz (using a frequency converter controlling the speed of the electric motor) ΔxRMS = 0.447 mm·s−1. The lowest absolute values of the difference in effective vibrations values for the x-axis in point B were reached at the set frequency of k = 50 Hz ΔxRMS = 0.060 mm·s−1.
The maximum absolute values of the difference in effective vibrations values for the y-axis in point B (were achieved at the set frequency k = 35 Hz (on a frequency converter controlling the speed of the electric motor) ΔxRMS = 0.351 mm·s−1. The lowest absolute values of the difference in effective vibrations values for the y-axis in point B ΔxRMS = 0.006 mm·s−1 were achieved at the set frequency of k = 40 Hz.
The highest absolute values of the difference in effective vibrations values for the z-axis in point B were achieved at the set frequency of k = 35 Hz (on a frequency converter controlling the speed of the electric motor) ΔxRMS = 0.228 mm·s−1. The lowest absolute values of the difference in effective vibrations values for the z-axis in point B were achieved at the set frequency of k = 15 Hz ΔxRMS = 0.003 mm·s−1.
Lower effective values of vibrations speed *RMS(k) [mm·s−1] were recorded for plastic support, when the vibration sensor was placed in point D (Figure 4c), i.e., at the point of support attachment to the cross bar of the firm conveyor idler, listed in Table 4 for steel support and in Table 8 for plastic one.
In Figure 16, the effective values of vibration speeds *RMS(k) [mm·s−1] in individual coordinate axes are compared, measured for steel support (Figure 4b), recorded at point A (Figure 4c, see Table 1) and at the point B (Figure 4c, Table 2), of the laboratory machine (Figure 3b).
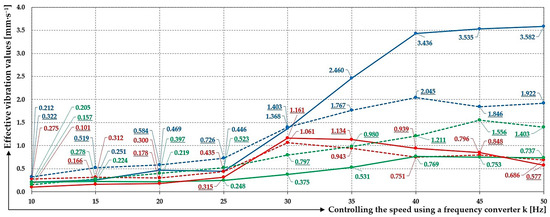
Figure 16.
Effective vibration values *RMS [mm·s−1] measured with the roller axle placed in steel support for measuring points A and B. Measuring point A:  xRMS,
xRMS,  yRMS,
yRMS,  zRMS, measuring point B:
  xRMS,
xRMS,  yRMS,
yRMS,  zRMS.
zRMS.
xRMS, yRMS, zRMS, measuring point B: xRMS, yRMS, zRMS.
Time course curves of vibration speed values for measurement point A and B listed in Figure 16, are similar in individual coordinate axes *RMS(k) [mm·s−1]. The maximum deviation in measured values for vibrations speeds taken at measuring points A (see Table 1) and B (see Table 2) was calculated for ΔxRMS(45) = 1.689 mm·s−1, ΔyRMS(35) = 0.191 mm·s−1 a ΔzRMS(45) = 0.803 mm·s−1 (nejnižší ΔxRMS(30) = 0.035 mm·s−1, ΔyRMS(45) = 0.052 mm·s−1 a ΔzRMS(10) = 0.048 mm·s−1).
In Figure 17, the effective values of vibration speeds *RMS(k) [mm·s−1] in individual coordinate axes are compared, measured for steel support (Figure 4a), recorded at point A (Figure 4c, see Table 5) and at the point B (Figure 4c, Table 6), of the laboratory machine (Figure 3b).
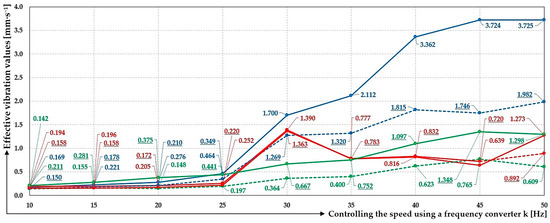
Figure 17.
Effective vibration values *RMS [mm·s−1] measured with the roller axle placed in plastic support for measuring points A and B. Measuring point A: xRMS, yRMS, zRMS, measuring point B: xRMS, yRMS, zRMS.
xRMS, yRMS, zRMS, measuring point B: xRMS, yRMS, zRMS.
Time course curves of vibration speed values for measurement point A and B listed in Figure 17, are similar in individual coordinate axes *RMS(k) [mm·s−1]. The maximum deviation in measured values for vibrations speeds taken at measuring points A (see Table 5) and B (see Table 6) was calculated for ΔxRMS(10) = 1.978 mm·s−1, ΔyRMS(50) = 0.381 mm·s−1 a ΔzRMS(50) = 0.803 mm·s−1 (the lowest ΔxRMS(10) = 0.019 mm·s−1, ΔyRMS(35) = 0.006 mm·s−1 a ΔzRMS(10) = 0.069 mm·s−1).
The recent advances on uncertainties in sensitivity of global structural parameters should be referred including [47,48].
The field of technical diagnostics called vibrodiagnostics helps in the care of all machines and their mechanical parts. High-quality vibrodiagnostics is an essential part of maintenance systems and at the same time a guarantee of trouble-free and safe operation of all possible machines and machinery. Vibration diagnostics are described in detail by the standards CSN ISO 13373-1 [49] and CSN ISO 13373-2 [50].
Vibration measurements [51] of a belt conveyor driven by six rollers (in two versions) showed that the precision tube rollers smeared less on the rack structure, resulting in lower final noise.
The study [52] shows that the operational wear of rollers effects on the level and structure of the generated vibrations. From the diagnostic point of view, the most useful frequency band is 6–8 kHz. Additional laboratory tests carried out on rollers, which characterize new, presented in article construction, has shown that, despite the significant differences seen in the vibration signal caused by the occurrence of wear, they still have a low static and dynamic resistance to rotation. Small values of resistance were also confirmed by measurements of the energy consumption of the conveyor drive carried out at each stage of the research.
5. Conclusions
The purpose of the article was to provide basic information with a description of the key parts of the designed laboratory machine, which allows to detection of vibrations of a rotating conveyor roller.
Using the laboratory device, measurements of effective vibrations speed values were taken at different rotation speeds of the conveyor roller with a diameter of 133 mm and a length of casing of 465 mm. Vibrations in three mutually perpendicular planes were detected using two acceleration sensors. The measured values of the vibration velocity were recorded by the measuring apparatus DEWESoft. By the V-belt, the roller casing rotated at a speed that was set to the required size using a frequency converter, which controlled the speed of the driving electric motor.
Experimental vibration measurements provided on a laboratory machine were carried out for two variants of placement (steel and plastic) of flattened ends of the conveyor roller axis into the support of a firm conveyor idler. In the first variant, the flattened end part of the conveyor roller axle is inserted into the cut-outs of the steel support of the firm conveyor idler. The second variant uses, unlike the first variant, plastic holders, which are inserted between the axle of the conveyor roller and a specially designed conveyor idler support.
Based on the experimental measurements, it was proved to reduce vibrations transmitted from the rotating casing of the conveyor roller to the firm conveyor idler, when the axle of the roller was placed in plastic holders.
Since vibrations adversely affect the operation of machines, including smoothly working transport equipment using conveyor rollers, we consider the knowledge of the value of deflection, speed or acceleration of vibration obtained by measurement to be necessary to be able to monitor the condition of machines and their subsequent diagnostics. The vibration signal carries information about the cause of the vibration and by analysing it using various methods, it is possible to detect an emerging or developing defect.
It is intended to carry out more extensive experimental measurement analyses on this laboratory machine, the purpose of which is to obtain vibration values of conveyor rollers with steel or plastic casing, or rubberized casing, for the diameters of 133, 108 and 89 mm.
The academic contribution can be traced in particular to the design and assembly of the laboratory machine, which can be used to measure vibrations generated by a rotating conveyor roller attached to the flattened parts of its axis in the cut-outs of the conveyor idler support.
A non-negligible part of the academic contribution is structurally modified support of the conveyor idler consisting of the insertion of a plastic element (see Figure 1) placed between the roller axis and the support cut-out, the vibration acceleration values of the rotating roller were measured and compared with the values of the traditional roller axis placement in the steel support.
A key part of academic contribution is measurements of effective vibrations speed values were taken at different rotation speeds of the conveyor roller with a diameter of 133 mm and a length of casing of 465 mm. Vibrations in three mutually perpendicular planes were detected using two acceleration sensors. The measured values of the vibration velocity were recorded by the measuring apparatus DEWESoft.
Author Contributions
Conceptualization, L.H. and Š.P.; methodology, L.H.; software, Š.P.; validation, E.N., R.Š. and D.K.; formal analysis, R.Š.; investigation, L.H.; resources, D.K.; data curation, E.N.; writing—original draft preparation, L.H.; writing—revie and editing, L.H.; visualization, L.H.; supervision, R.Š.; project administration, L.H.; funding acquisition, L.H. All authors have read and agreed to the published version of the manuscript.
Funding
This research was funded by “Research and innovation of modern processes and technologies in industrial practice”, grant number SP2023/003 and was funded by MŠMT ČR (Ministry of education youth and sports).
Data Availability Statement
Measured data of effective vibration speed values *RMS(k) [mm·s−1], listed from Table 1, Table 2, Table 3, Table 4, Table 5, Table 6, Table 7 and Table 8 and processed using DEWESoft X software version No. 10, can be sent in case of interest, by prior written agreement, in *.XLSX (Microsoft Excel) format.
Acknowledgments
This work has been supported by the Ministry of Education, Youth and Sports of the Czech Republic from the Specific Research Project SP2023/003 (SV3403351).
Conflicts of Interest
The authors declare no conflict of interest.
References
- Vance, J.M.; Zeidan, F.Y.; Murphy, B.G. Machinery Vibration and Rotordynamics; John Wiley & Sons: Hoboken, NJ, USA, 2010. [Google Scholar]
- Dresig, H.; Holzweißig, F. Dynamics of Machinery: Theory and Applications; Springer Science & Business Media: Berlin/Heidelberg, Germany, 2010. [Google Scholar]
- Palazzolo, A. Vibration Theory and Applications with Finite Elements and Active Vibration Control; John Wiley & Sons: Hoboken, NJ, USA, 2016. [Google Scholar]
- Jazar, R.N. Advanced Vibrations: Theory and Application; Springer: Basel, Switzerland, 2022. [Google Scholar]
- Ewins, D.J. Control of vibration and resonance in aero engines and rotating machinery—An overview. Int. J. Press. Vessel. Pip. 2010, 87, 504–510. [Google Scholar] [CrossRef]
- Zhu, D. Vibration energy harvesting: Machinery vibration, human movement and flow induced vibration. In Sustainable Energy Harvesting Technologies-Past, Present and Future; IntechOpen: Rijeka, Croatia, 2011; Volume 1, pp. 22–54. [Google Scholar]
- Fedorko, G.; Ivančo, V. Analysis of force ratios in conveyor belt of classic belt conveyor. Procedia Eng. 2012, 48, 123–128. [Google Scholar] [CrossRef]
- Hrabovský, L.; Blata, J.; Hrabec, L.; Fries, J. The detection of forces acting on conveyor rollers of a laboratory device simulating the vertical section of a Sandwich Belt Conveyor. Measurement 2023, 207, 112376. [Google Scholar] [CrossRef]
- Zimroz, R.; Hardygóra, M.; Blazej, R. Maintenance of belt conveyor systems in Poland—An overview. In Proceedings of the 12th International Symposium Continuous Surface Mining-Aachen 2014; Springer International Publishing: Berlin/Heidelberg, Germany, 2015; pp. 21–30. [Google Scholar]
- Zhao, H.S.; Wu, Y.Z. A new roller conveyor driven by linear motor. Adv. Mater. Res. 2011, 201, 1517–1520. [Google Scholar] [CrossRef]
- Hrabovsky, L.; Molnar, V.; Fedorko, G.; Tkac, J.; Frydrysek, K. Experimental determination of force acting on a sandwich conveyor’s pressure roller in transport of bulk materials for the needs of failure analysis. Measurement 2022, 202, 111832. [Google Scholar] [CrossRef]
- Hrabovský, L.; Maslarić, M. Device designed for detection and setting the required tensile force in ropes. Adv. Sci. Technol. Res. J. 2018, 12, 200–206. [Google Scholar] [CrossRef]
- Stace, L.R.; Yardleym, E.D. Belt Conveying of Minerals; Woodhead Publishing: Cambridge, UK, 2008. [Google Scholar]
- Kelly, S.G. Schaum’s Outline of Mechanical Vibrations; McGraw-Hill Education: New York, NY, USA, 1996. [Google Scholar]
- Geradin, M.; Rixen, D.J. Mechanical Vibrations: Theory and Application to Structural Dynamics, 3rd ed.; John Wiley & Sons: Hoboken, NJ, USA, 2015. [Google Scholar]
- Hrabovský, L.; Gaszek, J.; Kovář, L.; Fries, J. A Laboratory Device Designed to Detect and Measure the Resistance Force of a Diagonal Conveyor Belt Plough. Sensors 2023, 23, 3137. [Google Scholar] [CrossRef]
- Klimenda, F.; Kampo, J.; Hejma, P. Vibration measurement of conveyor rollers. Procedia Eng. 2016, 136, 198–203. [Google Scholar] [CrossRef][Green Version]
- Bernhard, R.K. Mechanical Vibrations-Theory and Application—An Introduction to Practical Dynamic Engineering Problems in the Structural Field; Read Books Ltd.: Redditch, UK, 2013. [Google Scholar]
- Benaroya, H.; Nagurka, M.; Han, S.M. Mechanical Vibration: Theory and Application; Rutgers University Press: New Brunswick, NJ, USA, 2022. [Google Scholar]
- Norton, M.P.; Karczub, D.G. Fundamentals of Noise and Vibration Analysis for Engineers; Cambridge University Press: Cambridge, UK, 2003. [Google Scholar]
- Brandt, A. Noise and Vibration Analysis: Signal Analysis and Experimental Procedures; John Wiley & Sons: Hoboken, NJ, USA, 2011. [Google Scholar]
- Hrabovský, L.; Fries, J. Transport Performance of a Steeply Situated Belt Conveyor. Energies 2021, 14, 7984. [Google Scholar] [CrossRef]
- Reutov, A.A. Simulation of load traffic and steeped speed control of conveyor. IOP Conf. Ser. Earth Environ. Sci. 2017, 87, 082041. [Google Scholar] [CrossRef]
- Kounovsky, P.; Straka, L.; Seidl, M. Replacing continuous-operation transport equipment with wheeled vehicles. Int. Multidiscip. Sci. GeoConf. SGEM 2012, 1, 771. [Google Scholar]
- Deshpande, V.; Karekar, A.A.; Patil, T.; Shahapurkar, S.; Hubalikar, P. Design and fabrication of efficient material transport equipment. Int. Res. J. Eng. Technol. (IRJET) 2017, 4, 2075–2081. [Google Scholar]
- Shin, K.; Hammond, J. Fundamentals of Signal Processing for Sound and Vibration Engineers; John Wiley & Sons: Hoboken, NJ, USA, 2008. [Google Scholar]
- Wheeler, C.A. Rotating resistance of belt conveyor idler rolls. J. Manuf. Sci. Eng. 2016, 138, 041009. [Google Scholar] [CrossRef]
- Yang, M.; Zhou, W.; Song, T. Audio-based fault diagnosis for belt conveyor rollers. Neurocomputing 2020, 397, 447–456. [Google Scholar] [CrossRef]
- Skoczylas, A.; Stefaniak, P.; Anufriiev, S.; Jachnik, B. Belt conveyors rollers diagnostics based on acoustic signal collected using autonomous legged inspection robot. Appl. Sci. 2021, 11, 2299. [Google Scholar] [CrossRef]
- Fiset, M.; Dussault, D. Laboratory simulation of the wear process of belt conveyor rollers. Wear 1993, 162, 1012–1015. [Google Scholar] [CrossRef]
- Zhao, L. Typical failure analysis and processing of belt conveyor. Procedia Eng. 2011, 26, 942–946. [Google Scholar] [CrossRef]
- Peng, C.; Li, Z.; Yang, M.; Fei, M.; Wang, Y. An audio-based intelligent fault diagnosis method for belt conveyor rollers in sand carrier. Control Eng. Pract. 2020, 105, 104650. [Google Scholar] [CrossRef]
- Peruń, G.; Opasiak, T. Assessment of technical state of the belt conveyor rollers with use vibroacoustics methods-preliminary studies. Diagnostyka 2016, 17, 75–80. [Google Scholar]
- Toshov, J.; Annaqulov, T.; Quvondiqov, O.; Eshonqulov, K. Calculation of the service life and assessment of the reliability of conveyor rollers under the conditions of the Angren coal mine. Asian J. Multidimens. Res. (AJMR) 2021, 10, 365–370. [Google Scholar] [CrossRef]
- Jiang, X.P.; Cao, G.Q. Belt conveyor roller fault audio detection based on the wavelet neural network. In Proceedings of the 2015 11th International Conference on Natural Computation (ICNC), Zhangjiajie, China, 15–17 August 2015; pp. 954–958. [Google Scholar]
- Klimenda, F.; Skocilasova, B. Rollers vibration of pipe conveyor. Manuf. Technol. 2015, 15, 991–995. [Google Scholar] [CrossRef]
- Bombasaro, E.; Oddera, R. Field measurement of contact forces on rollers for a large diameter pipe conveyor. Open Eng. 2020, 11, 130–141. [Google Scholar] [CrossRef]
- Bortnowski, P.; Król, R.; Ozdoba, M. Roller damage detection method based on the measurement of transverse vibrations of the conveyor belt. Eksploat. I Niezawodn. 2022, 24, 510–521. [Google Scholar] [CrossRef]
- Bird, J. Mathematics Pocket Book for Engineers and Scientists; Routledge: Abingdon-on-Thames, UK, 2019. [Google Scholar] [CrossRef]
- Gondek, H.; Kolman, J.; Boháč, D. Results of belt cpnveyors noise reduction with the new construction of roller holders. Int. Multidiscip. Sci. GeoConf. SGEM 2022, 22, 369–376. [Google Scholar]
- Kolman, J.; Boháč, D. Noise reduction of belt conveyor tracks. Int. Multidiscip. Sci. GeoConf. SGEM 2020, 20, 195–202. [Google Scholar]
- Třífázový Elektromotor 1.5 kW, 1400 RPM. Available online: https://elektromotory-vybo.cz/obchod/elektromotor-1-5kw-1400ot-90l-4-elektricky-motor/ (accessed on 24 January 2023).
- VS-606V7 Series Instruction Manual. Available online: https://automasjonslab.files.wordpress.com/2018/09/yaskawa-607.pdf (accessed on 11 May 2018).
- Hand-Arm Acceleration Sensor KS903.10. Available online: https://www.pce-instruments.com/eu/pce-instruments-hand-arm-acceleration-sensor-ks903.10-det_5966162.htm (accessed on 26 September 2021).
- Sirius Modular Data Acquisition (DAQ) System. Available online: https://dewesoft.com/products/sirius (accessed on 16 February 2023).
- ISO 10816-3; Mechanical Vibration—Evaluation of Machine Vibration by Measurements on Non-Rotating Parts—Part 3: Industrial Machines with Nominal Power above 15 kW and Nominal Speeds between 120 r/min and 15,000 r/min When Measured In Situ. Available online: https://www.technicke-normy-csn.cz/csn-iso-10816-3-011412-158763.html (accessed on 28 June 2023).
- Yang, C.; Xia, Y. Interval uncertainty-oriented optimal control method for spacecraft attitude control. IEEE Trans. Aerosp. Electron. Syst. 2023, 1–13. [Google Scholar] [CrossRef]
- Yang, C.; Lu, W.; Xia, Y. Reliability-constrained optimal attitude-vibration control for rigid-flexible coupling satellite using interval dimension-wise analysis. Reliab. Eng. Syst. Saf. 2023, 237, 109382. [Google Scholar] [CrossRef]
- ČSN ISO 13373-1; Condition Monitoring and Diagnostics of Machines—Vibration Condition Monitoring—Part 1: General Procedures (In Czech: Monitorování Stavu a Diagnostika Strojů—Monitorování Stavu Vibrací—Část 1: Obecné Postupy). Available online: https://www.normservis.cz/download/view/csn/01/67076/67076_nahled.pdf (accessed on 28 June 2023).
- ČSN ISO 13373-2; Condition Monitoring and Diagnostics of Machines—Vibration Condition Monitoring—Part 2: Processing, Analysis and Presentation of Vibration Data (In Czech: Monitorování Stavu a Diagnostika Strojů—Monitorování Stavu Vibrací—Část 2: Zpracování, Prezentace a Analýza Vibračních Dat). Available online: https://www.technicke-normy-csn.cz/csn-iso-13373-2-011440-158868.html (accessed on 28 June 2023).
- Klimenda, F.; Soukup, J.; Sterba, J. Noise and vibration analysis of conveyor belt. Manuf. Technol. 2019, 19, 604–608. [Google Scholar] [CrossRef]
- Peruń, G. Attempt to evaluate the technical condition of the rollers of the belt conveyor by vibration measurements. Vibroeng. Procedia 2014, 3, 296–299. [Google Scholar]


Disclaimer/Publisher’s Note: The statements, opinions and data contained in all publications are solely those of the individual author(s) and contributor(s) and not of MDPI and/or the editor(s). MDPI and/or the editor(s) disclaim responsibility for any injury to people or property resulting from any ideas, methods, instructions or products referred to in the content. |
© 2023 by the authors. Licensee MDPI, Basel, Switzerland. This article is an open access article distributed under the terms and conditions of the Creative Commons Attribution (CC BY) license (https://creativecommons.org/licenses/by/4.0/).