Abstract
In view of the high-sensitivity vibration effect of precision instrument laboratory buildings under the influence of surrounding traffic loads, field micro-vibration tests under various working conditions were carried out based on actual projects. Combined with numerical simulation, measured data served as input loads to simulate the vibration effect of various traffic loads on the floor of a building structure, and the structural vibration laws under the comprehensive action of various loads were analyzed. The vibration isolation effect of the isolation ditch on the oblique orthogonal load was investigated according to the corresponding safety index. The results show that the main frequency components of the site vibration frequency caused by various traffic loads are approximately 25 Hz and that the root-mean-square speed value is stable below VC-E, which meets the design requirements. Under the comprehensive action of multiple loads, the site structure will produce a vibration amplification effect, which is obvious when all types of loads are distributed symmetrically and the curve distribution is controlled by load factors with large amplitudes. The isolation effect of a small isolation ditch is best when it is located close to the source and the building. The depth of the isolation ditch must be greater than the maximum depth of the source to achieve better results, and the width has little influence. The effect of a small isolation trench on vertical vibration is poor, and the oblique orthogonal triaxial load has a counteracting effect on the vertical component. Thus, additional structural vibration isolation measures are needed. The research results provide a reference for engineering vibration isolation, damping measures, and structural design.
1. Introduction
In recent years, the application and development of high-tech technologies have gradually become important means to promote the in-depth implementation of innovation-driven development strategies in China and have created numerous precision factories, laboratories, and other building sites. However, vehicles, high-speed rails, pedestrians, and other daily traffic elements inevitably cause vibration loads. This vibration amplitude, usually referred to as micro-vibration, is lower than that of general vibrations; however, it often affects the normal operation of precision equipment or instrument vibration and has a nonnegligible impact on the daily production of equipment workshops [1,2,3,4]. Therefore, taking relevant technical measures to control vibration and ensure the normal operation of precision instruments and equipment has become an urgent technical problem.
Research on the influence of micro-vibration worldwide has focused mainly on measurement analysis and numerical simulation. In 1977, W. Kurze [5], for the first time, carried out field vibration test research and proposed a vibration measurement method for the Berlin railway in Germany. Y. Kitamura [6] proposed a simulation method to simulate roadside ground vibration caused by moving vehicles and compared it with the results of a field vibration test to provide a reference for subsequent scholars to carry out relevant research. Domestic research on micro-vibration began to flourish in the 21st century. In recent years, a team led by Gao et al. [7,8,9,10] has been committed to onsite micro-vibration testing, analyzing the vibration characteristics of the site to assess whether it meets the vibration requirements. Chinese researchers have conducted extensive research on various vibration sources. In terms of train vibration, Xie et al. [11] conducted a study of the prediction and countermeasures of subway vibration on precision instruments through field tests and verified the existence of a vibration amplification area. Chen et al. [12] established a coupling model of the subway tunnel-soil-building complex and conducted an in-depth study of the impact of subway tunnel-soil-building complex vibration. Jia [13] proposed an equivalent peak particle velocity vibration evaluation method and analyzed the attenuation characteristics of the peak particle vibration velocity of a high-speed railway vibration signal by conducting field soil monitoring tests. In terms of vehicle loads, Hao et al. [14] analyzed not only the influence of different site conditions and road center distances on structural vibration but also the vibration response of five hypothetical reinforced concrete structures under normal traffic conditions. Xing et al. [15] conducted in situ testing and analysis of vehicle vibration at three sites: Shanghai, Beijing, and Taiyuan. Their findings revealed that the vibration attenuation rate increases gradually with increasing soil hardness. Sun et al. [16] investigated the site vibration response caused by the passage of loaded trucks in different driving states, providing a basis for designing an electronic workshop and micro-vibration control. In addition, YU et al. [17] carried out monitoring and simulation analyses of structural micro-vibration of a proton service building based on the construction process and obtained a structural micro-vibration evaluation equation for the analyzed building under the working conditions of heavy vehicles through regression analysis. Zhang et al. [18] proposed a triangular wave model of pedestrian excitation and reported that fixed-point loading could envelope the vibration response caused by a single person walking. In view of the adverse effects of the above micro-vibrations on building structures, many researchers have begun to conduct relevant vibration isolation studies. Yang et al. [19] established a three-dimensional finite element analysis model based on the background of a commercial complex building to explore the vibration reduction and isolation effects of vertical vibration isolation supports. Wu et al. [20] used the three-dimensional finite element analysis method to investigate the vibration isolation effect of a ground barrier on a building floor and the rule of parameter influence, indicating that the average vibration reduction effect can exceed 5 dB. Shrivastava [21] used the finite element method to analyze the isolation effect of the depth, length, and width of the isolation ditch and the filling material. Deng et al. [22] used two-dimensional limiting elements and semi-infinite elements to discretize the boundary and reported that the isolation ditch had an optimal position between the vibration source and the investigation point.
In summary, most studies have adopted a single idealized approach to the vibration source, while it is usually the combined effect of multiple load combinations. In addition, for the selection of vibration isolation measures, vibration isolation supports, vibration isolators and vibration isolation barriers certainly have good vibration isolation effects, but for buildings such as equipment plants, it is more economical and reasonable to directly choose vibration isolation trenches to control micro-vibrations. Owing to the damping effect caused by the stiffness difference between the material fill in the trench and the surrounding soil, the energy loss of the vibration wave passing through the isolation trench further weakens the vibration intensity. However, existing studies are large-scale vibration isolation trenches that use a single vertical or orthogonal vibration source, which is not universal. Rationalization and effective exploration of structural measures are still rare, and the research results that can provide guiding opinions for practical projects are insufficient.
This paper uses a precision instrument laboratory building project as the research object, performs a field micro-vibration test, and establishes a three-dimensional finite element model of soil–load–building to explore the response characteristics of the building structure under the comprehensive action of various loads. The control effect of vibration reduction measures in the isolation ditch on oblique ramp loads is analyzed, providing reasonable guiding opinions for the project.
2. Project Overview
2.1. Project Introduction
The proposed project is the second phase of the Zhejiang Zhijiang Laboratory project, which is expected to create high-tech, sophisticated scientific and technological equipment and impose harsh requirements on the surrounding environment. The vast majority of precision equipment is extremely sensitive to vibration, and even small load vibrations can cause damage to such instruments and adversely affect their accuracy. Therefore, the influence of ambient vibration must be considered in early planning and construction.
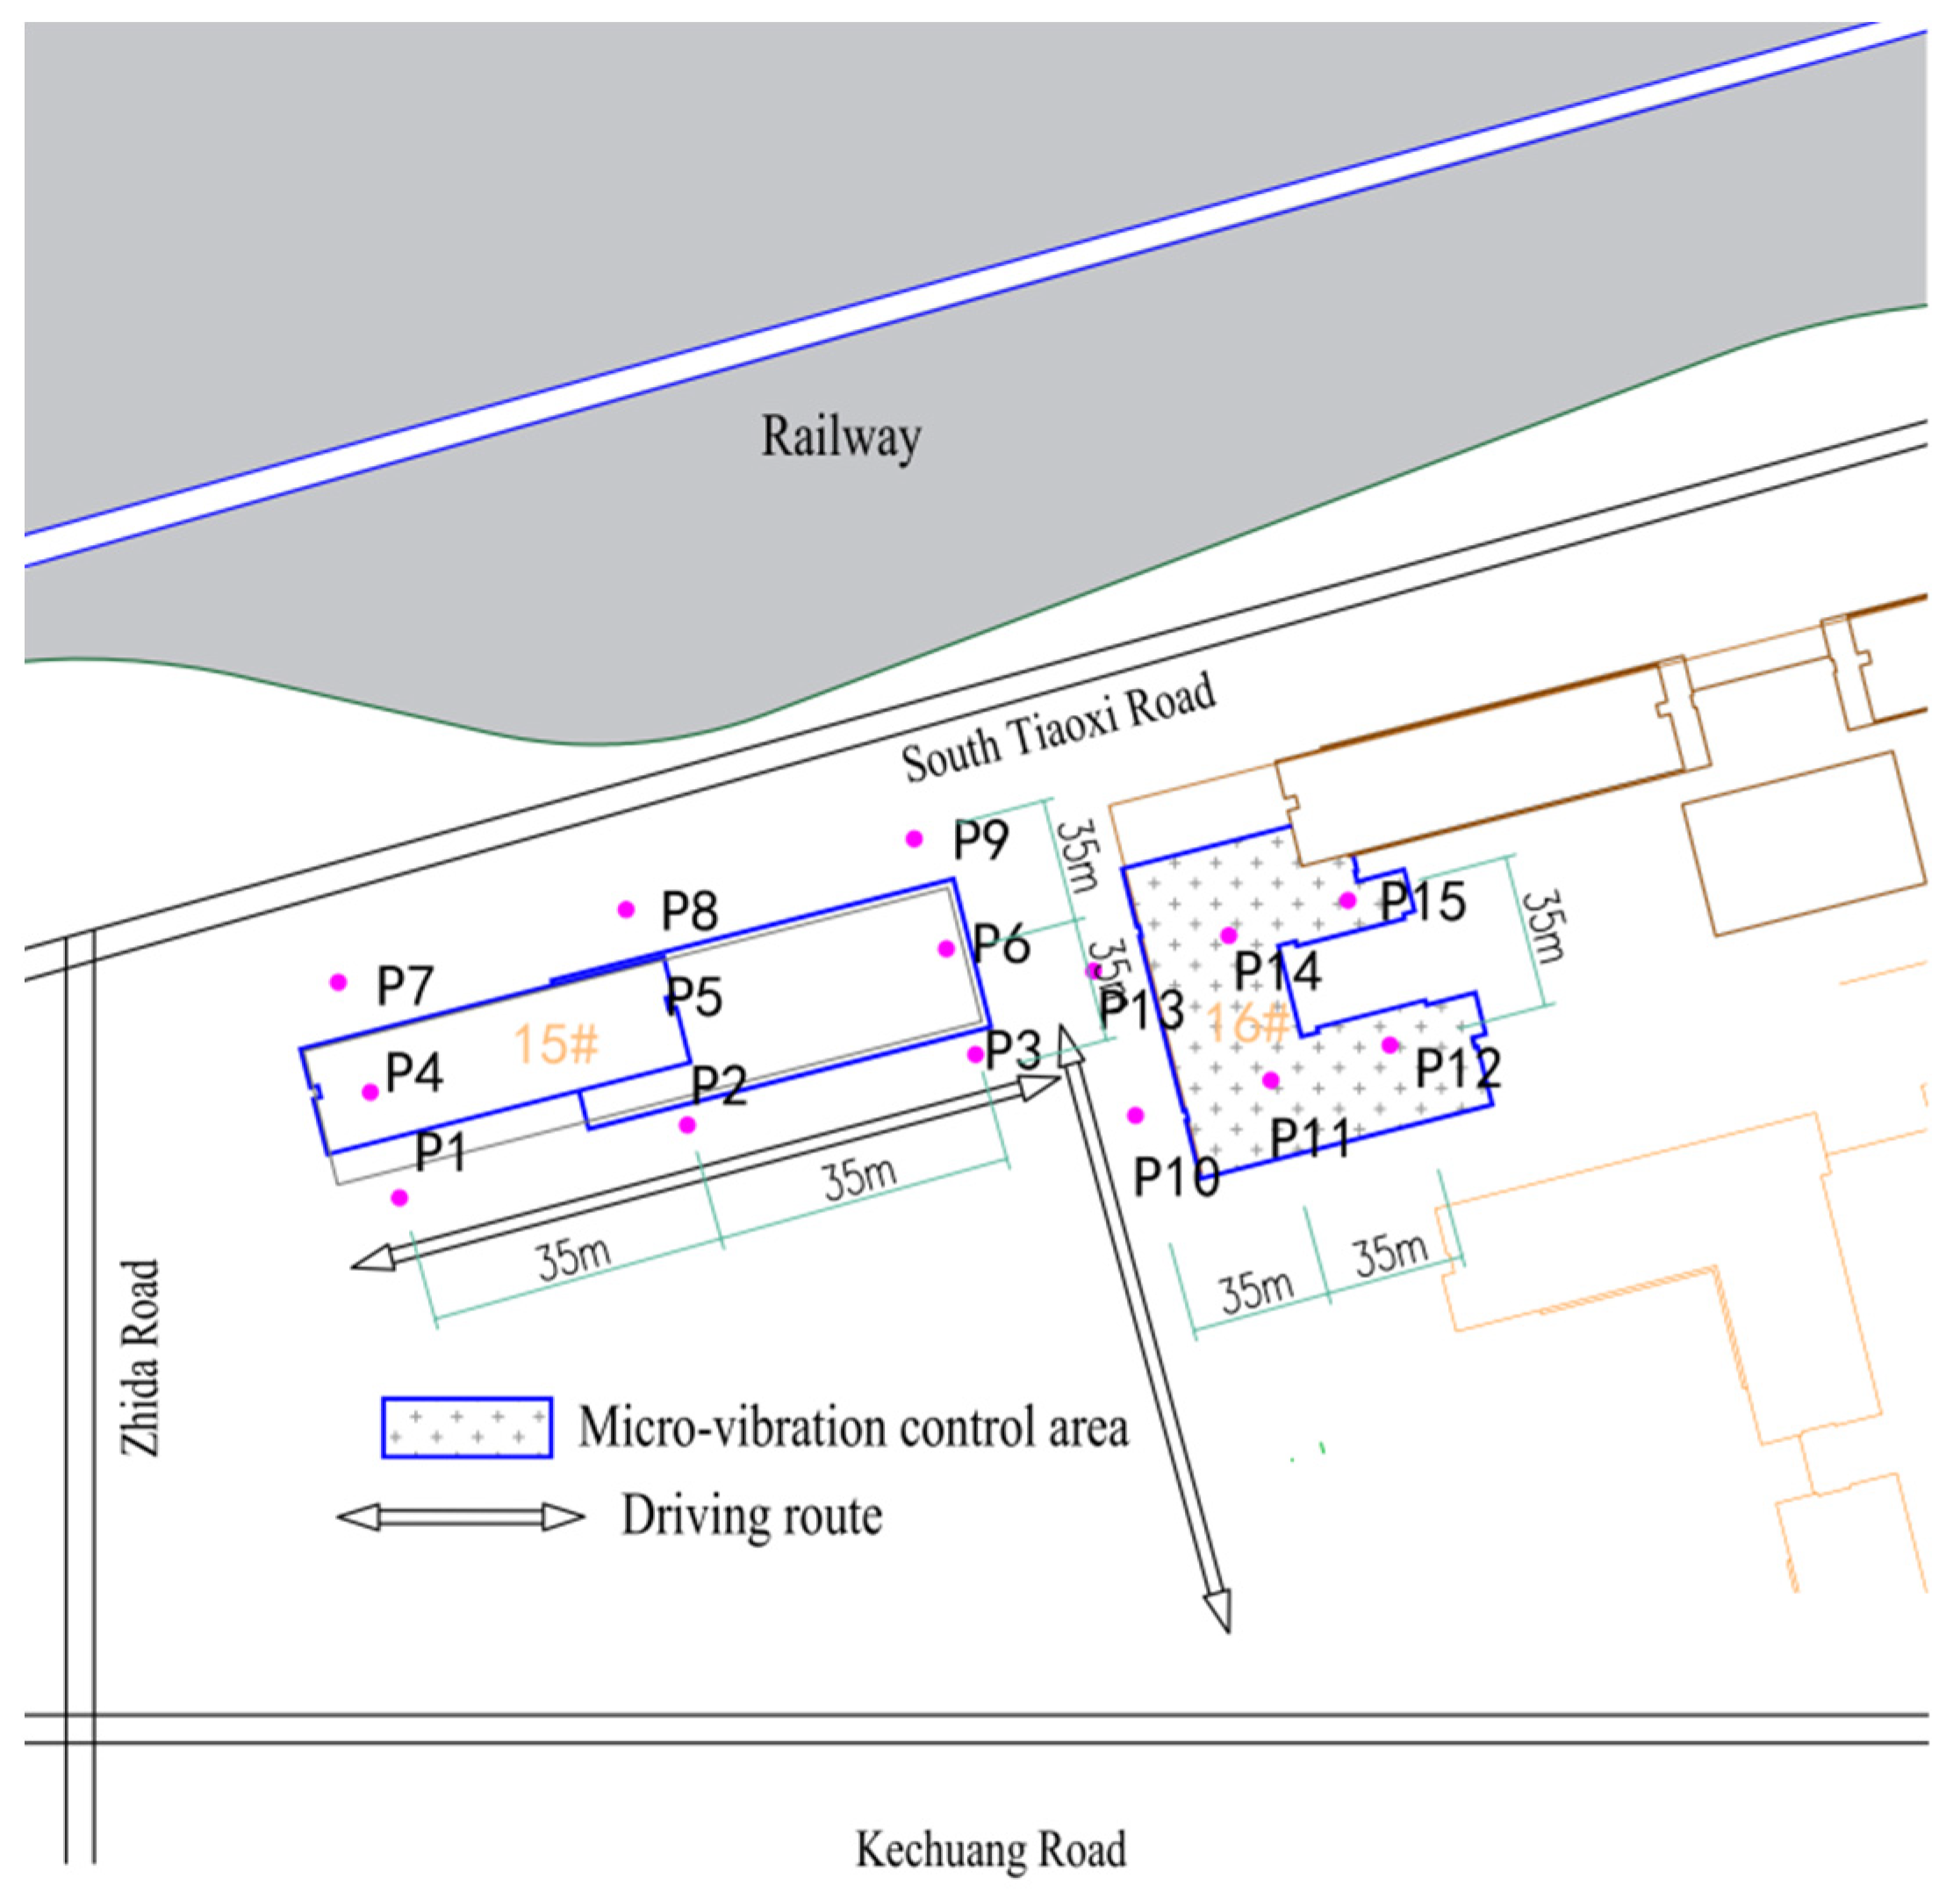
As shown in Figure 1, the main factors currently affecting the normal work of the laboratory are Kechuang Road in the south, South Tiaoxi Road in the north, Zhida Road in the west, Hangzhou high-speed railway in the northwest, and surface vibration caused by nearby aircraft. To meet the requirements of high-precision equipment for micro-vibration in the laboratory, the micro-vibration region is determined. Because building #16 is divided into microseismic areas, which imposes higher control requirements, this paper selects it as the object of vibration control research.
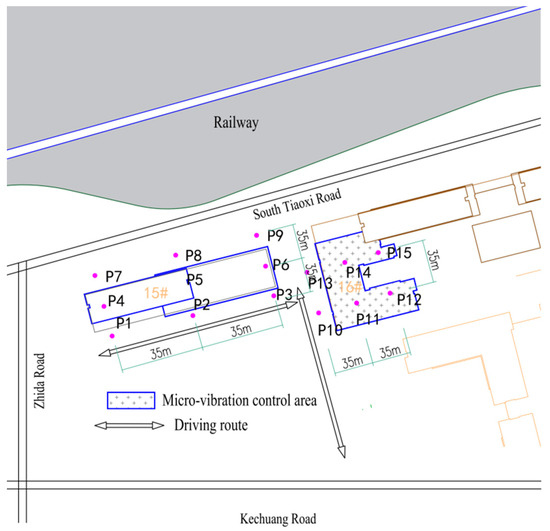
Figure 1.
Building plan and measuring point layout.
The soil layer properties of the site are shown in Table 1. The equivalent shear wave velocity Vse of the soil layer in each test hole within a depth of 20 m below the ground is 158 m/s to 192 m/s.

Table 1.
Physical and mechanical index parameters of the foundation soil.
2.2. Test Content and Purpose
To express the degree of influence of micro-vibration, the amount of vibration is generally used as the quantitative standard. The quantization standard includes three physical quantities: vibration displacement, vibration velocity, and vibration acceleration. Among these three methods, several mathematical derivations related to the measurement and numerical simulation analysis of micro-vibration induced by road traffic in a precision instrument laboratory exist. Therefore, if one of the physical quantities is measured, the remaining two terms can be derived via differentiation or integration. In actual engineering measurements, there are different errors in the measurements of velocity, acceleration, and displacement. Proper selection of reasonable physical quantities for measurement can effectively reduce the error to a minimum.
Field tests can be used to understand the ground pulsation characteristics of a site, evaluate the vibration status of the site, provide basic data for the vibration of the proposed building in the future, and provide an accurate excitation load for numerical simulation.
- (1)
- Understand the ground pulsation characteristics.
- (2)
- Understand the characteristics and distribution of vibration sources around the site.
- (3)
- Understand the impact of the main vibration sources around the site (high-speed railway, aircraft, vehicles, pedestrians, construction machinery, etc.) on the micro-vibration level of the construction site.
2.3. Measuring Points and Instrument Layout
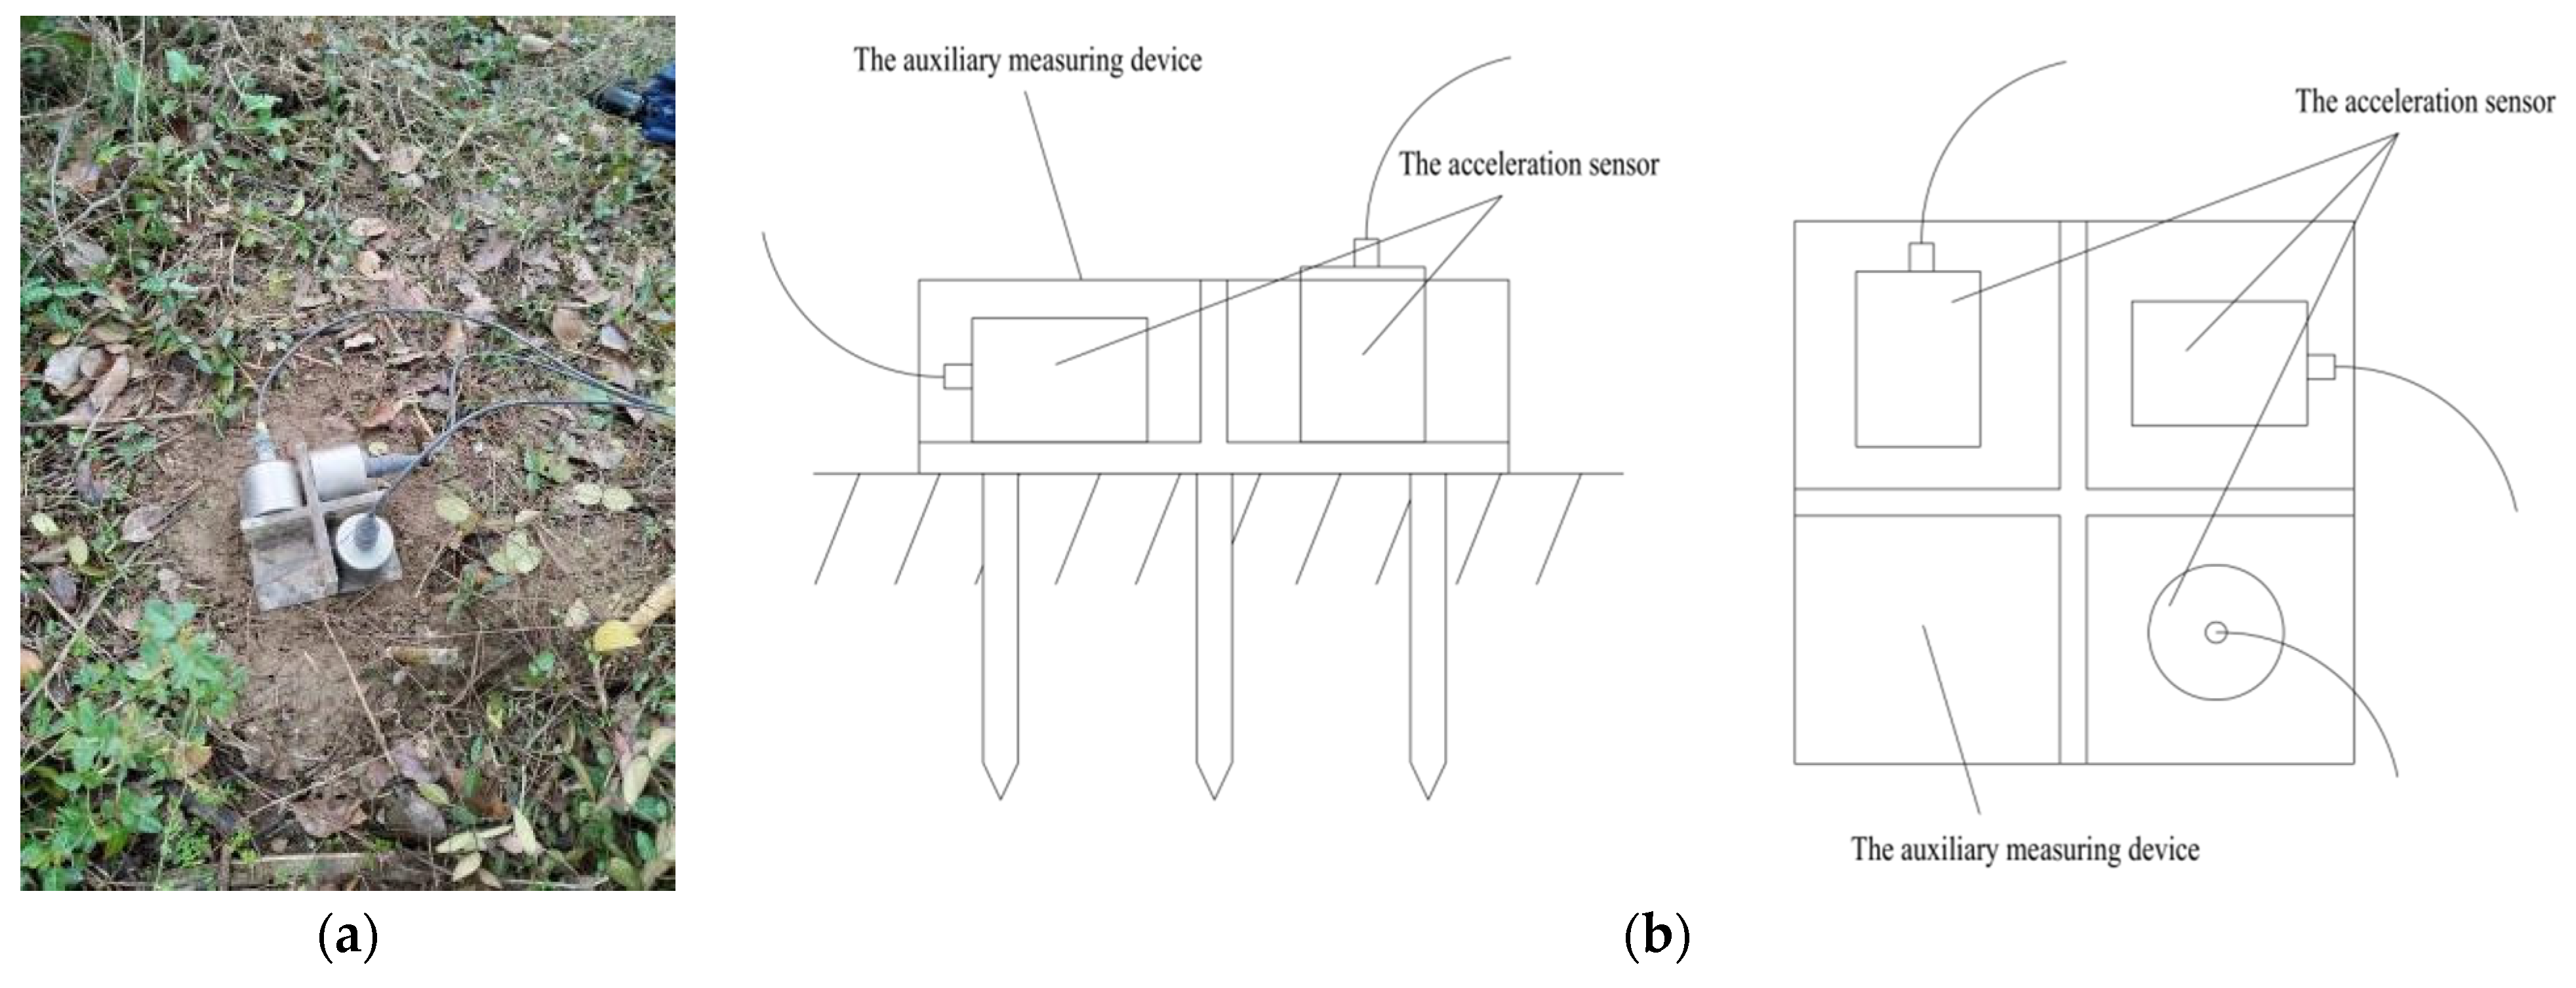
The layout of the onsite instruments and equipment is shown in Figure 2.

Figure 2.
Field test equipment. (a) Field measurement; (b) Acceleration sensor placement method.
2.3.1. Acquisition System
- (1)
- PCB-393B31 high-sensitivity low-frequency acceleration sensor
This measurement uses a low-frequency and high-resolution acceleration sensor (PCB-393B31), as shown in Figure 2a. The vibration frequency response of the acceleration sensor is 0.1~200 Hz, and its measurable range is 0.1–750 Hz, which meets the requirements of the maximum vibration bandwidth of general laboratory precision equipment (1~250 Hz). The resolution of the accelerometer is 0.00004 g RMS, which meets the requirements of the general high-tech factory micro-vibration specification of 0.01 g.
During the test, as the site is relatively soft, all three feet of the auxiliary measuring device are driven into the ground to make the bottom surface of the auxiliary measuring device touch the ground, as shown in Figure 2b. The acceleration sensor is fixed in the three directions of the auxiliary measuring device, and measures are taken to fix the data line connected to the vibration pickup with the ground to prevent measurement errors caused by the shaking of the connection line. During the installation process, the speed sensor maintains the sensitivity of the spindle direction in the vertical direction.
- (2)
- Dynamic data acquisition instrument
This test uses the dynamic signal test and analysis system developed by Donghua Test Co., Ltd.(Shanghai, China) .The characteristics of the test are that it is convenient to carry out; it is fast and easy to install; it provides real-time monitoring of vibration data and connection of various bandwidths of acceleration, speed, FFT (fast Fourier transformation), and 1/3 frequency spectrum (0.1~1 kHz); and it involves online calculation and analysis of each common spectrum. The results of the micro-vibration analysis are given in real time.
2.3.2. Analysis System
This test adopts the Donghua dynamic signal test and analysis system (DHDAS). This system is based on a big data dynamic data analysis system, which has a friendly operation interface, convenient installation, and strong scalability. The root needs to be able to carry forward the FFT, 1/3 octave spectrum, triple spectrum, narrowband spectrum, time history curve reproduction, and other functions.
The arrangement of the measuring points is shown in Figure 1, with a total of 15 measuring points from P1 to P15. The pedestrian and vehicle loads are divided into x- and y-directions; the sampling frequency is 256 Hz; each collection time is 10 min; and the collection step is performed 3 times. To avoid interference, such as onsite construction operations and vehicle flow during the day, the test data were collected in the early morning to ensure the accuracy of the test data as much as possible. The measurement lasted three days. To remove the interference signal in the vibration signal, it is necessary to correct the original data, eliminate the noise and interference in the inclusion signal, and process the signal by eliminating DC drift, smoothing processing, digital filtering, etc.
2.4. Vibration Control Standards
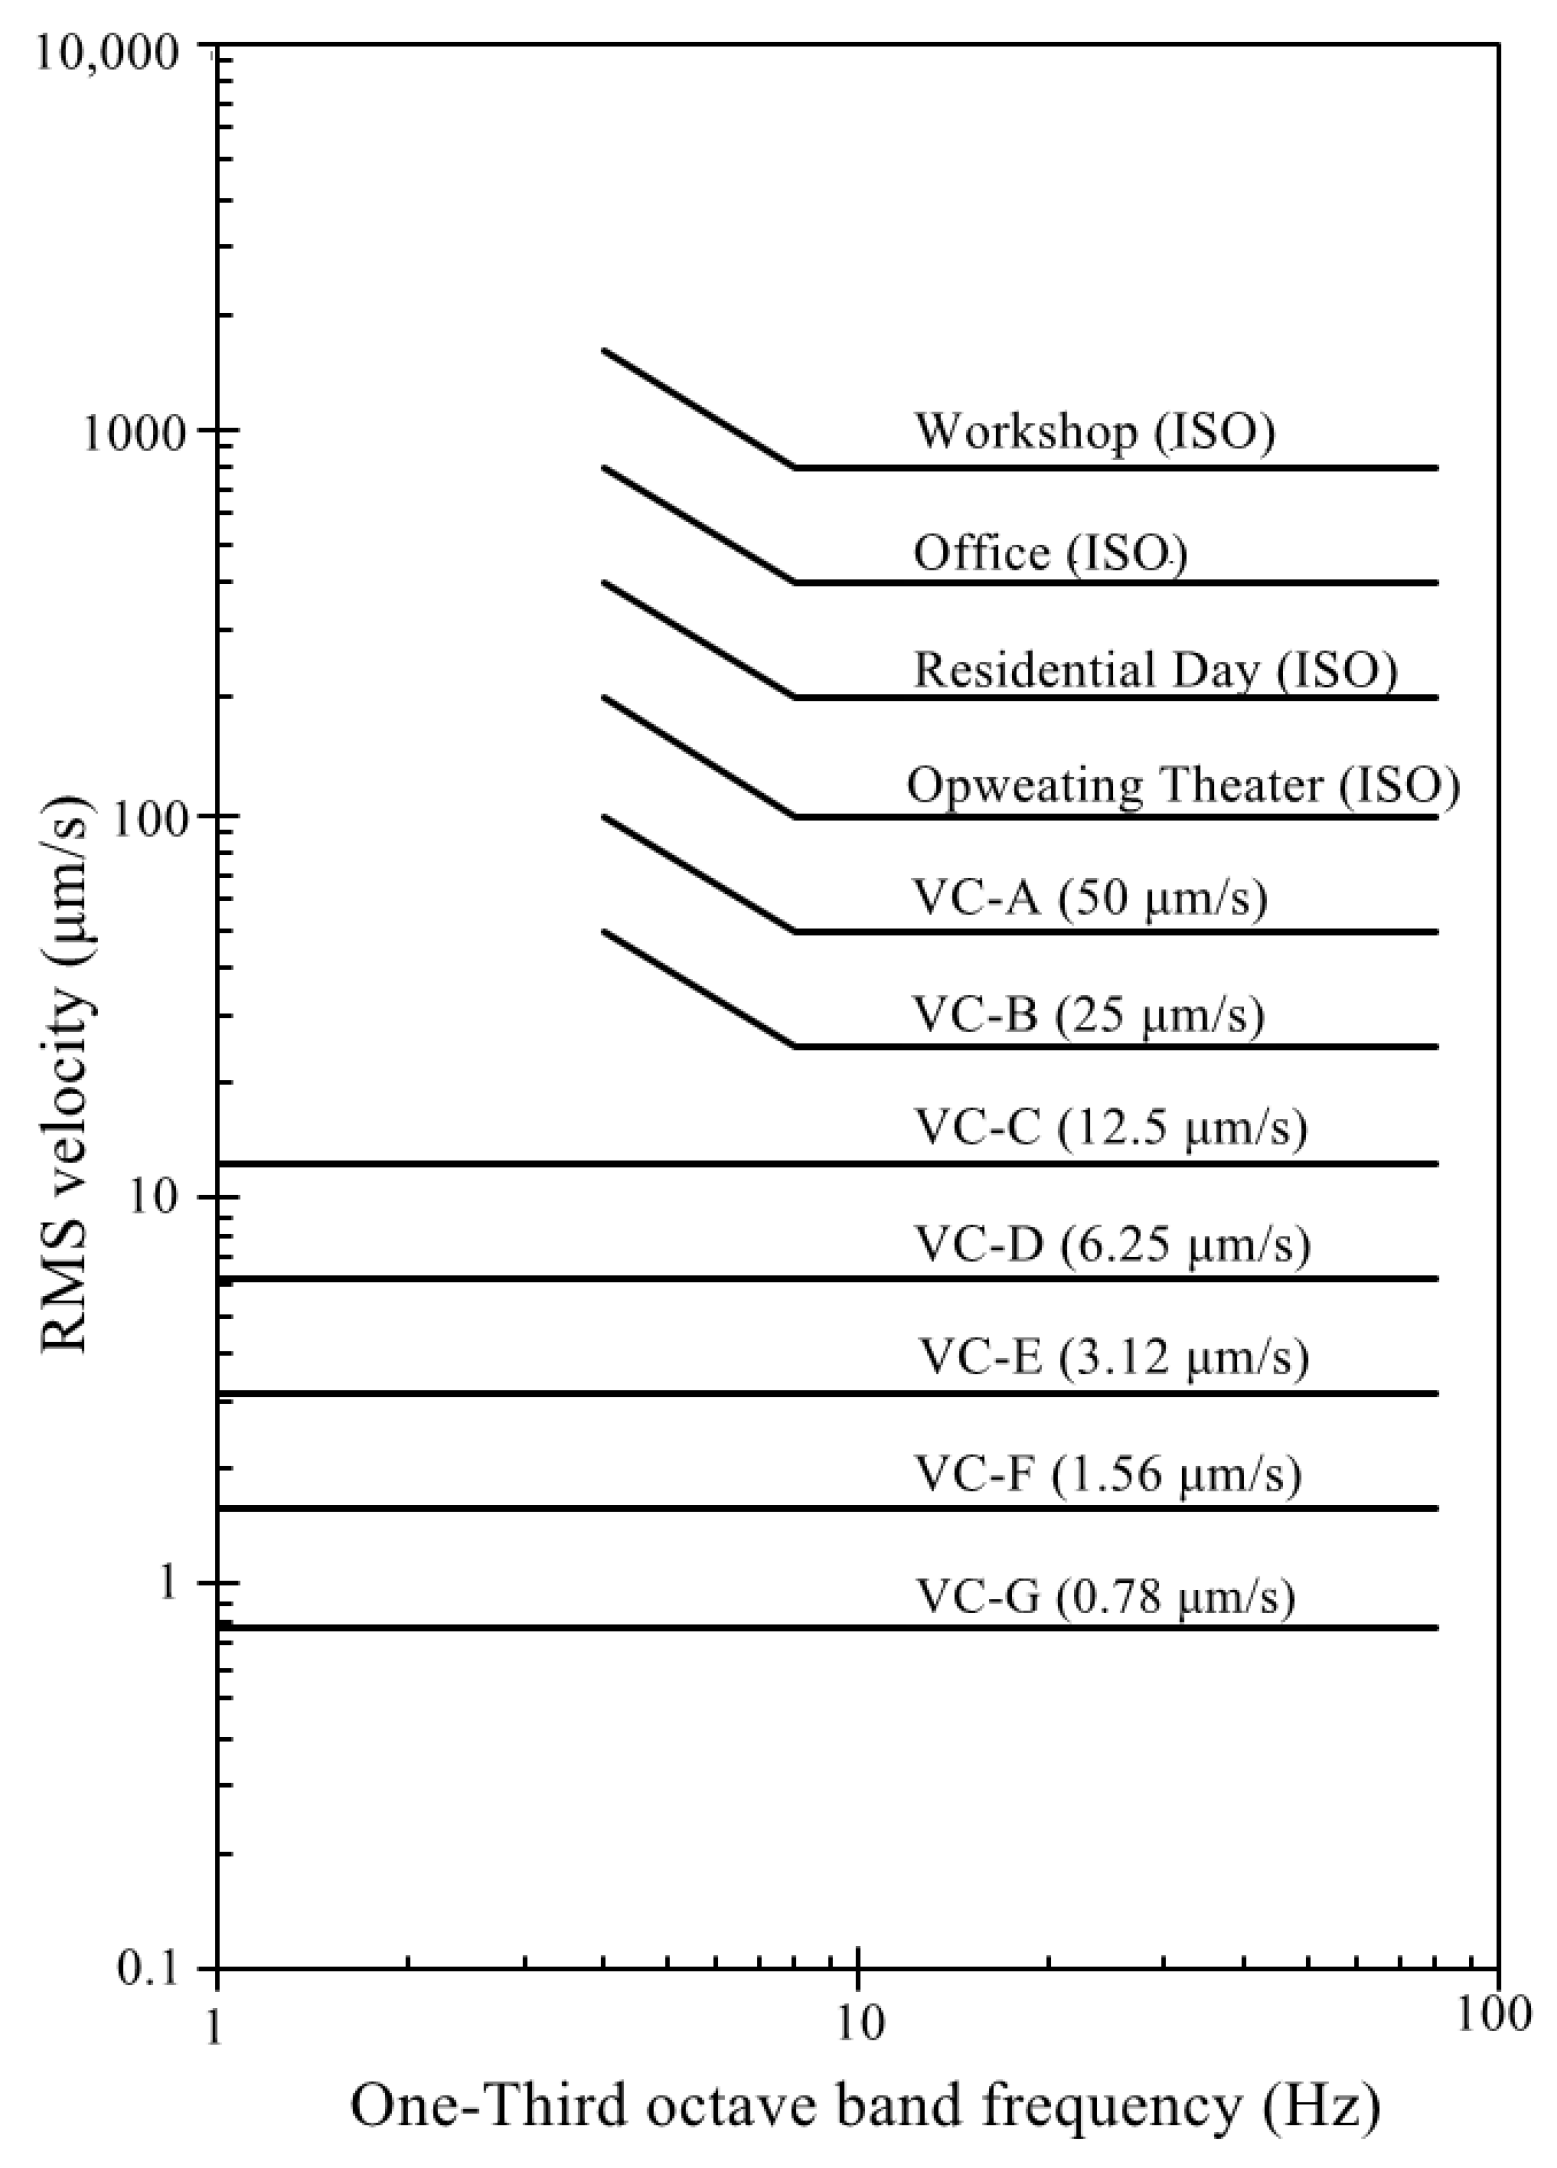
The micro-vibration criterion referred to in this analysis is “Considerations in Clean-Room Design”, the vibration standard of the American Society for Environmental Science and Technology [23], which uses the RMS value of velocity as the control index. The criterion controls mainly the 1/3 frequency spectrum of the speed in the frequency range of 1–80 Hz. The numerical definition of the standard curve shown in Figure 3 is provided in Table 2.

Figure 3.
General vibration standard (VC) curve for the vibration sensing equipment.
Table 2.
Numerical definition of the standard curve in Figure 3.
2.5. In Situ Measurements
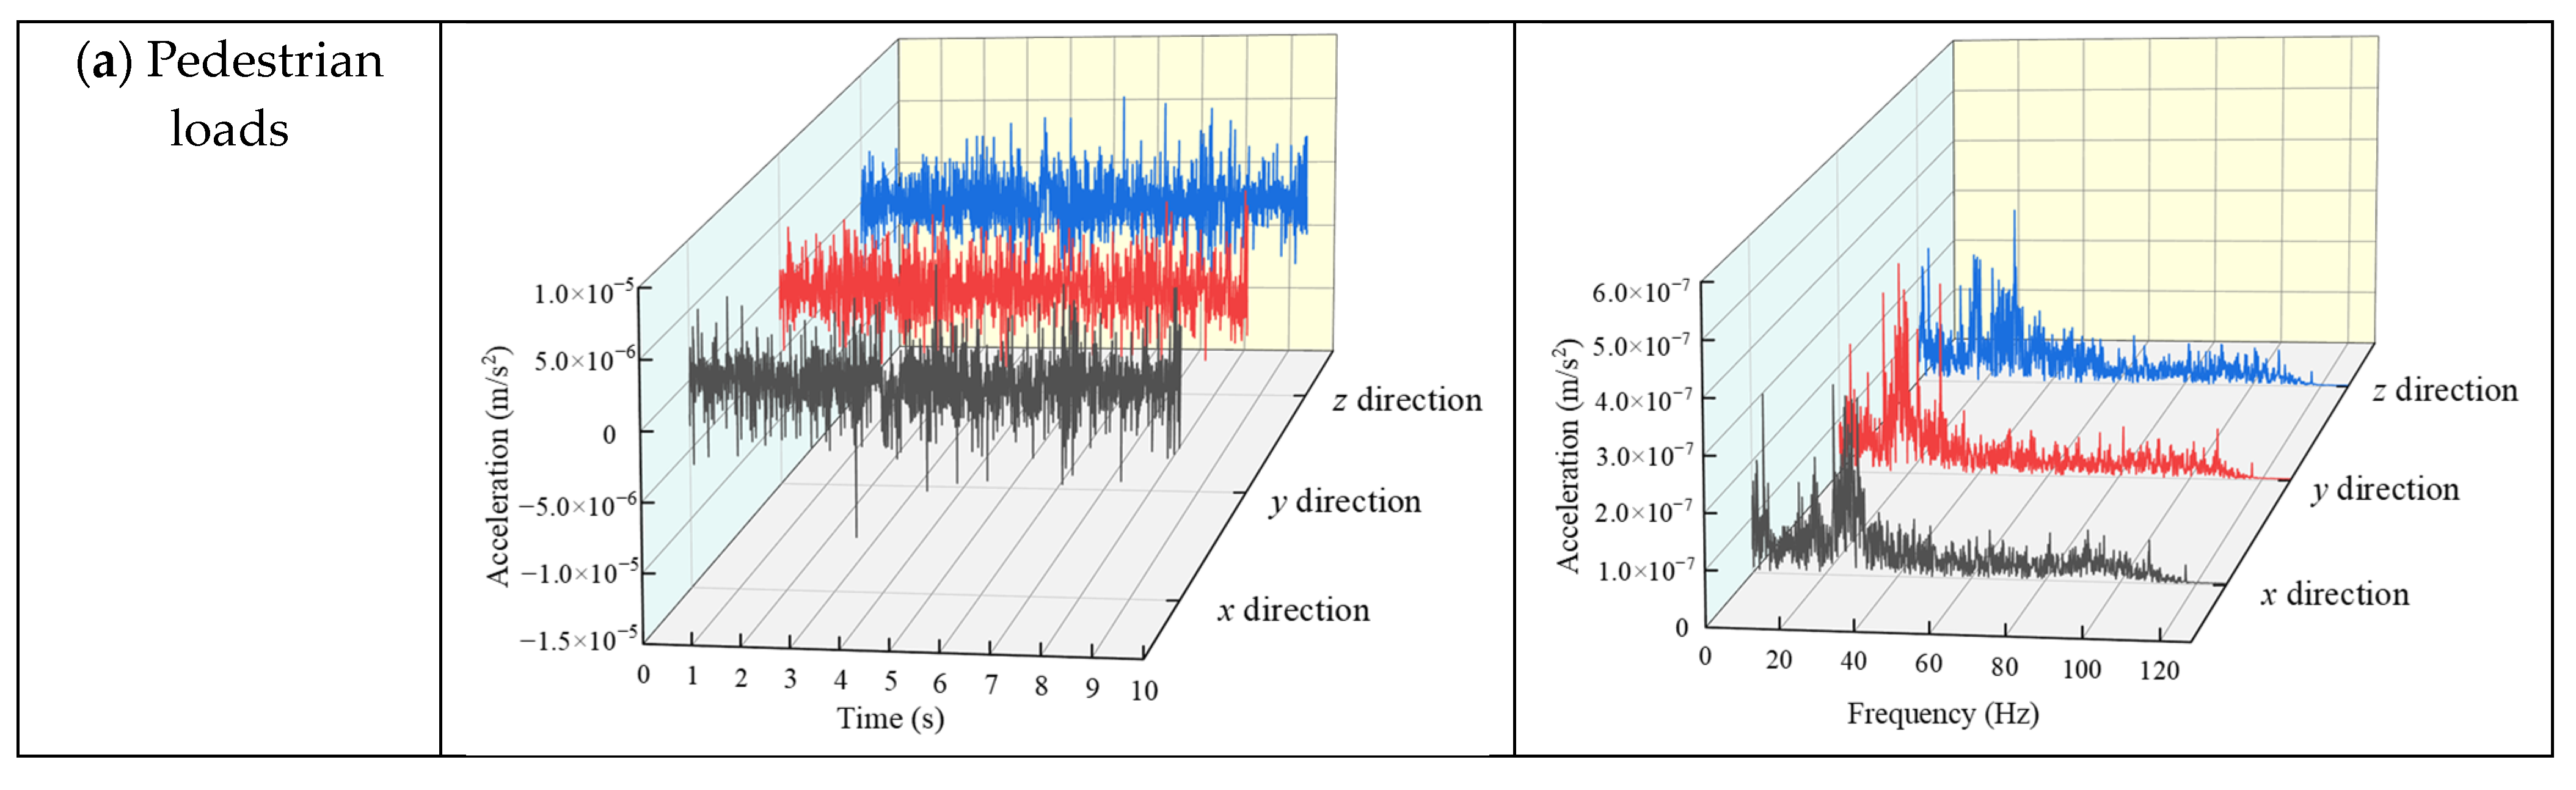
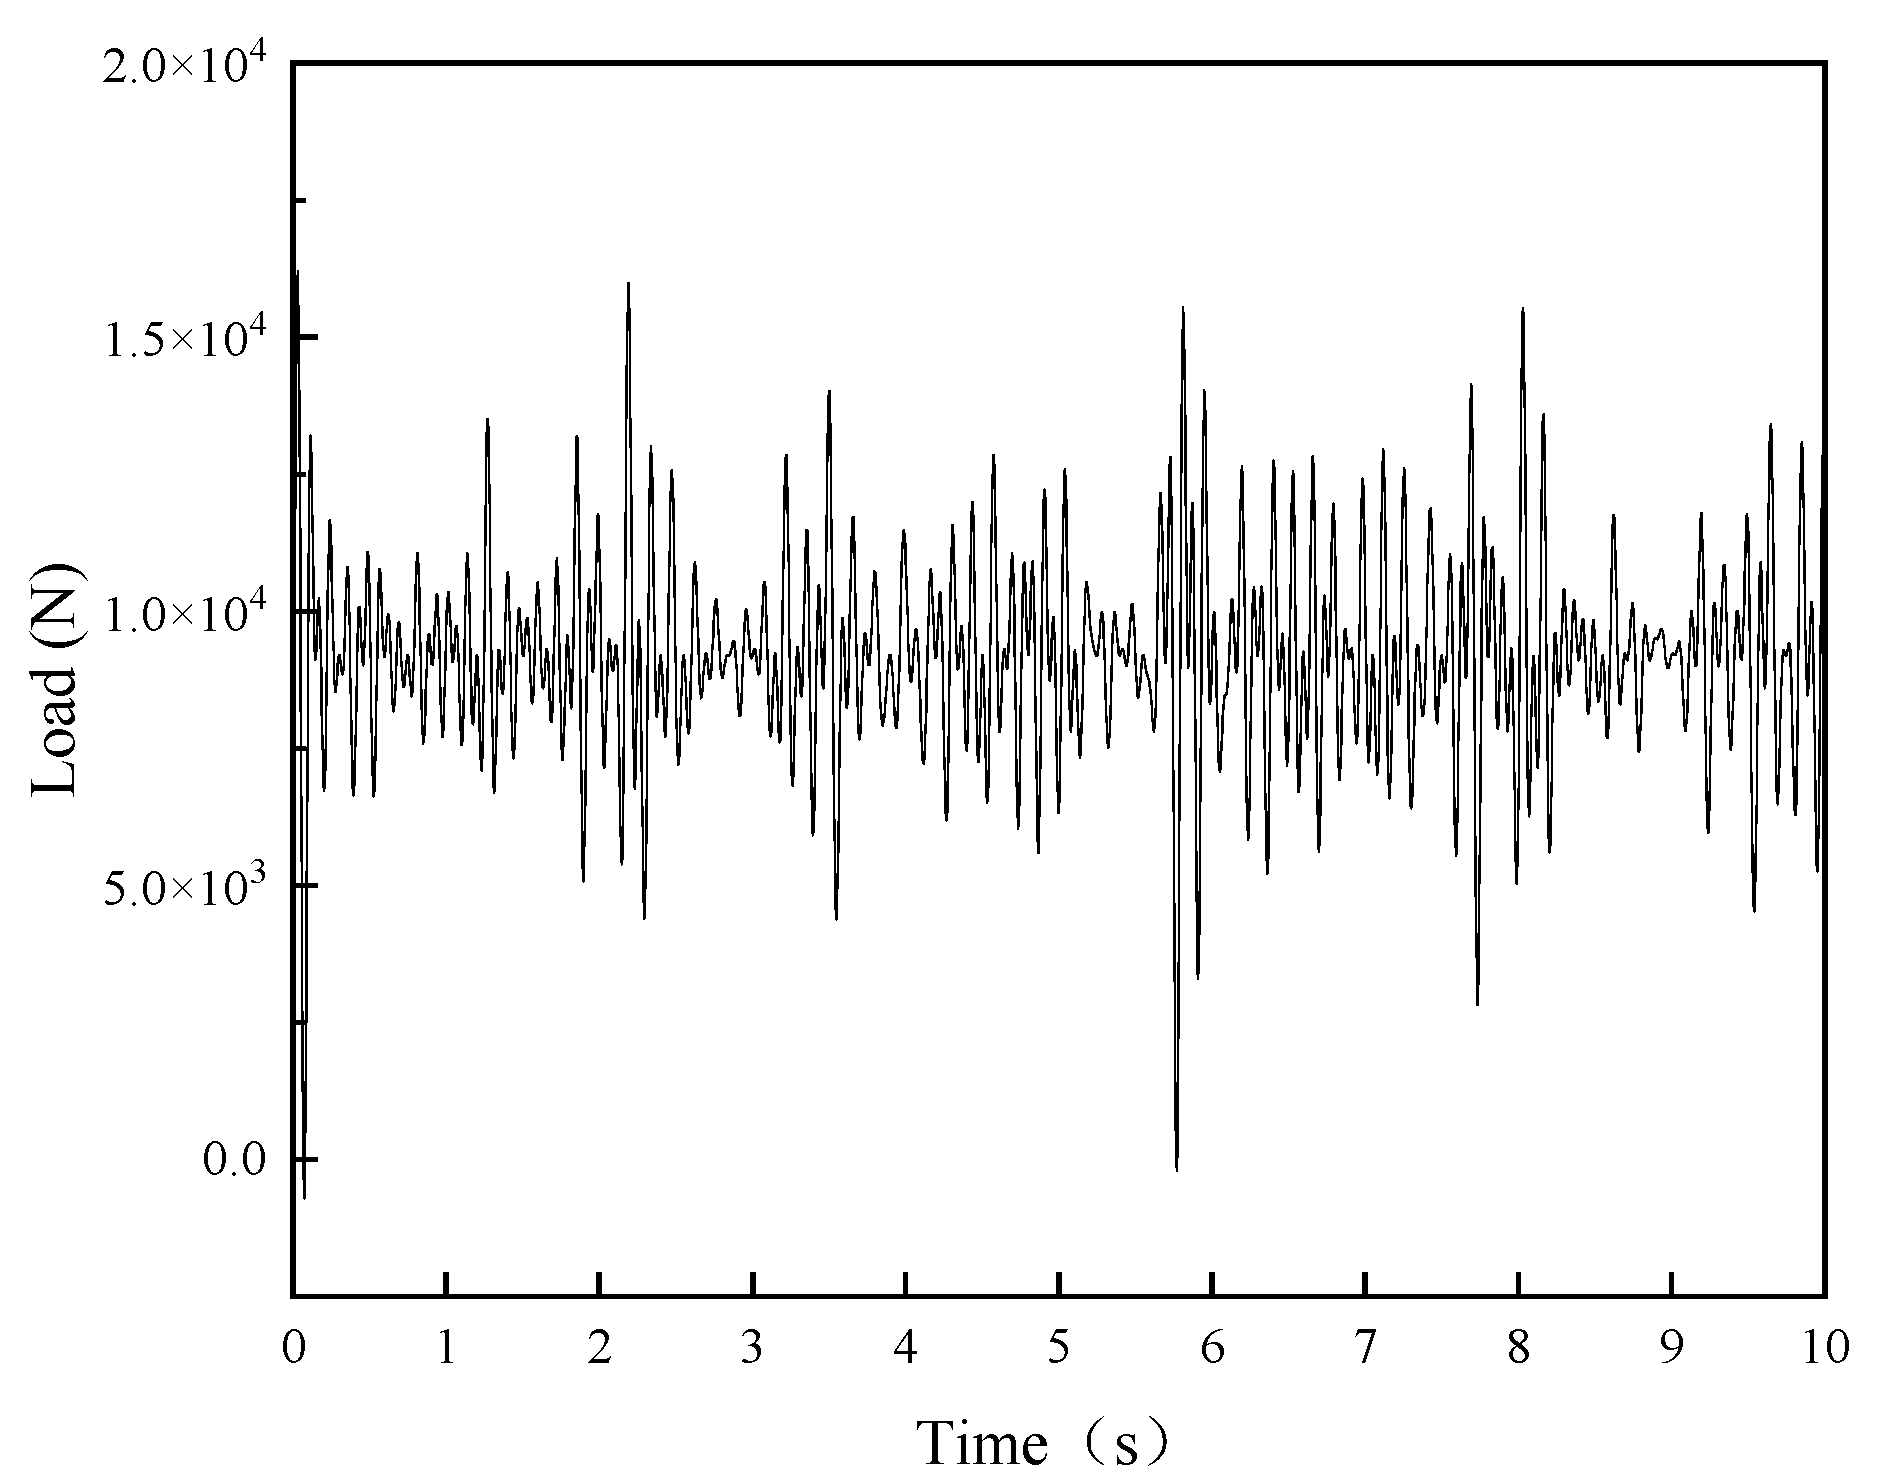
According to the field micro-vibration test, the following calculated loads are obtained (Figure 4): (a) pedestrian loads, (b) high-speed rail loads, (c) aircraft loads, and (d) vehicle loads.

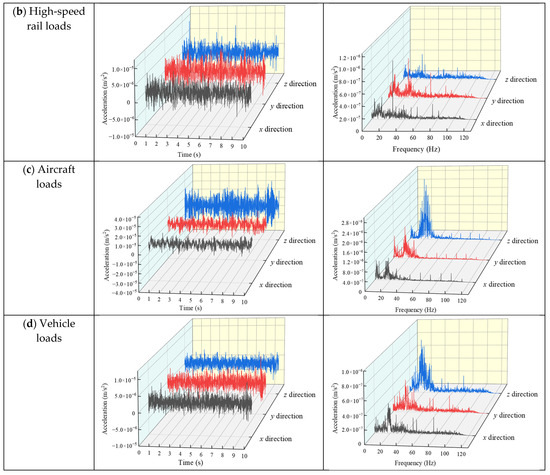
Figure 4.
Traffic loads.
3. Establishment of the Finite Element Model of the Soil–Building Load
In recent years, an increasing number of vehicle load models have been applied to vibration mechanics. Therefore, in this paper, a theoretical model that has been verified many times is used in the data model and compared with the measured data to verify the correctness of the subsequent model.
The vehicle load is generated mainly by vehicle self-weight and road irregularities. In this paper, a multifrequency sine wave load model considering road irregularities proposed in the literature [24,25] is adopted as follows:
where P0 is the static load of the car; Pi represents the fluctuating load of vehicle vibration; ωi is the vibrational PI; M0 represents the unsprung mass; a is the corresponding typical vector height; v is the speed of the car (since the test site is located inside the park, considering the speed limit inside the park and referring to the practices of researchers such as those in [24,25], the speed of the car is 20 km/h); and L indicates the curve wavelength and can be the body length.
According to the actual vibration data collected from the measurement points, each parameter in the above formula can be determined, and the vehicle spectrum diagram shown in Figure 5 can be obtained. The dominant frequency of ground vibration caused by the vehicle load is 5~12 Hz. Within the dominant frequency range, frequencies corresponding to different peaks are used to obtain different corresponding ωi and Pi values. The calculation results are shown in Table 3.
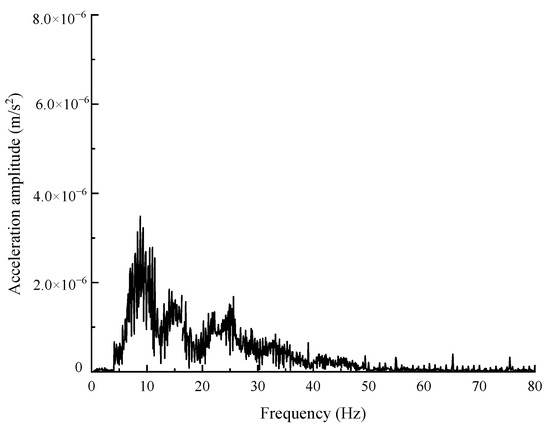
Figure 5.
Spectrum diagram for V = 20 km/h.
Table 3.
Value table of the dominant frequency interval.
In references [26,27,28], M0 can be 120 N·s2/m, with a body length of 6 m. The following is the numerical model of the vehicle load when the vehicle speed is 20 km/h (Figure 6):
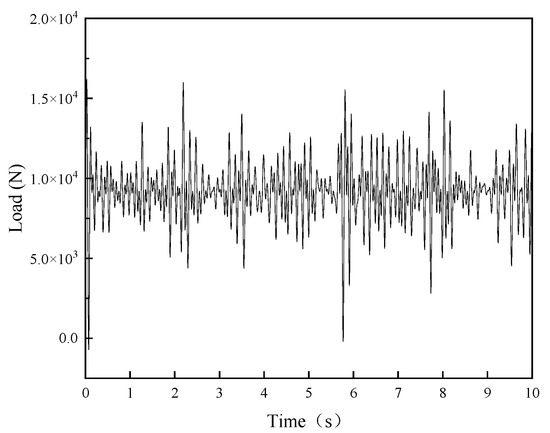
Figure 6.
Load model of the car.
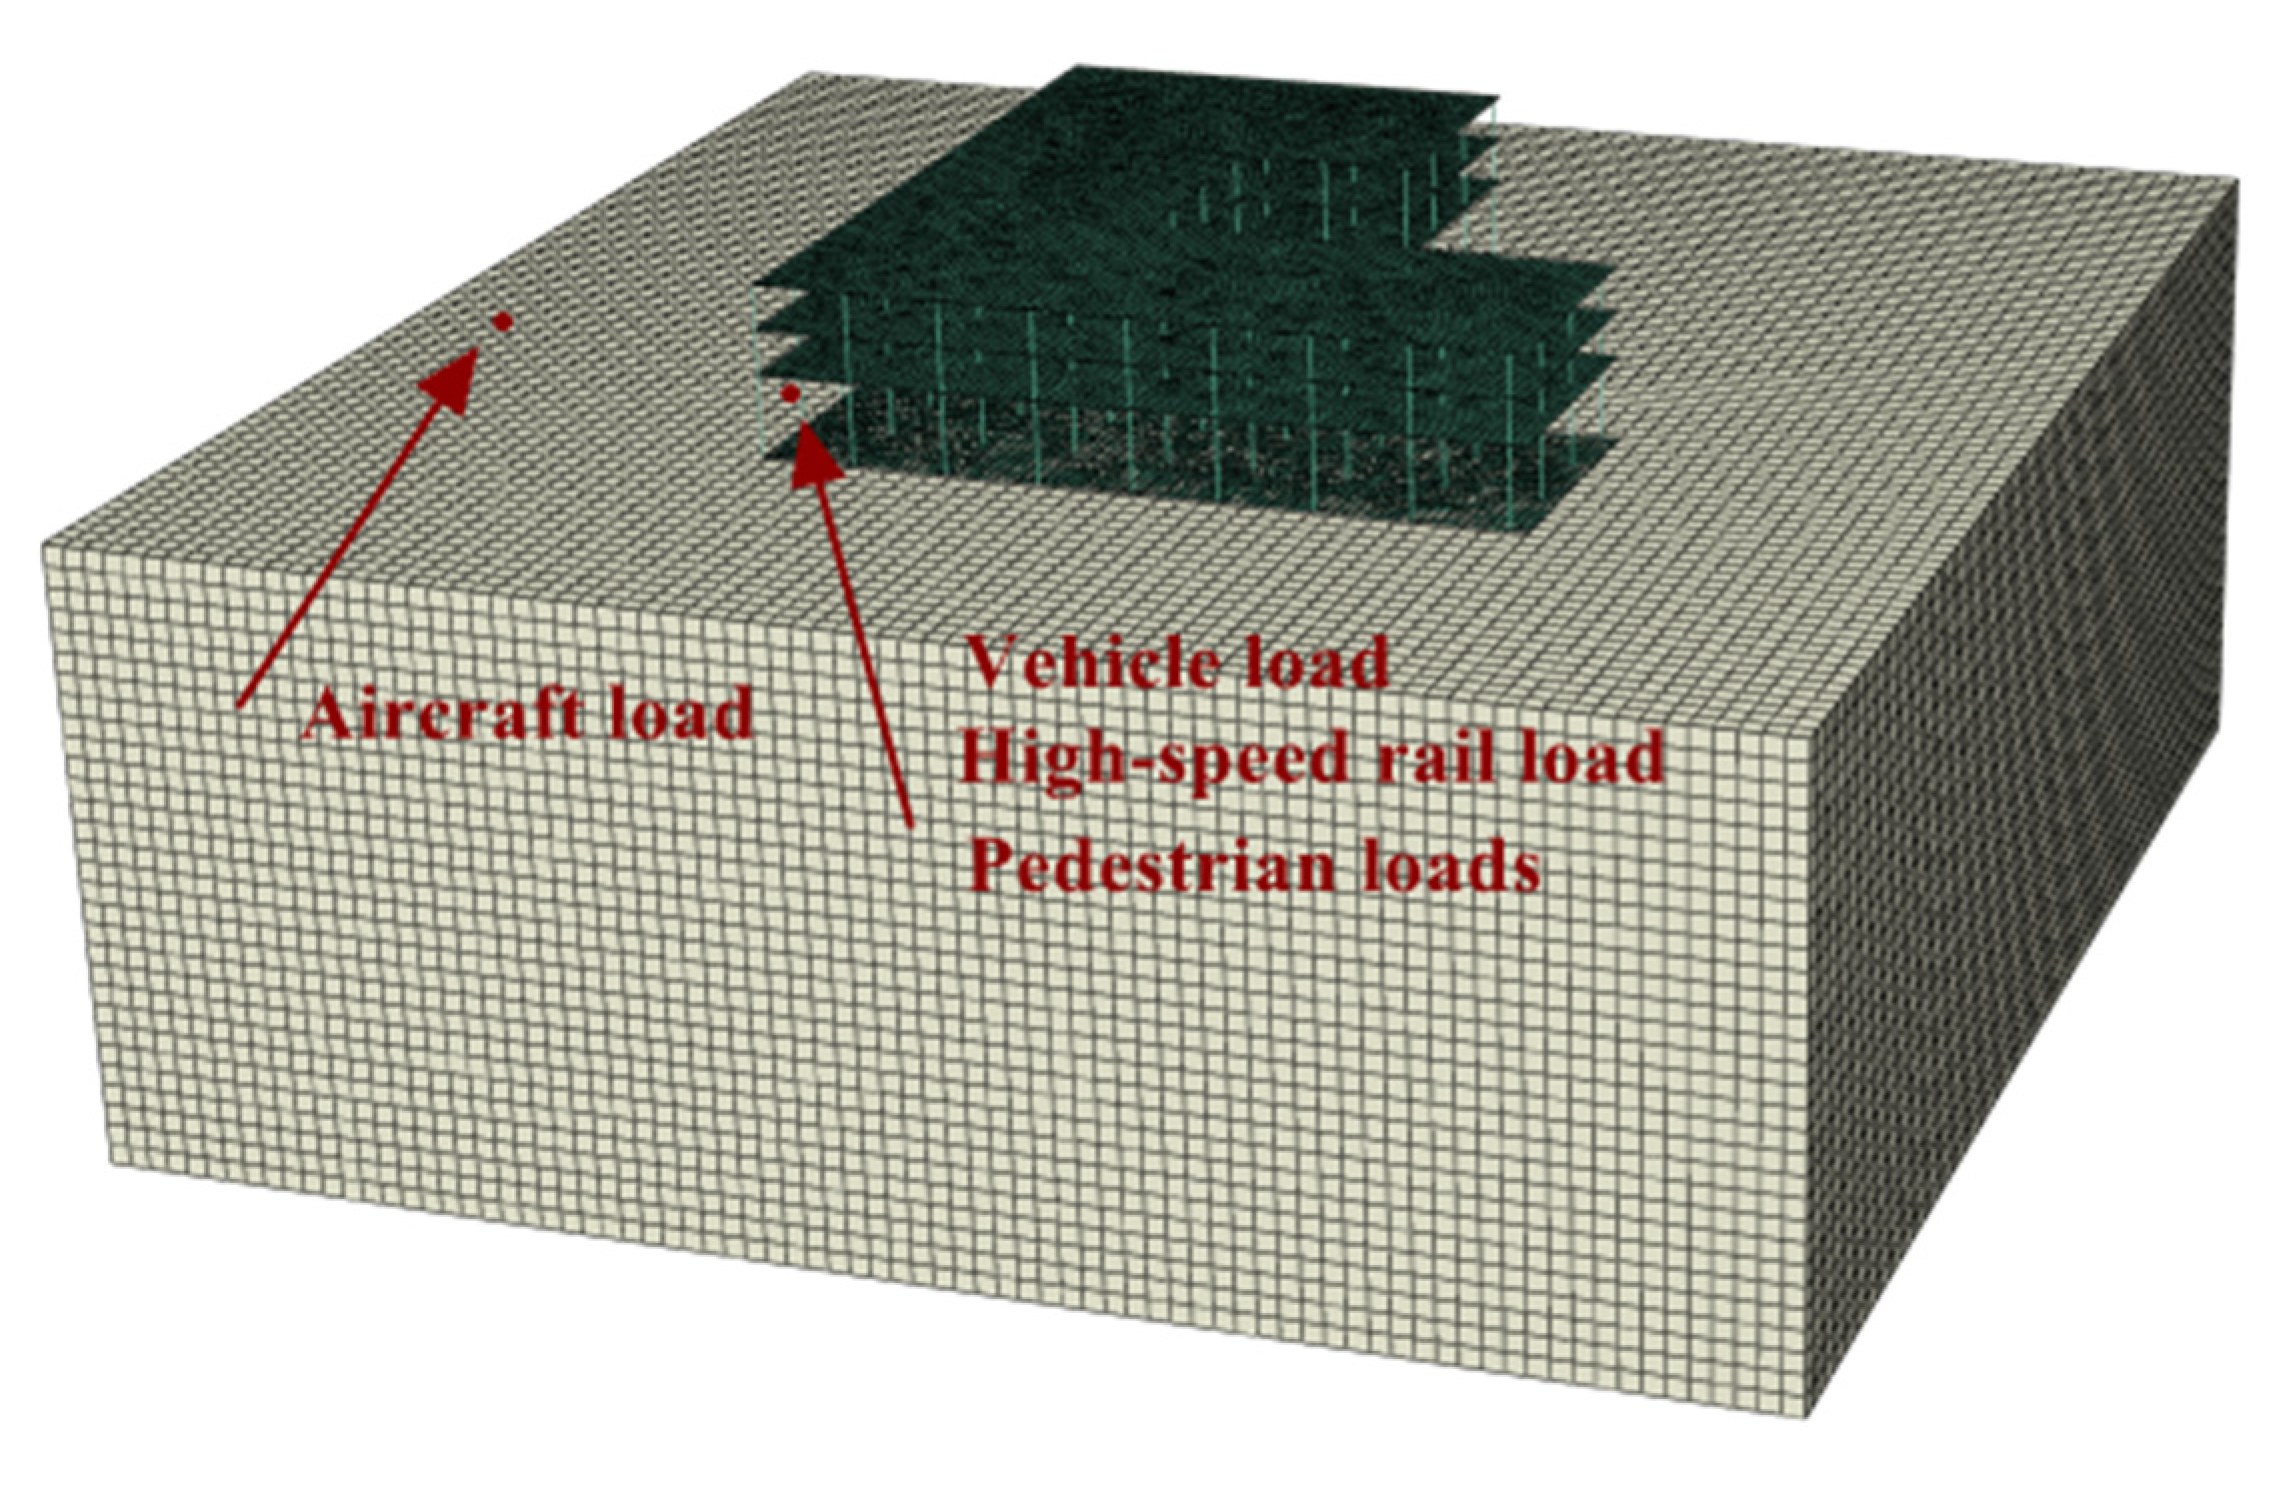
This paper is based on the preliminary design drawing of building #16 for modeling. The finite element method is widely used to analyze structural dynamics and vibration. With the ABAQUS platform, solid units were used to model the soil layer and other structures. The size of the soil model was 160 × 160 × 80 m (length × width × thickness). As the building structure is a three-story reinforced concrete frame structure, the actual proposed drawings are simplified accordingly, disregarding the influence of the wall. The shell unit and solid unit are used to model and calculate flat structures such as building floors and basement floors, respectively, and the beam unit and solid unit are used to model and calculate the building pillar to establish a more accurate model. The material properties are assigned to each part; the soil layer parameters are input according to the geological investigation report; C30 concrete material is used for building structures; material damping is added; and the sole-soil layer, pile foundation, and soil layer are connected by binding. The model adopts an implicit integration algorithm to ensure the stability of the calculation, and the solution results are more accurate for nonlinear problems, but a smaller time step is required. Therefore, the time step in this question is 1/4 (0.001 s) of the measured acquisition frequency, and the total time is 10 s. Regional division of the superstructure and soil mass was carried out, and hexahedral scanning elements were adopted as the grid control attribute to reduce the number of model elements as much as possible to improve the calculation efficiency. Figure 7 shows the overall finite element model.
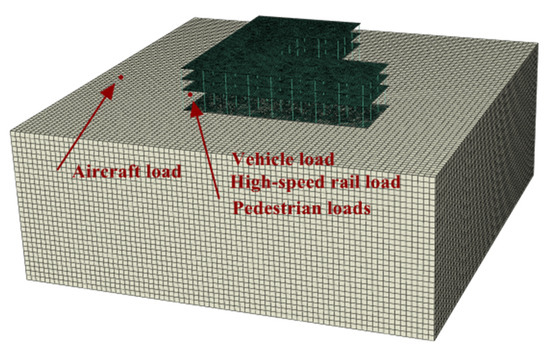
Figure 7.
Overall finite element model.
To reduce the influence of wave reflection at the boundary on the results, viscoelastic artificial boundary conditions are added around the soil mass, and a series of viscous dampers are applied by using the spring unit of the finite element software. The normal and tangential spring stiffness and damper coefficient are calculated as follows:
where and are the normal spring stiffness and tangential spring stiffness, respectively; and are the normal damper coefficient and tangential damper coefficient, respectively; and are the correction coefficients of the normal viscoelastic artificial boundary conditions and tangential viscoelastic artificial boundary conditions, respectively, which can be 1.0 and 0.5; cp and cs are the P wave velocity and S wave velocity, respectively, of the soil layer; G is the shear modulus of the soil; R is the distance from the wave source to the artificial boundary; and A is the equivalent area of each node of the artificial boundary.
The calculated load in Figure 6 is used as the point load input, and the acceleration response of the measuring point is output for comparison with the field test. Since point load replaces vehicle vibration load in the model, this paper takes the peak value of vibration acceleration of the site in the frequency domain as the comparison target between measured and simulated values, as shown in Figure 8. After comparison, the value obtained by numerical simulation is too large, and the peak value of both is within an order of magnitude range, so the model is reasonable.
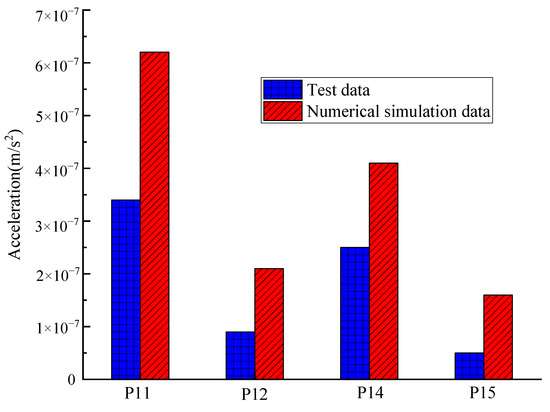
Figure 8.
Comparison between measured data and numerical simulation.
4. Analysis of the Model Vibration Response under Different Loads
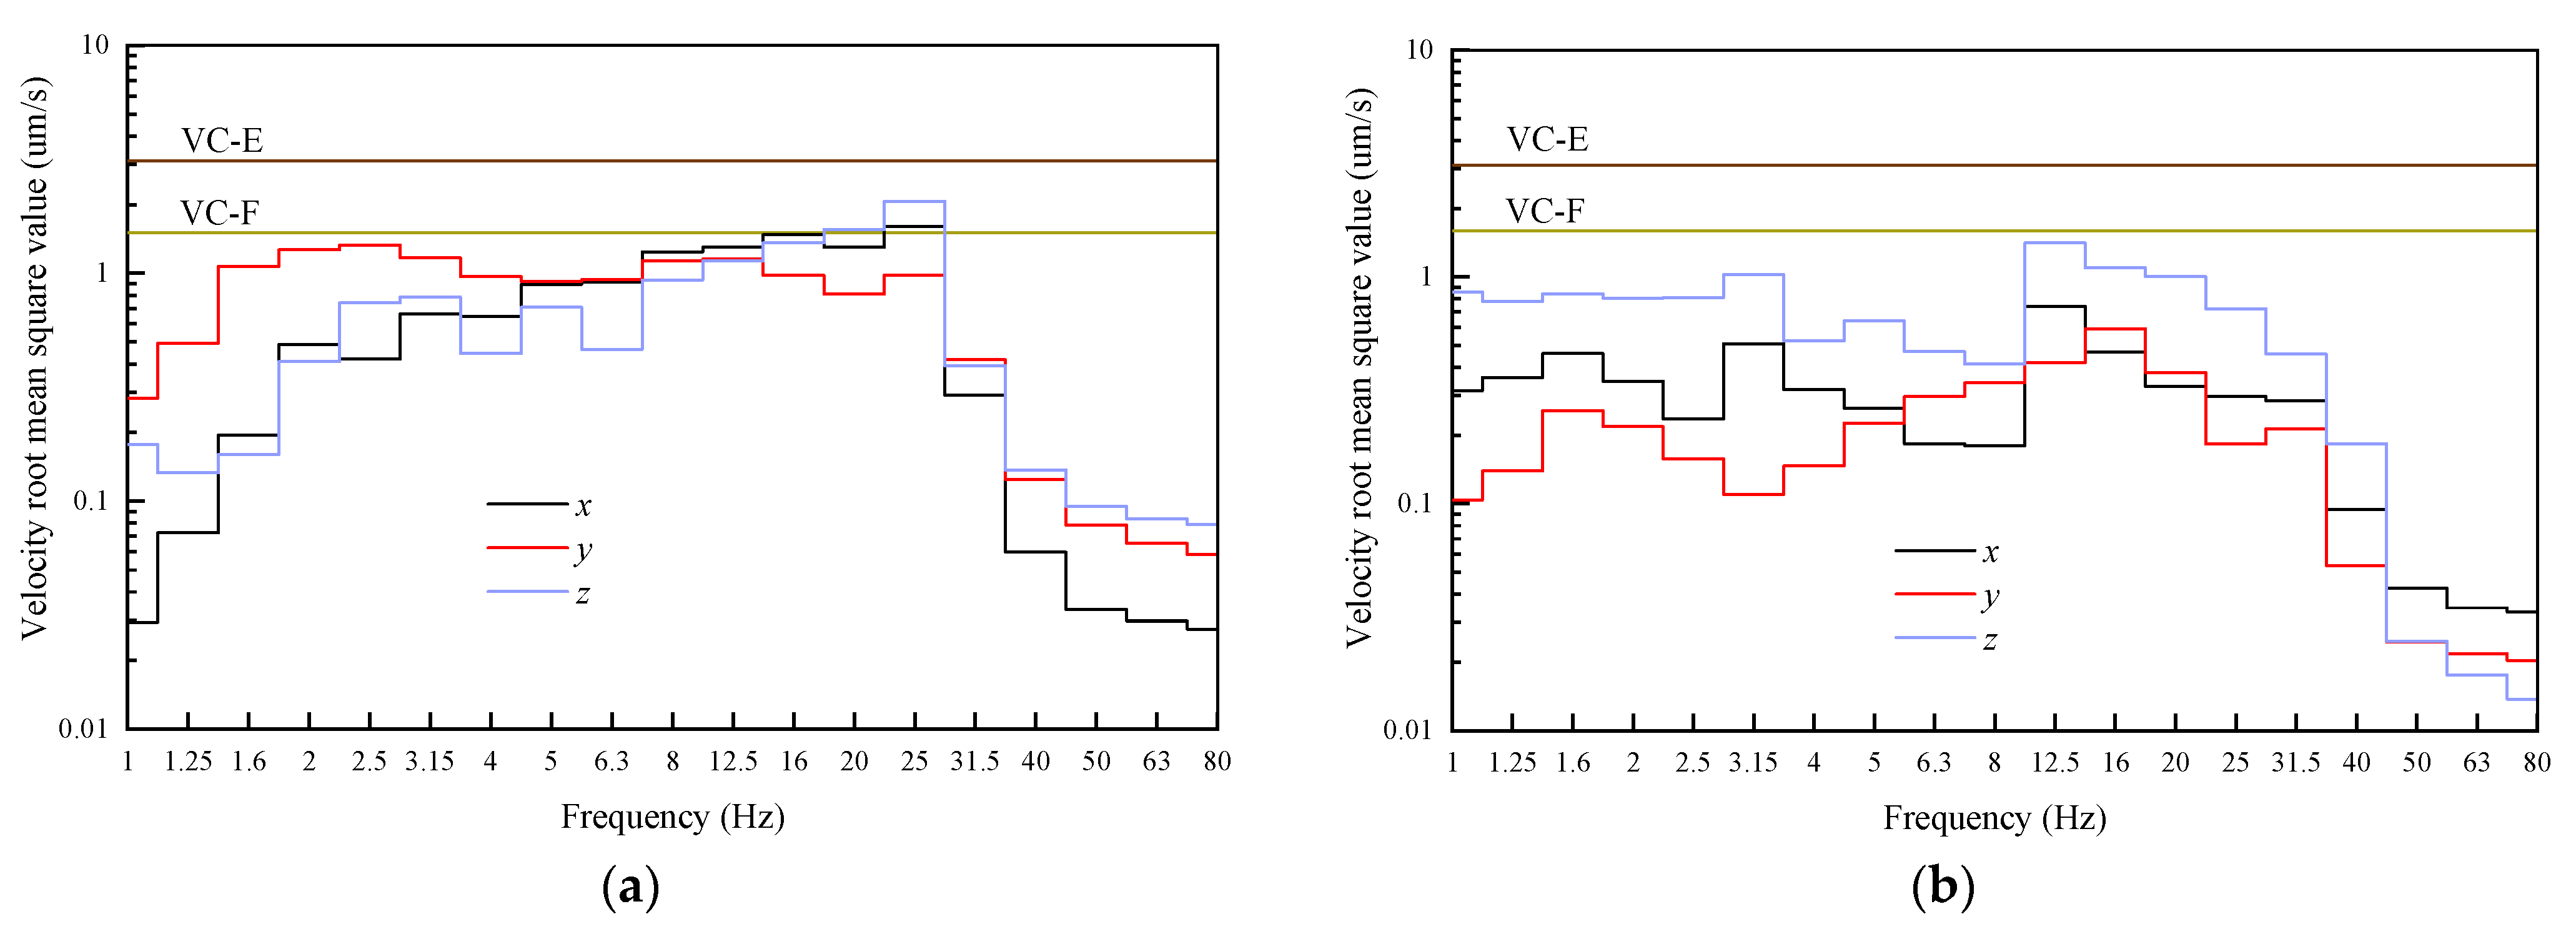
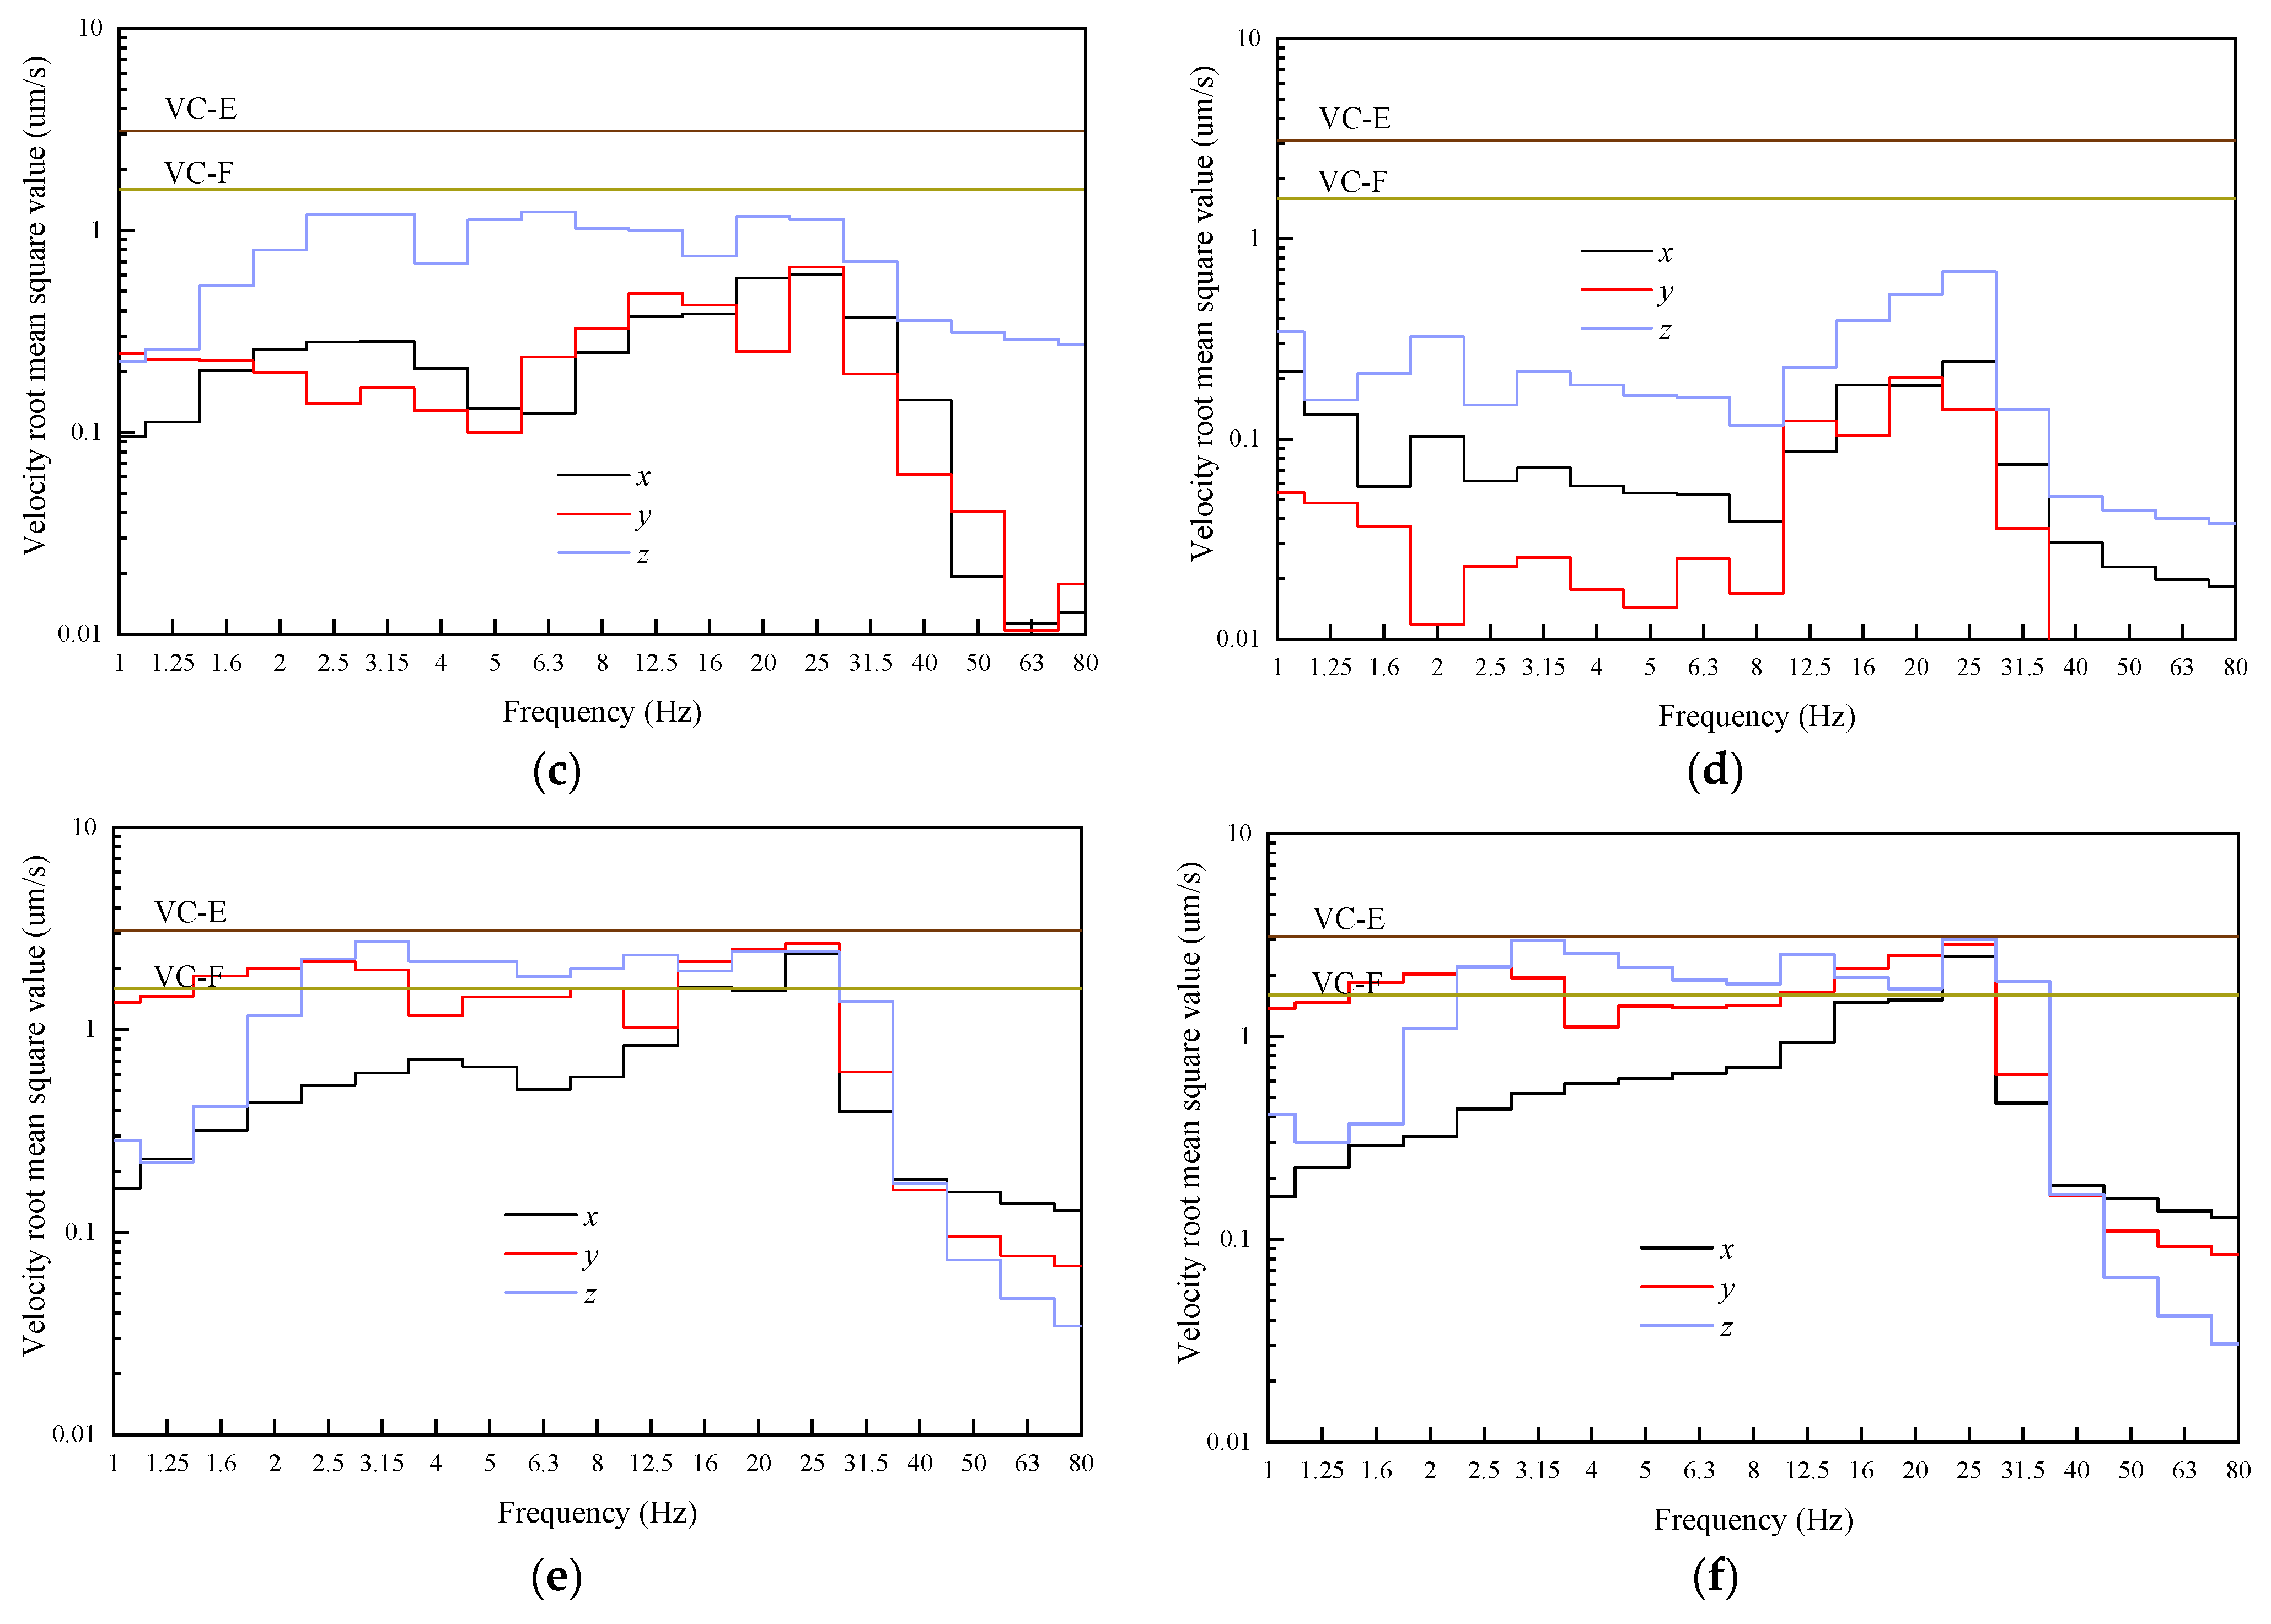
In accordance with the methods of the Gao team [7,8], various acceleration loads obtained from the measured results were input into the model to obtain the time–history data curve, which was converted to a frequency domain graph through a fast Fourier transform. The RMS value of the 1/3 octave velocity was calculated via MATLAB programming to determine whether it met the requirements of the VC-E vibration criterion. Below is the root-mean-square value of the vibration velocity of the floor of a one-story structure obtained from the input models of four different types of traffic loads obtained in the field test. Considering that various loads may act together in real life for a certain period, this paper also conducted two additional simulations of comprehensive effects. In the first simulation, four types of loads act in the same direction, that is, they act on the same side of the floor. In the second simulation, each load acts on the surrounding side of the floor. The vibration response of the floor under the comprehensive effects of these two types of loads is observed. A spectrum diagram of various loads is shown in Figure 9.
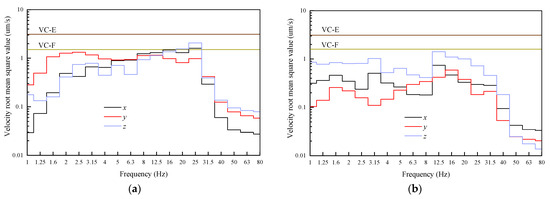
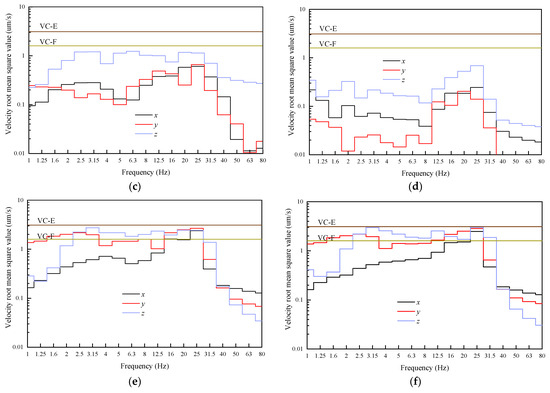
Figure 9.
One-third frequency octave band of the RMS value of the site speed under various loads. (a) One-third frequency octave band of the RMS value of the site speed under vehicle loads. (b) One-third frequency octave band of the RMS value of the site speed under pedestrian loads. (c) One-third frequency octave band of the RMS value of the site speed under high-speed rail loads. (d) One-third frequency octave band of the RMS of the site speed under aircraft loads. (e) One-third frequency octave band of the RMS value of the site speed under the combined action of loads (in the same direction). (f) One-third frequency octave band of the RMS value of the site speed under the combined action of loads (in different directions).
As seen from the vibration velocity frequency domain diagram of the site under each load, the vehicle load is the main source of all traffic loads—the vibration response caused by it is still mainly low-frequency and its main frequency component is approximately 25 Hz because the test speed is slow and the vibration velocity and frequency of the test point have a certain degree of weakening influence. Further tests will be conducted considering vehicle type and speed. According to the vibration standard, the vibration caused by vehicle load generally reaches the standard of VC-F, and the higher the frequency, the faster the attenuation. The other loads independently met the control standards. The main frequency of pedestrian loads is approximately 12.5 Hz, which may be due to the significant suppression of high-frequency vibration components of pedestrian load through the soil layer filtration of the site and the action of the structure itself during testing. The main frequency of high-speed rail loads and aircraft loads is approximately 25 Hz because the actual application points of these two loads are far away. In this paper, point load is used for simulation, which is greatly affected by environmental factors, and there are too many interference sources during vibration propagation. Field tests will be conducted again after the construction of the structure to verify the simulation results. Using a comprehensive comparison, it is found that the vertical vibration of these traffic loads is significantly greater than the horizontal vibration, which is consistent with what is mentioned in the literature [28]. Under the comprehensive action of each load, regardless of whether it is in the same direction or in different directions, the vibration intensity increases, and the maximum velocity amplitude increases by 20% and 50%, respectively, compared with the vehicle load. The vibration standard of the site has reached the standard of VC-E, with the main frequency distribution area of 25 Hz and the curve distribution law similar to that of the vehicle load. This finding shows that the vehicle load is the main controlling factor of site vibration in this project. Therefore, some vibration reduction and isolation measures must be established to reduce the vibration caused by it.
5. Research on the Control of Small Isolation Ditches
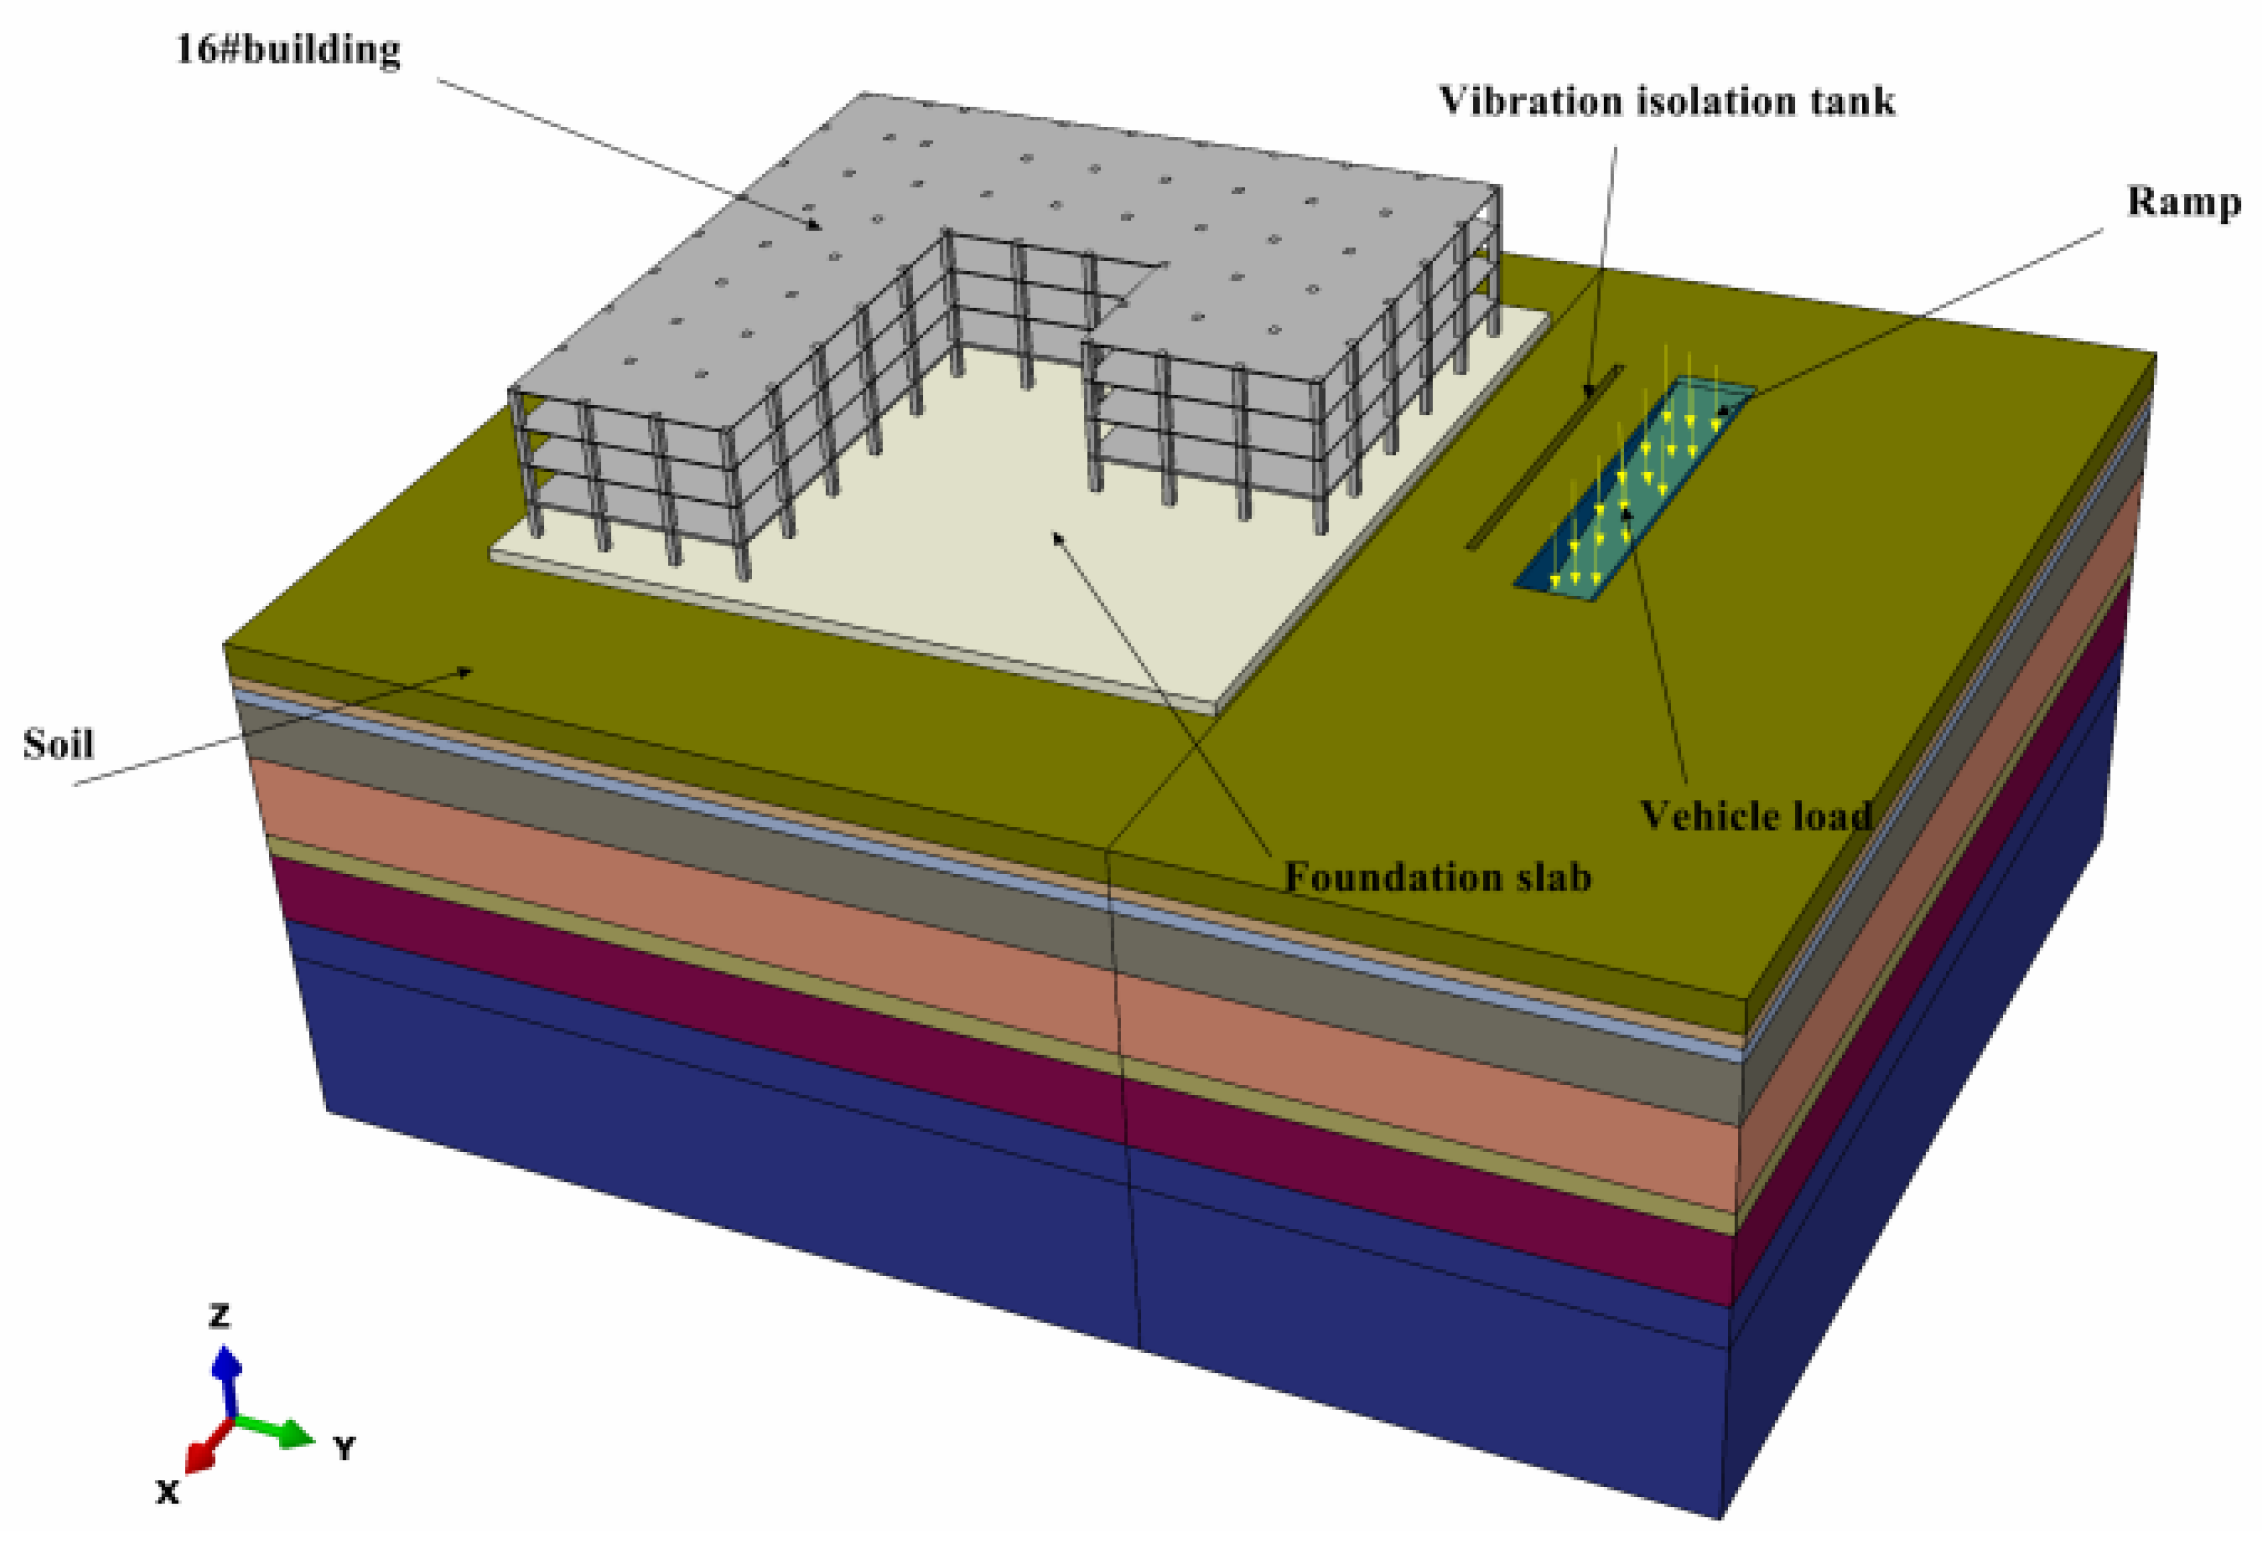
Vibration isolation ditches are often used as the first vibration isolation measure for precision instruments and equipment building structures; their construction is simple, economical, and efficient and is widely used in practical engineering. In this project, the north side of building #16 is an underground garage entrance. To reduce the impact of slope vibration caused by incoming and exiting vehicles, most projects choose to arrange an ornamental pond between the ramp and the floor (Figure 10), which can be regarded as a small vibration isolation ditch. An empty ditch is selected as the research object in this paper, which can effectively cause discontinuity of the propagation medium and reduce the harm of environmental micro-vibration. Research on the influence of small isolation gullet hooks on slope loads is lacking. According to the mechanism of the focal load on a building structure, this paper investigates the isolation control effect of the depth, width, and relative position of the three parameters of the isolation pond.
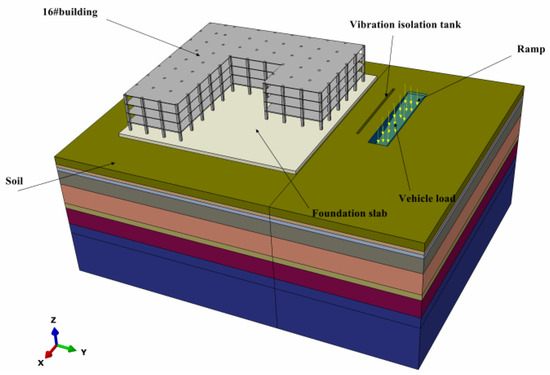
Figure 10.
Numerical model of the vibration isolation ditch.
To evaluate the vibration isolation effect of different pool arrangements, an evaluation criterion is introduced to define the peak vibration level reduction rate δmax, which is used to compare the reduction amplitude of the mean square value of the maximum vibration acceleration before and after taking vibration isolation measures. The calculation is as follows:
where v1 is the root-mean-square value of the maximum vibration acceleration of the pool without vibration isolation at the 1/3 octave and v2 is the root-mean-square value of the maximum vibration acceleration of the pool with vibration isolation at the 1/3 octave.
5.1. Location of Vibration Isolation Pool
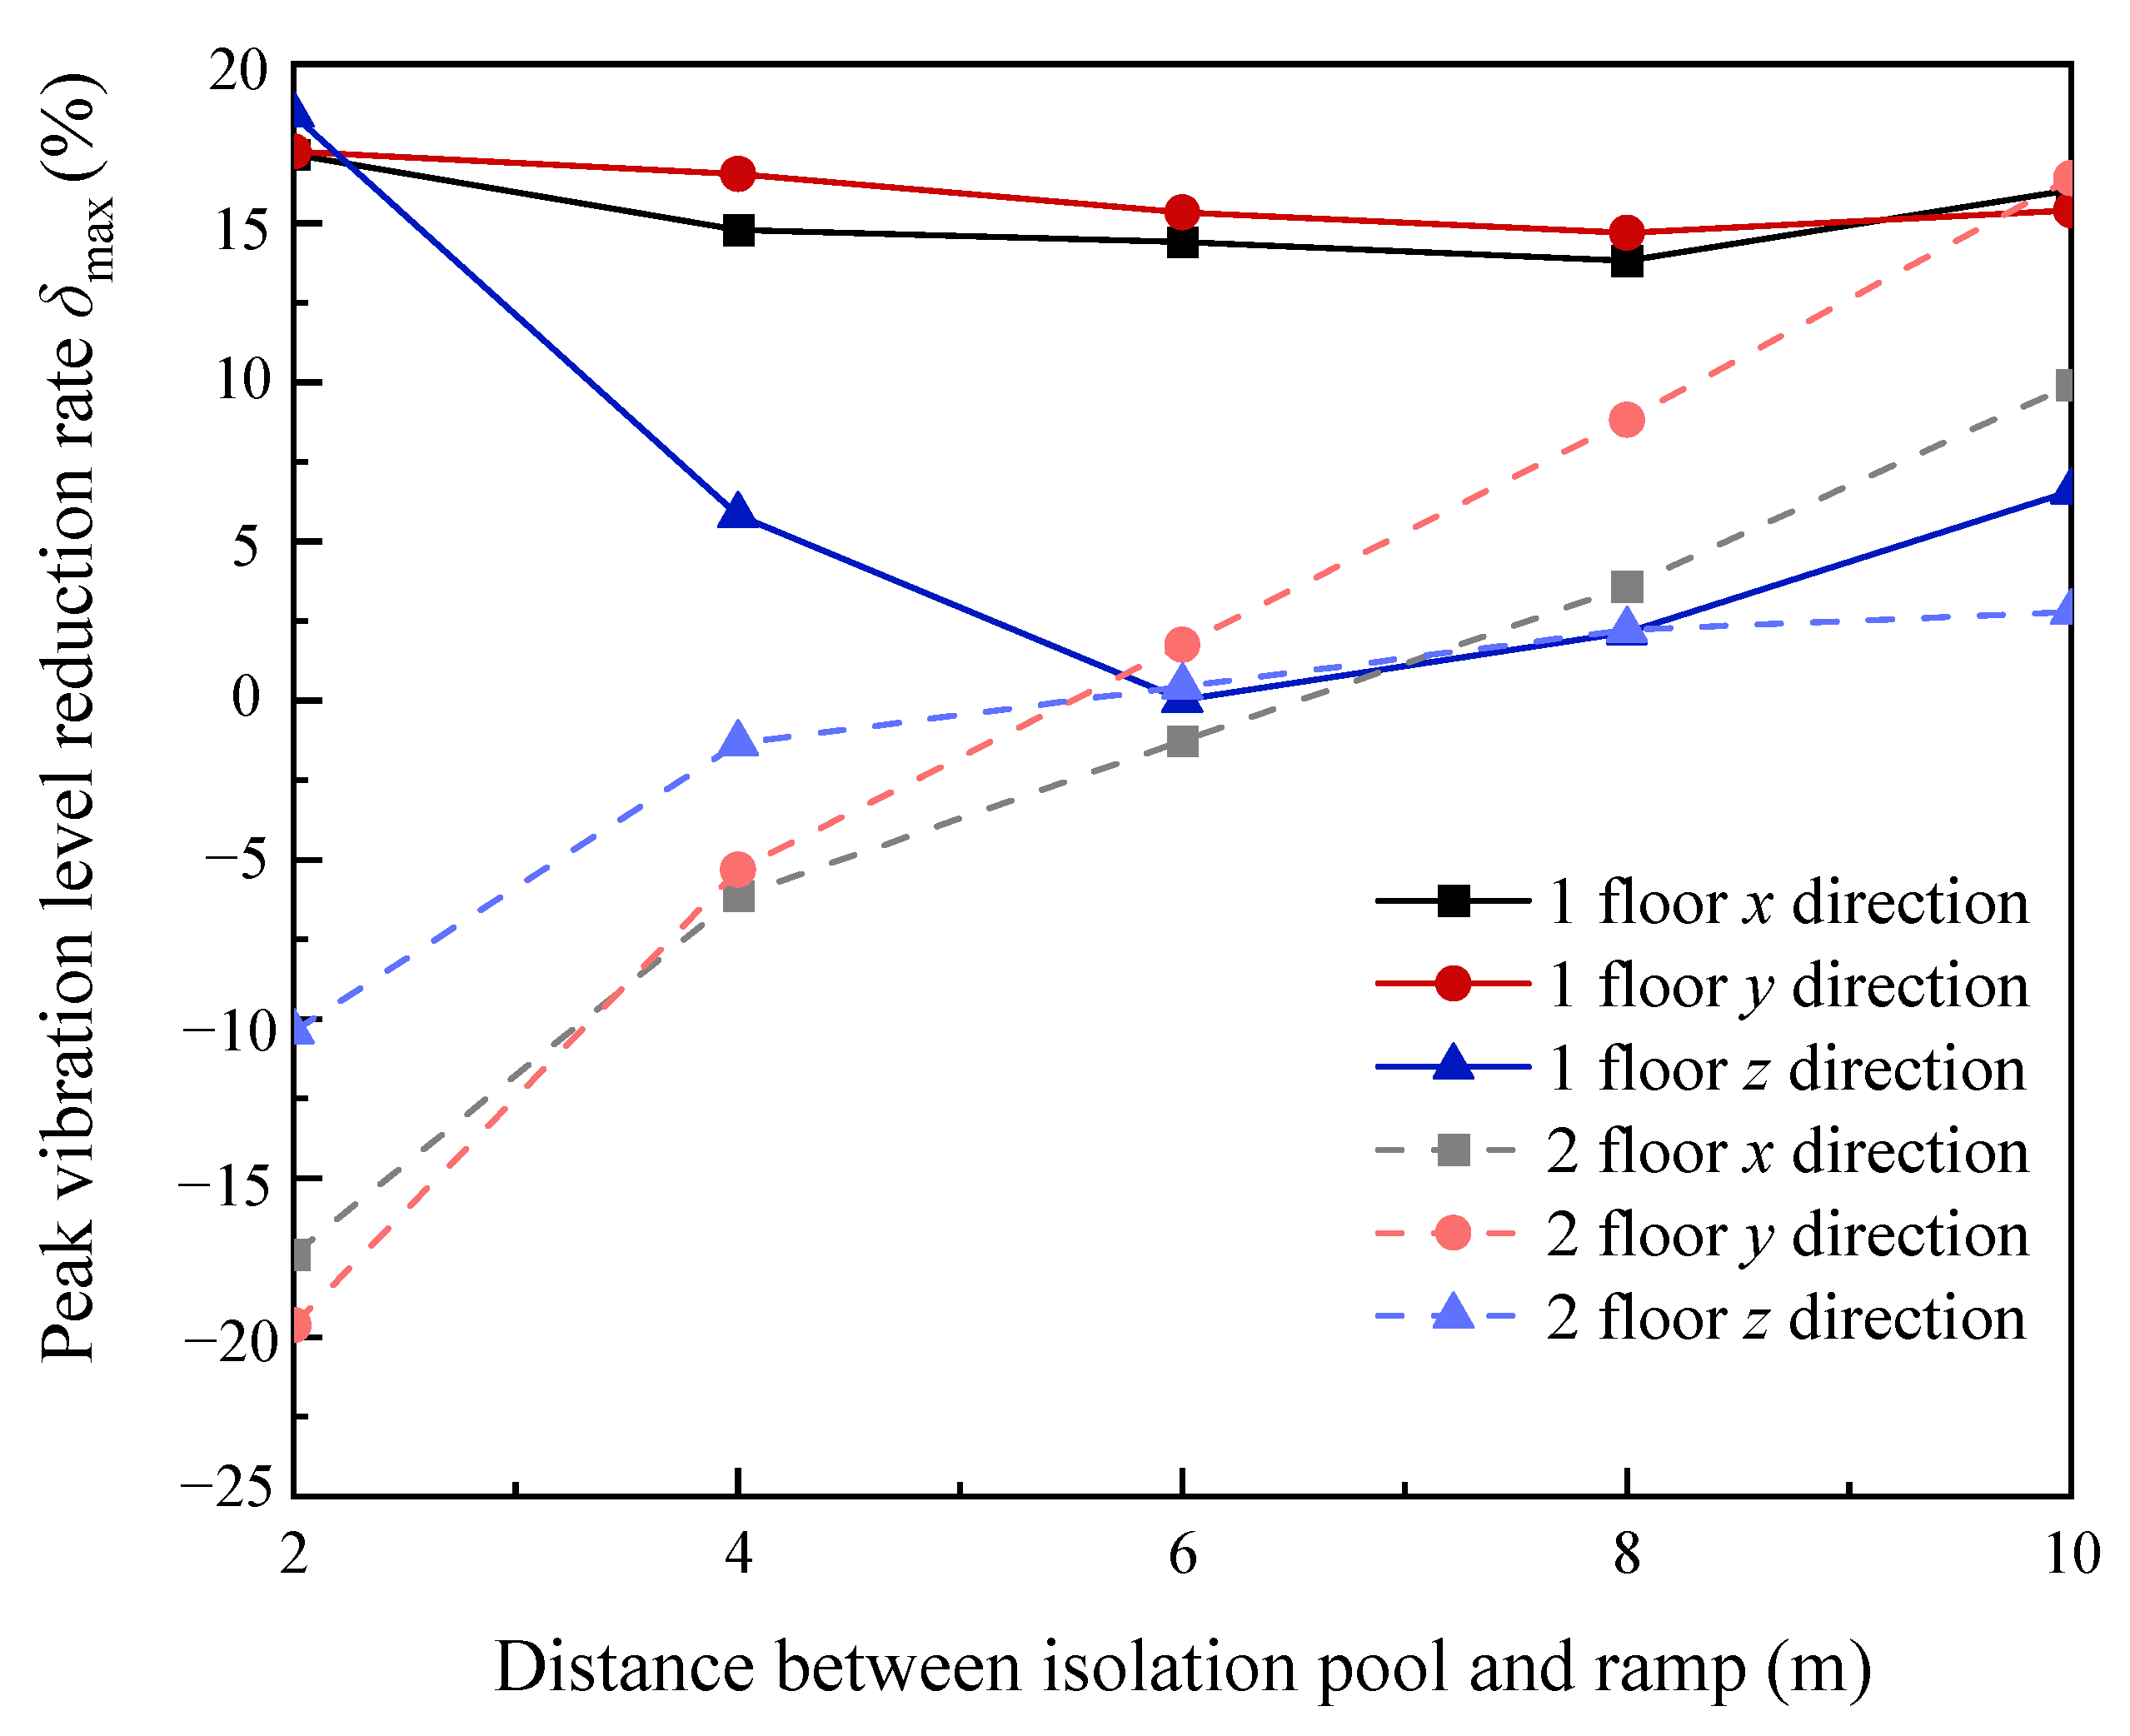
When the distance between the vibration isolation pool and the car ramp is 2, 4, 6, 8, or 10 m, the width is 2 m, and the depth is 3 m, the vibration isolation effect of each floor under different working conditions is analyzed. Figure 11 shows the reduction rate of the peak vibration level of the isolation pool at different positions. For a first-story structural floor, the vibration isolation basin has the best vibration isolation effect when it is located close to the source and the building, and the phenomenon is more obvious in the vertical direction, which confirms the results of [29]. Especially when the vibration isolation basin is close to the source, the maximum vibration reduction effect can reach nearly 20%. The reason for this phenomenon is that the location cuts off the propagation medium of the wave source for the first time. The vibration amplitude is attenuated to the maximum. However, the law of the floor of the two-story structure is completely opposite to that of the first-story structure, and the vibration isolation pool located near the source increases the vibration intensity. The reason for this phenomenon is very likely that the natural vibration frequency of the two-story structure is close to the load frequency, resulting in an inverse increase in the dynamic response. Therefore, the project must avoid this situation; in the early design, the vibration frequency of the source and the floor needs to be calculated, and the micro-vibration control area must be set at a reasonable floor position.
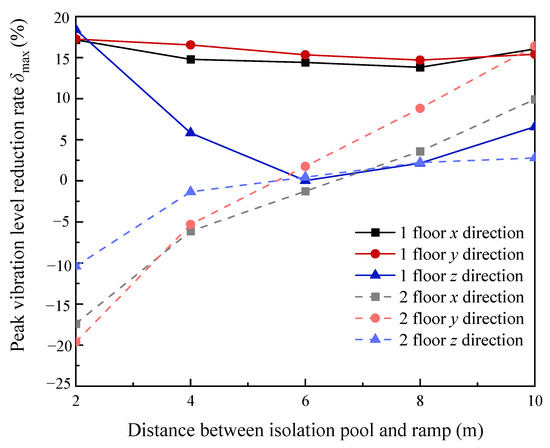
Figure 11.
The reduction rate of the peak vibration level of the isolation pool at different positions.
5.2. Depth of Vibration Isolation Pool
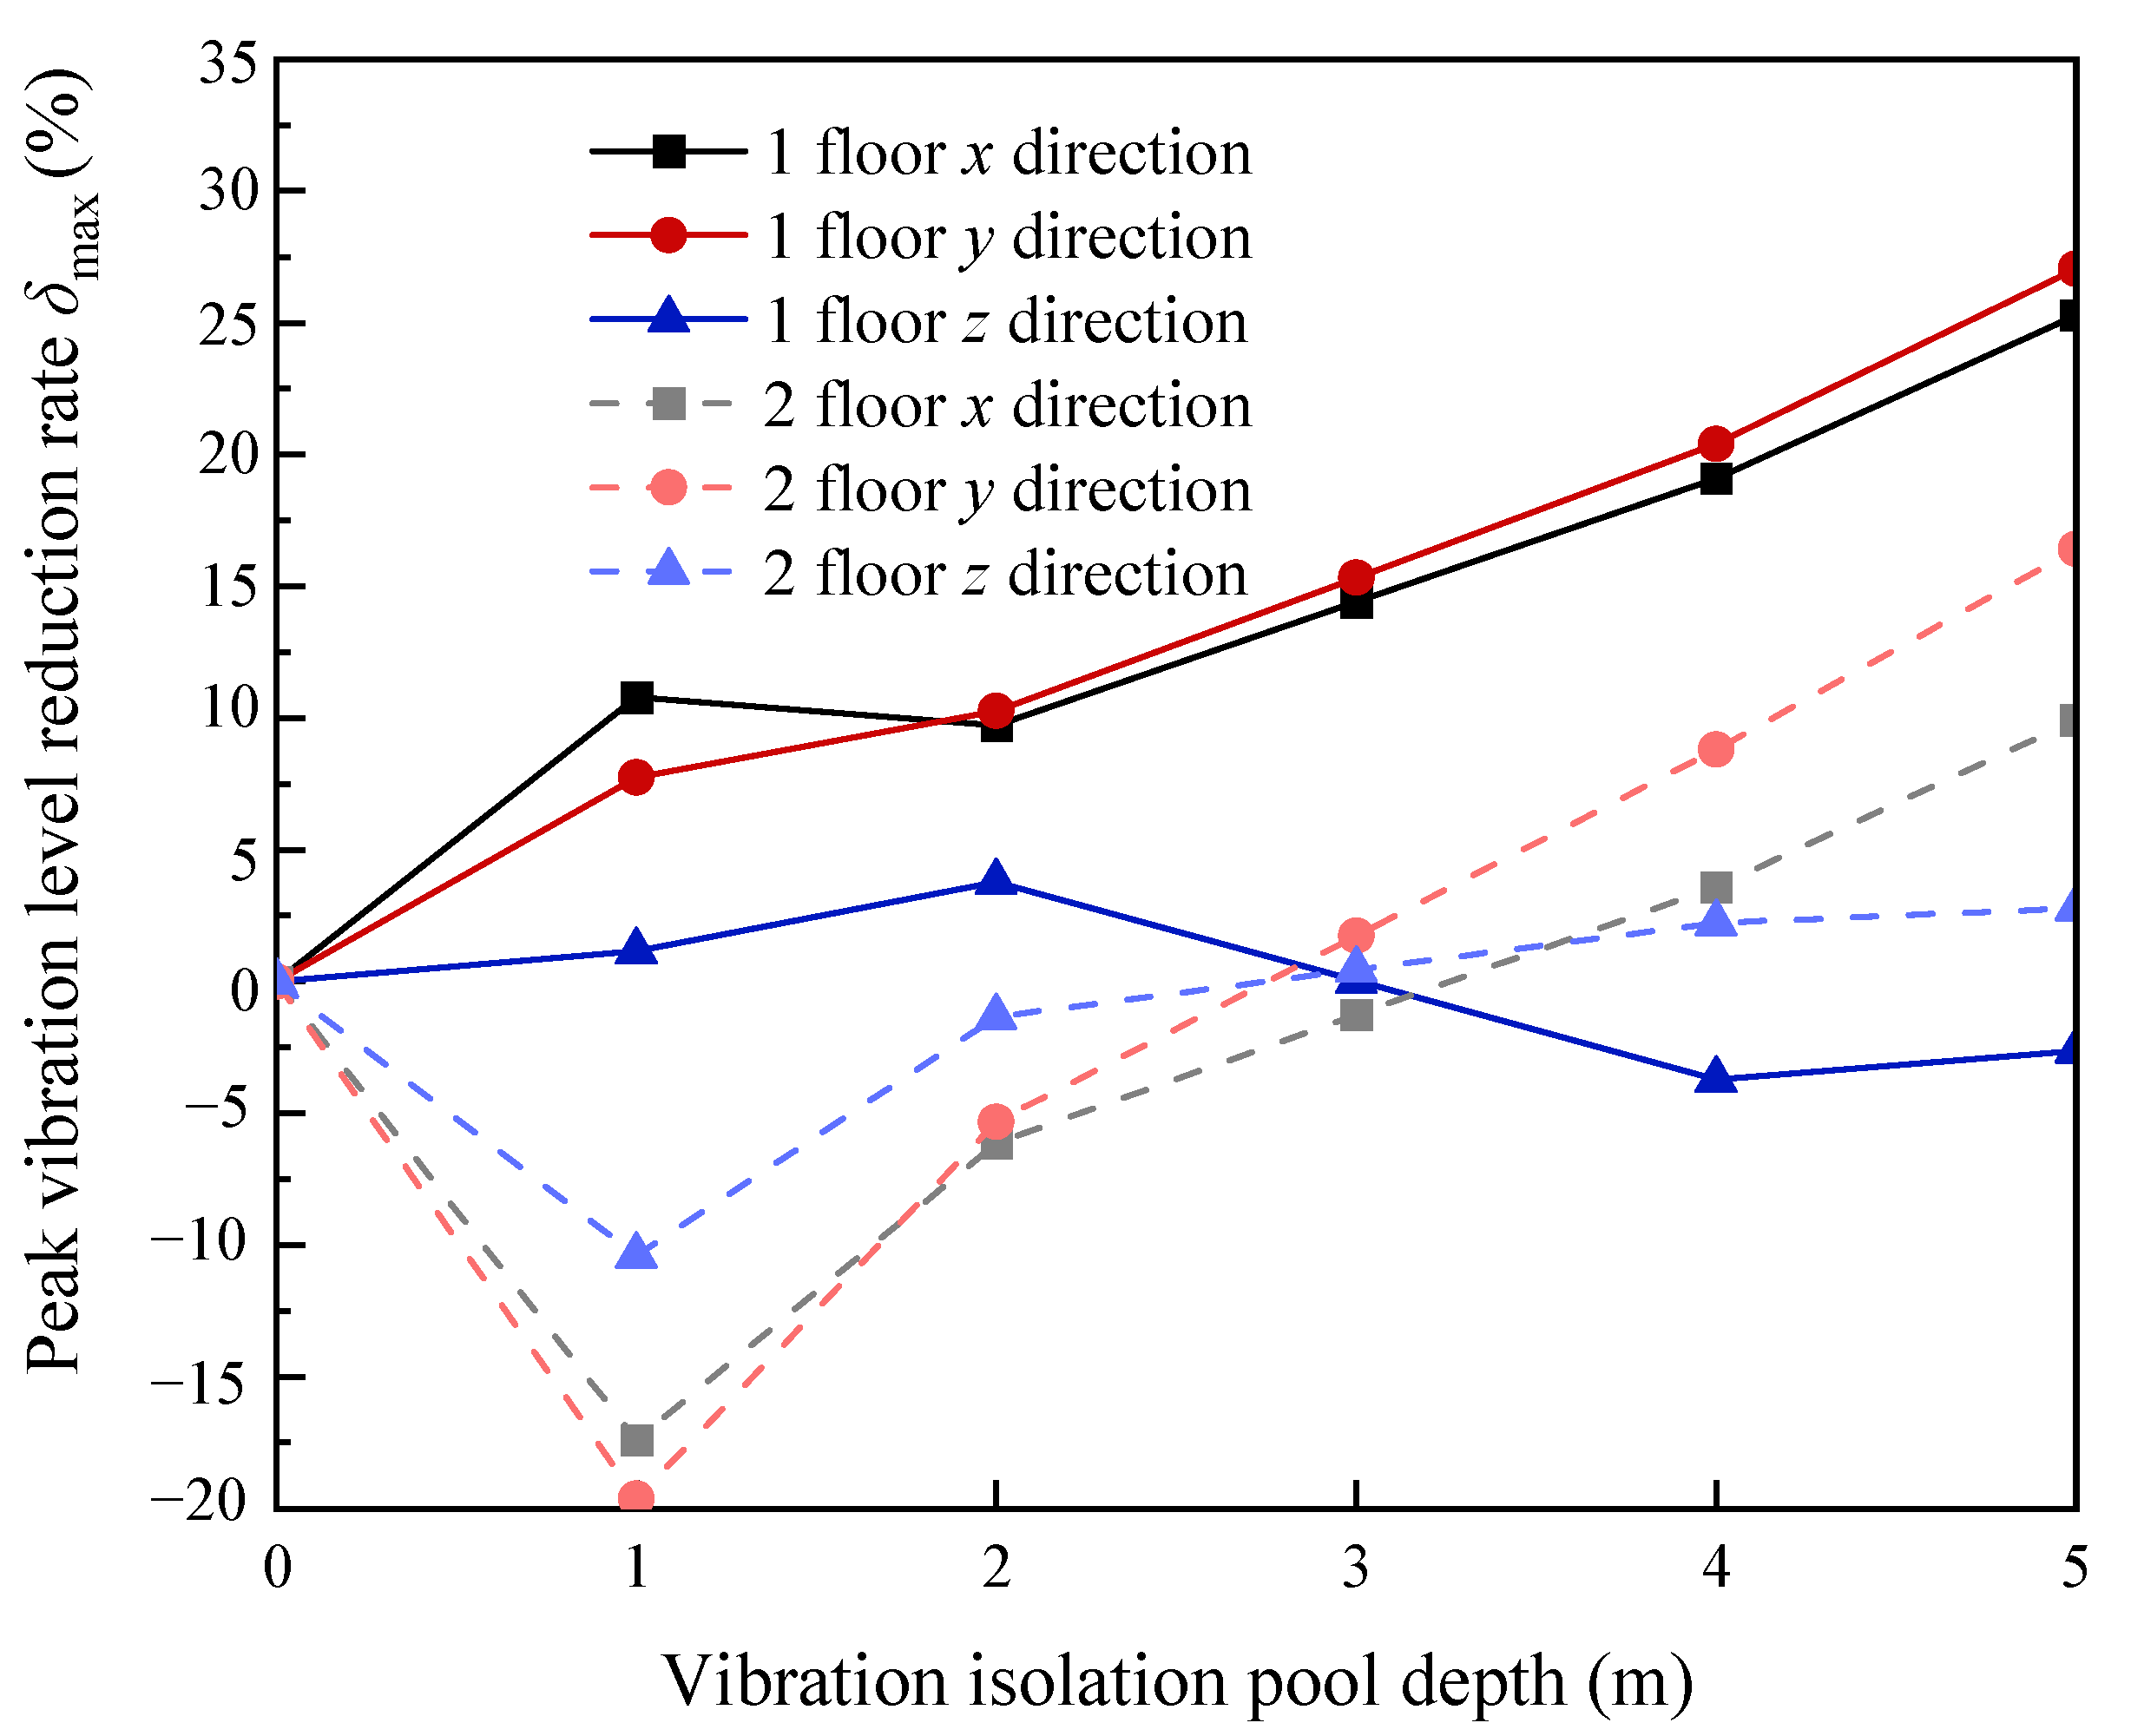
Taking the depth of the isolation pool as 1, 2, 3, 4, and 5 m and keeping the width 2 m and the distance from the source 6 m unchanged, the isolation effect of each floor under different working conditions is analyzed. Figure 12 shows the reduction rate of the peak vibration level of the isolation pool at different depths. The depth of the vibration isolation pool has an obvious suppression effect on horizontal vibration propagation. The maximum reduction rate of the peak vibration level of the first-story structural floor in the x- and y-directions can reach approximately 25%. Although the vibration isolation effect of the second-story structural floor is slightly weakened, the rules of the two floors remain consistent. Notably, the depth of the vibration isolation pool is greater than the vertical depth of the ramp as much as possible; a depth less than this depth may cause a poor vibration isolation effect or a reverse increase in the vibration strength.
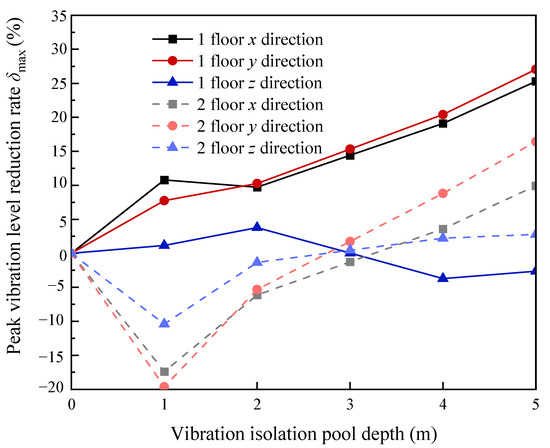
Figure 12.
The reduction rate of the peak vibration level at different depths of the isolation pool.
5.3. Width of Vibration Isolation Pool
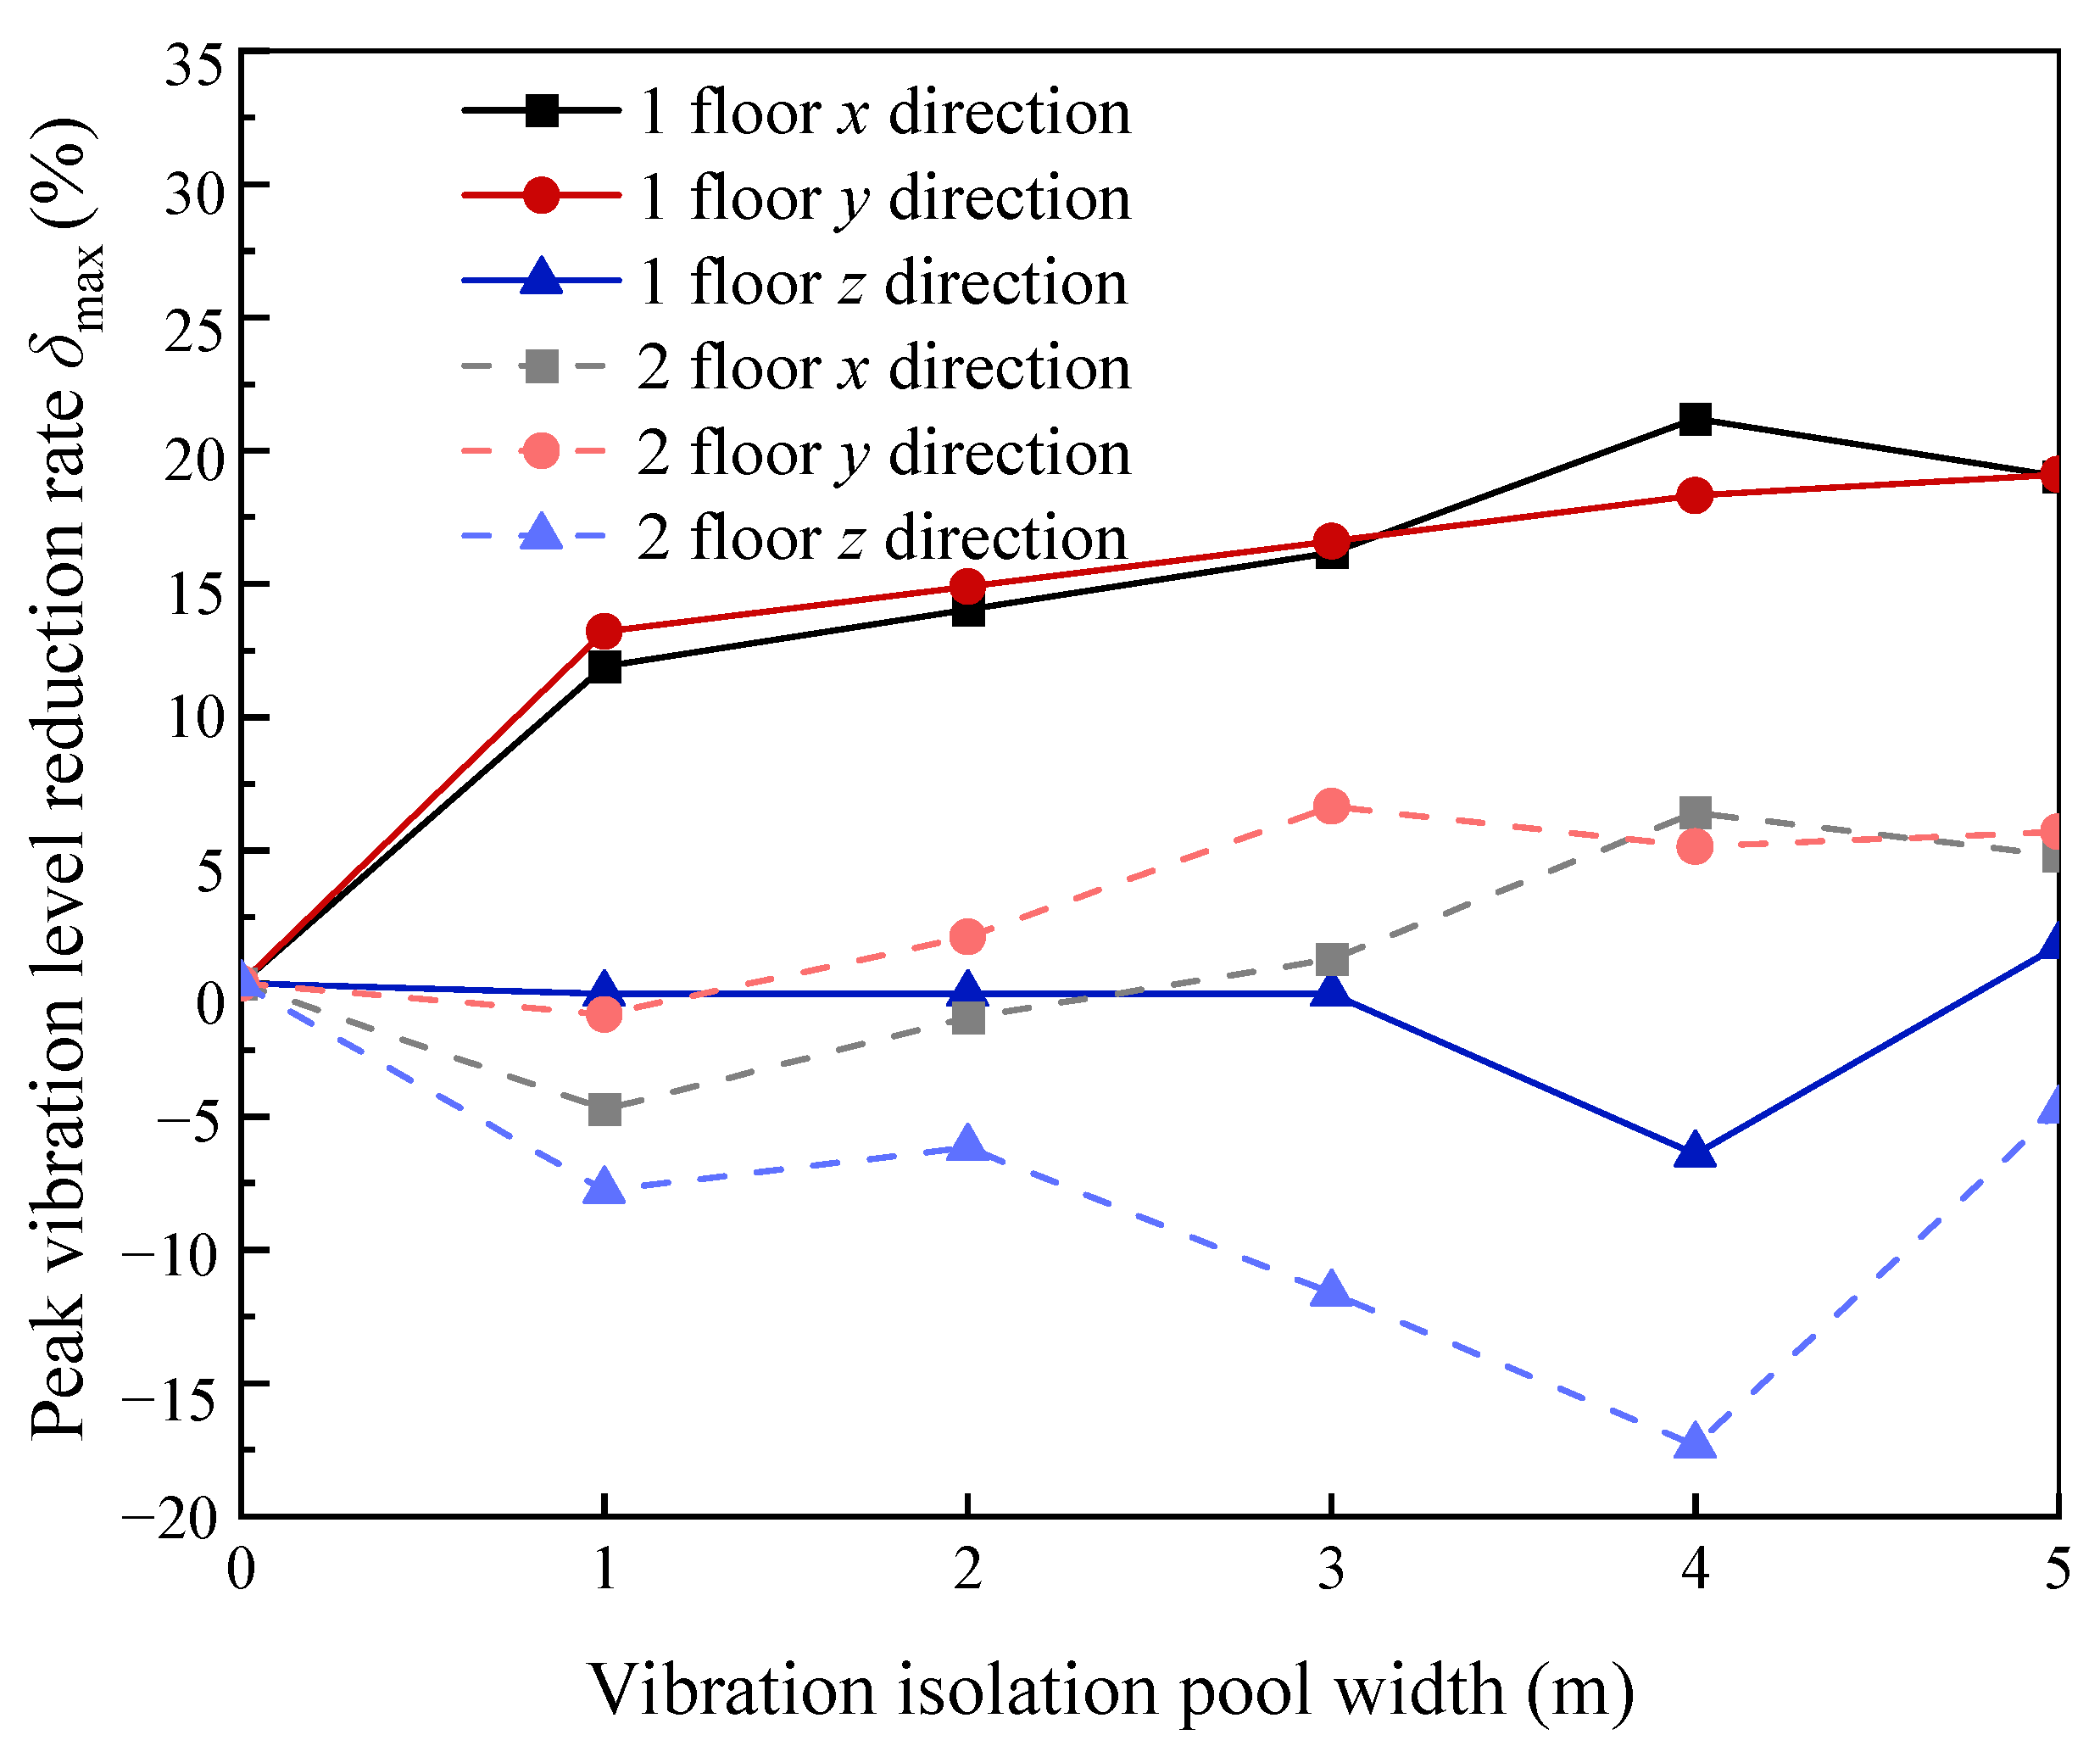
The isolation effect of each floor under different working conditions is analyzed when the width of the isolation pool is 1, 2, 3, 4, or 5 m, the depth is 3 m, and the distance from the source is 6 m. Figure 13 shows the reduction rate of the peak vibration level of the isolation pool of different widths. A comparison of the above two factors reveals that the vibration intensity curve is relatively gentle at each width, the vibration isolation effect is not significantly improved with increasing width, and the first-layer structure is always in the range of 15–20%, which is consistent with the conclusions obtained in the literature [21,22]. Similarly, the vibration amplitude of the second-layer structure is not sensitive to the vibration isolation pool. In addition, the results of the three vibration isolation tank parameters show that the reduction in vertical vibration is almost zero because the slope is different from the ground and because the vertical components of the load perpendicular to the slope direction and along the slope direction may cancel each other. This situation is particularly noteworthy in engineering as most projects pay more attention to vertical vibration. Other vibration isolation measures are needed, including structural measures such as increasing floor thickness.
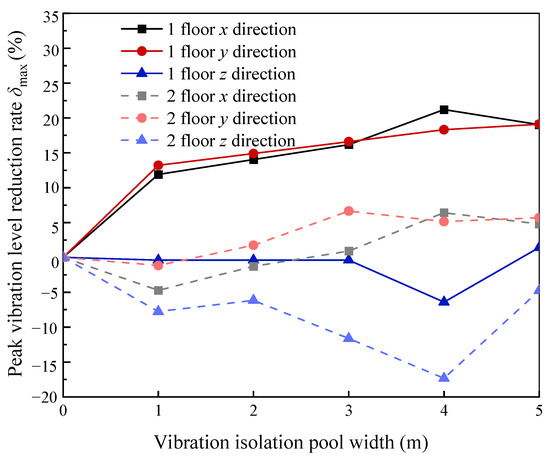
Figure 13.
The reduction rate of the peak vibration level of different isolation pool widths.
According to the analysis of the above factors, we can take relevant measures to avoid the adverse effects of micro-vibration in practical engineering. The examples of such measures are as follows: (1) The isolation ditch should be set as close to the source or the building as possible, and the effect on different floors is best when it is close to the building. Notably, in early design, attention should be given to the natural vibration frequency of the structural building, combined with field tests to determine whether the frequency of the micro-vibration load is similar and the phenomenon of resonance should be avoided. (2) The vibration isolation trench should be dug as deep as possible, the stiffness of the filling material should be as different as possible from that of the soil layer, and the vibration wave can be further weakened via layer isolation.
6. Conclusions
- (1)
- In this work, the measured results are input into the numerical model of the structural site as loads, and the vibration law of the site under various loads is obtained. The root-mean-square velocity value is stable below VC-E, which meets the design requirements. The research results have a certain significance for guiding actual construction.
- (2)
- Under the comprehensive action of multiple loads, the vibration amplification effect of the site structure is obvious. The curve distribution is controlled by the factors of vehicle loads with large amplitudes, and the main frequency distributions are consistent.
- (3)
- The isolation effect is best when the small isolation ditch is located close to the source and the building. The depth of the isolation ditch needs to be greater than the maximum depth of the source to have a better effect, the width of the isolation ditch has less influence, and the resonance between the source and the site needs to be avoided.
- (4)
- Small vibration isolation trenches have poor vibration isolation effects on vertical vibration. Since the vertical components of nonorthogonal triaxial loads may cancel each other, other structural vibration isolation measures are needed.
In this work, the soil layer is homogenized and multilayered during modeling. In practice, traffic loads such as high-speed railway vehicles are often blocked by other building foundations or rivers on the propagation path, and the influencing factors are relatively complex and can be further analyzed in future studies. In addition, this paper simplifies the form of the comprehensive action of loads, so the method of machine learning can be used in subsequent research to further summarize it and summarize the vibration law generated by the joint action of multiple loads on a structure.
Author Contributions
Conceptualization, Y.L.; methodology, F.F.; software, F.F.; validation, W.C.; formal analysis, F.F.; resources, Y.L.; data curation, Y.L.; writing—original draft preparation, F.F.; writing—review and editing, Y.L.; visualization, W.C.; supervision, Y.L.; project administration, Y.L.; funding acquisition, Y.L. All authors have read and agreed to the published version of the manuscript.
Funding
This research was funded by the Construction Research Project of Zhejiang Province (Approval number: 2023K085).
Data Availability Statement
The data that support the findings of this study are available from the corresponding author upon reasonable request.
Conflicts of Interest
Authors Feifan Feng, Yunjun Lu, Weiwei Chen were employed by the company Zhejiang Province Institute of Architectural Design and Research Co., Ltd. The authors declare that the research was conducted in the absence of any commercial or financial relationships that could be construed as a potential conflict of interest.
References
- Zuo, H.; Zhao, Z.; Du, P. Prediction and analysis of the influence of subway running in curve section on the vibration of a gymnasium. J. Earthq. Eng. Eng. Vib. 2023, 43, 150–158. [Google Scholar]
- Hu, W.; Wang, X.; Yu, H. Effect of micro vibration of urban rail transit on south city wall in Xi’an. J. Earthq. Eng. Eng. Vib. 2012, 32, 88–95. [Google Scholar]
- Lee, C.; Wang, Y. Assessment of Floor Micro-Vibrations Induced by Moving Vehicles in High Technology Factories Using a Fragility-Based Method. IOP Conf. Ser. Earth Environ. Sci. 2019, 283, 012067. [Google Scholar] [CrossRef]
- Chik, T.; Yew, T.A.; Ibrahim, M.; Yusoff, N.A. Vibration criteria analysis on floor at laboratory room. IOP Conf. Ser. Earth Environ. Sci. 2019, 220, 012021. [Google Scholar] [CrossRef]
- Rucker, W. Measurement and evaluation of random vibrations. In Proceedings of the International Symposium on Dynamic Methods in Soil and Rock Mechanics (DMSR77), Karlsruhe, Germany, 5–16 September 1977; pp. 407–421. [Google Scholar]
- Kitamura, Y. Simulation and observations of ground vibration caused by road traffic. In Proceedings of the International Seminar on Environment Vibration, Hangzhou, China, 16–18 October 2003. [Google Scholar]
- Gao, G.; Mu, Z.; Geng, J.; Chen, J. Investigation of the Effects of Subway Induced Environmental Vibration on Proposed Residential and Office Buildings through in-situ Measurement. Noise Vib. Control 2020, 40, 180–186. [Google Scholar]
- Gao, G.; Zhong, W.; Meng, Y.; Geng, J. Micro-vibration Test and Numerical Simulation Analysis of Precision Instrument Workshop. J. Eng. Geol. 2020, 28, 1076–1083. [Google Scholar]
- Gao, G.; You, Y.; Bi, J. Micro-vibration Test andAnalysis for Electronic Industrial Workshops. Noise Vib. Control 2020, 40, 239–244. [Google Scholar]
- Gao, G.; Chen, J.; Zhu, L. NumericalAnalysis of the Vibration Impact Induced by Underground Moving Trains on Surrounding Buildings in Shanghai. Noise Vib. Control 2016, 36, 136–141. [Google Scholar]
- Xie, Y.; Li, L.; Wang, L. Prediction and Countermeasure for the Influence of Metro Vibration on Precise Instrument. Urban Rail Transit Res. 2016, 19, 46–50. [Google Scholar]
- Chen, Z.; Xu, H.; Yin, Q.; Zhu, S. Study on low-frequency microvibration and transmission rule of adjacent buildings caused by subway operation. J. Vib. Eng. 2023, 36, 1623–1632. [Google Scholar]
- Jia, B.; Zhou, Z.; Yuan, W.; Zhang, J. Study on Vibration Evaluation of Buildings around High-speed Railway Line Based on Equivalent Peak Particle Velocity. Rock Soil Mech. 2023, 44, 2696–2706. [Google Scholar]
- Hao, H.; Ang, T.C.; Shen, J. Building vibration to traffic-induced ground motion. Build Environ. 2001, 36, 321–326. [Google Scholar] [CrossRef]
- Xing, Y.; Sun, H.; Zhang, Y. Analysis of Attenuation Law of Micro-vibration Response in Variable Sites under Traffic Loads. Noise Vib. Control 2023, 43, 182–187+194. [Google Scholar]
- Sun, H.; Xing, Y.; Hao, Y.; Dong, J.; Wang, J. Analysis of Micro-vibration Response of the Site under Traffic Load Impact. Noise Vib. Control 2022, 42, 208–213+220. [Google Scholar]
- Yu, P.; Zhang, Y.; Gao, Z.; Song, W.; Zhao, Y. Structural microvibration monitoring and simulation analysis of the proton service building based on the construction process. Structures 2020, 27, 1841–1850. [Google Scholar] [CrossRef]
- Zhang, G.; Qian, J.; Zhao, P.; Liu, F.; Song, T. Research on pedestrian vibration comfort of building structure. Build. Sci. 2021, 37, 27–35. [Google Scholar]
- Yang, W.; Li, H.; Kang, K.; Wang, M.; Liu, P. Analysis of Whole Process of Structural Vibration Induced by Underground High-speed Train and Performance of Vibration Isolation Support. J. Vib. Shock 2022, 41, 254–264. [Google Scholar]
- Wu, Y.; Song, R.; He, L.; Liu, B. Ground Train Loads Act under Ground Barriers on Building Floors Analysis of Vibration Isolation Effect. J. Vib. Eng. 2020, 33, 322–330. [Google Scholar]
- Shrivastava, R.K.; Kameswara, R. Response of Soil Media Due to Impulse Loads and Isolation Using Trenches. Soil Dyn. Earthq. Eng. 2002, 22, 695–702. [Google Scholar] [CrossRef]
- Deng, Y.; Xia, T.; Chen, J. Analysis of Efficiency of Vibration Isolating Groove Subjected to Vehicle Load. Rock Soil Mech. 2007, 28, 883–887+894. [Google Scholar]
- IEST-RP-CC012; Considerations in Cleanroom Design. Institute of Environmental Sciences and Technology: Schaumburg, IL, USA, 2005.
- Zhao, J.; Li, Z.; Guo, X.; Wang, J. Numerical Analysis of Bitumen-surface Highway Dynamic Response under Vehicle loads. J. Railw. Sci. Eng. 2012, 9, 83–89. [Google Scholar]
- Wang, M. Study on the Dynamic Response of the Ming Great Wall under the Vibration of Ground Traffic. Master’s Thesis, Beijing Jiaotong University, Beijing, China, 2021. [Google Scholar]
- Li, B.; Gao, Y.; Wei, D.; Liu, H. Research on Influential Depth of Vehicle Loads and Its Influencing Factors. Rock Soil Mech. 2005, 26, 310–313. [Google Scholar]
- Liang, Z. The Dynamic Response Analysis of Xi’an City Wall Structure under Traffic Random Loads. Master’s Thesis, Xi’an University of Architecture and Technology, Xi’an, China, 2013. [Google Scholar]
- Chen, Z. Measurement and Numerical Simulation Analysis of Road Traffic Induced Microvibration in Precision Instrument Laboratory. Master’s Thesis, Guangzhou University, Guangzhou, China, 2023. [Google Scholar]
- Chen, H. Study on the Mechanism and Scheme of Vibration Isolation Ditch to Reduce the Disturbance of Train Operation to the Underground Diaphragm Wall. Master’s Thesis, Taiyuan University of Technology, Taiyuan, China, 2022. [Google Scholar]


Disclaimer/Publisher’s Note: The statements, opinions and data contained in all publications are solely those of the individual author(s) and contributor(s) and not of MDPI and/or the editor(s). MDPI and/or the editor(s) disclaim responsibility for any injury to people or property resulting from any ideas, methods, instructions or products referred to in the content. |
© 2024 by the authors. Licensee MDPI, Basel, Switzerland. This article is an open access article distributed under the terms and conditions of the Creative Commons Attribution (CC BY) license (https://creativecommons.org/licenses/by/4.0/).