Article

A Preliminary Study on Mitigation Techniques for 3D Deformation of Adjacent Buildings Induced by Tunnelling in Water-Rich Strata: A Case

1
School of Civil Engineering, Harbin Institute of Technology, Harbin 150090, China
2
China Construction Eighth Engineering Division Rail Transit Construction Co., Ltd., Nanjing 210046, China
3
Key Lab of Structures Dynamic Behavior and Control of the Ministry of Education, Harbin Institute of Technology, Harbin 150090, China
4
Hunan Provincial Key Laboratory of Geotechnical Engineering for Stability Control and Health Monitoring, Hunan University of Science and Technology, Xiangtan 411201, China
*
Authors to whom correspondence should be addressed.
Symmetry 2024, 16(10), 1339; https://doi.org/10.3390/sym16101339
Submission received: 18 September 2024 / Revised: 2 October 2024 / Accepted: 4 October 2024 / Published: 10 October 2024

Abstract

:
Controlling the ground settlement and building deformation triggered by shield tunnelling, particularly within water-rich strata, poses a significant engineering challenge. This study conducts a finite element (FE) analysis focusing on the ground settlement and deformation of adjacent structures (with a minimum distance of 2.6 m to the tunnel) due to earth pressure balance (EPB) shield tunnelling. The analysis incorporates the influence of groundwater through a 3D fluid–solid coupling model. This study assesses the effects of tunnelling on the behaviour of nearby buildings and introduces two mitigation strategies: the vertical partition method and the portal partition method. Their effectiveness is compared and evaluated. Our findings reveal that the deformation curves of the stratum and the building are influenced by the accumulation and dissipation of pore pressure. The vertical partition method reduced surface settlement by approximately 70%, while the portal partition method further minimized building deformation but required careful application to avoid issues like uplift. Both methods effectively mitigate the impacts of tunnel construction, with the portal partition method offering superior performance in terms of material use and cost efficiency. This research provides a scientific foundation and technical guidance for similar engineering endeavours, which is vital for ensuring the safety of metro tunnel construction and the stability of adjacent buildings.

1. Introduction

In recent decades, China has seen a rapid and sustained expansion in the use of underground spaces, particularly with the swift development of subway systems. The shield tunnelling technique has become a prevalent method for constructing new tunnels [1,2,3] However, as these tunnels are often located in urban areas with limited overburden, excavation can cause ground movements and settlement [4], potentially leading to structural damage, such as cracking or even failure in buildings. Evaluating the potential impacts on nearby buildings is crucial to ensure these effects remain within the permissible structural limits. Accurate forecasting and control of tunnel displacement are essential for preserving the safety, stability, and longevity of existing structures.
Studying building deformation induced by tunnelling has been a topic of interest in the recent literature. Cao et al. [5]. investigated the movements of the ground and existing structures induced by TBM tunnelling, providing a valuable reference for forecasting settlement in clayey soils. Franza et al. [6] advanced our understanding of tunnel–building interactions with continuum solutions and a refined deformation prediction framework. Cao et al. [7] introduced an artificial neural network for real-time predictions of building damage during mechanized tunnelling. Amorosi and Sangirardi [8] employed 3D finite element (FE) modelling to evaluate the progressive damage to buildings caused by tunnelling. Soomro [9] explored the impact of twin stacked tunnels on piled rafts, while Zhong et al. [10] analyzed surface settlements from twin tunnel construction in mixed soil–rock conditions. Yang et al. [11] developed an empirical model for the 3D deformation at shield tunnel faces in soft clay, addressing the limitations of current estimation techniques. Dai et al. [12] investigated the influence of tunnelling on the deformation of excavation bracing systems and proposed effective countermeasures. Macchiarulo et al. [13] presented an integrated monitoring and assessment methodology using InSAR for tracking and assessing tunnelling-induced building deformation, combining automated deformation tracking with damage evaluation. Liu et al. [14] studied the influence of tail-grouting materials on tunnelling-induced ground deformation. Liang et al. [15] proposed a probabilistic assessment framework for in-service shield tunnel failure risks associated with tunnelling-induced deformation. Bayen and Samanta [16] investigated the responses of buildings on shallow foundations to tunnelling in cohesionless soil, aiming to identify potential hazards for structures near tunnel alignments. Overall, these studies highlight the importance of understanding and addressing tunnelling-induced ground deformation to ensure the safety and stability of infrastructure, with ongoing research crucial to advance tunnelling technologies and mitigate the associated risks.
Several studies have investigated techniques for mitigating building deformation caused by tunnelling. Active mitigation methods, such as compensation grouting, have effectively addressed settlement issues [17]. Additionally, using bored piles and micropiles has been explored due to their role in reducing tunnelling-induced ground deformation. Bilotta [18], Bilotta and Stallebrass [19], and Bilotta and Russo [20] examined the importance of the diaphragm wall characteristics to preventing damage due to tunnel excavation. Bai et al. [21] proposed strategies for protecting adjacent buildings during earth pressure balance (EPB) shield excavation: an underground cut-off wall for distances under 5 m, grouting reinforcement for distances between 5 and 10 m, and optimized construction parameters for distances over 10 m. Fantera et al. [22] evaluated the effectiveness of pre-installing a diaphragm wall between a tunnel and buildings to reduce the lateral displacement. Li and Zhang [23] examined passive pile responses to tunnelling, emphasizing the influence of soil anisotropy on tunnel–soil–pile interactions. Masini and Rampello [24] compared field data with soil–structure interaction FE analyses and empirical relationships to assess the efficiency of barriers made of bored piles. Li and Geng [25] introduced a combined reinforcement method using a foundation grouting oblique pipe roof, achieving dramatic reductions in deformation and angular distortion compared to using the traditional methods. However, the current reinforcement techniques are resource-intensive and costly and offer limited and often incomplete control over the deformation of the ground and structures. Developing more efficient and effective control methodologies and construction strategies is imperative to address these issues.
As computing technology advances, numerous progressive numerical methods have been developed to offer a versatile environment for analyzing structural responses [26,27]. This study develops a series of 3D fluid–solid coupling models to assess the surface settlement and structural deformation of adjacent buildings caused by EPB shield tunnelling. This research further compares the effectiveness of the vertical partition method and the portal partition method in reducing the impacts of deformation on neighbouring structures. Additionally, this study evaluates the cost-effectiveness of various mitigation strategies using different parameters. Analyzing these engineering challenges is essential for safeguarding the stability of both metro tunnels and the surrounding built environment. The findings of this research will provide valuable insights for the tunnel construction industry.

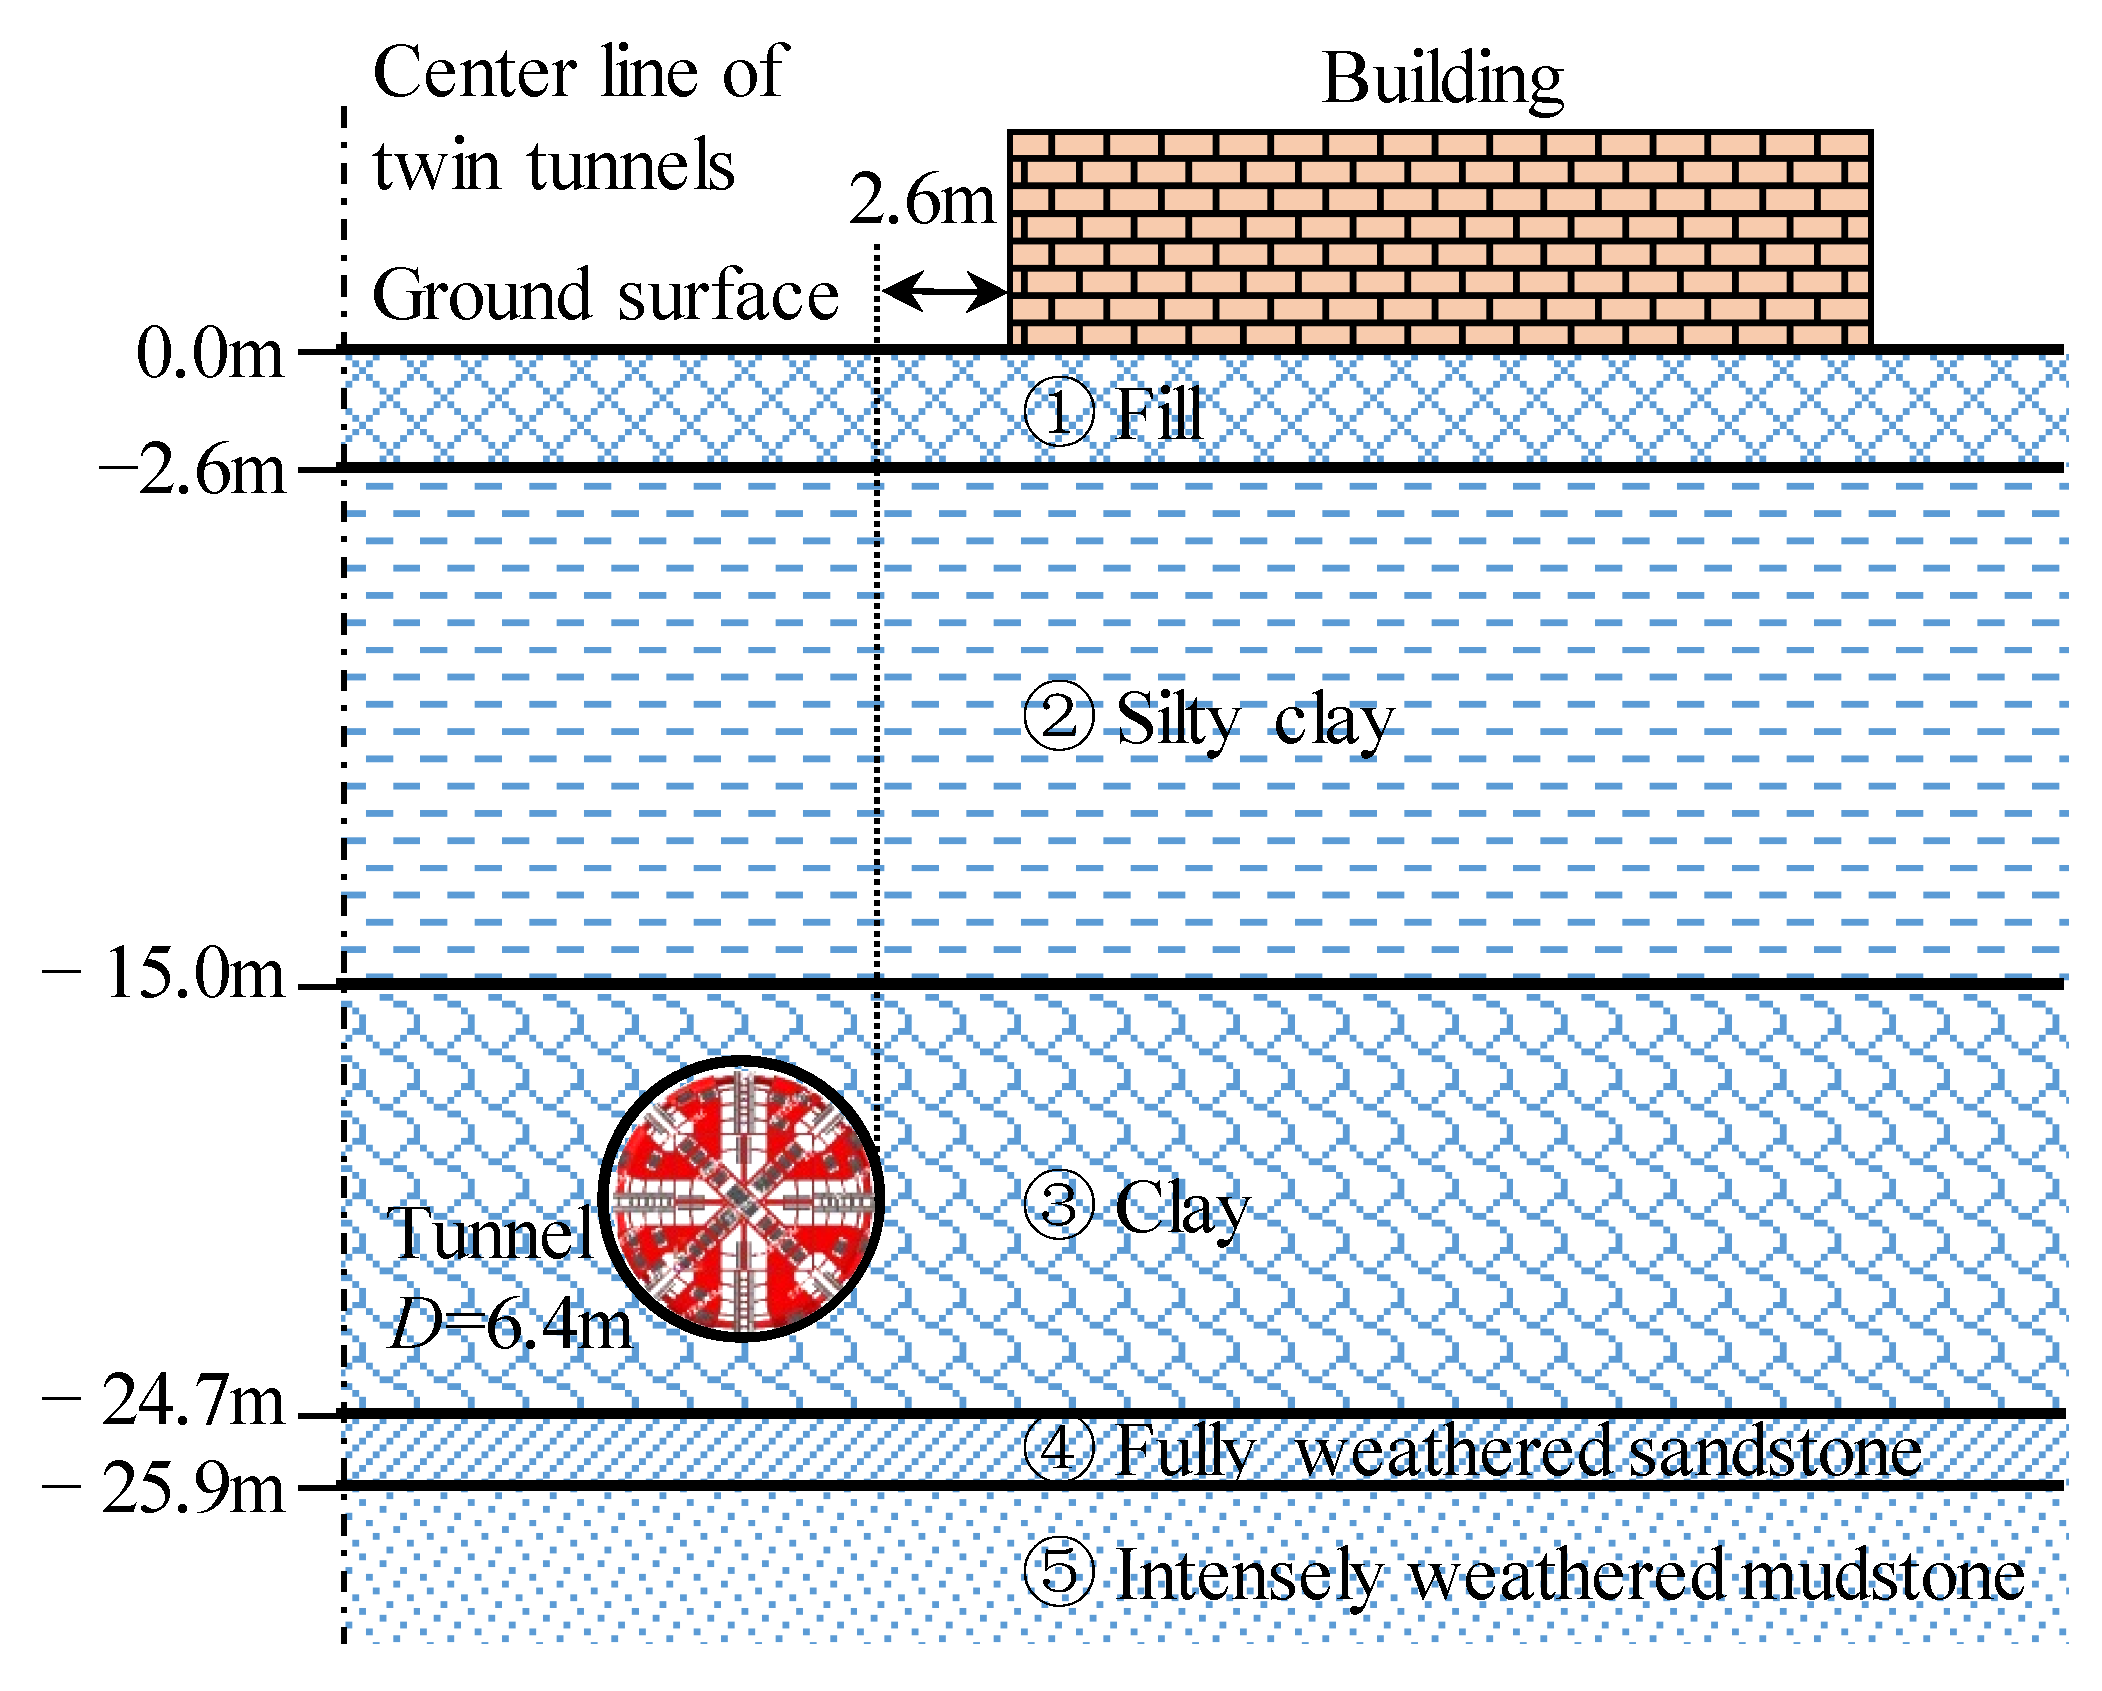
2. Engineering Background

A twin metro tunnel excavation in Changchun constructed using an EPB shield with a diameter of 6.4 m was chosen as the subject for a detailed case study and subsequent numerical simulation. As depicted in Figure 1, the tunnel is close to an existing single-storey brick–concrete mixed structure building with a length of 48 m. The distance between the outer edge of the tunnel and the building is a mere 2.6 m. The soil covering the tunnel has an approximate thickness of 16.6 m.
The terrain in this area is relatively flat. Based on drilling data, the soil layers within the project’s investigation zone have been carefully categorized into several main types: fill, silty clay, clay, fully weathered sandstone, and intensely weathered mudstone. The groundwater table is shallow, primarily replenished through lateral seepage and flow. Figure 1 illustrates the schematic layout of the project and the spatial relationship between the tunnel and the building. Figure 2 shows the progress curve for the metro tunnel excavation, which took four days to traverse the building at an average rate of approximately eight rings per day.

3. The Proposed Numerical Model

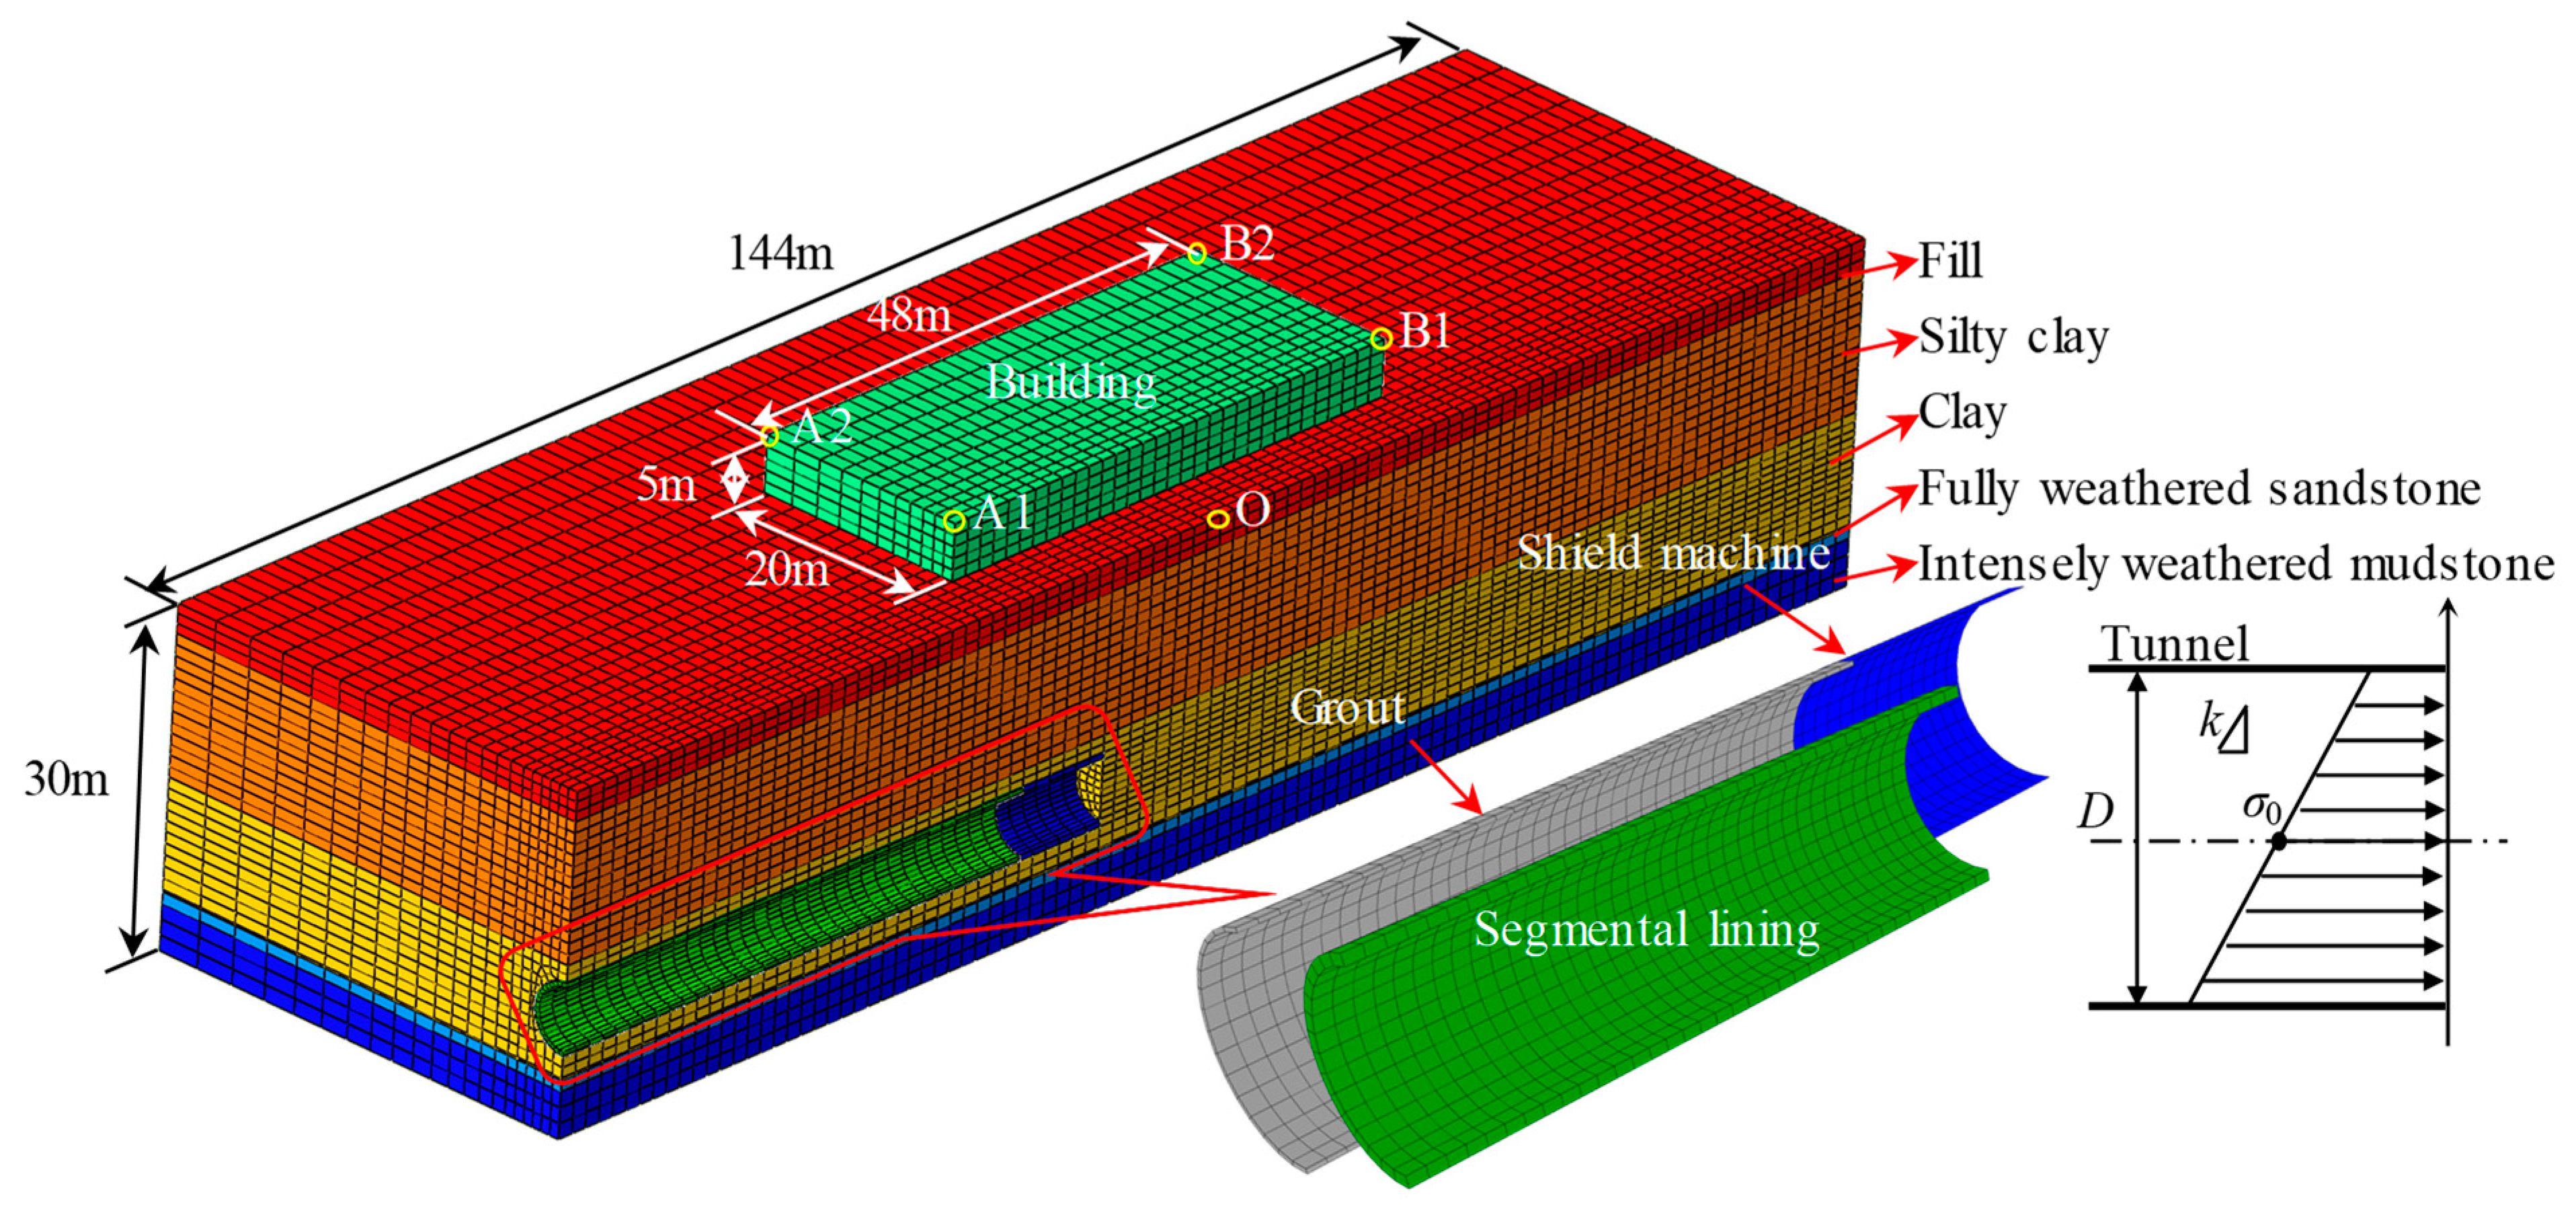
3.1. The FE Model and Material Properties

Using the commercial FE analysis software ABAQUS 2021, a three-dimensional fluid–solid coupling model was developed to investigate the deformation behaviour of both the strata and a building during tunnelling (see Figure 3). The model covered only half of the physical domain due to vertical plane symmetry. The total length of the model was set at 144 m, which was three times the length of the building. The model’s depth and width were 30 m and 50 m, respectively. The single-storey brick–concrete building was simplified into a solid model with dimensions of 48 m × 20 m × 5 m. Each lining ring had a longitudinal width of 1.5 m. Groundwater effects were incorporated into the analysis [28,29,30], with the groundwater level assumed to be at the natural ground surface, indicating that the strata were saturated.
The horizontal and vertical movements were fully restrained at the bottom of the model boundary, while movements normal to the border were constrained at the lateral external sides of the mesh. A no-flow boundary condition was applied to the tunnel lining, tunnel face, vertical surfaces, and the bottom of the model. The geotechnical material was represented using eight-node hexahedral elements that included degrees of freedom for pore pressure. The discretized FE models consisted of approximately 105,487 nodes and 98,144 three-dimensional elements, including 94,304 linear hexahedral elements for the strata, building, cement mortar, and segmental lining and 3840 four-node shell elements for the EPB shield model. Penalty and hard contact methods in ABAQUS were used to define the tangential and normal behaviours of the contact interactions between the grout and the segmental lining, the grout and the soil, and the EPB shield and the soil. Due to the significant deformation at the tunnel face, finite strain analysis was utilized to ensure accurate predictions of large deflections.
Selecting an appropriate constitutive model or failure criterion, along with accurate parameters, significantly enhances the precision of simulations. Over the past few decades, several advanced constitutive models have been introduced to enhance both the accuracy and efficiency of simulations, such as the boundary element model, the HS model, and the HSS model. However, these models often involve a complex array of parameters that are challenging to determine. The Mohr–Coulomb (MC) model is frequently used in numerical simulations of underground excavations due to its simple input parameters. It requires less computation time and fewer iterations compared to other models. For the current research, only the soil parameters of the MC model are available. Consequently, the strata are modelled as elastic–perfectly plastic materials, adhering to the Mohr–Coulomb failure criterion and the non-associated flow rule, as referenced in previous studies [31,32,33,34,35]. The primary physical and mechanical parameters of the soils used in the analyses are detailed in Table 1.
The building was assumed to behave in a linear elastic manner. Due to the simplification of the building, its density and modulus need to be reduced. According to the wall’s thickness along its length, its equivalent density is taken as 5 kN/m3. And its equivalent modulus is taken as 200 MPa due to the relatively low overall stiffness of the building in the direction of its length. Its Poisson’s ratio is taken as 0.15. The EPB shield model was represented as a cylindrical steel structure exhibiting linear elastic behaviour, as specified in Table 2. Due to the staggered configuration of the segmental lining, its stiffness was significantly increased, approaching that of a continuous lining [36]. The lining rings and the synchronous grouting material were simulated using continuous elastic solid elements, with their elastic parameters provided in Table 2.

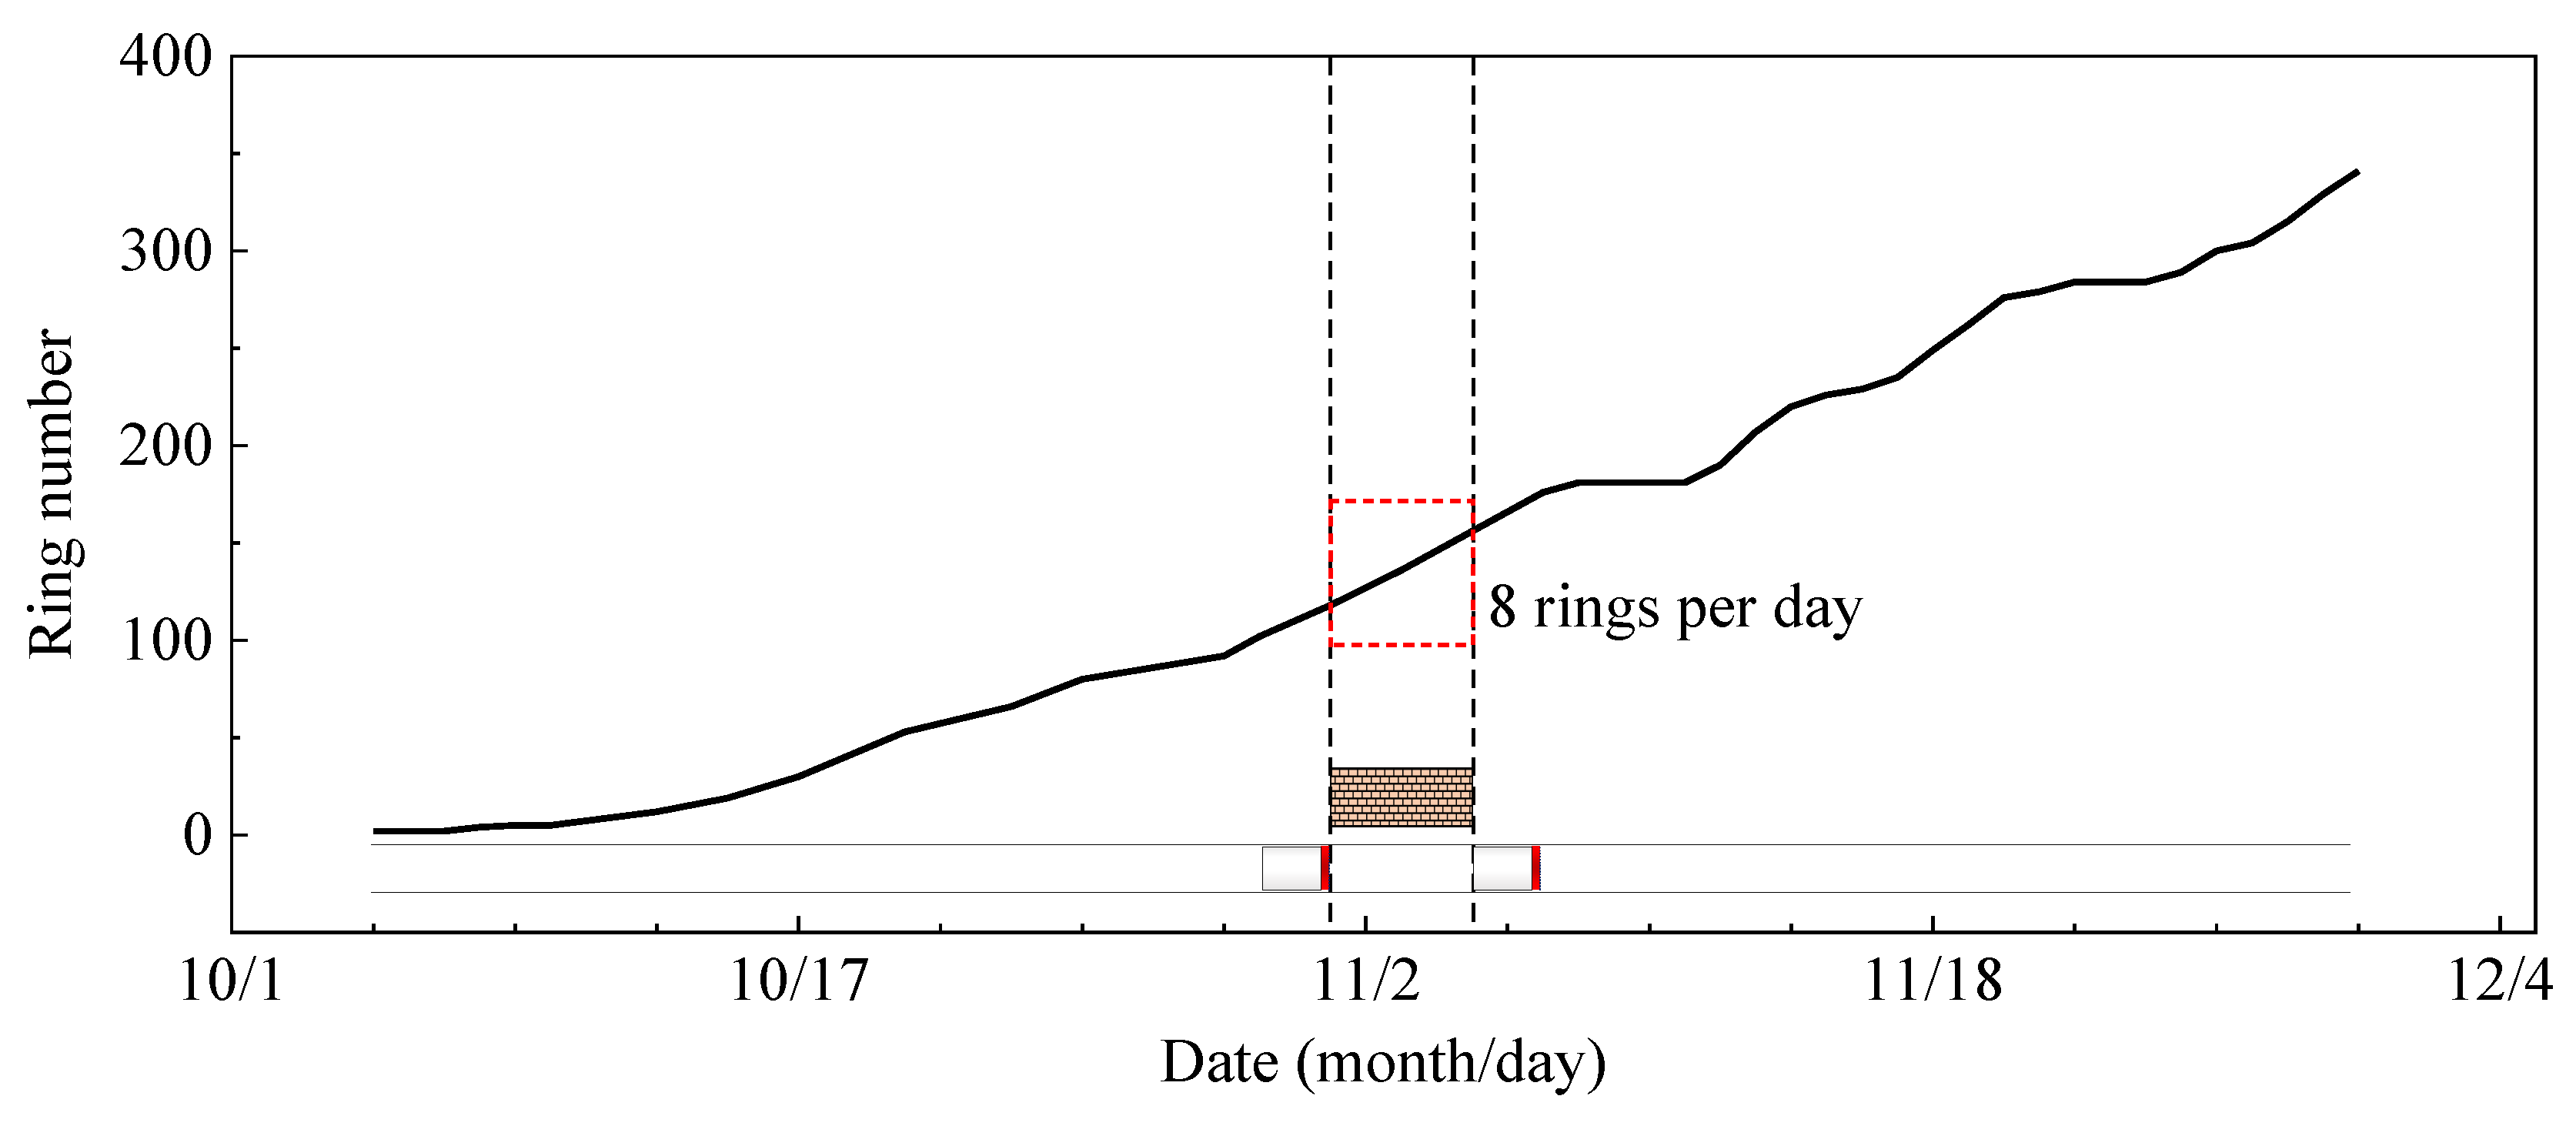
3.2. Model Description of Tunnel Excavation

Previous studies have frequently utilized the element death technique to model tunnel excavation processes [37,38]. To study the effect of tunnelling on the behaviour of the building, a staged construction process was considered in a numerical simulation. The initial stresses of the soil were established using the in situ stress values and soil parameters detailed in Table 1 to ensure the soil was in equilibrium with the gravitational forces and did not experience any initial deformation. The process of tunnel excavation and support was simulated by deactivating the soil elements and concurrently activating the lining and grout elements. Subsequently, the tunnel excavation and support processes were simulated through the deactivation of the soil elements and the activation of the lining and grout elements. The influence of the tunnelling speed on the void pressure was considered. The length of the excavated section at each step was 1.5 m, completed over 3 h. The linear distribution of the face support pressure (σt) from the soil in the chamber was considered. The face support pressure exerted by the soil in the chamber was assumed to have a linear distribution [39]. The gradient of the support pressure was set as 20 kPa/m based on the results of soil pressure monitoring. The face pressure at the tunnel face’s centre was determined to be 192 kPa, as derived from the initial stress analysis.

4. Analysis of Settlement of the Ground Surface and the Adjacent Building

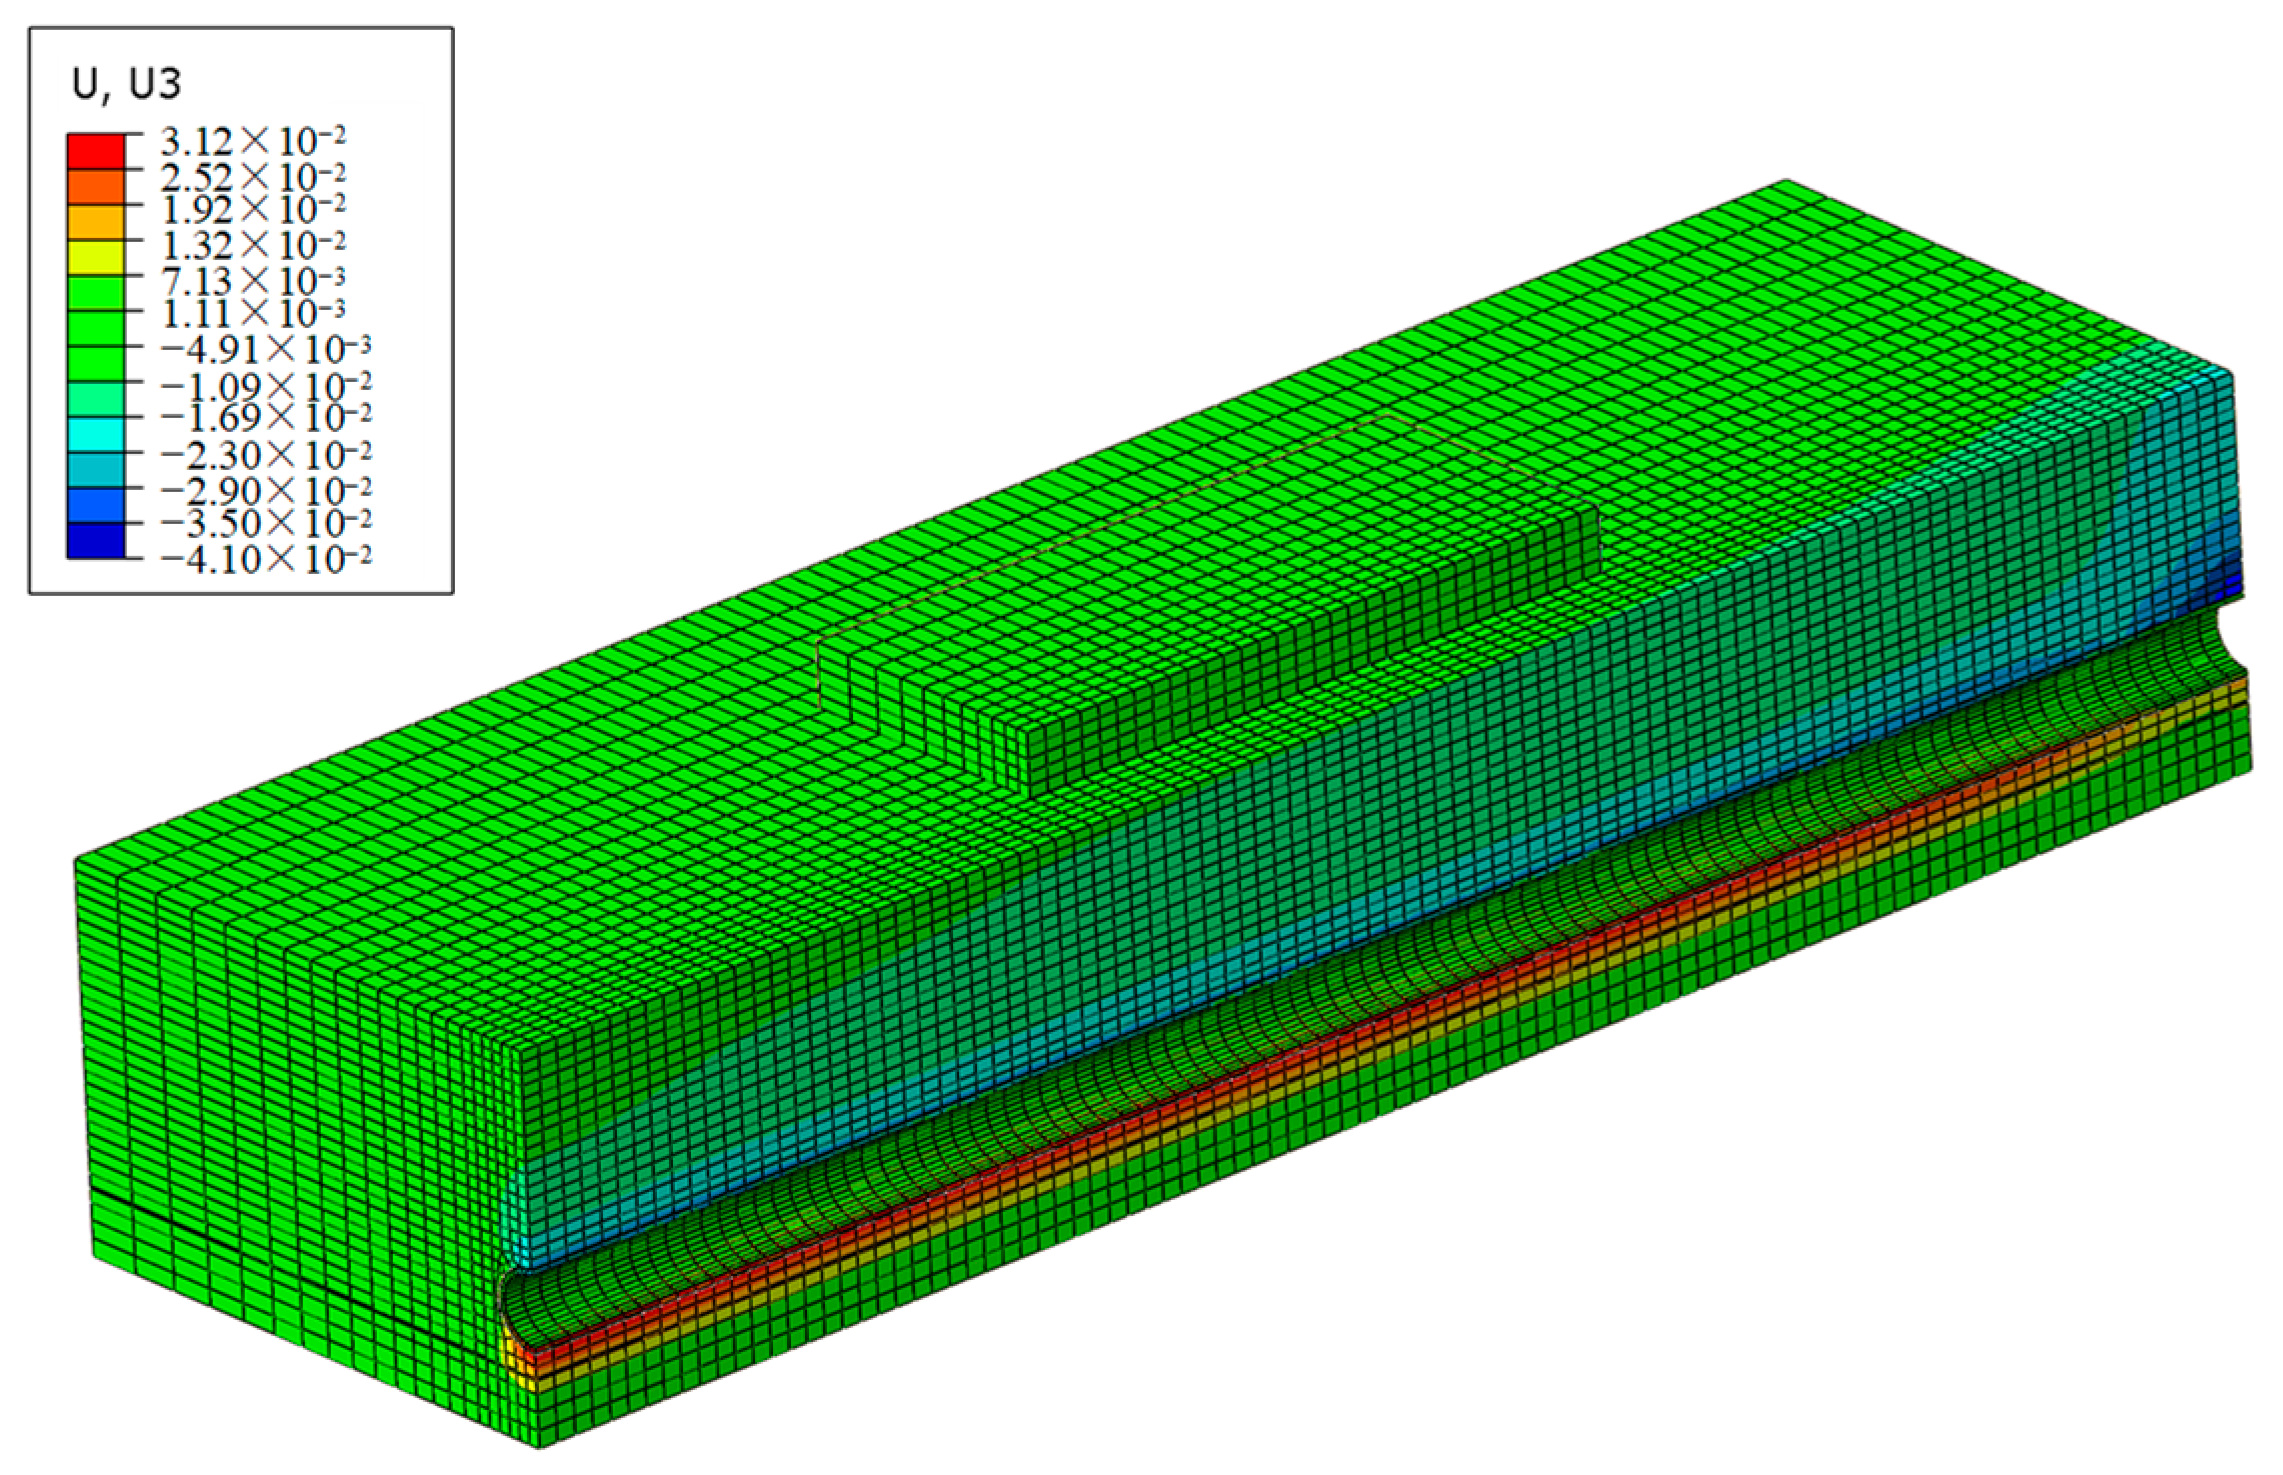
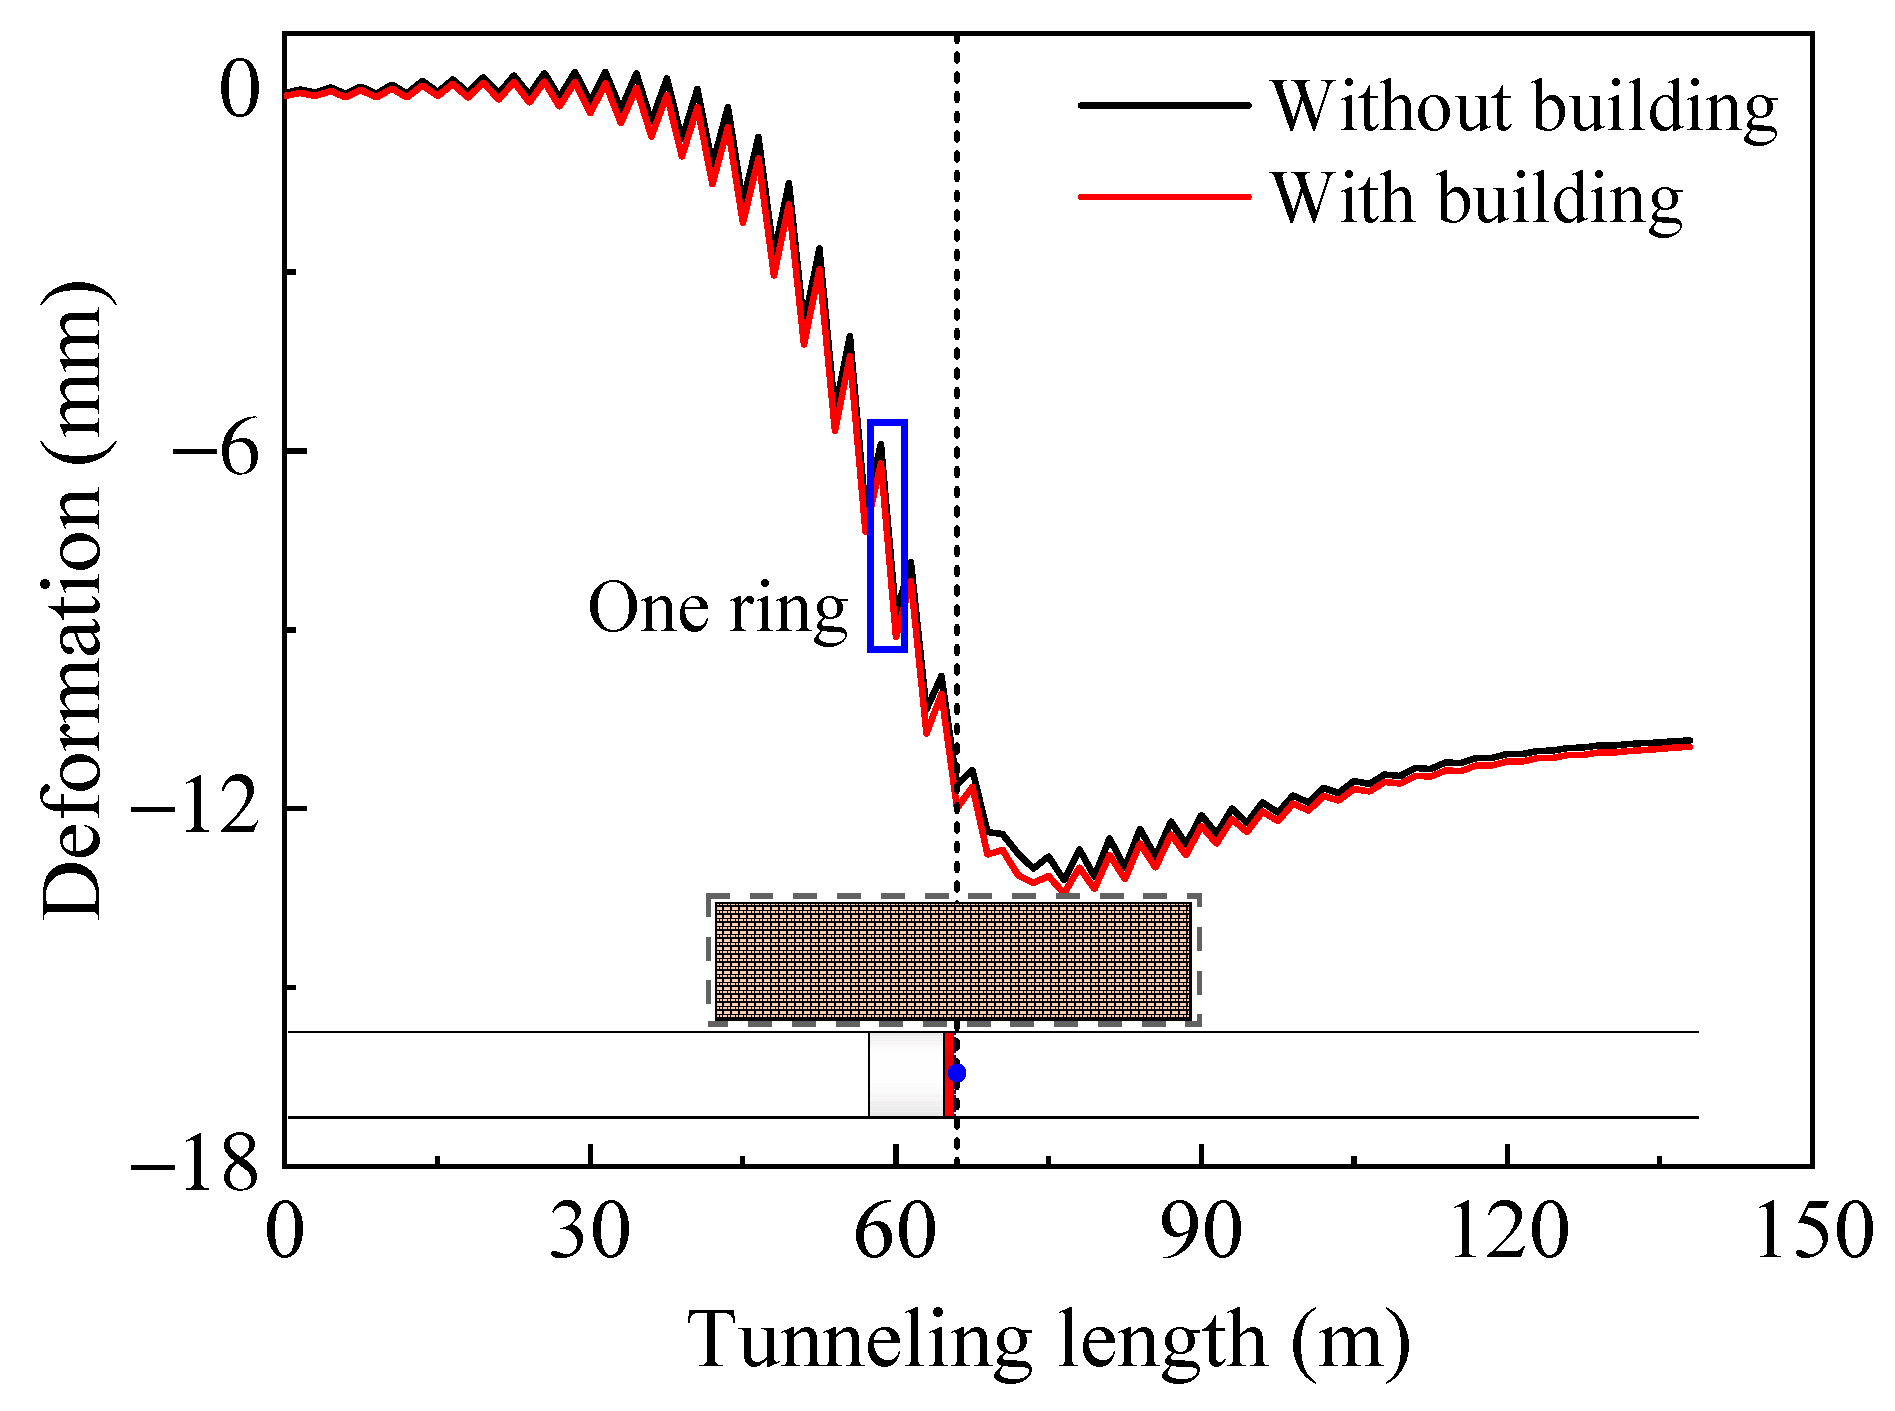
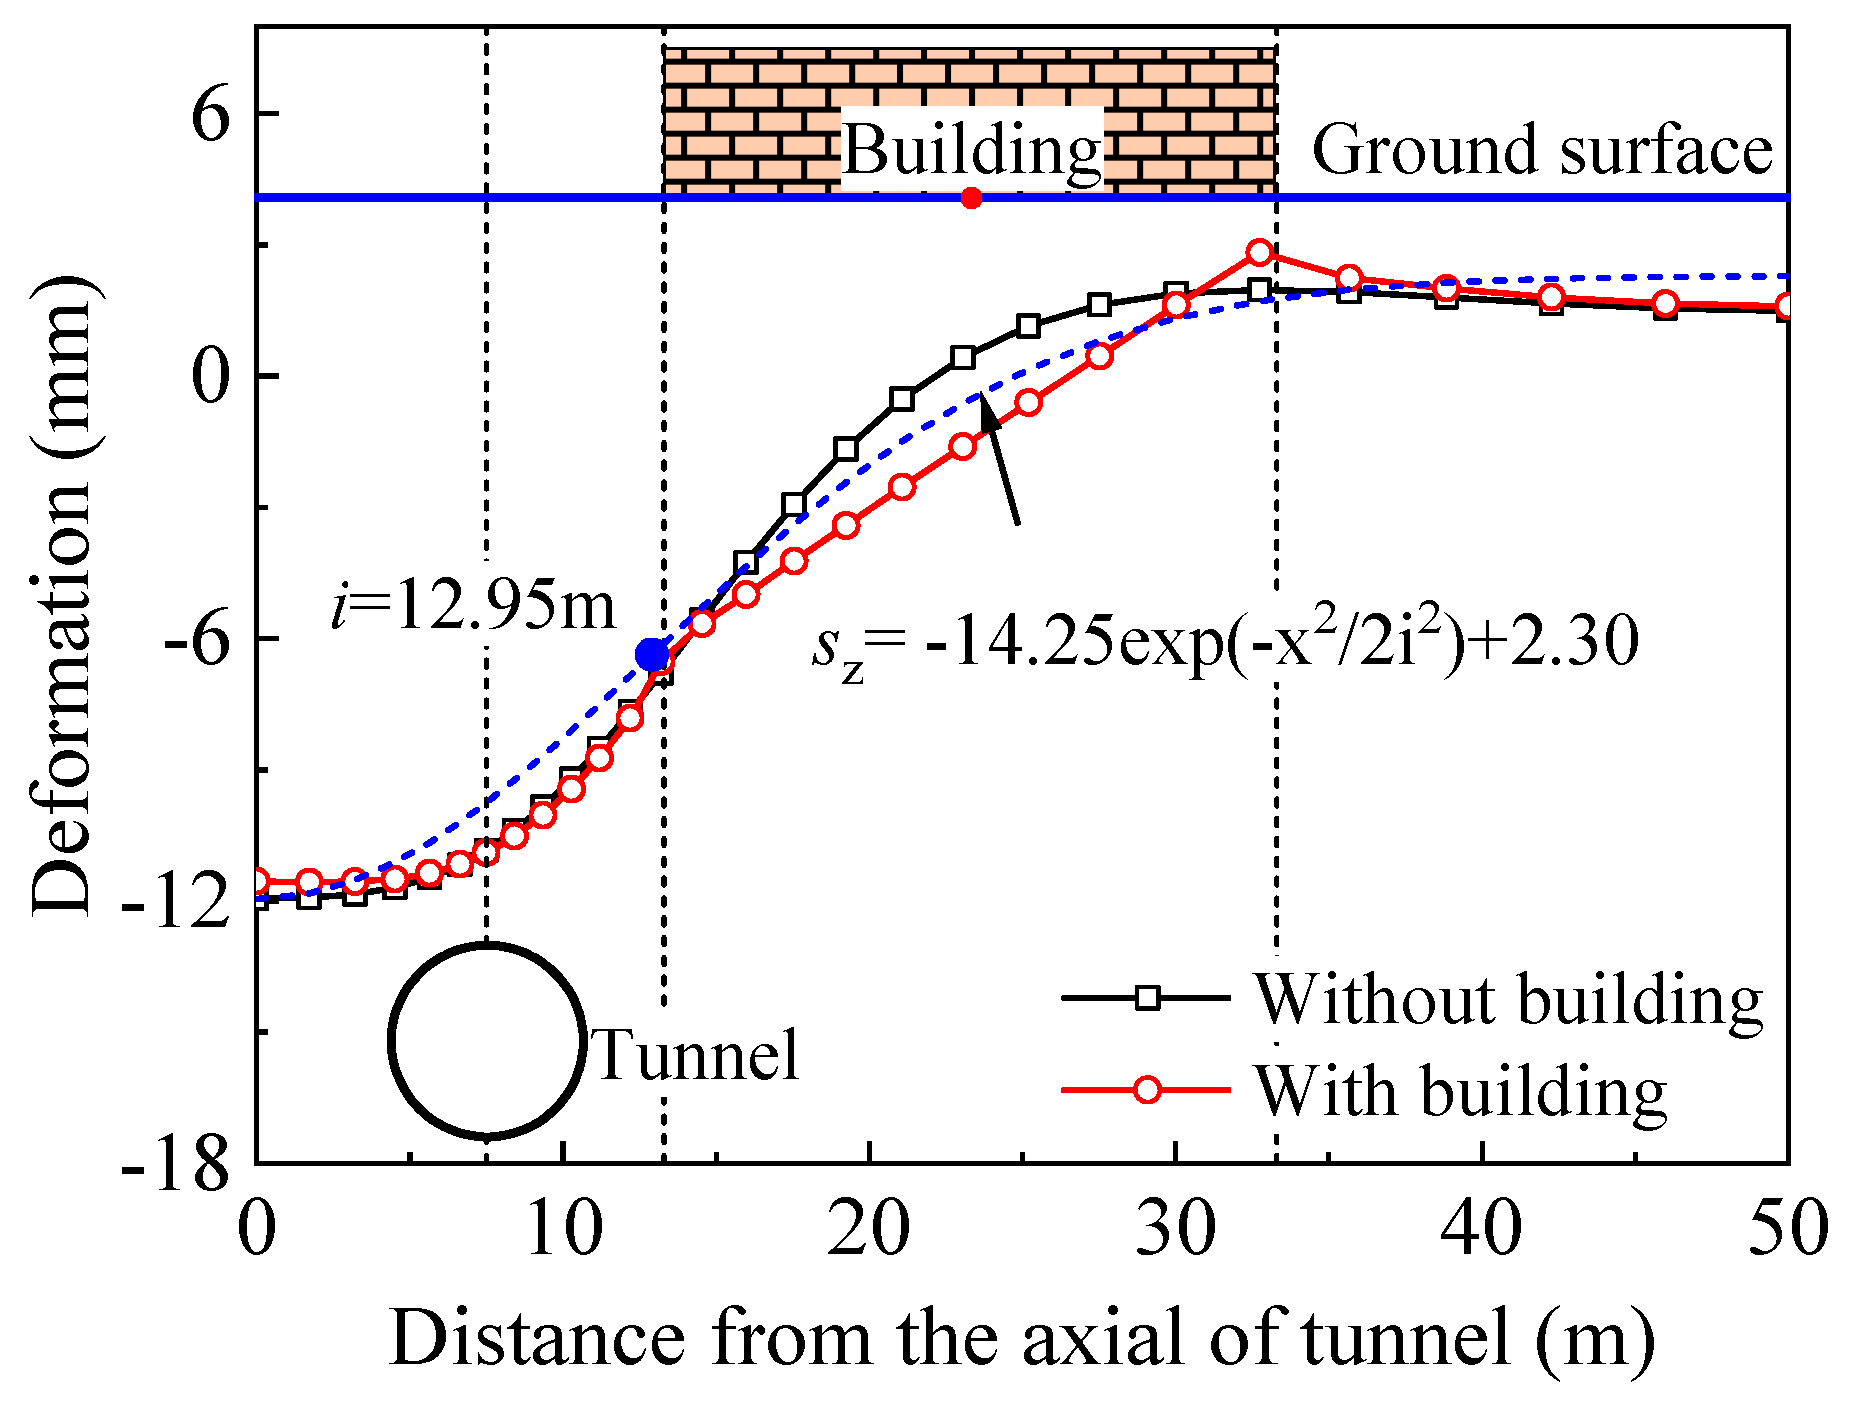
4.1. Settlement of the Ground Surface

A settlement contour that incorporates the adjacent building is presented in Figure 4. It reveals that the building falls within the influence range of the shield excavation. The settlement at the midpoint directly above the tunnel (point O in Figure 3) is discussed in detail. The settlement time-history curves under conditions with and without the adjacent building are compared in Figure 5. They demonstrate that each excavation ring induces a disturbance at the monitoring point, manifesting as a trend of a decrease in the initial settlement followed by an increase. Surface settlement fluctuations are attributed to the accumulation of pore pressure within the stratum, which is caused by the action of the face support forces during the excavation process. This accumulation leads to a reduction in the effective stress in the soil body. As the pore pressure gradually dissipates, the stratum experiences an increase in settlement. Consequently, the settlement trends for the adjacent building exhibit corresponding fluctuations. However, a slight increase in surface settlement occurs due to the influence of existing buildings.
The settlement troughs for the section in which point O is located both with and without the presence of the building on the surface are compared in Figure 6. The empirical formulation developed by Peck [40] and its revised versions are commonly employed to depict transverse settlement. The settlement trough is typically assumed to follow a Gaussian distribution curve, given by the following equation:
s z = ( s max s 0 ) exp ( x 2 2 i 2 ) + s 0
where sz is the ground surface settlement at distance x from the tunnel centre; smax is the maximum ground surface settlement at the tunnel axis; s0 is a modified factor; and i is the trough width parameter, representing the distance from the tunnel centre to the inflexion point. The presence of the building on the surface increases the deformation of the stratum directly beneath it, while its influence on the surface settlement at other locations is minimal.

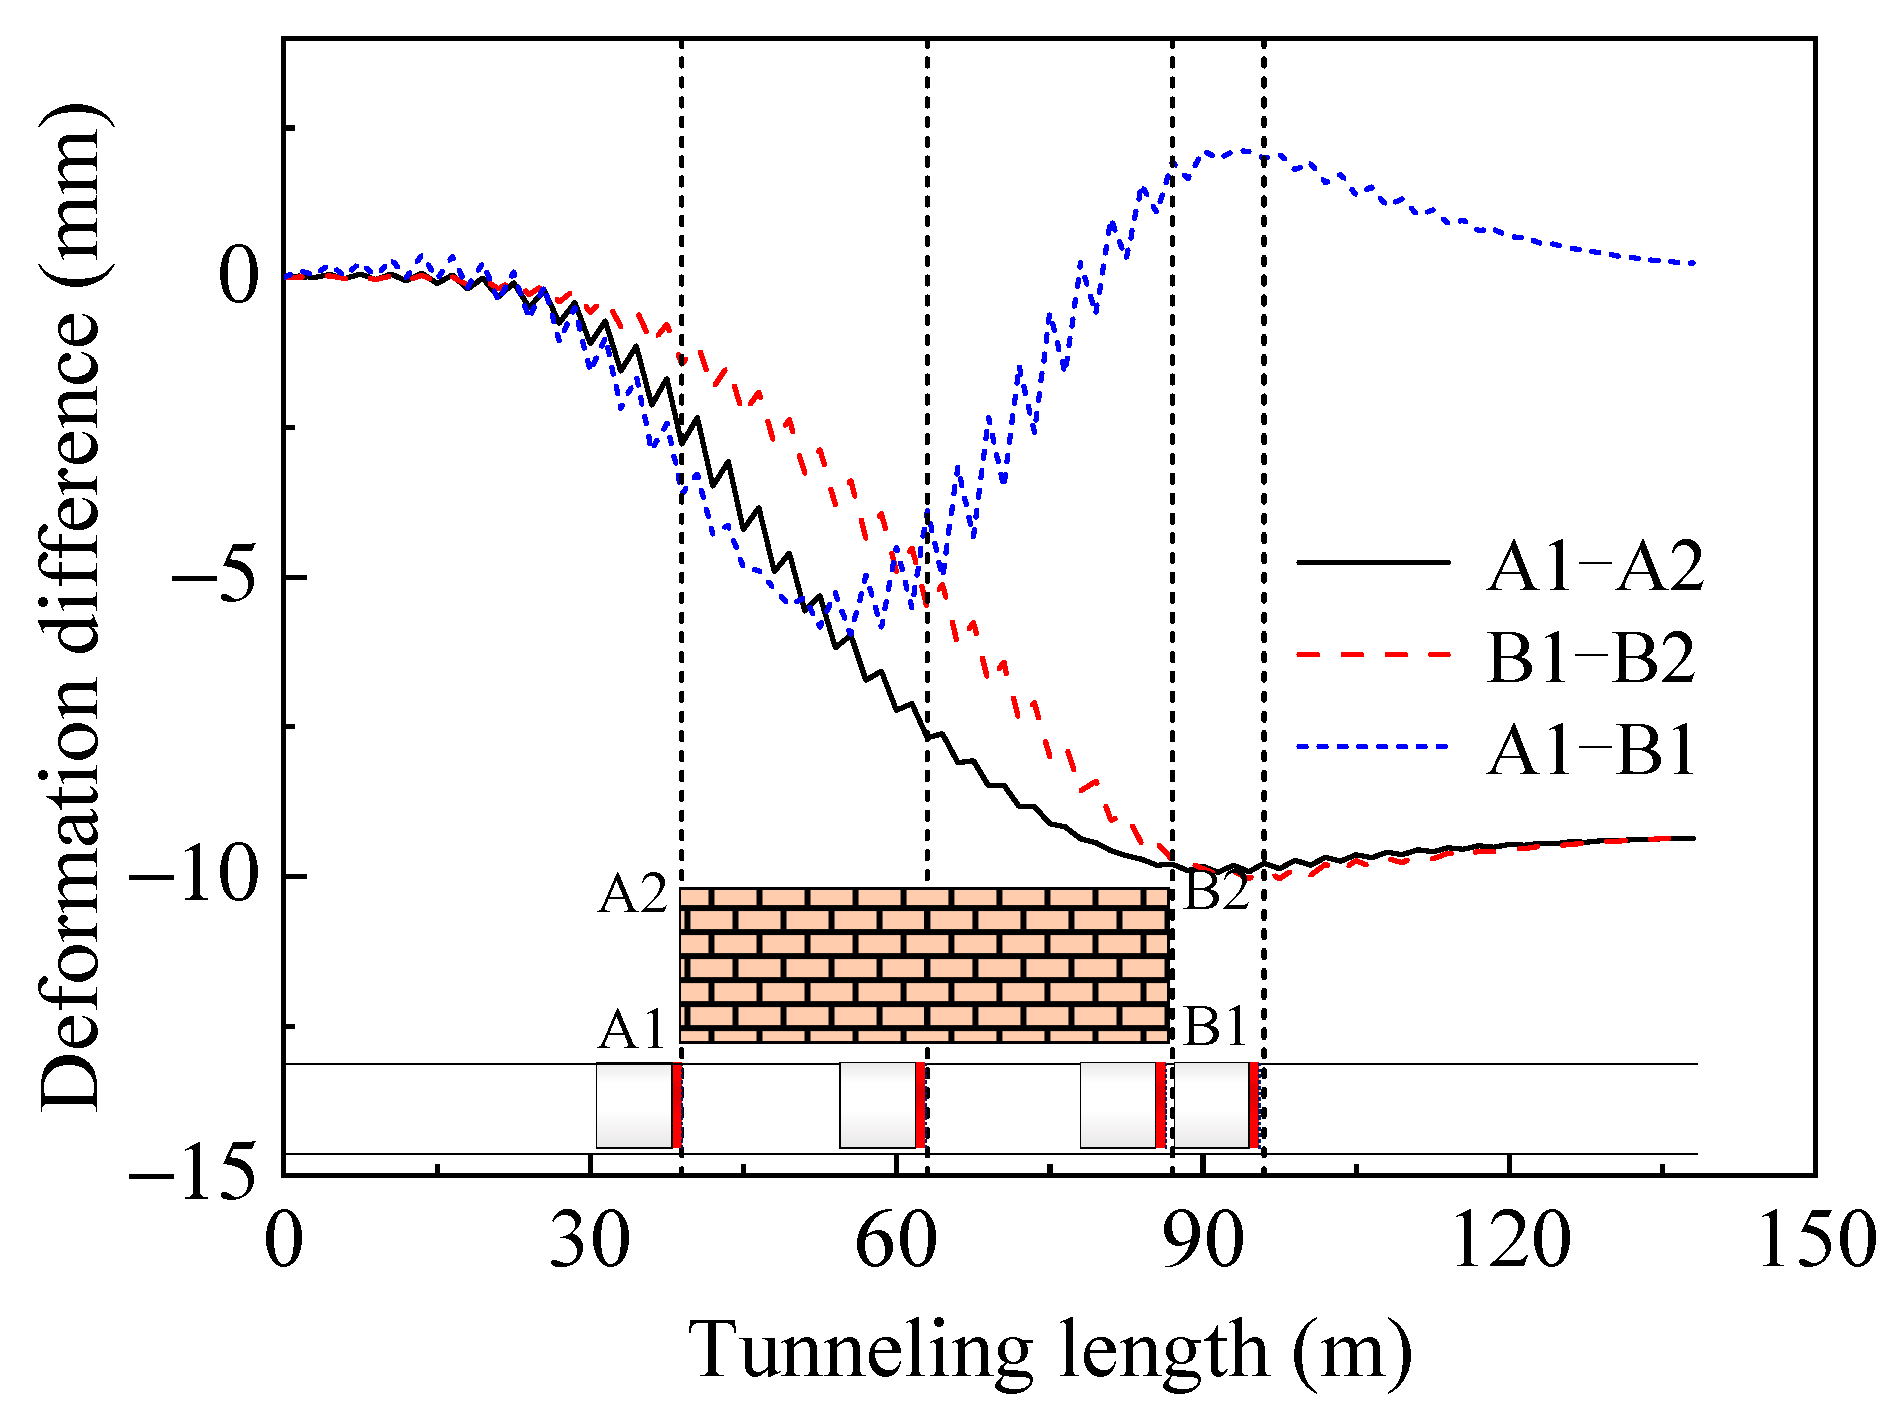
4.2. Settlement of the Adjacent Building

The settlement development curves for the four corner points of the building (points A1, A2, B1, and B2 in Figure 3) are depicted in Figure 7. Points A1 and B1, which are closer to the tunnel, exhibit settlement due to strata deformation from shield tunnelling. In contrast, point A2 initially settles but then experiences an uplift, while point B2 shows an initial uplift followed by a slight settlement. The differential settlement observed reflects the safety of the structure during the shield construction. As illustrated in Figure 8, transverse differential settlement increases with the tunnelling progress, reaching approximately 10 mm. Longitudinal differential settlement rises initially and then decreases, peaking when the shield is directly beneath the building. It becomes more uniform as the shield moves away. Continued shield advancement causes further settlement at point B1, increasing the longitudinal settlement in the opposite direction. With the building’s long longitudinal span, the maximum longitudinal settlement-to-length difference ratio is about 1.25 × 10⁻⁴, while the transverse settlement-to-width difference ratio is approximately 5 × 10⁻⁴.

5. Analysis of Settlement of the Ground Surface and the Adjacent Building after Using Control Measures

Appropriate measures, such as foundation grouting reinforcement, are essential to minimize the impact of shield tunnelling on adjacent buildings. This paper provides a comparative analysis of the effectiveness of two different reinforcement methods.
Figure 9a illustrates surface grouting using a sleeve valve tube, employed in the engineering project to reinforce the soil and establish a vertical barrier (Measure A). The grouting area spans 2 m in width and extends 16 m on each side of the building, considering the spatial relationship between the tunnel and the adjacent structure. The reinforcement depth reached 24.84 m, extending 2 m below the shield tunnel. Grouting was not deemed necessary within the upper strata, from the surface to a depth of 5.64 m. The precision grouting reinforcement procedure was carried out before the advancement of the shield tunnel. This pre-emptive measure ensured the stability of the surrounding soil and mitigated the potential impact on the adjacent building.
The portal partition method (Measure B) was proposed as an alternative reinforcement measure for controlling deformation in adjacent buildings. This method can also be implemented using a sleeve valve tube. As shown in Figure 9b, the vertical reinforcement zone is deposited 0.6 m from the tunnel structure’s exterior. The horizontal reinforcement zone is placed 1.6 m from the exterior, coinciding with the upper boundary of the clay layer. The length and thickness of the reinforced area were considered to investigate the effect of the tunnel excavation on the ground and building responses.

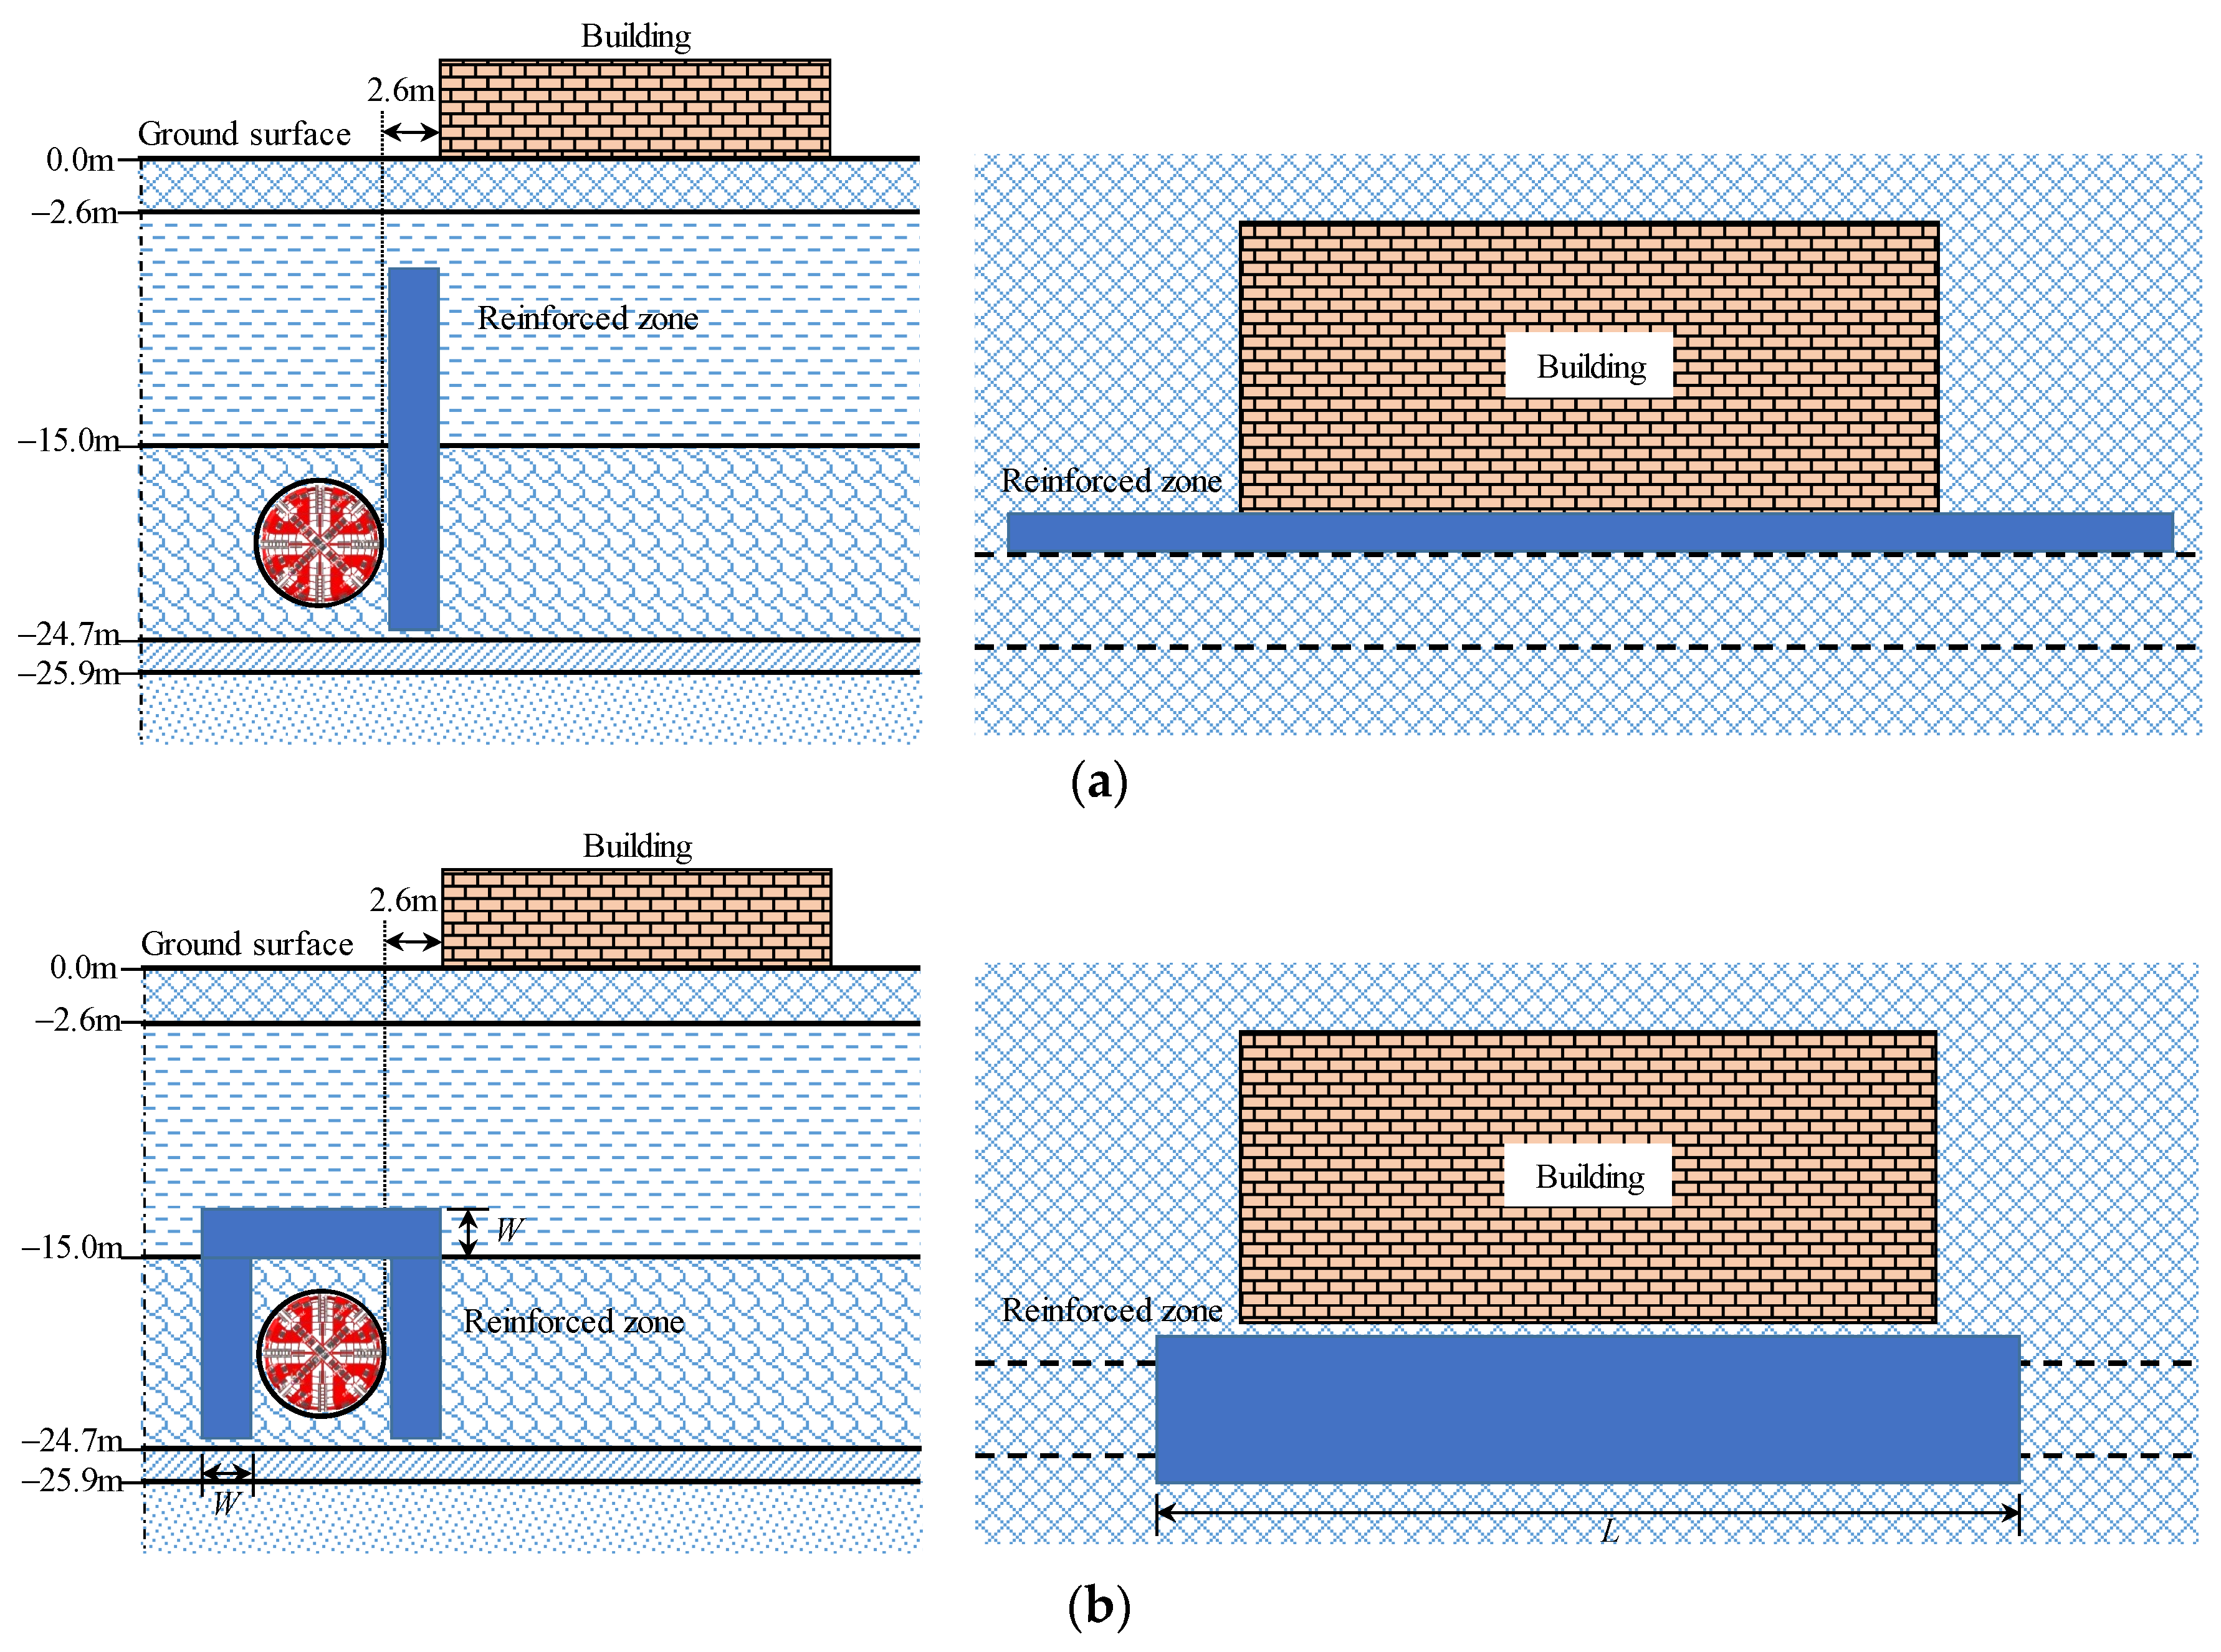
5.1. The Effect of the Vertical Partition Method

As can be seen in Figure 10, the area of influence of the shield tunnel excavation is significantly reduced after applying the vertical partition method. The settlement time history at point O is illustrated in Figure 11. The maximum disturbance caused by shield tunnel excavation is reduced by about 58% compared to that in scenarios with no mitigation measures. This can be interpreted as the partition obstructing the transmission of stress through lateral diffusion through the soil. As the shield tunnel progresses, the soil rebound at the bottom of the tunnel is transmitted to the surface, leading to a recovery in the settlement.
The measured data, as presented in Figure 11, were compared with the settlement calculated from the FE model. The numerical model demonstrates a strong correlation with the measured data, both in terms of the trend of deformation development and the magnitude of the deformation amplitudes. Taking into account the characteristics of this simplified three-dimensional FE model and the inherent uncertainties associated with in situ measurement activities, the predicted values are found to be within a reasonable range. Consequently, the model established in this study is deemed reliable for conducting settlement analyses.
Corresponding settlement troughs are shown in Figure 12. It demonstrates that the surface settlement beneath buildings is significantly reduced and more uniformly distributed compared to that in the scenario without any measures. The unloading of the tunnel causes vertical compression and horizontal expansion of the lining segments, which, in turn, compresses the surrounding soil and results in upward bulging of the soil on the side away from the tunnel.
Curves for the development of settlement at the four corner points of the building are illustrated in Figure 13. It reveals that all the points exhibit initial settlement followed by an uplift. With mitigation measures in place, the maximum settlement during tunnelling decreases by approximately 70% compared to that in the scenario with no measures in place. The difference in transverse settlement increases with the advancement of the shield, reaching a maximum difference of about 2 mm (Figure 14). And the difference in longitudinal settlement first increases and then decreases, with peaks occurring when the shield enters and exits the building area. Compared to the situation without measures, the maximum difference in settlement occurs earlier, indicating that vertical isolation effectively reduces disturbances to the surface building during tunnel construction.

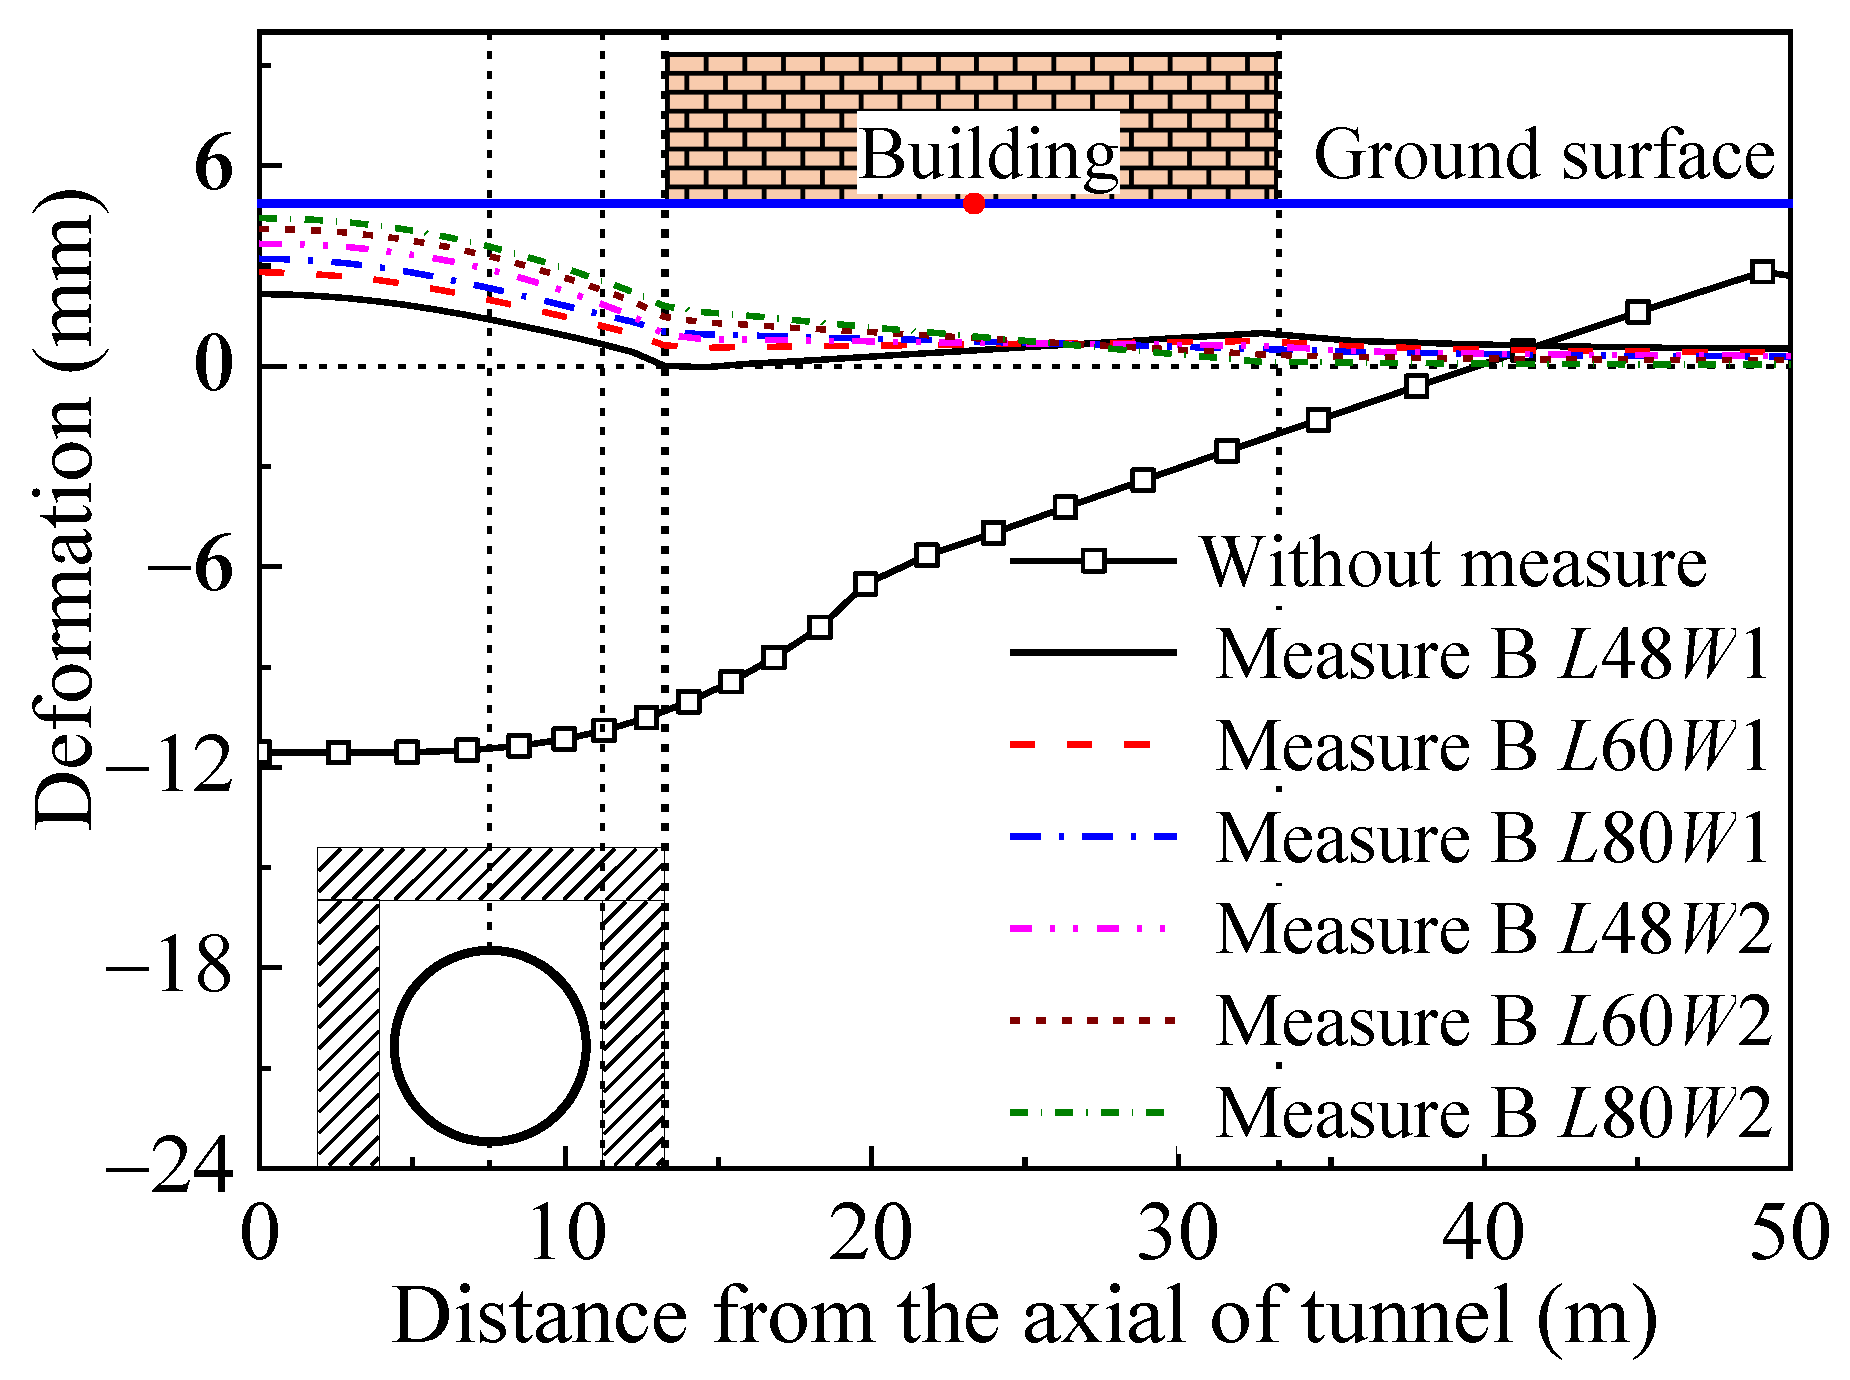
5.2. The Effect of the Portal Partition Method

In the case of adopting the portal partition method, the influence of tunnel excavation on the surface settlement adjacent to the building is notably less than that in the tunnel sections farther from the structure according to the ground settlement contour (Figure 15). This underscores the efficacy of the portal frame in mitigating ground subsidence and effectively managing the settlement process.
As can be seen from the settlement time history for point O after adopting the portal partition measure in Figure 16, the disturbance caused by shield excavation significantly decreases due to the portal partition hindering the transmission of stress and lateral diffusion through the ground soil. Additionally, as the shield excavation progresses, the rebound deformation of the soil at the bottom of the tunnel is transmitted to the surface through the portal partition reinforcement. When the rebound amount exceeds the previous settlement, the surface eventually shows an uplift or an upward movement.
The lateral settlement trough results at the cross-section of point O after using the portal partition method are shown in Figure 17. It is surprising that there is no settlement beneath the building but a slight upward movement. The greater the length and thickness of the reinforced area, the greater the upward movement near the tunnel side, and even the direction of the building tilt changes. This suggests that an indiscriminate increase in the reinforced area may not be advantageous for managing surface settlement.
The trend in the development at the corner points of the building shows settlement initially followed by an uplift (Figure 18). It can be seen that the maximum settlement during tunnelling has been reduced by approximately 70% compared to the scenario without any measures in place. Due to the higher stiffness of the reinforcement, the final settlement at point A1 is slightly greater than that at point B1, which contrasts with the results observed using the vertical isolation method. The difference in transverse settlement in Figure 19 increases with the advancement of the shield, reaching a maximum difference of approximately 2.5 mm. The difference in longitudinal settlement initially becomes negative and then positive and eventually returns to zero, with peaks occurring as the shield enters and exits the building area. Compared to the conditions without any mitigation measures, the maximum settlement difference occurs earlier, indicating that the portal partition method effectively reduces building disturbances during tunnel construction.

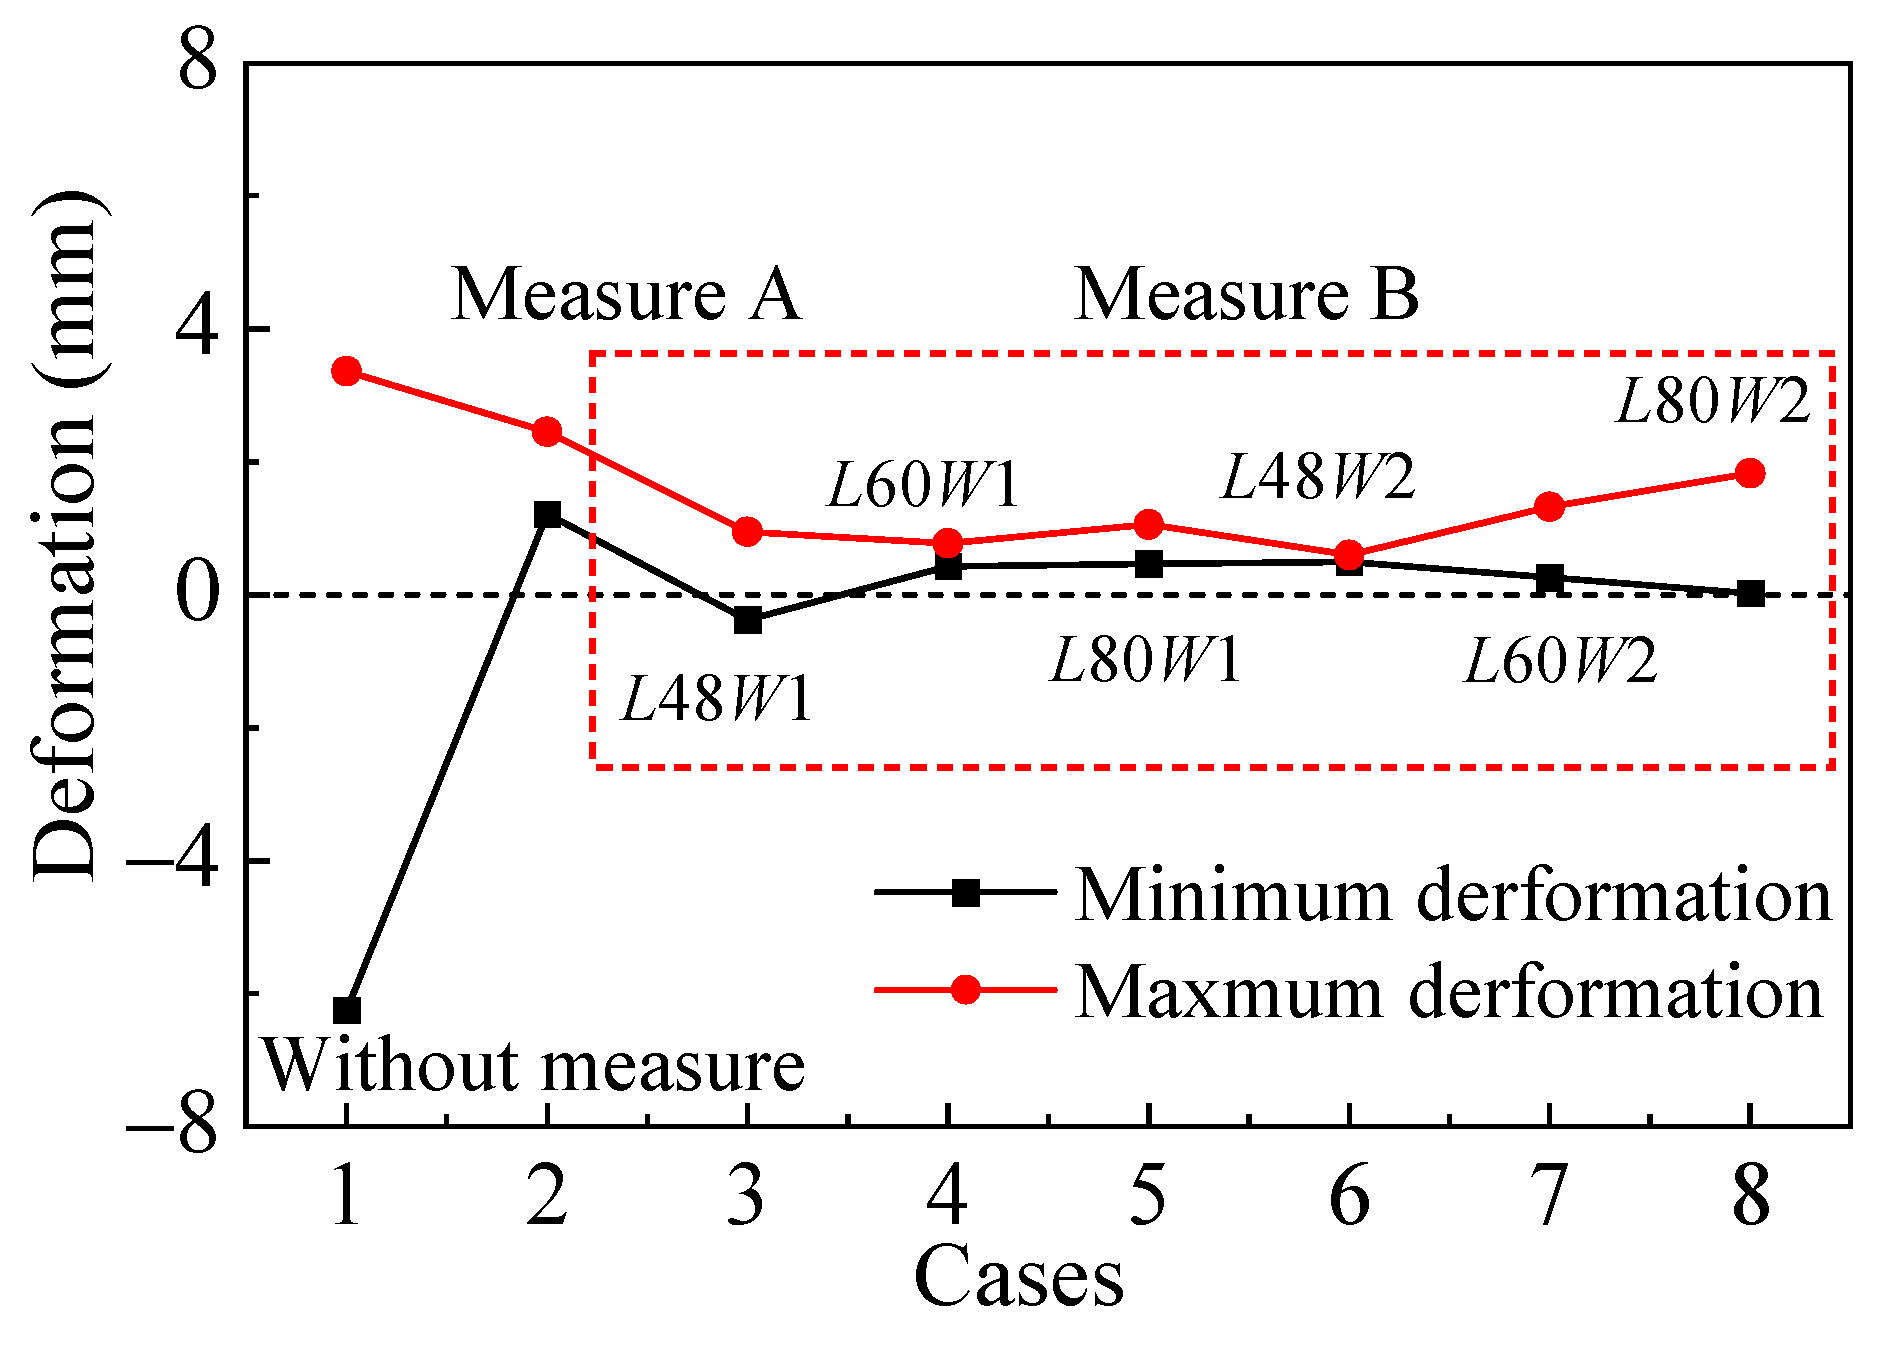
5.3. Comparison of Different Measures

Surface subsidence serves as a direct indicator of the effectiveness of various measures. As illustrated in Figure 20, the ground subsidence at point O shifts from negative to positive. The shield excavation results in ground subsidence of approximately 11 mm without any interventions. When the vertical partition method is applied, the subsidence decreases to about 3.2 mm, reflecting a reduction of nearly 71%. The ground surface uniformly experiences an uplift due to the unloading effect from the tunnel excavation being transmitted upward through the rigid reinforcement using the portal partition method, with a maximum uplift of approximately 3.6 mm (L80W2). When the length and thickness of the portal partition reinforcement are reduced, the overall stiffness is lower, and the deformation amplitude remains less than that observed when using the vertical partition method.
A comparison of the final deformation results for the building under different conditions is shown in Figure 21. As can be seen in this figure, the tunnel construction causes noticeable subsidence on one side of the surface building; after measures are taken, the subsidence of the building is restrained significantly, and the subsidence or uplift at the point of the minimum deformation of the building is close to zero. When the portal partition method is used for reinforcement of the stratum, the deformation of the building does not change much with an increase in the length and thickness of the reinforcement, which is lower overall than that when using the vertical isolation method.
Tunnel construction inevitably leads to differential subsidence in buildings. Figure 22 shows the differential subsidence of the building in the transverse direction under different working conditions. The building gradually tilts from towards the side of the tunnel to towards the side away from the tunnel due to the obvious difference in the stiffness of the foundation around the building after the reinforcement of the stratum. And the differential subsidence is the smallest in the case of L48W2.
The extent of stratum reinforcement can be quantified by the volume of reinforcement material used. Figure 23 illustrates how this volume varies under different conditions. It is clear that increasing both the length and thickness of the portal partition results in a significant rise in the volume and cost of the reinforcement material. However, the stratum reinforcement under the L60W2 scenario remains relatively similar to that when using the vertical partition method. Therefore, using the portal partition method to manage deformation in adjacent structures not only enhances the effectiveness of the reinforcement but also leads to a substantial reduction in costs.

6. Conclusions

In this study, numerical analyses accounting for groundwater were performed to examine the ground settlement and deformation of adjacent buildings caused by earth pressure balance (EPB) shield tunnelling. Two distinct ground reinforcement methods for controlling the deformation of buildings were proposed. Their effectiveness was compared and evaluated. The main conclusions are summarized as follows:
(1)
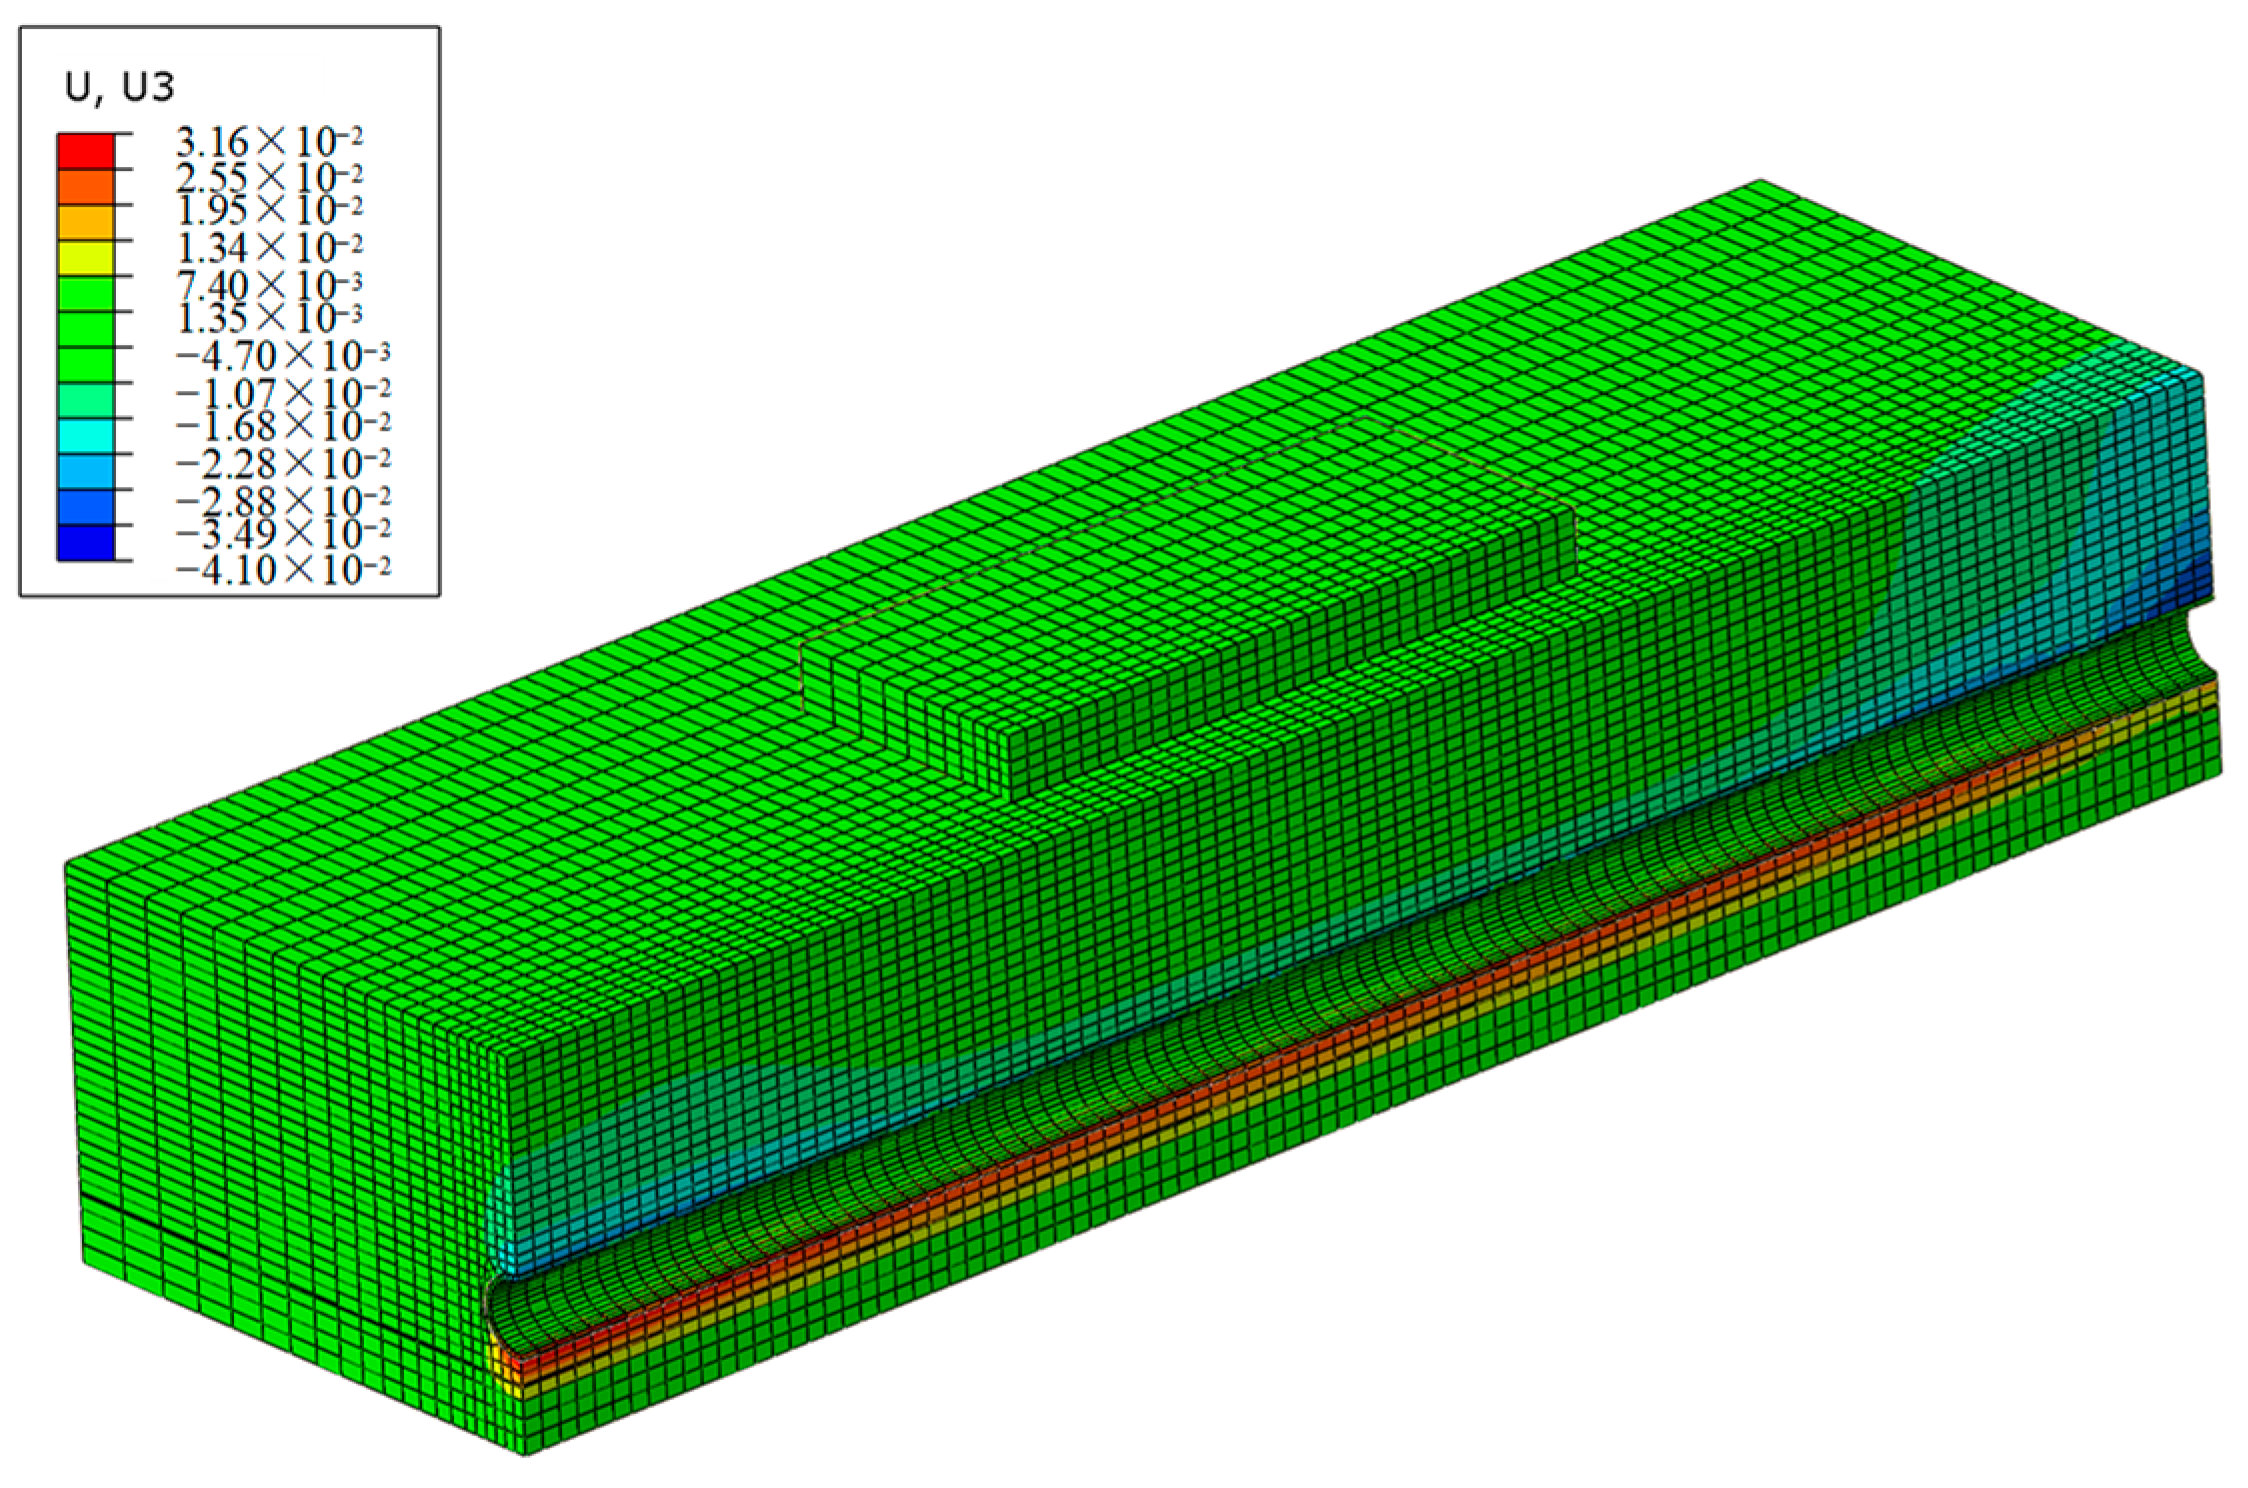
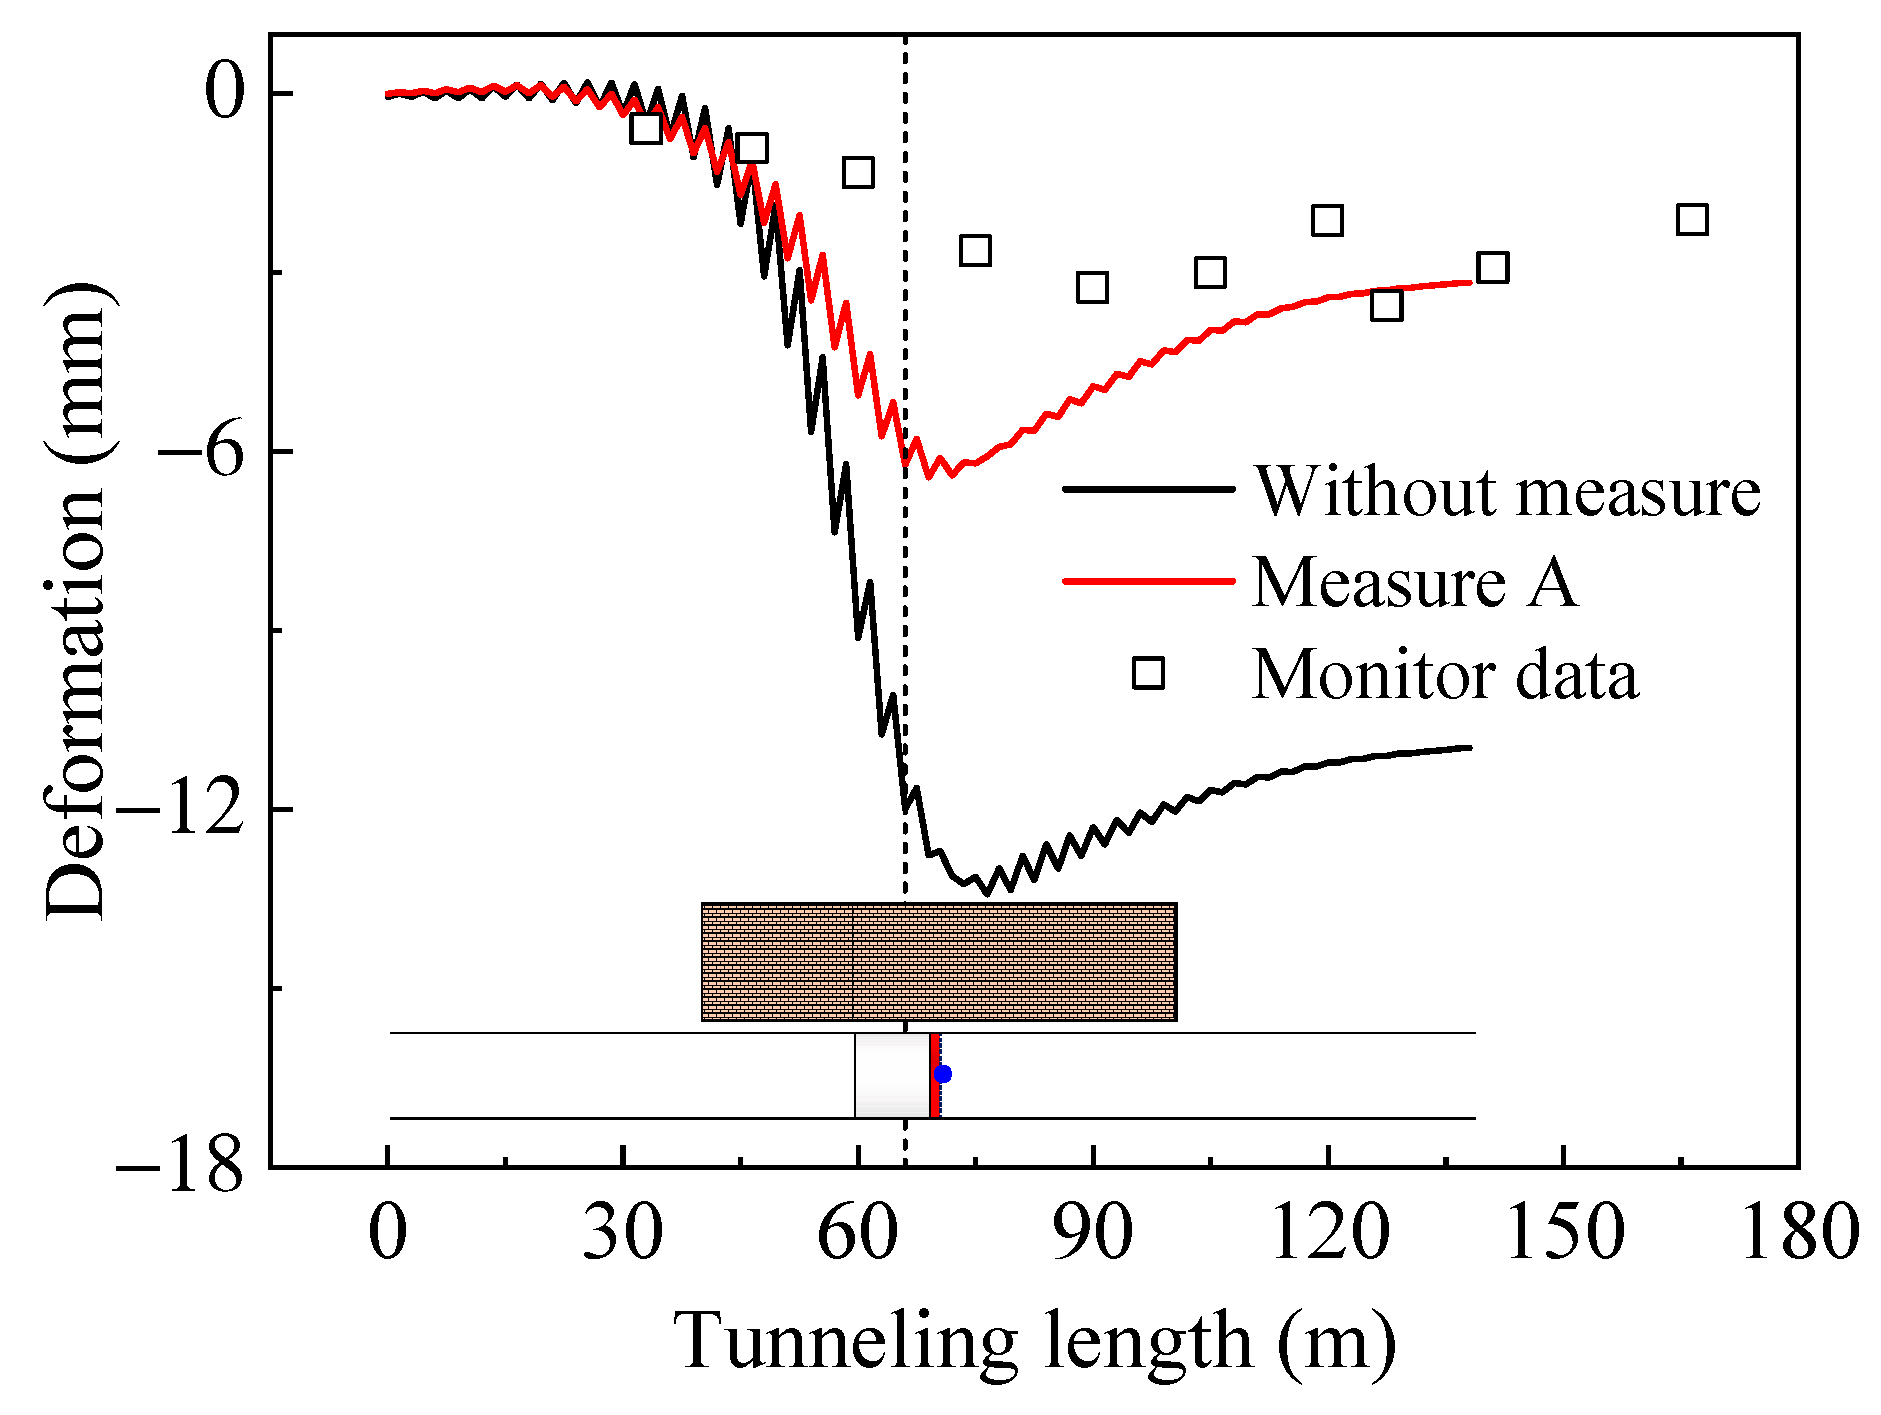
The presence of adjacent buildings at the shield construction site increases the deformation of the strata directly beneath the buildings while having little impact on the surface settlement above the tunnel. The stratum deformation curve fluctuates due to the accumulation and dissipation of pore pressure.
(2)
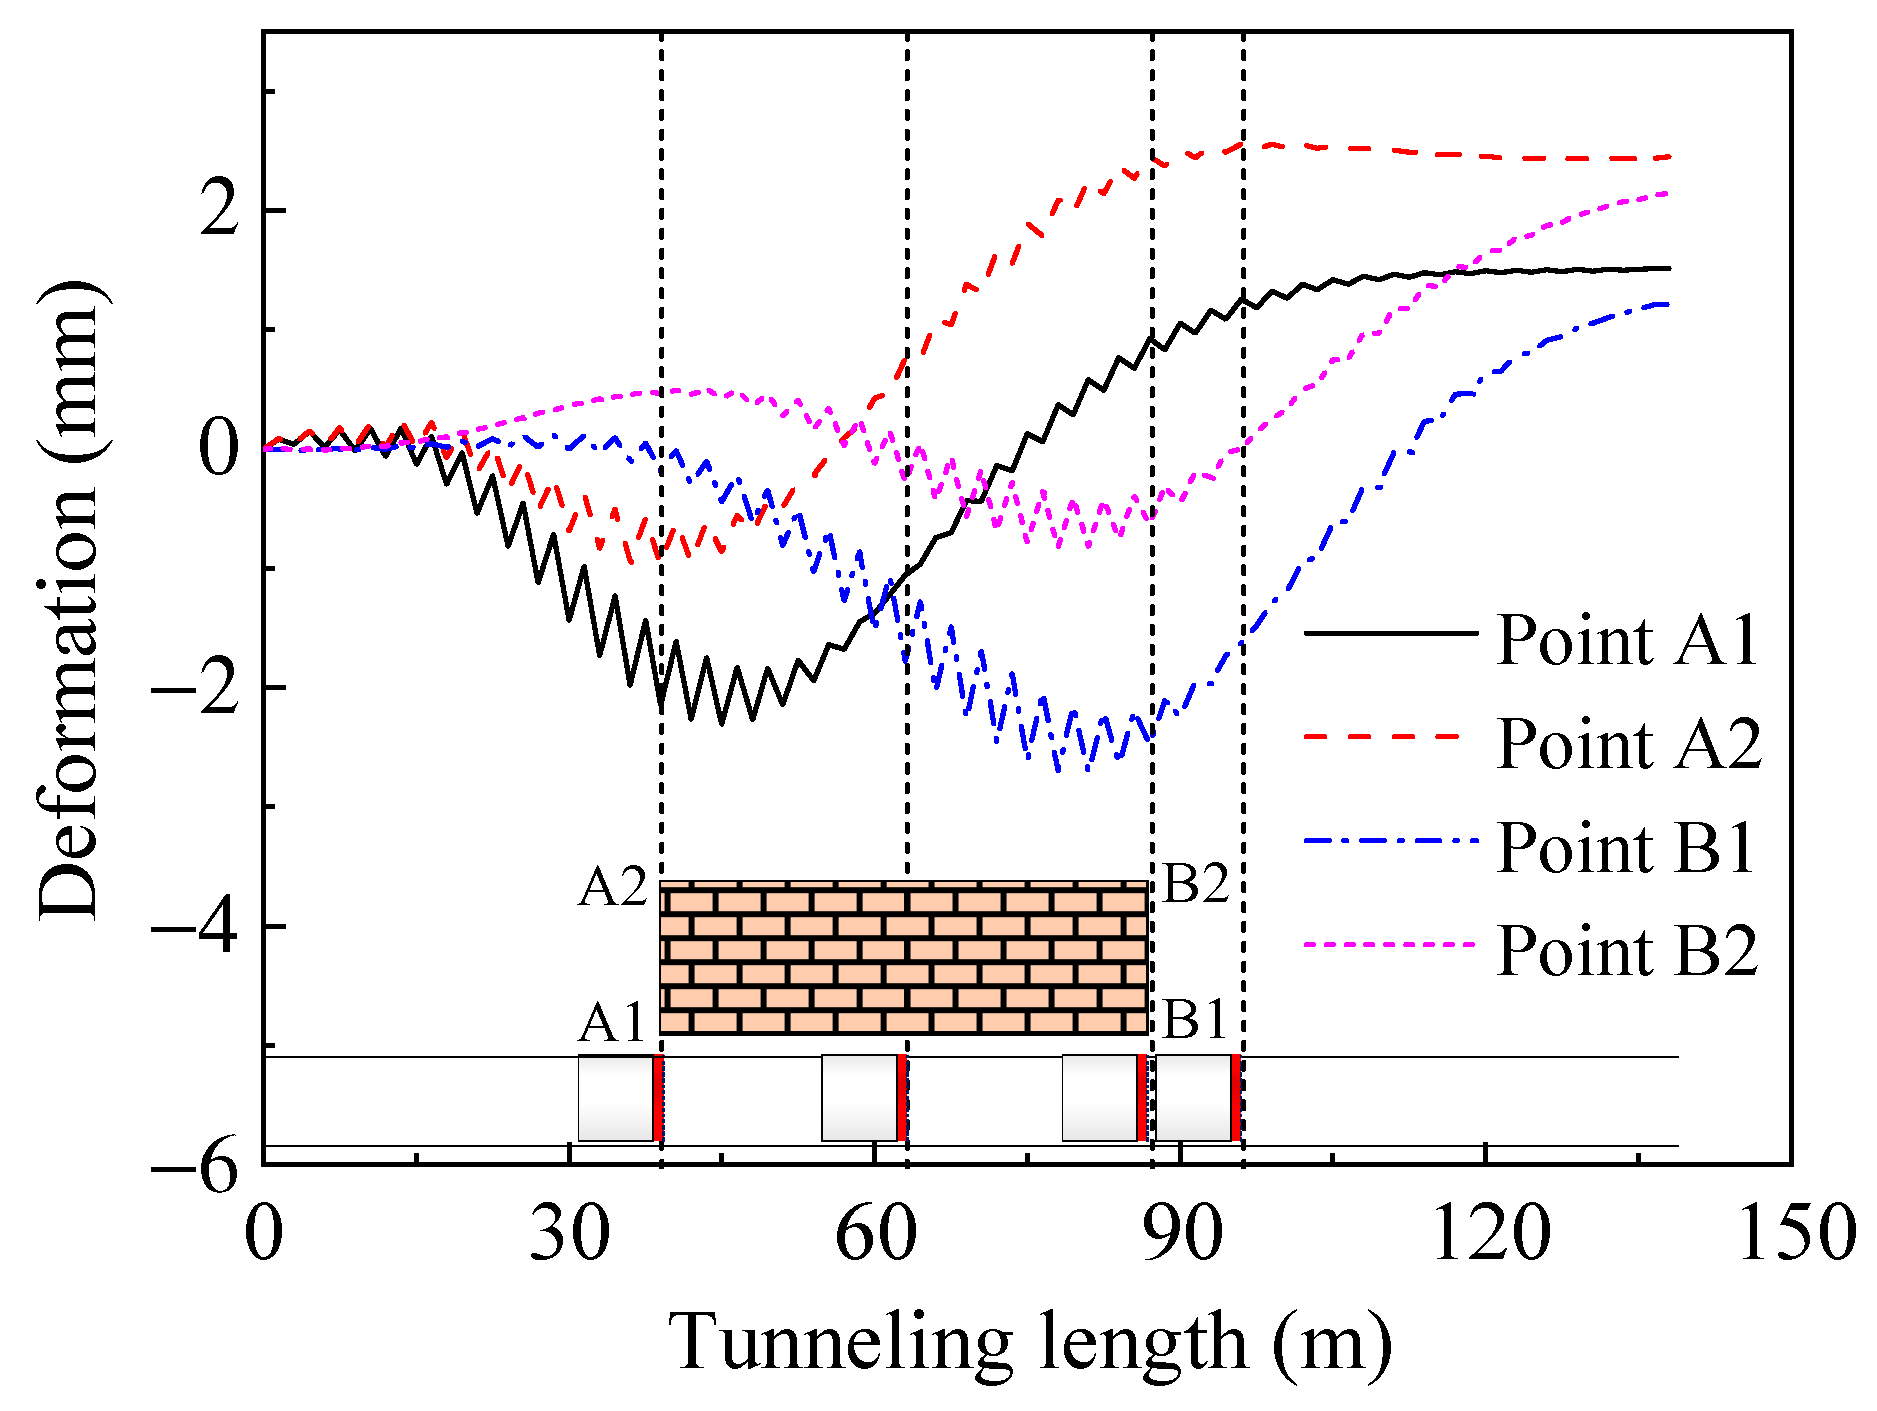
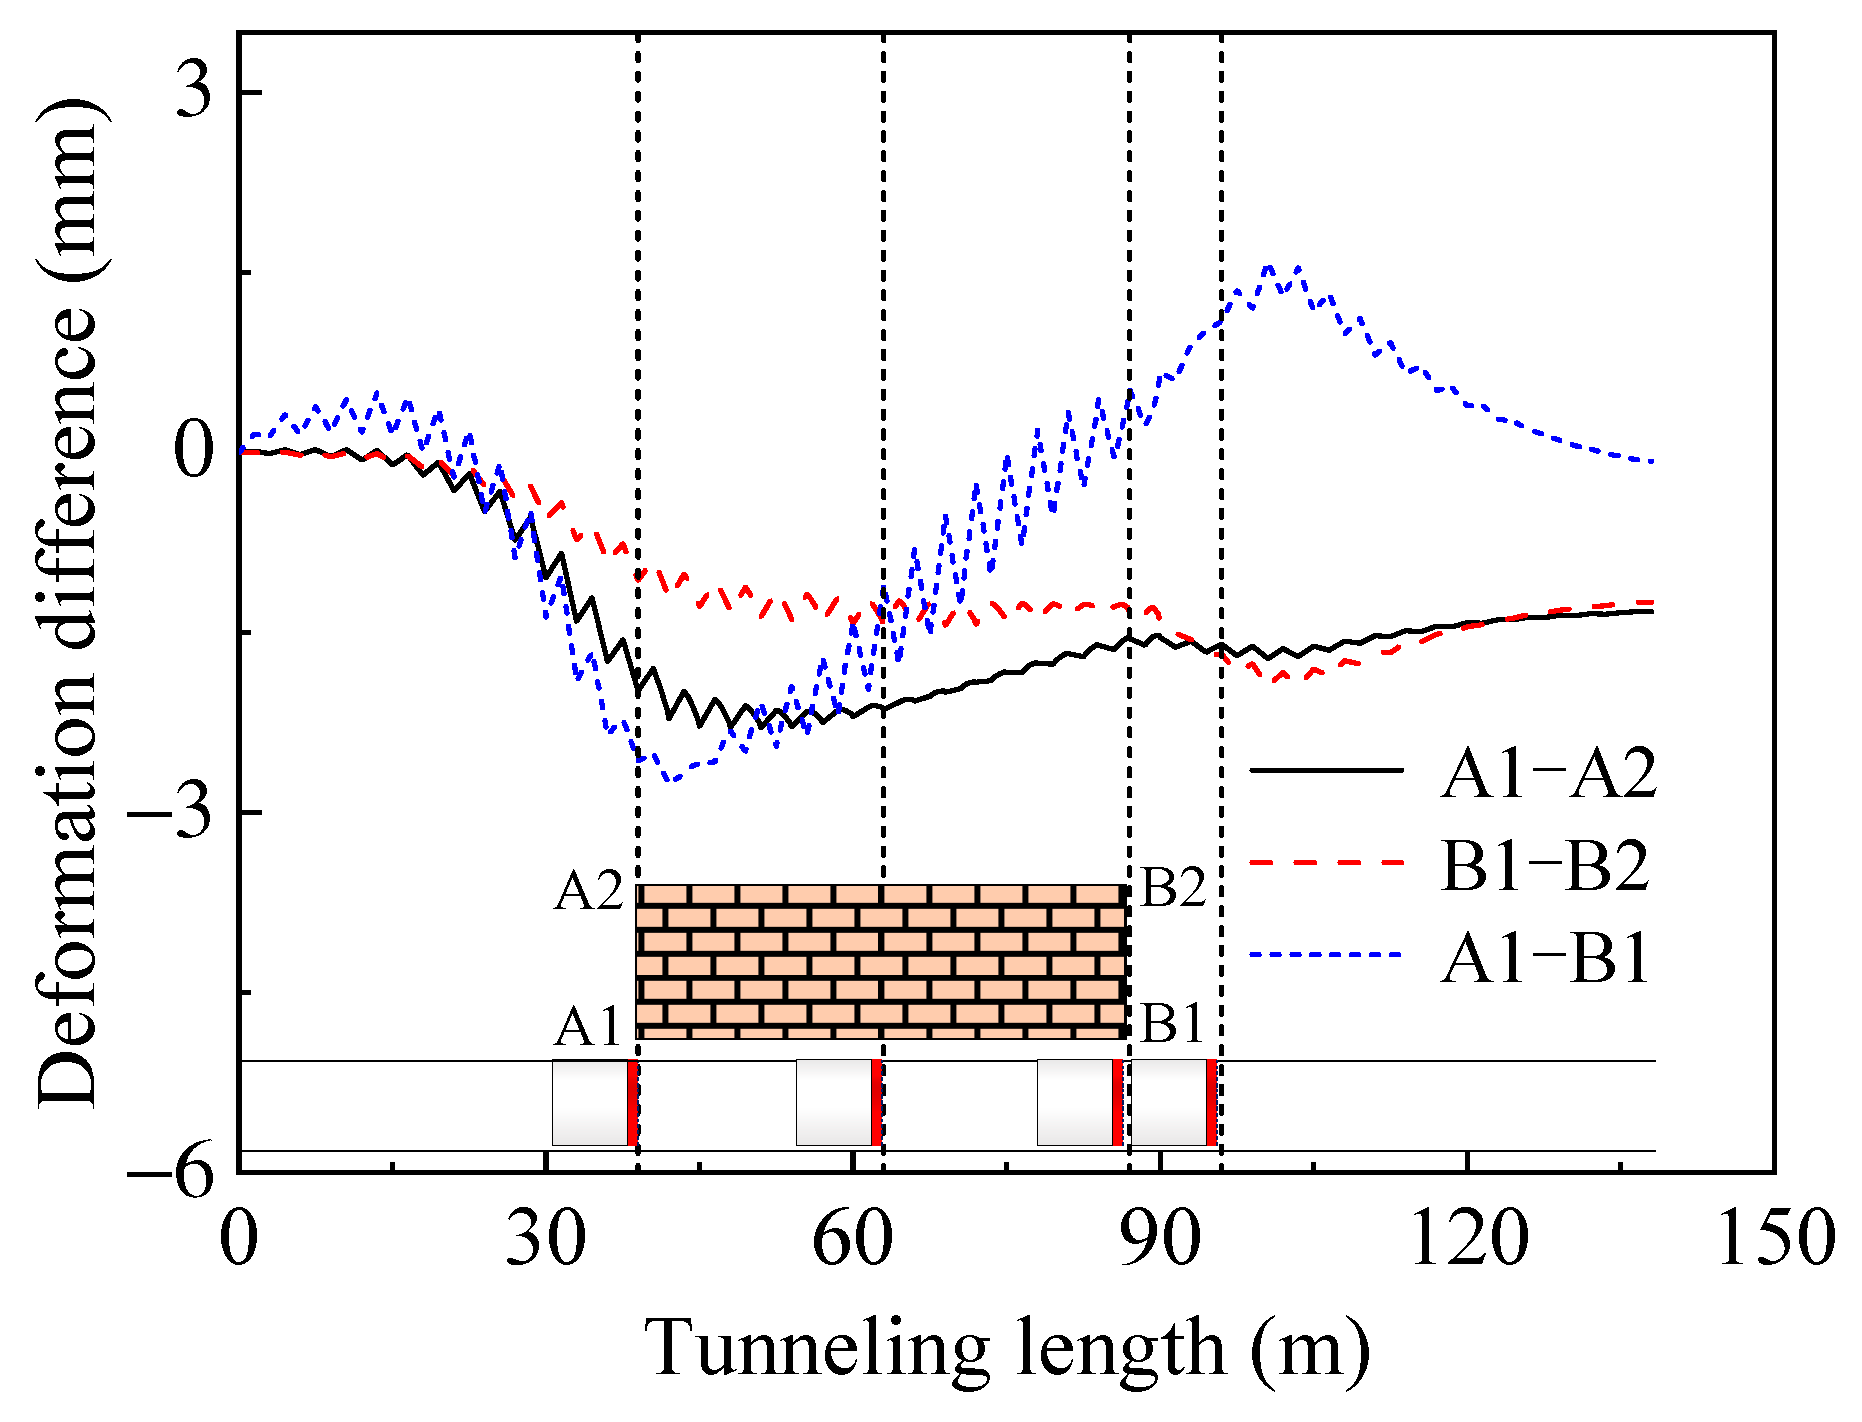
The difference in transverse settlement for the building continues to increase with the advancement of the shield. The difference in longitudinal settlement shows a trend of initial settlement followed by an uplift, which eventually becomes more uniform.
(3)
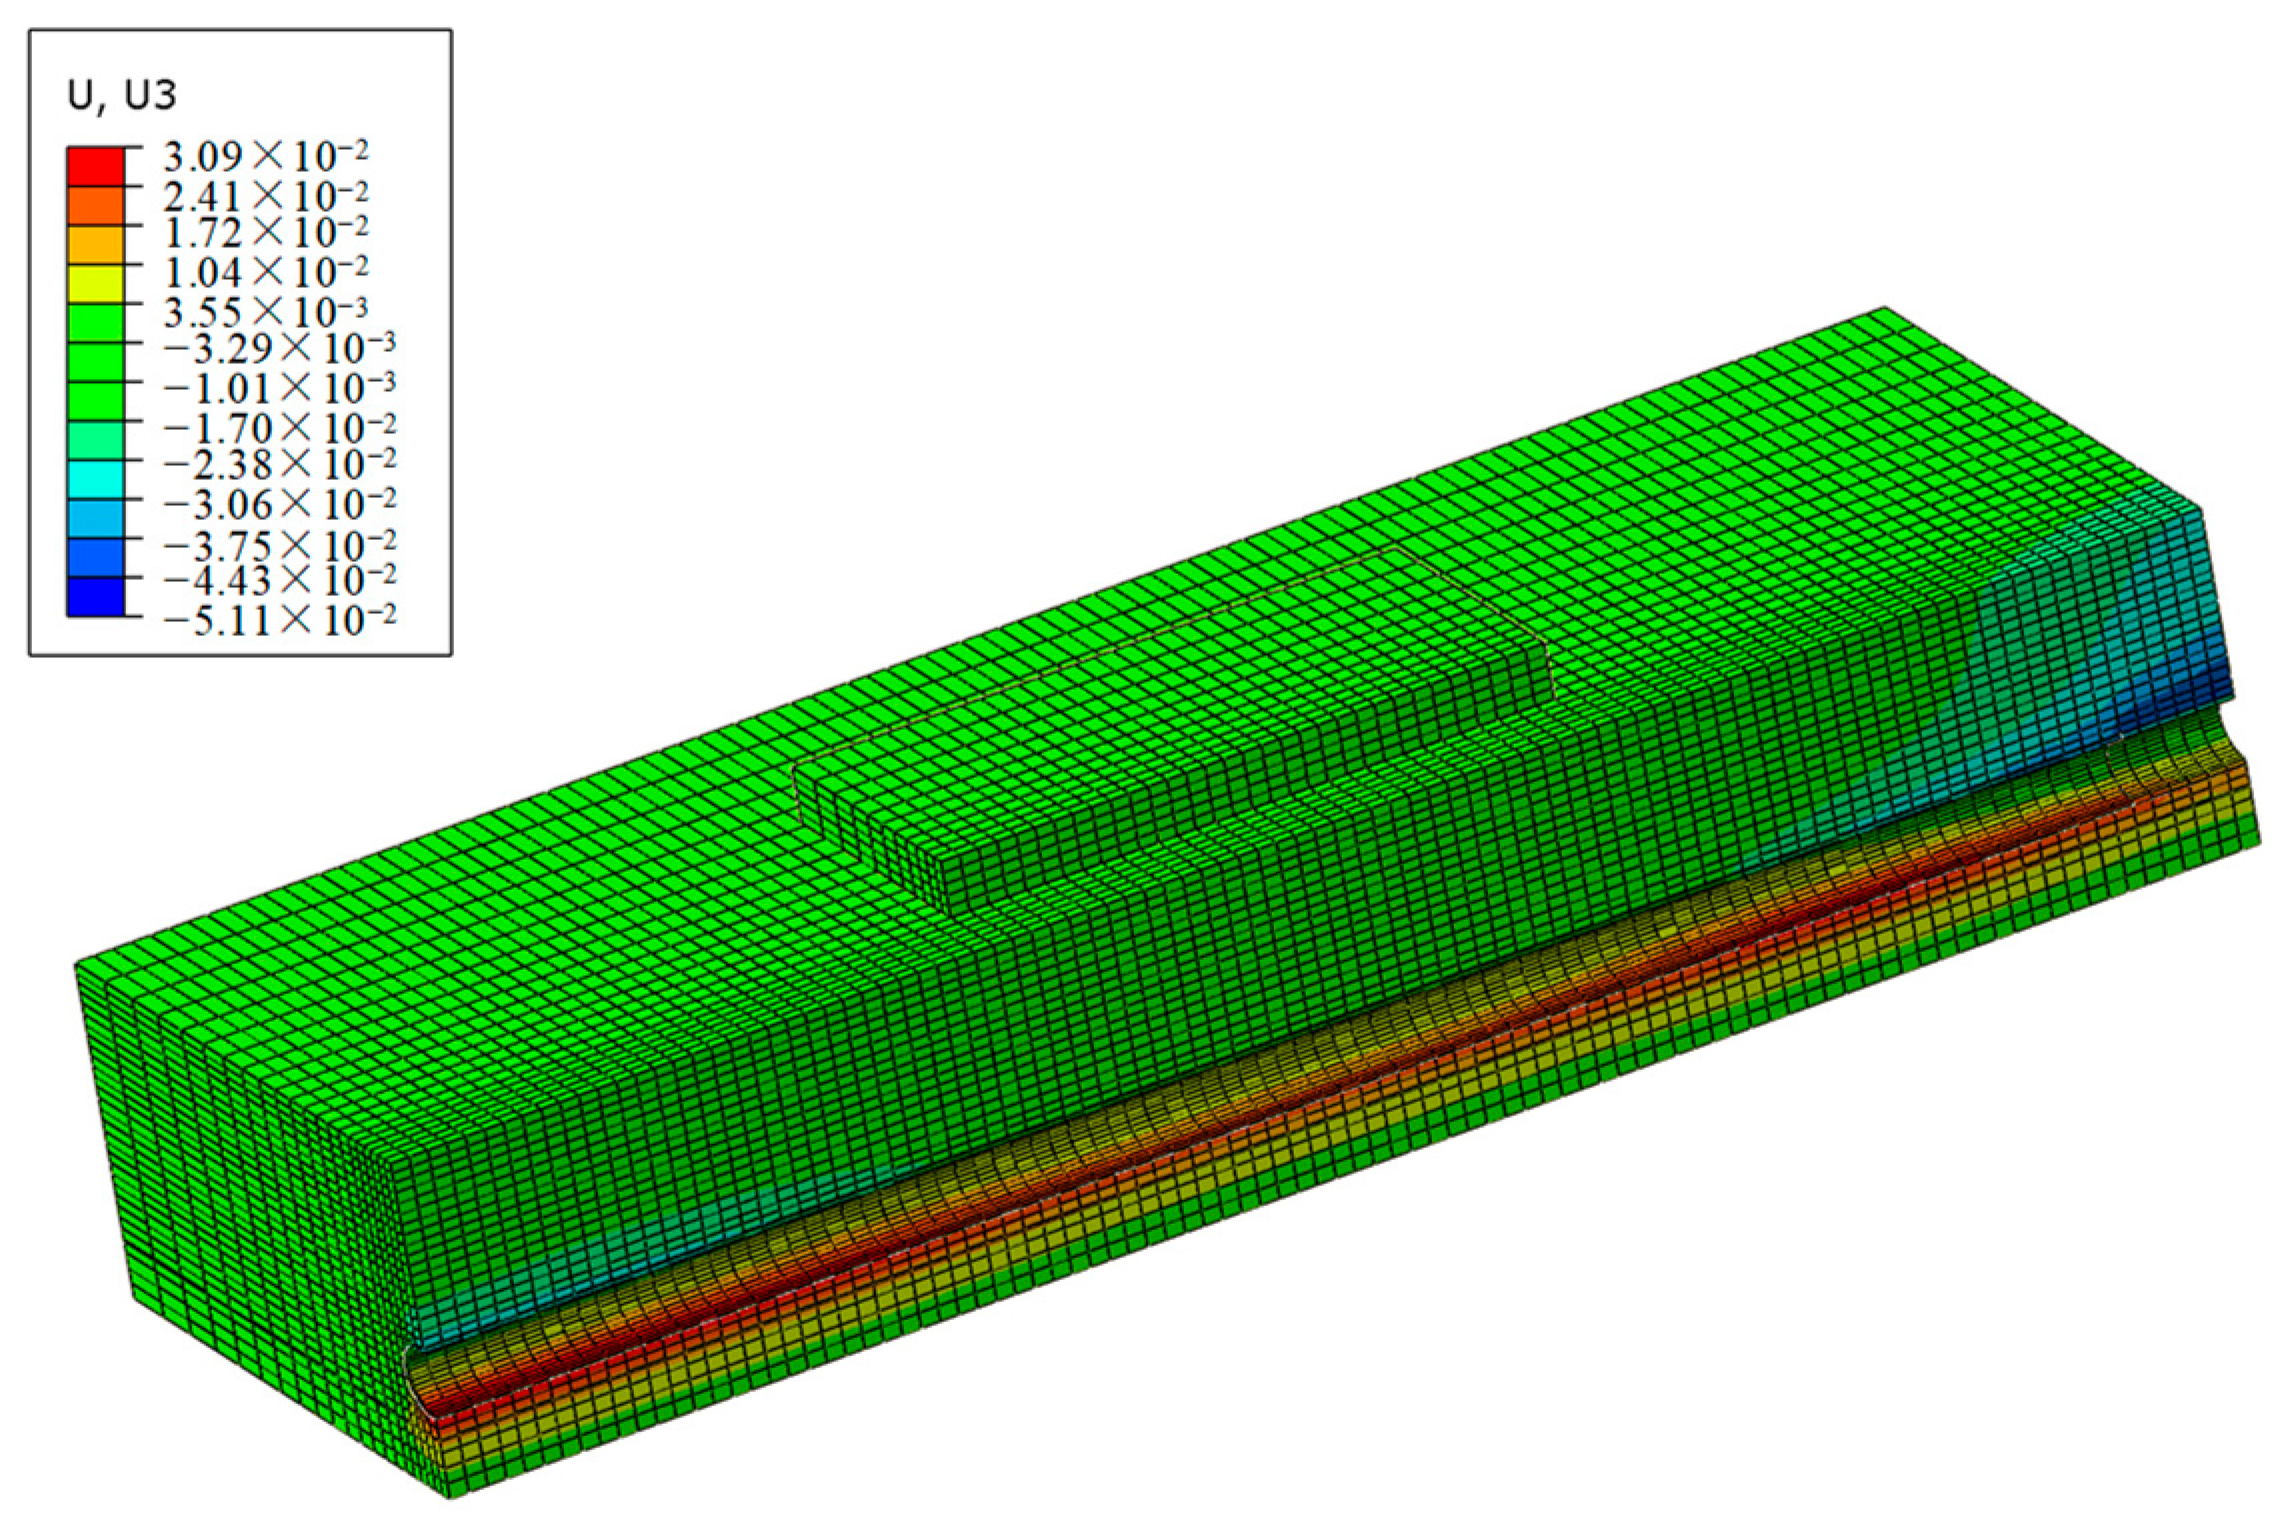
The vertical partition method can reduce the surface settlement above the tunnel by about 70%, significantly reducing the settlement and the difference in settlement in the building. The portal partition method can further reduce the building deformation by increasing the length and thickness of the reinforcement zone. Excessive reinforcement should be avoided to prevent adverse effects such as uplift.
(4)
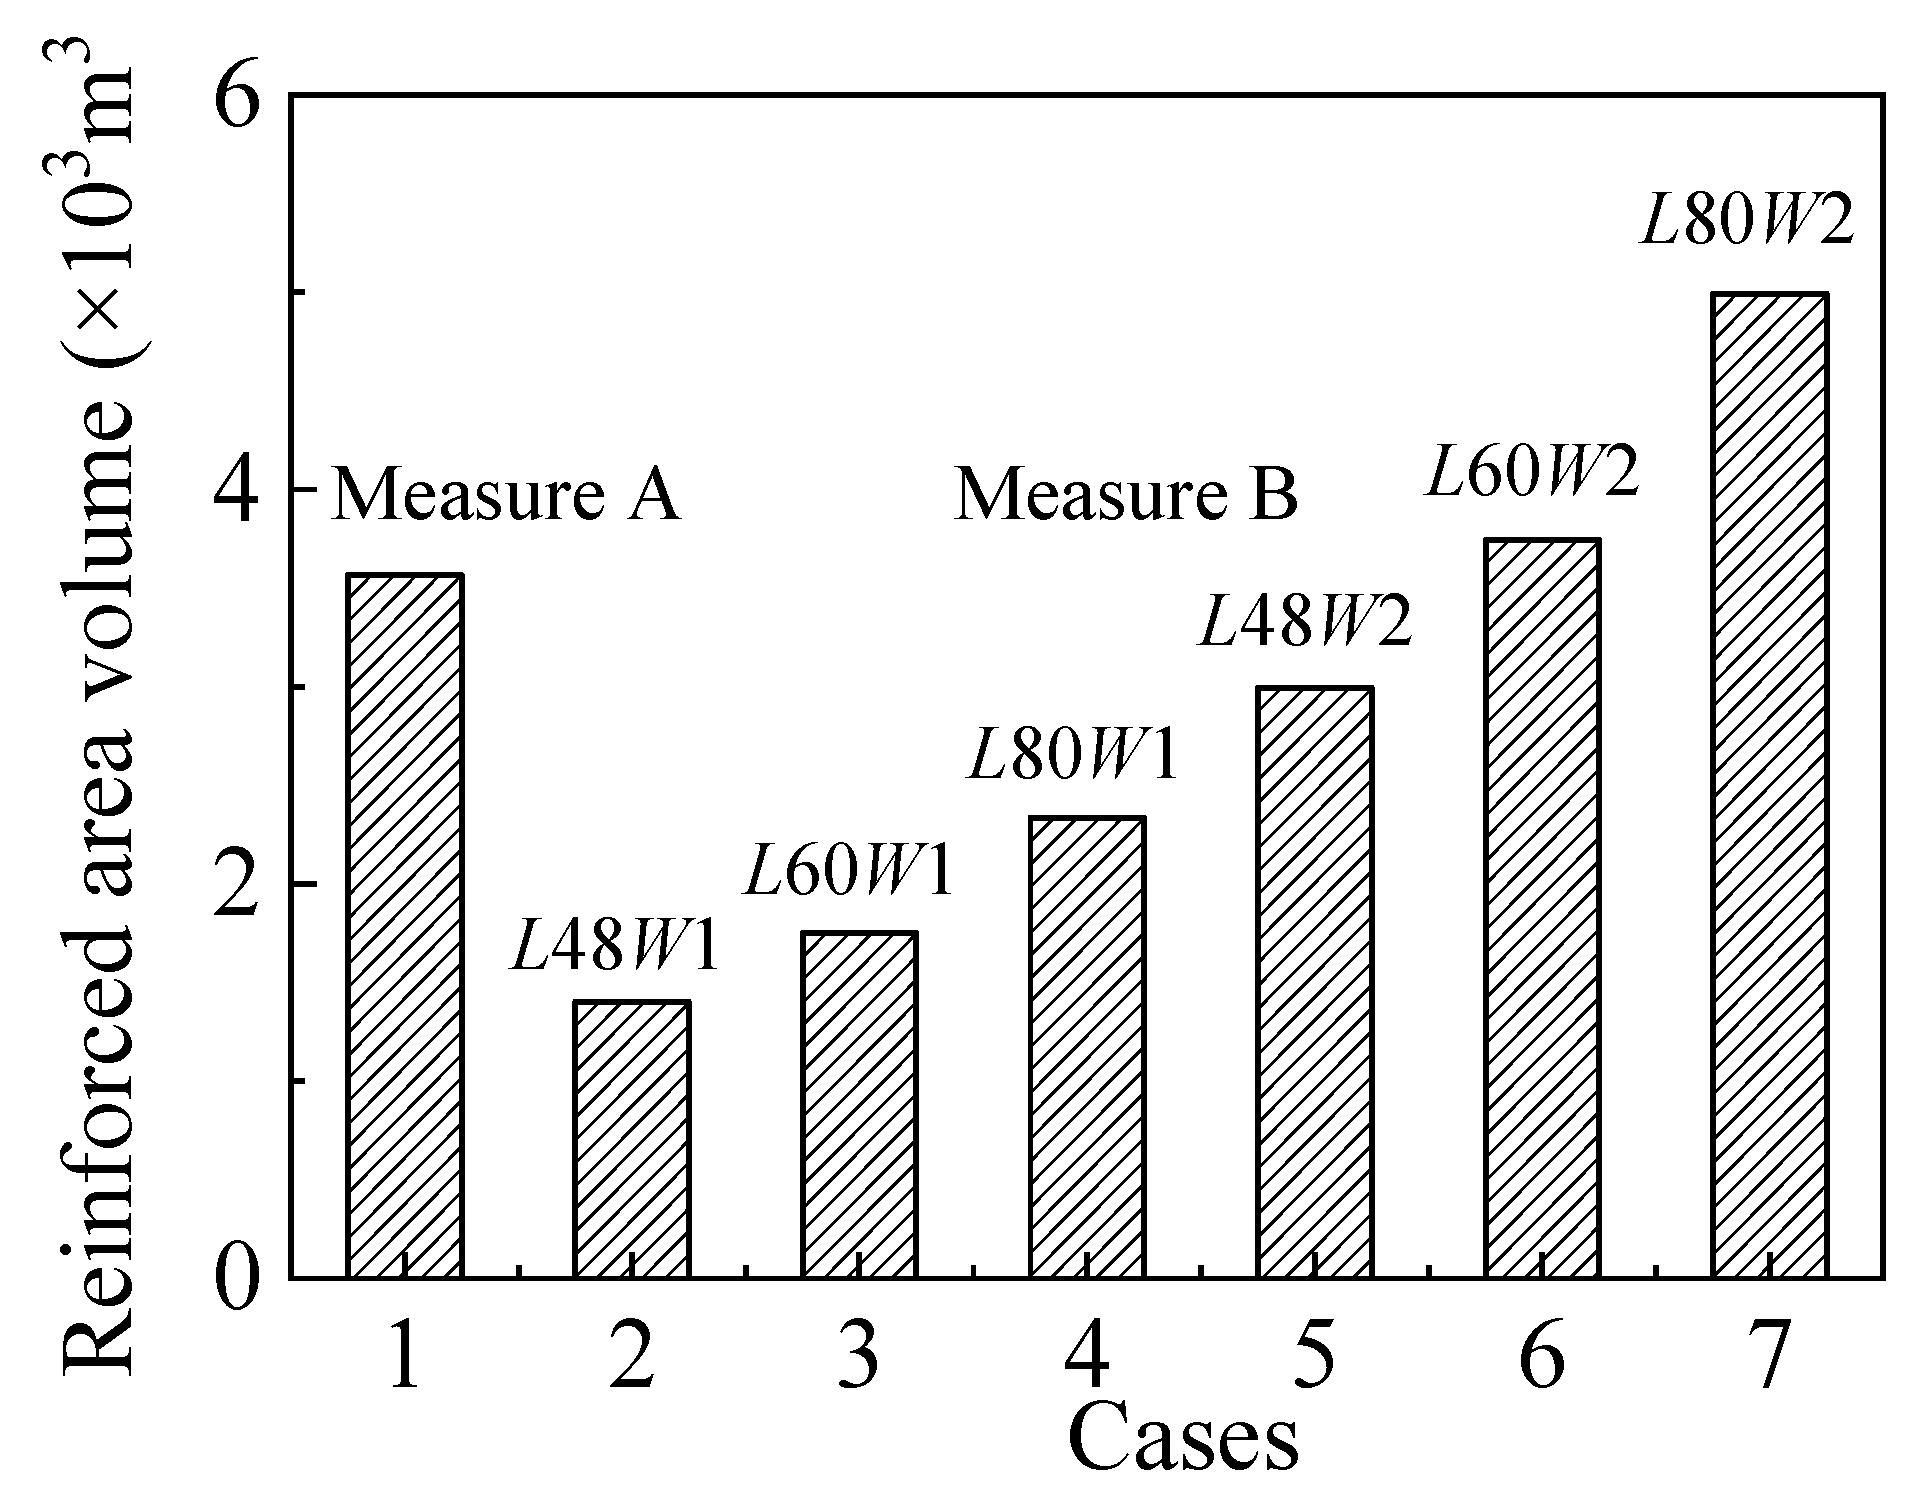
Both the vertical partition method and the portal partition method effectively reduced the impact of tunnel construction on the ground and buildings, with the portal partition method showing a better performance in terms of material usage and cost reduction.

Author Contributions

Methodology, W.H. (Wei He) and W.C.; Software, X.K.; Validation, X.K.; Formal analysis, W.H. (Wei Hu); Investigation, L.T. and G.C.; Resources, W.C. and G.C.; Data curation, W.H. (Wei He) and X.K.; Writing—original draft, W.H. (Wei He) and X.K.; Writing—review & editing, L.T., W.C. and W.H. (Wei Hu); Funding acquisition, W.H. (Wei He) and W.H. (Wei Hu). All authors have read and agreed to the published version of the manuscript.

Funding

This research was supported by the China Postdoctoral Science Foundation Project (Grant No. 2024M754193); the “Longjiang Outstanding Master’s and Doctoral Dissertation in the New Era” project (Grant No. LJYXL2023-022); the Open Research Fund Program of Hunan Provincial Key Laboratory of Geotechnical Engineering for Stability Control and Health Monitoring (Grant No. E22420); the Fundamental Research Funds for the Central Universities (Grant No. LH2022D016); the Chongqing Construction Science and Technology Project (Grant No. 2023-5-6); and the Research and Development Project of the Ministry of Housing and Urban-Rural Development (Grant No. 2022-K-040).

Data Availability Statement

Data is contained within the article.

Conflicts of Interest

Author Wei He was employed by the company China Construction Eighth Engineering Division Rail Transit Construction Co., Ltd. The remaining authors declare that the research was conducted in the absence of any commercial or financial relationships that could be construed as a potential conflict of interest.

References

  1. Yan, T.; Shen, S.; Zhou, A.; Lyu, H. Construction efficiency of shield tunnelling through soft deposit in Tianjin, China. Tunn. Undergr. Space Technol. 2021, 112, 103917. [Google Scholar] [CrossRef]
  2. Tang, S.; Zhang, X.; Liu, Q.; Xie, W.; Wu, X.; Chen, P.; Qian, Y. Control and prevention of gas explosion in soft ground tunneling using slurry shield TBM. Tunn. Undergr. Space Technol. 2021, 113, 103963. [Google Scholar] [CrossRef]
  3. Li, L.; Sun, S.; Wang, J.; Song, S.; Fang, Z.; Zhang, M. Development of compound EPB shield model test system for studying the water inrushes in karst regions. Tunn. Undergr. Space Technol. 2020, 101, 103404. [Google Scholar] [CrossRef]
  4. Liu, Z.; Xue, J.; Ye, J.; Qian, J. A simplified two-stage method to estimate the settlement and bending moment of upper tunnel considering the interaction of undercrossing twin tunnels. Transp. Geotech. 2021, 29, 100558. [Google Scholar] [CrossRef]
  5. Cao, L.; Zhang, D.; Fang, Q.; Yu, L. Movements of ground and existing structures induced by slurry pressure-balance tunnel boring machine (SPB TBM) tunnelling in clay. Tunn. Undergr. Space Technol. 2020, 97, 103278. [Google Scholar] [CrossRef]
  6. Franza, A.; Ritter, S.; Dejong, M.J. Continuum solutions for tunnel–building interaction and a modified framework for deformation prediction. Géotechnique 2020, 70, 108–122. [Google Scholar] [CrossRef]
  7. Cao, B.T.; Obel, M.; Freitag, S.; Mark, P.; Meschke, G. Artificial neural network surrogate modelling for real-time predictions and control of building damage during mechanised tunnelling. Adv. Eng. Softw. 2020, 149, 102869. [Google Scholar] [CrossRef]
  8. Amorosi, A.; Sangirardi, M. Coupled three-dimensional analysis of the progressive tunnelling-induced damage to masonry buildings: Is it always worth it? Tunn. Undergr. Space Technol. 2021, 118, 104173. [Google Scholar] [CrossRef]
  9. Soomro, M.A. 3D finite element analysis of effects of twin stacked tunnels at different depths and with different construction sequence on a piled raft. Tunn. Undergr. Space Technol. 2021, 109, 103759. [Google Scholar] [CrossRef]
  10. Zhong, Z.; Li, C.; Liu, X.; Fan, Y.; Liang, N. Analysis of ground surface settlement induced by the construction of mechanized twin tunnels in soil-rock mass mixed ground. Tunn. Undergr. Space Technol. 2021, 110, 103746. [Google Scholar] [CrossRef]
  11. Yang, W.; Zheng, J.; Zhang, R.; Liu, H. An empirical model for characterizing 3D deformation at the face of shield tunnel in soft clay. Tunn. Undergr. Space Technol. 2021, 112, 103862. [Google Scholar] [CrossRef]
  12. Dai, X.; Cai, J.; Diao, Y.; Huo, H.; Xu, G. Influence of tunnelling on the deformation of the overlying excavation bracing system and analysis of countermeasures. Comput. Geotech. 2021, 134, 104089. [Google Scholar] [CrossRef]
  13. Macchiarulo, V.; Milillo, P.; DeJong, M.J.; González Martí, J.; Sánchez, J.; Giardina, G. Integrated InSAR monitoring and structural assessment of tunnelling-induced building deformations. Struct. Control. Health Monit. 2021, 28, e2781. [Google Scholar] [CrossRef]
  14. Liu, W.; Liang, J.; Xu, T. Tunnelling-induced ground deformation subjected to the behavior of tail grouting materials. Tunn. Undergr. Space Technol. 2023, 140, 105253. [Google Scholar] [CrossRef]
  15. Liang, R.; Zhang, Z.; Wu, J.; Li, Z.; Cao, S.; Wu, W. Probabilistic assessment of existing shield tunnel longitudinal responses to tunnelling. Int. J. Numer. Anal. Methods Geomech. 2024, 48, 2493–2520. [Google Scholar] [CrossRef]
  16. Bayen, A.; Samanta, M. Assessment of Building Response Supported on Shallow Foundation Due to Tunnelling in Cohesionless Soil. IOP Conf. Ser. Earth Environ. Sci. 2024, 1333, 012044. [Google Scholar] [CrossRef]
  17. Masini, L.; Rampello, S.; Soga, K. An Approach to Evaluate the Efficiency of Compensation Grouting. J. Geotech. Geoenviron. Eng. 2014, 140, 04014073. [Google Scholar] [CrossRef]
  18. Bilotta, E. Use of diaphragm walls to mitigate ground movements induced by tunnelling. Géotechnique 2008, 58, 143–155. [Google Scholar] [CrossRef]
  19. Bilotta, E.; Stallebrass, S.E. Prediction of stresses and strains around model tunnels with adjacent embedded walls in overconsolidated clay. Comput. Geotech. 2009, 36, 1049–1057. [Google Scholar] [CrossRef]
  20. Bilotta, E.; Russo, G. Use of a Line of Piles to Prevent Damages Induced by Tunnel Excavation. J. Geotech. Geoenviron. Eng. 2011, 137, 254–262. [Google Scholar] [CrossRef]
  21. Bai, Y.; Yang, Z.; Jiang, Z. Key protection techniques adopted and analysis of influence on adjacent buildings due to the Bund Tunnel construction. Tunn. Undergr. Space Technol. 2014, 41, 24–34. [Google Scholar] [CrossRef]
  22. Fantera, L.; Rampello, S.; Masini, L. A Mitigation Technique to Reduce Ground Settlements Induced by Tunnelling Using Diaphragm Walls. Procedia Eng. 2016, 158, 254–259. [Google Scholar] [CrossRef]
  23. Li, Y.; Zhang, W. Investigation on passive pile responses subject to adjacent tunnelling in anisotropic clay. Comput. Geotech. 2020, 127, 103782. [Google Scholar] [CrossRef]
  24. Masini, L.; Rampello, S. Predicted and observed behaviour of pre-installed barriers for the mitigation of tunnelling effects. Tunn. Undergr. Space Technol. 2021, 118, 104200. [Google Scholar] [CrossRef]
  25. Li, X.; Geng, A. Investigation and measurement of old building response to the overlapped shield tunnel of multiple schemes in the sandy cobble stratum. Undergr. Space 2024, 15, 260–274. [Google Scholar] [CrossRef]
  26. Asemi, K.; Ashrafi, H.; Salehi, M.; Shariyat, M. Three-dimensional static and dynamic analysis of functionally graded elliptical plates, employing graded finite elements. Acta Mech. 2013, 224, 1849–1864. [Google Scholar] [CrossRef]
  27. Shariyat, M.; Asemi, K. 3D B-spline finite element nonlinear elasticity buckling analysis of rectangular FGM plates under non-uniform edge loads, using a micromechanical model. Compos. Struct. 2014, 112, 397–408. [Google Scholar] [CrossRef]
  28. Chen, L.L.; Wang, Z.F.; Wang, Y.Q. Failure Analysis and Treatments of Tunnel Entrance Collapse Due to Sustained Rainfall: A Case Study. Water 2022, 14, 2486. [Google Scholar] [CrossRef]
  29. Deng, Q.; Zhang, J.; Lu, F.; Fan, Z.; Wang, Y.; Lin, Z. Stability Assessment of Tunnels Excavated in Loess with the Presence of Groundwater—A Case Study. Water 2024, 16, 581. [Google Scholar] [CrossRef]
  30. Zheng, F.; Li, W.; Song, Z.; Wang, J.; Zhang, Y.; Liu, N.; Xiao, K.; Wang, Y. Construction Stability Analysis and Field Monitoring of Shallowly Buried Large-Section Tunnels in Loess Strata. Water 2024, 16, 2192. [Google Scholar] [CrossRef]
  31. Hejazi, Y.; Dias, D.; Kastner, R. Impact of constitutive models on the numerical analysis of underground constructions. Acta Geotech. 2008, 3, 251–258. [Google Scholar] [CrossRef]
  32. Ercelebi, S.G.; Copur, H.; Ocak, I. Surface settlement predictions for Istanbul Metro tunnels excavated by EPB-TBM. Environ. Earth Sci. 2011, 62, 357–365. [Google Scholar] [CrossRef]
  33. Xie, X.; Yang, Y.; Ji, M. Analysis of ground surface settlement induced by the construction of a large-diameter shield-driven tunnel in Shanghai, China. Tunn. Undergr. Space Technol. 2016, 51, 120–132. [Google Scholar] [CrossRef]
  34. Chavda, J.T.; Dodagoudar, G.R. Finite element evaluation of ultimate capacity of strip footing: Assessment using various constitutive models and sensitivity analysis. Innov. Infrastruct. Solut. 2018, 3, 15. [Google Scholar] [CrossRef]
  35. Cheng, H.; Chen, J.; Chen, G. Analysis of ground surface settlement induced by a large EPB shield tunnelling: A case study in Beijing, China. Environ. Earth Sci. 2019, 78, 605. [Google Scholar] [CrossRef]
  36. Kavvadas, M.; Litsas, D.; Vazaios, I.; Fortsakis, P. Development of a 3D finite element model for shield EPB tunnelling. Tunn. Undergr. Space Technol. 2017, 65, 22–34. [Google Scholar] [CrossRef]
  37. Zhang, Z.X.; Liu, C.; Huang, X. Numerical analysis of volume loss caused by tunnel face instability in soft soils. Environ. Earth Sci. 2017, 76, 563. [Google Scholar] [CrossRef]
  38. Alagha, A.S.N.; Chapman, D.N. Numerical modelling of tunnel face stability in homogeneous and layered soft ground. Tunn. Undergr. Space Technol. 2019, 94, 103096. [Google Scholar] [CrossRef]
  39. Ling, X.; Kong, X.; Tang, L.; Tang, W.; Cong, S.; Zhang, J.; Zhao, X. Face stability of the slurry shield–driven tunnel with an impermeable filter cake in saturated medium sand. Arab. J. Geosci. 2021, 14, 1490. [Google Scholar] [CrossRef]
  40. Peck, R.B. Deep excavations and tunneling in soft ground. In Proceedings of the 7th International Conference on Soil Mechanics and Foundation Engineering, Mexico City, Mexico, 25–29 August 1969. [Google Scholar]
Figure 1. Sketch of the existing building and tunnel, together with the soil profile.
Symmetry 16 01339 g001
Figure 2. The tunnelling progress curve for the tunnel.
Symmetry 16 01339 g002
Figure 3. Geometry and mesh discretization of the three-dimensional finite element model.
Symmetry 16 01339 g003
Figure 4. The deformation contour after the tunnel excavation.
Symmetry 16 01339 g004
Figure 5. Comparison of surface settlement development at point O above the tunnel axis with and without adjacent buildings.
Symmetry 16 01339 g005
Figure 6. Comparison of surface settlement trough with and without adjacent building.
Symmetry 16 01339 g006
Figure 7. Settlement development at corners of the adjacent building.
Symmetry 16 01339 g007
Figure 8. Differences in the development of settlement for the adjacent building in different directions.
Symmetry 16 01339 g008
Figure 9. Cross-sectional sketch of deformation control measures by grouting reinforcement. (a) Measure A: Vertical partition method. (b) Measure B: Portal partition method.
Symmetry 16 01339 g009
Figure 10. The deformation contour after the tunnel excavation with the vertical partition method.
Symmetry 16 01339 g010
Figure 11. Settlement development at point O above the tunnel axis with the vertical partition method.
Symmetry 16 01339 g011
Figure 12. Surface settlement trough with the vertical partition method.
Symmetry 16 01339 g012
Figure 13. Development of settlement at corners of the adjacent building with the vertical partition method.
Symmetry 16 01339 g013
Figure 14. Differences in the development of settlement for the adjacent building in different directions with the vertical partition method.
Symmetry 16 01339 g014
Figure 15. The deformation contour after the tunnel excavation with the portal partition method.
Symmetry 16 01339 g015
Figure 16. Settlement development at point O above the tunnel axis with the portal partition method.
Symmetry 16 01339 g016
Figure 17. Surface settlement trough with the portal partition method.
Symmetry 16 01339 g017
Figure 18. Development of settlement at the corners of the adjacent building with the portal partition method (L48W1).
Symmetry 16 01339 g018
Figure 19. Differences in the development of settlement for the adjacent building in different directions with the portal partition method (L48W1).
Symmetry 16 01339 g019
Figure 20. Comparison of settlement at point O above the tunnel axis with different measures.
Symmetry 16 01339 g020
Figure 21. Comparison of settlement of the adjacent building with different measures.
Symmetry 16 01339 g021
Figure 22. Comparison of the difference in settlement for the adjacent building with different measures.
Symmetry 16 01339 g022
Figure 23. Comparison of the reinforced area volume with different measures.
Symmetry 16 01339 g023
Table 1. Physical and mechanical parameters of soils.
LayerDry Density,
ρd (kg/m3)
Void Ratio,
e
Poisson’s Ratio,
v
Cohesion,
c (kPa)
Friction Angel,
φ (°)
Young’s Modulus,
E (MPa)
Permeability Coefficient,
λ (m/h)
① Fill15600.80.327146.30.042
② Silty clay15900.70.2927146.80.021
③ Clay16500.60.26311411.70.017
④ Fully weathered sandstone16600.50.252515100.208
⑤ Intensely weathered mudstone18600.40.246025300.013
Table 2. Elastic parameter of EPB shield and tunnel structure.
ParamEPB ShieldSegmental LiningGrout
Density, ρ (kg/m3)780025002100
Elastic modulus, E (GPa)21034.50.01
Poisson’s ratio, v0.30.30.4
Disclaimer/Publisher’s Note: The statements, opinions and data contained in all publications are solely those of the individual author(s) and contributor(s) and not of MDPI and/or the editor(s). MDPI and/or the editor(s) disclaim responsibility for any injury to people or property resulting from any ideas, methods, instructions or products referred to in the content.

